
ABSTRACT
Antioxidant activity and physicochemical properties of Melastoma malabathricum (L.) and Syzygium caryophyllatum (L.) fruit were determined in line with the progressive color development in three maturity stages (MS) such as unripe (MS1-green), intermediate (MS2-light purple) and ripe (MS3-blackish-purple). Antioxidant values in terms of total phenol content, ferric reducing antioxidant power, 2,2-diphenyl-1-picrylhydrazyl radical scavenging activity, and oxygen radical absorbance capacity, as well as physicochemical properties, were increased significantly (P <0.05) with the ripening while decreasing titratable acidity and firmness of both fruits significantly (P <0.05). Color measurements pertaining to lightness (L*) and yellowness (b*) of both fruits were decreased while increasing the redness (a*) significantly (P <0.05).
Introduction
Melastoma malabathricum (L), is a flowering shrub that belongs to the family of Melastomataceae, can be found in South and Southeast Asia (Vankar et al., Citation2009). The fruit is berry-like capsules converted to dark purple color when ripe and is a rich source of anthocyanins and tannins (Aziz et al., Citation2012; Malek et al., Citation2003). Syzygium caryophyllatum belongs to the Myrtaceae family. It is a large, evergreen tree and grows up to 15 m tall in high elevation and spread across tropical Africa, subtropical and tropical Asia (Subramanian et al., Citation2012). Both Melastoma malabathricum and Syzygium caryophyllatum fruits are underutilized in Sri Lanka and properties of these fruits are less known.
Naturally, fruits are considered as a major source of antioxidants which include a larger amount of vitamins, anthocyanins, and polyphenols (Kaur and Kapoor, Citation2001; Robards et al., Citation1999) which have a major influence on sensory quality of the fruits, such as color, flavor, taste, etc. and health benefit properties such as anticarcinogenic, antimicrobial, antiallergic, antimutagenic and anti-inflammatory (Joshipura et al., Citation2001). Besides, tropical climate conditions lead to the extreme stressful environmental changes such as extreme temperatures, drought, heavy rainfalls, and high irradiation levels that may enhance the production of antioxidants as self-defensive compounds in plants (Atkinson et al., Citation2005).
Most of the phytochemical and antioxidant properties of the fruits are directly influenced by climatic conditions, soils type, fruiting season, elevation, variety, and stages of maturity, etc. During maturation, several biochemical, physiological, and structural changes take place (Ali et al., Citation2004; Siddiqui et al., Citation2013) which determine the quality of fruit (optimum harvesting maturity) and enables to deliver the best nutritional, sensory and functional properties to consumers.
Characterizing the physicochemical properties of berries and their antioxidant capacity variation could provide useful information to optimize the maturity stage for harvesting and better utilization of these healthy underutilized berries as fruit or converted into commercial products (Yarılgaç et al., Citation2019). Most of the current literature is focused on the physicochemical and antioxidant properties of mature fruits and also inhabitants prefer to eat purple color matured fruit. There is no comprehensive data reported on the variation of antioxidants throughout the different maturity stages of both Melastoma malabathricum and Syzygium caryophyllatum, fruit. Therefore, the present research work aimed to determine the effect of the maturity stage on physicochemical properties and the antioxidant activity of both fruits, in order to establish an optimum harvesting maturity stage.
Materials and Methods
Chemicals and Equipment
Methanol, sodium carbonate, sodium acetate tetrahydrate, glacial acetic acid, ferric chloride, monosodium dihydrogen orthophosphate, disodium monohydrogen orthophosphate, folin-ciocalteu reagent, gallic acid, 6-hydroxy-2-5-7-8-tetramethylchroman-2-carboxylic acid (Trolox), 2,2-diphenyl-2-picryl-hydrazyl (DPPH), 2,2-azobis(2-amidinopropane) dihydrochloride (AAPH), sodium fluorescein, 2,4,6-tripyridyl-s-triazine (TPTZ) and dimethyl sulfoxide (DMSO) were purchased from Sigma-Aldrich (USA). All chemicals and reagents used in the experiment were of analytical grade.
Plant Material
Fruits of Melastoma malabathricum (L.), Syzygium caryophyllatum (L.), were collected from Galle, Sri Lanka. All fruits were hand-harvested during November 2018 from the trees grown in the natural habitat of the same area (80°13’15’’ E 6°3’12’’ N, Average temperature: 27 °C, average humidity: 73%, Soil type: clay loam soil, Natural light conditions, and Rainfall: 1500–2500 mm). The voucher specimens of both species were deposited at Herbal Technology Section, Industrial Technology Institute, Malabe, Sri Lanka (M. malabathricum, BF001; S. caryophyllatum, BF002).
Plant Material, Sampling, and Preparation of the Pulp
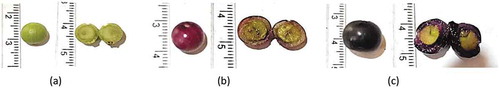
Three maturity stages of M. malabathricum (L.) and S. caryophyllatum (L.) fruits (unripe-MS1, intermediate-MS2, and ripe-MS3) were distinguished as described in . Maturity stages were sorted according to the progressive fruit development by its color change.
Table 1. Characteristics of selected maturity stages of fruit samples collected from Melastoma malabathricum (L.) and Syzygium caryophyllatum (L.) plants
Maturity stages of M. malabathricum and S. caryophyllatum fruits selected for this study were shown in and . Fruits were harvested and transfer (under cold conditions) on the same day to Herbal Technology Section, Industrial Technology Institute, Malabe. After receipting the fruits, they were selected according to the maturity stage, washed, cleaned, and air-dried (25 °C, 2 hours) and each maturity stage of both fruits was processed separately. Both types of fruits at different maturity stages were randomly divided into two subgroups for antioxidant analysis and physicochemical measurements. Approximately 1 kg of fruits from each stage of the maturity stage of both fruits was collected and stored at −20°C for the subsequent use of the study.
Figure 1. Different maturity stages of M. malabathricum (L.) fruit (a) Maturity stage 1 (MS1) immature fruit, (b) Maturity stage 2 (MS2) mature fruit, (c) Maturity stage 3 (MS3) ripen fruit
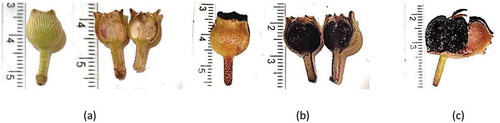
Figure 2. Different maturity stages of S. caryophyllatum (L.) fruit (a) Maturity stage 1 (MS1) immature fruit, (b) Maturity stage 2 (MS2) mature fruit, (c) Maturity stage 3 (MS3) mature fruit
Determination of Physicochemical Properties
The physicochemical properties of the fresh fruits were determined by measuring 30 individual fruits from each maturity stage. Fruit weight and fruit volume were determined using a digital balance (GX-2000, A&D Weighing, Milpitas, CA, USA) and the seed displacement method respectively. The sizes of the fruits were measured by length and width with a vernier caliper (General Tools & Instruments Co., LLC, New York). The color was measured with a Chroma meter (Ramsey, NJ, USA). The (L*) value represented the luminosity of the fruit, where 0 = black and 100 = white, the (a*) value ranged from the negative (green) to the positive (red) scale and the (b*) value ranged from negative (blue) to positive (yellow), (AOAC, Citation1998). pH and titratable acidity (TA) were measured by diluting 5 g grounded fruit pulp in 50 mL with distilled water. TA was determined, using standard AOAC method 942.15 (AOAC, Citation1999). Results are expressed as gram malic acid 100 g fresh weight (fw). pH was measured by using digital pH meter (Consort, C6010, Belgium). Total soluble solids (TSS) (expressed as °Brix) of fruit pulp were measured on a refractometer (Palette, PR-100, Atago Co., Ltd., Tokyo, Japan). The ripening index was calculated as the ratio between TSS and TA. Moisture content was determined using a hot air oven drying method (AOAC, Citation1998).
The firmness was measured on 30 fruits from each maturity stage (peeled M. malabathricum and whole S. caryophyllatum fruits), using a Texture Analyzer, TA.XT2 Plus (Stable Micro Systems, Surrey, England). Each fruit was placed on the smooth platform (Base TA-90) and subjected to 2% deformation, in a compression, mode using a cylindrical probe (38 mm) at a speed of 1.0 mm/sec.
Determination of Total Phenolics Content (TPC) and Antioxidant Activity
Sample Preparations for TPC and Antioxidant Analysis
Test samples of each maturity stage were freeze-dried before the analysis. The edible portion of fruit was collected (after seeds and inedible outer peel was removed) and 250 g of each sample was blended with 100 mL of distilled water using a laboratory-scale blender (at Herbal Technology Section, Industrial Technology Institute, Malabe) for 1 min. Then the homogenized fruit samples were freeze-dried (freeze dryer: Telstar – LYOBRTA 4PS, Parc Scientific Technologic, Terrassa, Spain) for 24 h while maintaining the temperature at −25 °C for the first 24 h and then rose to 5°C for 16 h, and finally, it rose to room temperature for the remaining time. Freeze-dried samples were grounded using a laboratory-scale grinder and stored in an airtight container at −20 °C until analysis. The antioxidant analysis was performed using freeze-dried fruit samples within a week after the freeze-drying process (Gibson et al., Citation2013).
Stock solution for each maturity stage of fruit was made by accurately weighed 5 mg of freeze-dried sample dissolved in 1000 µL of corresponding solvent (stock concentration 5000 ppm). Samples were vortexed for five min and sonicated (model 750D, VWR Intl. Ltd., Montreal, QC, Canada) for 15 minutes. Solutions were centrifuged (Durafuge 300, Precision Scientific, Richmond, VA, USA) at 2800 g for 15 min to get a clear supernatant solution. Dilutions for each assay were done by using this supernatant solution respectively (Zuhair et al., Citation2013). All the bioassays were carried out using high throughput 96-well micro-plate readers (Spectra Max Plus384, Molecular Devices, USA and Spectra Max-Gemini EM, Molecular Devices Inc, USA)
TPC and Antioxidant Analysis
Total Phenolics Content (TPC)
The determination of TPC was carried out according to the modified Folin-Ciocalteu method of Singleton et al. (Citation1999). Fruit extracts were tested within the assay concentration of 500 µg/mL. Weighed freeze-dried fruit samples dissolved in distilled water (110 µL) and were added to ten times dilute folin-ciocalteu reagent. The mixture was incubated with sodium carbonate solution (10% w/v, 70 µL) for 30 min at room temperature (25 ± 2°C) and the absorbance was recorded at 765 nm wavelength with the micro-plate reader. Gallic acid was used as the reference standard. Results were expressed as mg Gallic acid equivalents (GAE)/g of dried fruit sample using the calibration curve of Gallic acid standard (y = 0.034x + 0.0182, r2 = 0.9976).
2,2-diphenyl-2-picryl-hydrazyl (DPPH) Free Radical Scavenging Activity
The DPPH free radical scavenging activity of fruit was determined according to the method of Blois (Citation1958) with some modifications. Fruits were tested at the assay concentration of 500 µg/mL. DPPH solution (40 µg/mL, absorbance of 0.70 ± 0.01 at 517 nm) 200 µL was incubated with 100 µL of freeze-dried fruits dissolved in methanol at room temperature (25 ± 2 °C) in dark for 10 min. The absorbance of the mixture was recorded at 517 nm wavelength with a micro-plate reader. The percentage of DPPH scavenging activity was calculated as follows.
Scavenging activity (%) = [(A control–A sample)/A control] ×100, Where A is the absorbance.
Ferric Reducing Antioxidant Power (FRAP)
The FRAP assay was determined according to the method described by Benzie and Szeto (Citation1991). The freshly prepared FRAP reagent was made by mixing 300 mM acetate buffer (3.1 g sodium acetate trihydrate and 16 mL glacial acetic acid, pH 3.6), 10 mM TPTZ solution (2,4,6-tripyridyl-s-triazine) in 40 mM HCl, and 20 mM ferric chloride hexahydrate solution (10:1:1, v/v/v) and incubating at 37 °C for 10 min. Fruits were tested at a concentration of 100 µg/mL. The stock solution was made by dissolving the freeze-dried fruit in acetate buffer and 20 µL of stock solution which were incubated with acetate buffer (30 µL) and FRAP solution (150 µL) at room temperature (25 ± 2 °C) for 8 min. The absorbance of the ferrous-TPTZ complex was recorded at 593 nm wavelength with a micro-plate reader. Trolox was used as the reference standard. Results were expressed as mg Trolox equivalents (TE)/g of dried fruit sample using a calibration curve of Trolox (y = 0.0773x + 0.1595, r2 = 0.9976).
Oxygen Radical Absorbance Capacity (ORAC)
The ORAC assay was determined according to the method of Ou et al. (Citation2001) with modifications. The assay was carried out at 37 °C and pH 7.4, with a parallel blank sample. Fresh fluorescein (4.8 µM) and AAPH (2,2-azobis(2-amidinopropane) dihydrochloride, 40 µg/mL) solutions were prepared in phosphate buffer (75 mM, pH 7.4) prior to analysis. Fruits were tested in the assay concentration range of 500 µg/mL. The stock solution was made by dissolving the freeze-dried fruit in phosphate buffer. Fruit’s stock solution (10 µL), phosphate buffer (40 µL) and fluorescein solution (100 µL) were pre-incubated at 37°C for 5 min. AAPH solution (50 µL) was added to each well to initiate the reaction. The decay of fluorescein was recorded at 1 min intervals for 35 min at the excitation and emission wavelengths of 494 nm and 535 nm respectively. Trolox was used as the reference standard. The area under the curve of fluorescein decay of fruit and blank was used to calculate the fruit’s net area under the curve. Results were expressed as mg Trolox equivalents (TE)/g of dried fruit sample using the calibration curve of Trolox (y = 0.035x + 0.076, r2 = 0.996).
Statistical Analysis
The study was performed in triplicate for each maturity stage of both fruits and data obtained from the research were expressed as mean ± standard error (SE) and statistical analysis performed by one-way ANOVA using IBM SPSS Statistics 22.0. Tukey’s multiple range tests was used for mean separation when the F value of ANOVA was significant (p < 0.05) for each maturity stage.
Results and Discussion
TPC and Antioxidant Analysis of Fruits
Antioxidant activity of M. malabathricum and S. caryophyllatum fruit with three maturity stages ( and ) were evaluated with respect to total phenolics content (TPC), 2,2-diphenyl-1-picrylhydrazyl (DPPH) radical scavenging activity, ferric reducing antioxidant power (FRAP), and oxygen radical absorbance capacity (ORAC) and obtained results were tabulated in .
Table 2. Antioxidant activity of M. malabathricum (MM) and S. caryophyllatum (SC) fruit with different maturity stages
Phenolic compounds are the main component of the antioxidant capacity of fruits which act as radical scavengers, protect against oxidative damages, and inhibit lipid autoxidation, etc. According to the results given in , the phenolic content of M. malabathricum showed a significant increase with the maturation (p < 0.05), and S. caryophyllatum showed a significant increase between MS1 to MS2 but there is no significant difference between MS2 and MS3. The same variation of TPC of M. malabathricum was reported by Tlili et al. (Citation2014) in Rhus tripartitum from Ain Jalloula district, which also showed a significant increase during maturation. However, Gibson et al. (Citation2013) reported that the phenolic content remained unchanged during fruit maturity, however a decrease in phenolic content was reported in Kachhwaha and Gehlot (Citation2015) and Gull et al. (Citation2012). This may be due to variation of the phenolic content of fruits with several factors, such as biotic and abiotic stress, senescence, cultivar, tissue, harvesting time, post-harvest treatment, and also extraction techniques (Tlili et al., Citation2014; Yarılgaç et al., Citation2019).
The relative antioxidant potential as measured by percent inhibition of DPPH• by freeze-dried fruits is shown in . In this experiment, the DPPH radical scavenging activity of M. malabathricum was expressed as % scavenging at well concentration of 30 ppm dried fruit and S. caryophyllatum at 100 ppm. M. malabathricum exhibits a very high activity therefore; scavenging activity was given in low concentration. Both fruits showed a significant increase (p < 0.05) in percent inhibition of DPPH• with ripening. M. malabathricum demonstrated significantly high radical scavenging activity (p < 0.05) at MS3 stage and it was about a three-fold increment compared to the MS2 stage. S. caryophyllatum exhibited a low DPPH radical scavenging activity compared to M. malabathricum. S. caryophyllatum also showed an increment in radical scavenging activity with maturation, but the percentage increase was comparatively low. Present investigations reveal that DPPH results correlate with TPC with the ripening of fruits. The increasing trend of DPPH radical scavenging activity of the study is in line with the investigations of Tlili et al. (Citation2014) who reported DPPH scavenging activity of the methanolic extract of R. tripartitum, Zuhair et al. (Citation2013) reported about Carica papaya (L.) and Conforti et al. (Citation2007) reported about pepper fruit. However, both Gull et al. (Citation2012) and Kachhwaha and Gehlot (Citation2015) reported a decreasing trend in DPPH activity with ripening.
FRAP measures the reducing power of plant extract, which has the capability to convert Fe3+ to Fe2+ ion. FRAP value is an important indicator of antioxidant capacity and the higher the FRAP value, the greater is the antioxidant activity (Kachhwaha and Gehlot, Citation2015). The results for the reducing power of dried fruit-derived at different maturity stages are shown in . Both fruits exhibit increasing FRAP values during ripening significantly (p < 0.05). M. malabathricum showed a higher FRAP value than S. caryophyllatum that indicates M. malabathricum fruit has more antioxidant activity than S. caryophyllatum. Kachhwaha and Gehlot (Citation2015) and Zuhair et al. (Citation2013) showed an increase in FRAP value with fruit ripening whereas Gull et al. (Citation2012) presented a decrease in FRAP value with guava fruit ripening.
ORAC assay is based on the kinetics of peroxy radicals which exhibit the same reaction mechanism of physiological oxidants in the body (Perera et al., Citation2016). The results for the ORAC assay of dried fruits with different maturity stages are shown in . Both fruits showed a significant increase (p < 0.05) in ORAC value with ripening. M. malabathricum fruit exhibit a higher ORAC value than that of S. caryophyllatum at MS2 and MS3 stages but less ORAC value in the MS1 stage. Acosta-Montoya et al., Citation2010) also reported an increasing trend in ORAC value of tropical highland blackberry during ripening.
Physicochemical Properties of Fruits
Physicochemical properties of M. malabathricum and S. caryophyllatum fresh fruits were measured by using weight, volume, length, width, firmness, color, moisture content, pH, titratable acidity (TA), total soluble solids (TSS), ripening index, and results obtained was tabulated in
Table 3. Physical properties of M. malabathricum and S. caryophyllatum fruit with maturity stages
Fruit maturity and ripening are generally described by their physicochemical properties. Out of three different maturity stages, fully ripen blackish-purple color stage (MS3) was chosen as the edible state of the fruits subjected to this study. Therein, the both fruits were classified into three maturity stages according to the homogeneous surface color and physicochemical properties as given in . According to , the sizes of both fruits were increased with the fruit ripening. Thus the weight of MM increased from 0.26 to 0.82 g and SC fruit from 0.31 to 0.97 g. Volume of both fruits were significantly increased (P < 0.05) in parallel to the increment of maturity stages (MM 0.56–1.56 cm3; SC 1.23–2.15 cm3). And also, during the fruit ripening length and width of both fruits were increased significantly (p < 0.05). Serradillaa et al. (Citation2011) also reported that fruit weight was increased from 6.27 g to 7.60 g and the caliber was from 22.61 mm to 23.72 mm during the cherry fruit ripening.
Firmness is a measurement of the force required to puncture a fruit and it associates with the fruit ripening as well (Khodabakhshian et al., Citation2017). According to , the firmness of both fruits were significantly decreased along with the fruit ripening (P < .05; MM 714.0–228.5 g; SC 1565–176.3 g). The result of this study also indicated that during the fruit ripening both fruits turned into soft texture. Khodabakhshian et al. (Citation2017) also reported that firmness of pomegranate fruit was reduced from 50.12 N to 40.3 N with fruit ripening and they explain this reduction was due to the occurrence of the changes in the structure of polymers in fruit skins during maturity. However, Serradillaa et al. (Citation2011) reported that there was no significant difference in the firmness of cherry fruit during their selected maturity stages because they have selected only at the edible states of ripeness.
Color value pertaining to the lightness (L*) and yellowness (b*) of both fruits were decreased while increasing redness (a*) significantly (P < 0.05). The possible explanation for the color change during natural fruit ripening was a result of chlorophyll degradation and anthocyanin accumulation (Celik et al., Citation2008). The pulp of both fruits turned into dark purple color with the maturation. Most of the researchers explained that the lightness of fruit decrease with the maturation (Celik et al., Citation2008; Zuhair et al., Citation2013). The decrement of L* value may be due to change in color from light green to dark purple. Celik et al. (Citation2008) also reported that the L* value of fruit gradually decreased due to the accumulation of more wax with the maturation. In decrement of b* value indicated that the color change occurs from yellow to blue. Increasing the minus value of b* indicates that further increment of the blueness of M. malabathricum fruit at the MS3 stage. Further, the increment of a* value with the fruit maturation indicates that the color change of fruit occurs from green to red. Zuhair et al. (Citation2013) reported that both a* and b* values were increased with the ripening of papaya fruit while developing orange-red color.
According to , the pH values of both fruits were increased with the ripening process (MM 2.59–3.10; SC 3.20–3.63). The pH of both fruits at MS3 was in the range of 3–5 where the pH promotes the processes of copigmentation, which favor the stability anthocyanin (Serradillaa et al., Citation2011). However, in contradictory, TA was decreased with the ripening of both fruits. Increment of pH and decrement of TA value indicates that the acidity of both fruits reduced during the ripening. However; Zuhair et al. (Citation2013) reported a contradictory result, therein, they described decrease of pH value while increasing of TA value of papaya fruit. The total soluble solids (TSS) of both fruits were increased with the ripening process (MM 9.68–13.84 °Brix; SC 11.31–16.82 °Brix). Zuhair et al. (Citation2013) reported that the TSS value of the papaya fruit was continuously increased from 6.60 to 11.50 °Brix during fruit ripening. That may be due to the hydrolysis of starches into sugars during fruit ripening. Hence, the formation of sugars during fruit ripening, they impart to increases the sweetness of fruits along with the ripening process. Khodabakhshian et al. (Citation2017) reported that pH and TSS were increased with the ripening of pomegranate fruit. According to Celik et al. (Citation2008), berry size and Brix values of cranberry fruit were progressively increased during fruit maturation. In the case of the ripening index (TSS/TA) of both fruits of this study which was also increased with the fruit ripening (MM 3.07–6.50; SC 2.66–12.55). Further, the moisture content of both fruits was gradually increased during ripening (MM 79.15–84.25; SC 84.60–87.56) and SC fruit contained more moisture content than that of MM fruit. That may be the reason for the low hardness and juiciness of SC fruit at the MS3 stage compared to MM fruit.
Table 4. Color of M. malabathricum and S. caryophyllatum fruit with maturity stages
Table 5. Physiochemical properties of M. malabathricum and S. caryophyllatum fruit with maturity stages
Conclusion
To the best of our knowledge, reported results are the first study about changes in antioxidant activity and physicochemical properties of Melastoma malabathricum and Syzygium caryophyllatum fruits during different maturity stages. The results revealed that antioxidant activity and physicochemical properties of M. malabathricum and S. caryophyllatum fruit are significantly affected along with the maturation stages (P < 0.05). The chemical properties of fruits such as TPC and antioxidant activity values were increased with the maturation, and both fruits showed the highest TPC and antioxidant activity at the fully ripen stage (MS3). And also physicochemical properties namely weight, volume, width, length, pH, TSS, ripening index, and moisture content were increased with the maturation. Whereas, TA and firmness of both fruits were decreased significantly along with the ripening. Lightness and yellowness of both fruits were decreased while increasing the redness significantly (P < 0.05). Therefore, the optimum maturity, with regards to the antioxidant activity and physicochemical properties of both fruits were shown at the fully ripen stage.
Declaration Of Interest
No potential conflict of interest was reported by the authors.
Acknowledgments
The authors thank the University of Sri Jayewardenepura, Sri Lanka for financial assistance (Grant No: ASP/01/RE/SCI/2016/19).
Additional information
Funding
References
- Acosta-Montoya, Ó., F. Vaillant, S. Cozzano, C. Mertz, A.M. Pérez, and M.V. Castroc. 2010. Phenolic content and antioxidant capacity of tropical highland blackberry (Rubus adenotrichus Schltdl.) during three edible maturity stages. Food Chem. 119:1497–1501. doi: http://doi.10.1016/j.foodchem.2009.03.
- Ali, Z.M., L.H. Chin, and H. Lazan. 2004. A comparative study on wall degrading enzymes, pectin modifications and softening during ripening of selected tropical fruits. Plant Sci. 167(2):317–327. doi: http://doi.10.1016/j.plantsci.2004.03.030.
- AOAC. 1998. Official Method of Analysis. 15th Edition, Association of Official Analytical Chemists, Washington DC. USA.
- AOAC. 1999. Official methods of analysis of AOAC International. AOAC International, Maryland.
- Atkinson, C.J., R. Nestby, Y.Y. Ford, and P.A.A. Dodds. 2005. Enhancing beneficial antioxidants in fruits: A plant physiological perspective. Bio Factors. 23(4):229–234. doi: http://doi.10.1002/biof.5520230408.
- Aziz, N., N.A. Mat Nor, A.F. Mohd Adnan, R.M. Taha, and A.K. Arof. 2012. Study of anthocyanin stability derived from the fruit pulp of Melastoma malabathricum in a coating system. Pigment Resin Tech. 41(4):223–229. doi: http://doi.10.1108/03699421211242455.
- Benzie, I.F.F., and Y.T. Szeto. 1991. Total antioxidant capacity of teas by the ferric reducing antioxidant power assay. J. Agric. Food Chem. 47:633–636. doi: http://doi.10.1021/jf9807768.
- Blois, M.S. 1958. Antioxidant determination by use of stable free radical. Nature. 181:1199–1200. doi: 10.1038/1811199a0.
- Celik, H., M. Ozgen, S. Serce, and C. Kaya. 2008. Phytochemical accumulation and antioxidant capacity at four maturity stages of cranberry fruit. Sci. Hortic. 117:345–348. doi: http://doi.10.1016/j.scienta.2008.05.005.
- Conforti, F., G.A. Statti, and F. Menichini. 2007. Chemical and biological variability of hot pepper fruits (Capsicum annuumvar. acuminatum L.) in relation to maturity stage. Food Chem. 102:1096–1104. doi: http://doi.10.2016/j.foodchem.2006.06.047.
- Gibson, L., H.P.V. Rupasinghe, C.F. Forney, and L. Eaton. 2013. Characterization of changes in polyphenols, antioxidant capacity and physico-chemical parameters during low bush blueberry fruit ripening. Antioxidants. 2:216–229. doi: http://doi.10.3390/antiox2040216.
- Gull, J., B. Sultana, F. Anwar, R. Naseer, M. Ashraf, and M. Ashrafuzzaman. 2012. Variation in antioxidant attributes at three ripening stages of guava (Psidium guajava L.) fruit from different geographical regions of Pakistan. Molecules. 17:3165–3180. doi: http://doi.10.3390/molecules17033165.
- Joshipura, K.J., F.B. Hu, J.E. Manson, M.J. Stampfer, E.B. Rimm, F.E. Speizer, G. Colditz, A. Ascherio, B. Rosner, D. Spiegelman, et al. 2001. The effect of the fruit and vegetable intake on risk for coronary disease. Ann. Intern. Med. 143:1106–1114. doi: http://doi.10.7326/0003-4819-134-12-200106190-00010.
- Kachhwaha, P., and H.S. Gehlot. 2015. Changes in phytonutrients and antioxidant properties of Cordia myxa and Carissa carandas fruit during ripening. Ind. J. Plant Physiol. 20(1):72–78. doi: http://doi.10.1007/s40502-015-0138-7.
- Kaur, C., and H.C. Kapoor. 2001. Antioxidants in fruits and vegetables the millennium’s health. Int. J. Sci.Tech. 36:703–725. doi: http://doi.10.1111/j.1365-2621.2001.00513.x.
- Khodabakhshian, R., B. Emadi, M. Khojastehpour, and M.R. Golzarian. 2017. Determining quality and maturity of pomegranates using multispectral imaging. J. Saudi Soc. Agri. Sci. 16:322–331. doi: http://dx.doi.10.1016/j.jssas.2015.10.004.
- Malek, S.N.H.A., S.H. Baek, and A. Asari. 2003. A. chemical components of Melastoma malabathricum. ACGC Chem. Res. Commun. 16:28–33.
- Ou, B., M. Hampsch-Woodill, and R.L. Prior. 2001. Development and validation of an improved oxygen radical absorbance capacity assay using fluorescein as the fluorescent. J. Agric. Food Chem. 49:4619–4626. doi: http://doi.10.1021/jf010586o.
- Perera, H.D.S.M., J.K.R.R. Samarasekera, S.M. Handunnetti, and O.V.D.S.J. Weerasena. 2016. In vitro anti-inflammatory and antioxidant activities of Sri Lankan medicinal plants. Ind. Crops Prod. 94:610–620. doi: http://dx.doi.10.1016/j.indcrop.2016.09.009.
- Robards, K., P.D. Prenzler, G. Tucker, P. Swatsitang, and W. Glover. 1999. Phenolic compounds and their role in oxidative processes in fruits. Food Chem. 66:401–436. doi: http://doi.10.1016/S0308-8146(99)00093-X.
- Serradillaa, M.J., M. Lozano, M.J. Bernalte, M.C. Ayuso, M. López-Corralesa, and D.D. González-Gómez. 2011. Physicochemical and bioactive properties evolution during ripening of ‘Ambrunés’ sweet cherry cultivar. LWT - Food Sci. Technol. 44:199–205. doi: http://doi.10.1016/j.lwt.2010.05.036.
- Siddiqui, M.D.W., C.M. Momin, P. Acharya, J. Kabir, M.K. Debnath, and R.S. Dhua. 2013. Dynamics of changes in bioactive molecules and antioxidant potential of Capsicum chinense Jacq. cv. Habanero at nine maturity stages. Acta Physiologiae Plantarum. 35:1141–1148. doi: http://doi.10.1007/s11738-012-1152-2.
- Singleton, V.L., R. Orthofer, and R.M. Lamuela-Raventos. 1999. Analysis of total phenols and other oxidation substrates and antioxidants by means of Folin-Ciocaltue reagent. Methods Enzymol. 299:152–178. doi: http://doi.10.1016/S0076-6879(99)99017-1.
- Subramanian, R., P. Subbramaniyan, and V. Raj. 2012. Determination of some minerals and trace elements in two tropical medicinal plants. Asian Pac J Trop Biomed. 2:555–558. doi: http://doi.http://doi.10.1016/S2221-1691(12)60273-1.
- Tlili, N., H. Mejri, Y. Yahia, E. Saadaoui, S. Rejeb, A. Khaldi, and N. Nasri. 2014. Phytochemicals and antioxidant activities of Rhus tripartitum (Ucria) fruits depending on locality and different stages of maturity. Food Chem. 160:98–103. doi: 10.1016/j.foodchem.2014.03.030.
- Vankar, P.S., V. Tiwari, L.W. Singh, and L. Potsangbam. 2009. Sonicator dyeing of cotton fabric and chemical characterization of the colorant from Melastoma malabathricum. Pigment Resin. Techno. 38(1):38–42. doi: http://doi.10.1108/03699420910923562.
- Yarılgaç, T., H. Kadim, and B. Ozturk. 2019. Role of maturity stages and modified‐atmosphere packaging on the quality attributes of cornelian cherry fruits (Cornus mas L.) throughout shelf life. J. Sci. Food Agric. 99(1):421–428. doi: 10.1002/jsfa.9203.
- Zuhair, R.A., A. Aminah, A.M. Sahilah, and D. Eqbal. 2013. Antioxidant activity and physicochemical properties changes of papaya (Carica papaya L. cv. Hongkong) during different ripening stage. INt. Food Res. J. 20(4):1653–1659.