
 ?Mathematical formulae have been encoded as MathML and are displayed in this HTML version using MathJax in order to improve their display. Uncheck the box to turn MathJax off. This feature requires Javascript. Click on a formula to zoom.
ABSTRACT
Bael fruit pulp was treated with pectinase enzyme for the easy extraction and high recovery of juice with nutritive properties. The response surface methodology (RSM) and artificial neural network (ANN) modeling were carried out on runs of Box-Behnken design of three variables for the optimization process and identification of the best modeling method. Pectinase concentration of 0.22 g/100 g of pulp, the temperature of 46.20°C, and time of 6.35 hours was found out to be RSM optimized value of variables whereas pectinase concentration of 0.18 g/100 g of pulp, the temperature of 46.81°C and time of 6.09 hours was obtained to be ANN-GA optimized value of variables. From the values of the coefficient of determination (R2), root mean squared error (RMSE), and mean absolute error (MAE), ANN was found out to be better than RSM. This research would help in the commercial production of bael fruit juice on an industrial scale.
Introduction
Bael (Aegle marmelos C.) is an underutilized indigenous fruit that belongs to the Rutaceae family and grown in India and its subcontinents. It has tremendous nutritive and medicinal properties, which make it processable and unique from other fruits (Roy and Singh, Citation1979; Sonawane et al., Citation2020). The pulp of bael fruit is highly fibrous along with the seeds and has complex texture. The yellow-orange and palatable pulp contain minerals like phosphorus and calcium, vitamins such as vitamin C, thiamine, riboflavin, and niacin. The highly mucilaginous bael fruit pulp also contains bioactive compounds, namely marmelosin, marmelide, tannin, luvangetin, psoralen, and aurapten. Bael fruit is rich in β-carotene (Bag et al., Citation2009; Panda et al., Citation2014). Many products such as wine, powder, toffee, marmalade, candy, slab, jelly, jam, nectar, etc. can be made from bael fruit pulp for therapeutical as well as food purposes (Bhattacherjee et al., Citation2015).
Bael fruit contains fibrous pulp with a complex texture that restricts the higher juice recovery. The extraction of pulp from bael fruit and extraction of juice from pulp is the most tedious work and the main obstacle in the processing of bael fruit (Singh et al., Citation2014). The high viscosity of pulp makes the extraction of juice difficult, and it also contributes to the pulp losses. Only by adding water, all vitamins, minerals, polyphenols, and bioactive compounds are unable to extract into juice. In beverage industries, enzymatic-mechanical extraction of fruit juice is considered as the best method (Ghosh et al., Citation2016). Enzyme ruptures the wall of the cell and pectin substrate, and this results in the release of sap from a cell, and the whole process is known as depectinization or enzyme hydrolysis (Gurung et al., Citation2013). Depectinisation, followed by the mechanical extraction of pulp, increases the solubility of dietary fibers, which results in high recovery of juice and higher extraction of vitamins, minerals, polyphenols, and bioactive compounds in the juice. Enzymes such as pectinase cellulose, etc. show different activities with different fruit pulp (Ghosh et al., Citation2016).
The process of enzymatic extraction of juice is an expensive method as the cost enzyme is high. So the process of enzymatic extraction needs to be modeled and optimized based on quality parameters of juice for its commercialization on an industrial scale. The optimized values of variables (process parameters) will reduce the time taken and the cost required for the extraction of juice with the retention of nutritive properties.
Response surface methodology (RSM) is an essential statistical tool to model and develop the empirical equations between the independent and dependent variables by using sequential experimental techniques. RSM is generally used for optimization by focusing on important variables and their effects (Erbay and Icier, Citation2009; Yang et al., Citation2009). Many applications of RSM befall in the area of chemical engineering, biological engineering, and industrial research (Chen et al., Citation2005). An artificial neural network (ANN) is a computational technique that uses the principle of the human brain neurological system for data learning or training (Youssefi et al., Citation2009). The acceptance of ANN in food processing is increasing day by day for modeling of data. It is because of its properties like resistance to noisy, accommodation of multiple nonlinear variables, parallel processing capacity, universal function approximation capability, and good generalization ability (Coit et al., Citation1998; Rai et al., Citation2005). The well trained ANN model can be used for data fitting and prediction. Genetic algorithm (GA) is an optimization tool and having numerous applications in practical problems. It reduces the simulation time and also maintains accuracy. Coupling of ANN with GA (ANN-GA) has been using for the optimization in many practical applications (Akintunde et al., Citation2015; Hugget et al., Citation1999; Srinivas and Patnaik, Citation1994).
In this paper, modeling and optimization of variables were carried out for the pectinase assisted extraction of bael fruit juice by using RSM and ANN-GA based on quality parameters of extracted juice. This paper also aimed to identify the best modeling method and make the juice extraction process qualitatively and commercially viable.
Materials and Methods
Sample Preparation and Juice Extraction
The bael fruits (variety: Kagzi) at the full ripen maturity stage were harvested from the trees located in Rourkela, and fruits were stored in a deep freezer at −20 ± 2°C (Roy and Singh, Citation1979). The yellowish-orange color bael fruits were taken and poured for the thawing process. The pulp was taken out by using a spoon after breaking the hard shell of thawed bael fruit. The fibrous pulp was passed through a sieve to get uniform textured pulp without fibers and seeds. After sieving, the pulp was blended neatly for maintaining consistency and uniformity. The blended pulp was kept again in a deep freezer at −20 ± 2°C for further experiments. The thawing of sieved bael fruit pulp was performed as per the procedure of Nadulski et al. (Citation2016) for further experiments. The storing (at −20 ± 2°C) and thawing processes have shown a negligible effect on the color and physiochemical properties of bael fruit and pulp.
The bael fruit pulp has a complex texture; therefore, it is very difficult to get maximum juice yield from the pulp. So the water was added to 100 g of the pulp of bael fruit in the proportion of 2:1 (weight/weight) to extract juice easily with the help of the enzyme. Pectinase (EC-232-885-6) (commercial name: Himedia, Mumbai, India) of 8000–12000 units/g activity from Aspergillus niger was used as an enzyme for the extraction of bael fruit juice from its pulp as bael fruit pulp contains a higher amount of pectin (Jindal et al., Citation2013). The enzymatic treatment of pectinase of a particular concentration was given to the pulp for a particular time and temperature in an incubator at 125 rpm. Then treated sample was passed through a muslin cloth to separate a bael fruit juice from the fibers (Ghosh et al., Citation2016; Mohanty et al., Citation2018). For the deactivation of the pectinase enzyme, the temperature treatment (−20°C) for 5 min was given to extracted bael fruit juice. A similar kind of enzyme deactivation process was carried out by Ghosh et al. (Citation2016) and Vivek et al. (Citation2019) for Jamun and Sohiong juice, respectively.
Experimental Design and Response Surface Methodology (RSM)
The enzyme concentration (X1), incubation temperature (X2), and incubation time (X3) were used as process parameters or variables (independent variables) for the extraction of juice. The preliminary experiments were carried out for setting the upper and lower values of the variables. The preliminary study has helped to limit the independent variables up to three levels instead of going for the five levels of rotatable central composite design (RCCD). The levels and values of independent variables with their coded values are given in . Box-Behnken design of response surface methodology (RSM) was used to obtain the total number of runs and the combination of design parameters in the Design Expert of version 11.0. The reason behind using the Box-Behnken design for modeling and optimization was to generate the high order response surfaces with a minimal number of runs of three levels of the independent variable. The experimental Box-Benhken design of three independent variables with two levels gives 17 runs.
Table 1. Coded and actual values variables (process parameters) with their levels for enzymatic extraction of bael fruit juice
The effect of variables (process parameters) viz. enzyme concentration (X1), incubation temperature (X2), and incubation time (X3) on responses such as juice yield (Y1), total soluble solids (TSS) (Y2), viscosity (Y3), turbidity (Y4), total phenol content (Y5) and vitamin C (Y6) was modeled mathematically by using Box-Behnken design of response surface methodology (RSM) in Design-Expert software of version 11.0 (Vivek et al., Citation2019). The equation model was obtained for all responses (quality parameters). The significance and validation of each modeled equation were checked in terms of coefficient of determination (R2), adjusted R2, predicted R2, and analysis of variance (ANOVA). The quadratic equation of second-degree polynomial with regression coefficients represents the effect of variables on responses, and it is given by a mathematical model, as shown in EquationEquation 2(2)
(2) .
where Y is predicted response, b1, b2, and b3 are the linear coefficients, b12, b13, and b23 are the interaction coefficients, whereas b12, b22, and b32 are the quadratic coefficients. The response surfaces were obtained by using response EquationEquations 2(2)
(2) of the developed RSM model to express the effect of variables on responses.
Characterization of Extracted Bael Fruit Juice
The quality of extracted bael fruit juice was determined by the characterization, which comprises of different analysis such as juice yield, total soluble solids (TSS), viscosity, turbidity, total phenol content, and vitamin C and collectively called as responses.
The juice recovery is represented by juice yield (%) and was calculated by EquationEquation 1(1)
(1) (Vivek et al., Citation2019). TSS of extracted bael fruit juice in °Brix was determined by using a hand refractometer (Erma Inc., Japan). The viscosity of bael fruit juice was determined by using the Brookfield Viscometer (Model: DV2TLV, USA).
Digital Turbidity Meter (Model: MT-134, India) was used for the determination of turbidity in NTU (Sin et al., Citation2006). Folin–Ciocalteu method was carried out for the estimation of total phenol content in the juice. The standard curve of gallic acid with different concentrations at 650 nm absorbance was obtained to determine the total phenol content in bael fruit juice. The total phenol content was expressed in mg of gallic acid equivalent per 100 mL of extracted juice (Singleton et al., Citation1999). The titrimetric method was carried out for determination of vitamin C (ascorbic acid), and vitamin C was expressed in mg per 100 mL of extracted juice (Rekha et al., Citation2012). Each analysis of juice was carried out in triplicates and converted to average values. The characterization of raw bael fruit juice with a 2:1 ratio (weight/weight) of water to the pulp (without enzymatic and incubation treatment) is given in .
Table 2. Characterization of raw bael fruit juice
ANN Modeling
The neural network fitting tool of Matlab (Matlab 9.6 – R2019a, The Mathworks Inc., MA, USA) software was used for modeling of experimental data which was obtained in the enzymatic extraction of bael fruit juice. Multilayer perceptron (MLP) is the most widely used technique for the modeling of data in ANN. MLP consists of a feed-forward (FF) backpropagation (BP) algorithm of a neural network of the input layer, hidden layers, and output layer. Each layer may contain one or more neurons. The number of hidden layer neurons was varied from 5 to 15 to develop a different neural network for the training of data. The optimum condition (minimum error condition) for the given data was obtained by trial and error (Chegini et al., Citation2008; Hornik et al., Citation1989; Pradhan et al., Citation2020; Rai et al., Citation2005). ANN model was trained until the error between observed and predicted values of responses was reached a minimum value. The Bayesian Regularization training algorithm was used for training of data set. This algorithm gives good results small or noisy and difficult data set and but requires more time to train an adaptive weight minimization feature. The synaptic joints between the neurons of the different layers have weights (values), and each neuron has a bias or threshold values. These weights and bias or threshold values are collectively called as neural network parameters. The neural network parameters were generated by using Matlab code after training of data to the optimum condition. The weights of synaptic joints between the input and hidden layer, as well as the hidden and output layer, were determined by a well-developed ANN model for optimizing the variables.
Verification of Estimated Data
The performance of RSM and ANN modeling was carried out by determining the coefficient of determination (R2), mean absolute error (MAE), and root mean squared error (RMSE) for six outputs (Razmi-Rad et al., Citation2007; Youssefi et al., Citation2009). The formulae of R2, MAE, and RMSE are given below:
where Yiobs is an observed value of the response, Yipre is RSM or ANN-predicted value of the response, is the average value of the observed responses, and n is the number of data points for a single response.
RSM and ANN-GA Optimization of Variables
The optimization of variables (process parameters) was based on the values of responses that we wanted to minimize or maximize. In this study, the juice yield, total phenol content, and vitamin C were assigned as maximum parameters for higher nutritive value. In contrast, viscosity, TSS, and turbidity were assigned as minimum parameters for optimization. The lower values of viscosity and TSS of the extracted bael juice allow easy pumping, conveying, processing, and convenient for the drinking purpose as well.
The numeric RSM optimization was carried out in a Design Expert to give optimized values. ANN-GA optimization for variables of the bael fruit juice extraction was performed by using the genetic algorithm (GA) toolbox of Matlab (Matlab 9.6 – R2019a, The Mathworks Inc., MA, USA). GA includes population, selection, reproduction, mutation, and crossover as its functional steps in the optimization process. The weights of synaptic joints and bias or threshold values of neurons that were derived from ANN modeling of each response were used collectively for GA optimization (Nandi et al., Citation2002; Sivanandam and Deepa, Citation2008).
Results and Discussion
RSM Analysis
Model Data Fitting
The quadratic model (equation) was developed for every response with the linear, interaction, and quadratic terms of variables. The regression coefficients of linear, interaction and quadratic terms for responses are given in . The quadratic model of the second-order polynomial has given the predicted values of responses by putting the values of regression coefficients and variables in EquationEquation 2(2)
(2) . The RSM predicted values of responses are shown in .
Table 3. Regression coefficients of the RSM model
Table 4. (a) Observed, RSM and ANN-predicted values of juice yield, TSS, and viscosity and for enzymatically extracted bael fruit juice
The coefficient of determination (R2), adjusted R2, predicted R2, root means squared error (RMSE) and mean absolute error (MAE) was determined to validate the developed RSM model from the observed and predicted values of responses (). The linear terms have shown a significant effect, whereas interaction and quadratic terms have given the least effect on the responses. The values of R2 and adj R2 were found to be within acceptable limits for every response. The difference between adjusted R2 and predicted R2 was found to be less than 0.2 for all responses, and this indicated the reasonable agreement between adjusted R2 and predicted R2. The analysis of variance (ANOVA) indicates the significance of the developed model for every response. The F- values of developed models have shown that all models are significant with the lack of fit as a not significant (p > .05), which is desirable.
Effect of Variables on the Quality of Bael Fruit Juice
The variables (process parameters) have shown a significant effect on juice yield, TSS, viscosity, turbidity, total phenol content, and vitamin C. The effect of each variable on every qualitative parameter of extracted bael fruit juice was studied by using response surfaces (three-dimensional graphs). Three-dimensional graphs were derived from the predicted values of the RSM equation (Xi et al., Citation2013).
The juice yield of bael fruit ranges from 43 to 57%. The juice yield was higher at higher pectinase enzyme concentration and in the middle range of temperature, as shown in , whereas the juice was higher in the middle range of time and higher pectinase concentration as per . In , it is confirmed that the juice yield was higher in the middle range of temperature and time. Thus pectinase concentration, temperature, and time have shown a positive linear effect on juice yield. The higher concentration of pectinase allows more breakdown of the cell wall, and this results in a higher release of sap from a cell. In addition to that, the solubility of fibers increases at the higher concentration of pectinase enzyme, and that promotes the higher juice yield. This kind of trend for juice yield was obtained by Surajbhan et al. (Citation2012) and Ghosh et al. (Citation2016) for guava and Jamun juice. The effect of variables on total soluble solids (TSS) has shown in (ii).
Figure 1. Response surfaces of juice yield (%) and TSS (°Brix)
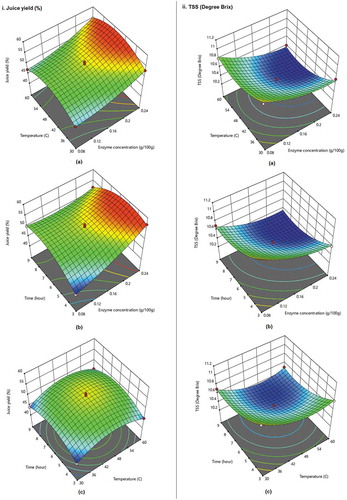
TSS was found to a minimum at higher enzyme concentration, temperature, and time as shown in (ii-a,b,c). This indicates that the pectinase concentration, temperature, and time had a negative linear effect on TSS. The higher pectinase concentration would degrade the complex compounds, which may increase in the juice yield. Consequently, it reduces the concentration of TSS in the juice. A similar kind of outcome for TSS has been reported by Mohanty et al. (Citation2018) for palm juice.
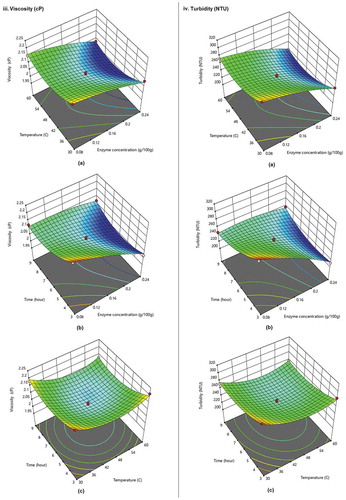
The interaction of variables on viscosity and turbidity is shown in . Both viscosity and turbidity have given similar trends as they are closely related to each other. The viscosity and turbidity were found out to be minimum at higher enzyme concentration and in the middle range of temperature and time. This is due to the breakdown of pectin and cellulose at higher pectinase concentration, which gives higher juice yield, and this dilutes existing juice. Thus, it results in lower viscosity and, consequently, the turbidity (Ghosh et al., Citation2016; Kittur et al., Citation2003). The pectinase concentration, temperature, and time have shown a negative linear effect on both viscosity and turbidity. Vivek et al. (Citation2019) have been reported similar behavior of viscosity and turbidity for Sohiong fruit juice.
Figure 2. Response surfaces of viscosity (cP) and Turbidity (NTU)
The total phenol content is one of the major and the most important factor of any juice. The total phenol content is responsible for the antioxidant activity of juice. The total phenol content of bael fruit juice was maximum in the middle range of enzyme concentration and temperature, as represented in (v-a). From (v-b and c), it has been shown that the time had a negligible effect on total phenol content. Higher enzyme concentration and temperature denature the phenolic compounds, which may reduce the total phenol content of bael fruit juice. The pectinase concentration, temperature, and time have shown a positive linear effect on total phenol content, which was earlier reported by Ghosh et al. (Citation2016) and Altemimi et al. (Citation2016) for Jamun juice and Jatropha dioica respectively.
Figure 3. Response surfaces of and total phenol content (mg/100 mL) and vitamin C (mg/100 mL)
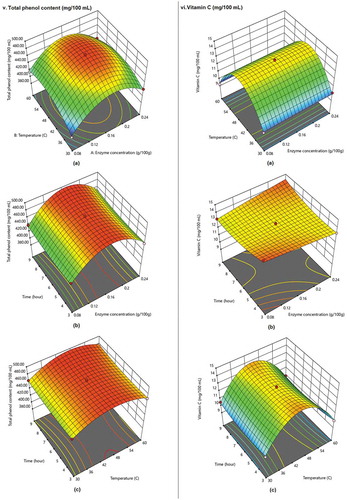
The enzyme concentration and time had a negligible effect on vitamin C of bael fruit juice, and vitamin C could be considered as a function of temperature as it has an overall dependency on temperature, as shown in (vi- a, b, and c). The higher temperature of incubation denatures and oxidizes vitamin C as it gets dissolved in the water, and this reduces the vitamin C content in juice (Oyeleke and Olaniyan, Citation2007). The pectinase concentration has shown positive linear effect whereas, temperature and time have shown a negative linear effect on vitamin C. Similar behavior has been obtained for pomegranate and apple juices (Ioana et al., Citation2015; Paul and Ghosh, Citation2012).
Performance and Verification of Developed ANN Model
The selection of best conditions for the topology of ANN was based on mean absolute error, correlation plot, performance plot, and correlation coefficient (Hornik, Citation1993; Ripley and Hjort, Citation1996). The hidden layer containing eight neurons showed the best result for the training of ANN. The best network topology of a well-trained ANN model (3:8:6) is shown in . The weights of joints connecting different layer neurons and bias or threshold values of hidden and output layer neurons are represented in matrix form. The matrix size of weights of synaptic joints between input and hidden layer neurons was 8 × 3, whereas the matrix size of weights of synaptic joints connecting hidden and output layer neurons was 6 × 8. The matrix size of bias or threshold values of hidden and output layer neurons was 8 × 1 and 6 × 1, respectively. The weights of synaptic joints and bias or threshold values of neurons are given in equations from 6 to 9.
Figure 4. The topology of a well-developed ANN model for enzymatic extraction of bael fruit juice
where u is the weights of synaptic joints between input and hidden layer neurons, th is the bias or threshold values of hidden layer neurons, w is the weights of synaptic joints between hidden and out layer neurons, and t0 is the bias or threshold values of output layer neurons.
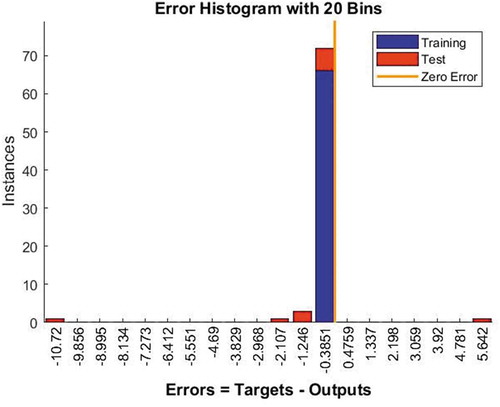
The performance of training and test of the developed ANN model was confirmed with the correlation coefficient (R) of 1.0 and 0.99977, respectively. The value of the correlation coefficient (R) was 0.99996 for all response data and shown in . The error histogram of the developed ANN model with training and test error of the data set is shown in . An error was calculated as a difference between the target value or observed value of response and the output value of the response from the developed ANN model. The minimum bar at zero error in histogram has indicated the higher accuracy of the developed ANN model.
Figure 5. The correlation coefficient (R) of training test and all data of well-developed ANN model
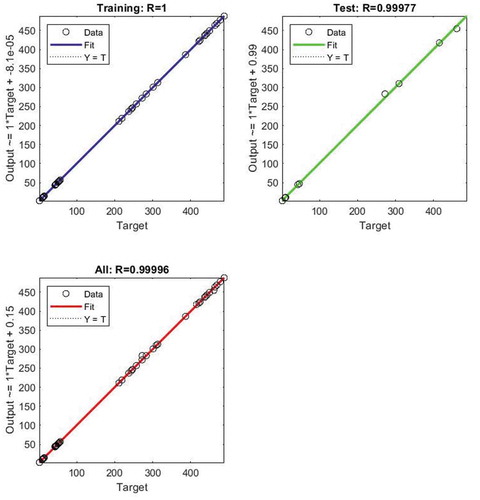
Figure 6. Error histogram of the developed ANN model
The developed ANN model was verified by statistical parameters such as coefficient of determination (R2), root means squared error (RMSE), and mean absolute error (MAE). shows the values of R2, RMSE, and MAE for all responses, and all values are satisfactory and acceptable concerning the eight responses as output in ANN modeling (Chegini et al., Citation2008). For the best fit model, the value of R2 should be more than 0.80 (Joglekar et al., Citation1987). The values of R2 for juice yield, TSS, viscosity, turbidity activity, total phenol content, and vitamin C were 0.97, 0.99, 0.99, 0.99, 0.99, and 0.99, respectively. The ANN modeling of bael fruit juice extraction by pectinase showed R2 values more than 0.80 for all responses, and this showed that the developed ANN model is valid (Pradhan et al., Citation2020). The ANN modeled predicted values of responses are shown in . From and , it is clearly shown that the ANN model had lower values of RMSE and MAE for all responses than the RSM model. Thus, as expected, the ANN was showing superiority over the RSM for enzymatic extraction of bael fruit juice due to its high processing ability and goof generalization ability (Akintunde et al., Citation2015; Zbiciński et al., Citation1997).
Table 5. R2, RMSE and MAE values of observed and ANN-predicted responses for verification of developed ANN model
RSM and ANN-GA Optimization
For RSM optimization, the numerical method was implemented to obtain optimized values of variables as well as responses. The Matlab code was created for the optimization of variables (process parameters), which includes enzyme concentration (g/100 g of pulp), temperature (°C), and time (hours). The fitness function, which is used in ANN-GA optimization, is given below (Goldberg, Citation1989; Hugget et al., Citation1999; Xi et al., Citation2013):
where y(1), y(2), y(3), y(4), y(5), and y(6) are the ANN-predicted values of juice yield, TSS, viscosity, turbidity, total phenol content, and vitamin C respectively. The negative sign indicates the maximization of the given function in the genetic algorithm. For ANN-GA optimization, population size was selected as 200 because, on repeating the GA loop, less than 200 iterations were coming. The scaling, selection, mutation, and crossover functions were assigned as Rank, Roulette, adaptive feasible, and scattered, respectively. Other functions were selected as the default by GA itself for the best optimization result (Shen et al., Citation2007). The process of GA optimization continued until convergence forms a result of best-optimized values for variables. By using the Matlab code, the prediction was made over the optimized values of the variables to obtain the respective values responses (quality parameters).
The RSM and ANN-GA optimized values of variables (process parameters) are shown in , with their corresponding values of responses (quality parameters). The RSM optimization has shown a higher concentration of pectinase enzyme and prolonged incubation time, whereas lower incubation temperature than ANN-GA optimization. Mathematically, the ANN model showed superiority over RSM. In addition to that, the optimized value of enzyme concentration for the ANN model (0.18 g/100 g of pulp) is considerably lower than RSM (0.22 g/100 g of pulp). Hence the ANN model would require a lower cost to perform it on a commercial scale than RSM. The reason behind the higher pectinase enzyme concentration of RSM and ANN-GA optimization for extraction of bael fruit juice may be the complex nature, presence of fiber, and higher viscosity of bael fruit pulp, as discussed earlier (Shrestha, Citation2000). A similar range of concentrations of pectinase enzyme was obtained by Mohanty et al. (Citation2018) for palm juice, whereas a similar range of incubation temperature was attained by Vivek et al. (Citation2019) for Sohiong fruit juice.
Table 6. RSM and ANN-optimized values of variables and responses
Conclusion
The bael fruit juice was extracted by using variables, namely pectinase enzyme concentration, incubation temperature, and time according to the runs, which were given by Box-Behnken design. The characterization of enzymatically extracted bael fruit juice was carried out to develop the RSM and ANN model and optimize the variables (enzyme concentration, temperature, and time). RSM models for every response were developed, whereas a well-developed ANN model was obtained by training data set for optimization of variables. The effect of variables on the quality of enzymatically extracted bael fruit juice was studied by using response surfaces (three-dimensional graphs). RSM optimization showed the pectinase concentration of 0.22 g/100 g of pulp, incubation temperature of 46.20°C, and an incubation time of 6.35 hours as an optimized value of variables. ANN-GA coupling has given the optimized value of enzyme concentration, temperature, and time as 0.18 g/100 g of pulp, 46.81°C, and 6.09 hours respectively. Enzymatically extracted juice of bael fruit has shown better quality as compared to its raw juice. The optimized value of pectinase concentration was higher for enzymatic extraction of bael fruit juice, and this may increase the cost of juice. ANN has shown the higher values of R2, whereas lower values of RMSE and MAE for all responses than RSM, and this indicates the higher accuracy and better adaptability of the ANN model, which can be useful to scale-up the experiment for commercial production of bael fruit juice. The RSM and ANN-GA optimized values of variables can save the time, labor, and cost of the experiment to process highly nutritive bael fruit juice.
Acknowledgments
No fund was offered from any organization or institute.
Disclosure Statement
The authors declare that they do not have any conflict of interest.
Data Availability Statement
Research data are not shared.
References
- Akintunde, A.M., S.O. Ajala, and E. Betiku. 2015. Optimization of Bauhinia monandra seed oil extraction via artificial neural network and response surface methodology: A potential biofuel candidate. Ind. Crops Prod. 67:387–394. doi: 10.1016/j.indcrop.2015.01.056.
- Altemimi, A., D.G. Watson, R. Choudhary, M.R. Dasari, and D.A. Lightfoot. 2016. Ultrasound assisted extraction of phenolic compounds from peaches and pumpkins. PloS One 11(2):e0148758.
- Bag, S., P. Srivastav, and H. Mishra. 2009. Desorption and adsorption characteristics of bael (Aegle marmelos) pulp and powder. Int. Food Res. J. 16:561–569.
- Bhattacherjee, A., A. Dikshit, D. Pandey, and D. Tandon. 2015. High performance liquid chromatographic determination of marmelosin and psoralen in bael (Aegle marmelos (L.) Correa) fruit. J. Food Sci. Technol. 52(1):597–600. doi: 10.1007/s13197-013-1015-x.
- Chegini, G., J. Khazaei, B. Ghobadian, and A. Goudarzi. 2008. Prediction of process and product parameters in an orange juice spray dryer using artificial neural networks. J. Food. Eng. 84(4):534–543. doi: 10.1016/j.jfoodeng.2007.06.007.
- Chen, M.-J., K.-N. Chen, and C.-W. Lin. 2005. Optimization on response surface models for the optimal manufacturing conditions of dairy tofu. J. Food. Eng. 68(4):471–480. doi: 10.1016/j.jfoodeng.2004.06.028.
- Coit, D.W., B.T. Jackson, and A.E. Smith. 1998. Static neural network process models: Considerations and case studies. Int. J. Prod. Res. 36(11):2953–2967.
- Erbay, Z., and F. Icier. 2009. Optimization of hot air drying of olive leaves using response surface methodology. J. Food. Eng. 91(4):533–541. doi: 10.1016/j.jfoodeng.2008.10.004.
- Ghosh, P., R.C. Pradhan, and S. Mishra. 2016. Optimization of process parameters for enhanced production of Jamun juice using Pectinase (Aspergillus aculeatus) enzyme and its characterization. 3 Biotech. 6(2):241.
- Goldberg, D. 1989. Genetic algorithms in search. Optimization and machine learning. Addism1—Wesley, Reading, MA.
- Gurung, N., S. Ray, S. Bose, and V. Rai. 2013. A broader view: Microbial enzymes and their relevance in industries, medicine, and beyond. Biomed. Res. Int. 2013.
- Hornik, K. 1993. Some new results on neural network approximation. Neural Networks 6(8):1069–1072. doi: 10.1016/S0893-6080(09)80018-X.
- Hornik, K., M. Stinchcombe, and H. White. 1989. Multilayer feedforward networks are universal approximators. Neural Networks 2(5):359–366. doi: 10.1016/0893-6080(89)90020-8.
- Hugget, A., P. Sebastian, and J.P. Nadeau. 1999. Global optimization of a dryer by using neural networks and genetic algorithms. AIChE J. 45(6):1227–1238. doi: 10.1002/aic.690450609.
- Ioana, V.S., L. Marieta, and L. Vasile. 2015. The effect of enzymatic treatment on bioactive compounds and antioxidant capacity of pasteurized apple juice. Analele Univ. Oradea 25:127–132.
- Jindal, M., V. Kumar, V. Rana, and A. Tiwary. 2013. Aegle marmelos fruit pectin for food and pharmaceuticals: Physico-chemical, rheological and functional performance. Carbohydr. Polym. 93(2):386–394. doi: 10.1016/j.carbpol.2012.12.012.
- Joglekar, A.M., A.T. May, E. Graf, and I. Saguy. 1987. Product excellence through experimental design. Food product and development: From concept to the marketplace 211.
- Kittur, F.S., A.B.V. Kumar, and R.N. Tharanathan. 2003. Low molecular weight chitosans—preparation by depolymerization with Aspergillus niger pectinase, and characterization. Carbohydr. Polym. 338(12):1283–1290. doi: 10.1016/S0008-6215(03)00175-7.
- Mohanty, S., S. Mishra, and R.C. Pradhan. 2018. Optimisation of enzymatic extraction and characterization of palm (Borassus flabellifer) juice. J. Food Meas. Charact. 12(4):2644–2656. doi: 10.1007/s11694-018-9882-5.
- Nadulski, R., Z. Kobus, K. Wilczyński, K. Zawiślak, J. Grochowicz, and T. Guz. 2016. Application of freezing and thawing in apple (Malus domestica) juice extraction. J. Food Sci. 81(11):E2718–E2725. doi: 10.1111/1750-3841.13514.
- Nandi, S., P. Mukherjee, S. Tambe, R. Kumar, and B. Kulkarni. 2002. Reaction modeling and optimization using neural networks and genetic algorithms: Case study involving TS-1-catalyzed hydroxylation of benzene. Ind. Eng. Chem. Res. 41(9):2159–2169. doi: 10.1021/ie010414g.
- Oyeleke, F., and A. Olaniyan. 2007. Extraction of juice from some tropical fruits using a small scale multi-fruit juice extractor, p. 1803–1808. In: Book extraction of juice from some tropical fruits using a small scale multi-fruit juice extractor. African Crop Science Society, El-Minia, Egypt.
- Panda, S., U. Sahu, S. Behera, and R. Ray. 2014. Bio-processing of bael (Aegle marmelos L.) fruits into wine with antioxidants. Food Biosci. 5:34–41.
- Paul, R., and U. Ghosh. 2012. Effect of thermal treatment on ascorbic acid content of pomegranate juice. Indian J. Biotechnol. 11:309–312.
- Pradhan, D., S. Abdullah, and R.C. Pradhan. 2020. Optimization of pectinase assisted extraction of Chironji (Buchanania Lanzan) fruit juice using response surface methodology and artificial neural network. Int. J. Fruit Sci. 1–19. https://doi.org/10.1080/15538362.2020.1734895
- Rai, P., G. Majumdar, S. DasGupta, and S. De. 2005. Prediction of the viscosity of clarified fruit juice using artificial neural network: A combined effect of concentration and temperature. J. Food. Eng. 68(4):527–533.
- Razmi-Rad, E., B. Ghanbarzadeh, S. Mousavi, Z. Emam-Djomeh, and J. Khazaei. 2007. Prediction of rheological properties of Iranian bread dough from chemical composition of wheat flour by using artificial neural networks. J. Food. Eng. 81(4):728–734.
- Rekha, C., G. Poornima, M. Manasa, V. Abhipsa, J.P. Devi, V. Kumar, and T.R.P. Kekuda. 2012. Ascorbic acid, total phenol content and antioxidant activity of fresh juices of four ripe and unripe citrus fruits. Chem. Sci. Trans. 1(2):303–310.
- Ripley, B.D., and N. Hjort. 1996. Pattern recognition and neural networks. Cambridge, United Kingdom: Cambridge university press.
- Roy, S.K., and R. Singh. 1979. Bael fruit (Aegle marmelos)-a potential fruit for processing. Econ. Bot. 33(2):203–212.
- Shen, C., L. Wang, and Q. Li. 2007. Optimization of injection molding process parameters using combination of artificial neural network and genetic algorithm method. J. Mater. Process. Tech. 183(2–3):412–418.
- Shrestha, G. 2000. Processing of wild Bael fruit for rural employment and income generation. ITDG Food Chain. p. 27.
- Sin, H., S. Yusof, N.S.A. Hamid, and R.A. Rahman. 2006. Optimization of enzymatic clarification of sapodilla juice using response surface methodology. J. Food. Eng. 73(4):313–319.
- Singh, A., H. Sharma, P. Kaushal, and A. Upadhyay. 2014. Bael (Aegle marmelos Correa) products processing: A review. Afr. J. Food Sci. 8(5):204–215.
- Singleton, V.L., R. Orthofer, and R.M. Lamuela-Raventós. 1999. Analysis of total phenols and other oxidation substrates and antioxidants by means of folin-ciocalteu reagent. Methods in enzymology. Elsevier. p. 152–178.
- Sivanandam, S., and S. Deepa. 2008. Genetic algorithms, p. 15–37. In: Introduction to genetic algorithms. Berlin, Heidelberg: Springer.
- Sonawane, A., S.S. Pathak, and R.C. Pradhan. 2020. Physical, thermal, and mechanical properties of bael fruit. J. Food Proces. Eng. 43(6): e13393.
- Srinivas, M., and L.M. Patnaik. 1994. Adaptive probabilities of crossover and mutation in genetic algorithms. IEEE Trans Syst Man Cybern 24(4):656–667.
- Surajbhan, S., A. Singh, C. Joshi, and L. Rodrigues. 2012. Extraction and optimization of guava juice by using response surface methodology. Am. J. Food Technol. 7:326–339.
- Vivek, K., S. Mishra, and R.C. Pradhan. 2019. Optimization of ultrasound‐assisted enzymatic extraction of Sohiong (Prunus nepalensis) juice. J. Food Proces. Eng. 42(1):e12948.
- Xi, J., Y. Xue, Y. Xu, and Y. Shen. 2013. Artificial neural network modeling and optimization of ultrahigh pressure extraction of green tea polyphenols. Food Chem. 141(1):320–326.
- Yang, B., X. Liu, and Y. Gao. 2009. Extraction optimization of bioactive compounds (crocin, geniposide and total phenolic compounds) from Gardenia (Gardenia jasminoides Ellis) fruits with response surface methodology. Innov. Food Sci. Emerg. Technol. 10(4):610–615.
- Youssefi, S., Z. Emam-Djomeh, and S. Mousavi. 2009. Comparison of artificial neural network (ANN) and response surface methodology (RSM) in the prediction of quality parameters of spray-dried pomegranate juice. Dry. Technol. 27(7–8):910–917.
- Zbiciński, I., W. Kamiński, K. Ciesielski, and Ł.P. Strumił. 1997. Dynamic and hybrid neural model of thermal drying in a fluidized bed. Dry. Technol. 15(6–8):1743–1752.