
 ?Mathematical formulae have been encoded as MathML and are displayed in this HTML version using MathJax in order to improve their display. Uncheck the box to turn MathJax off. This feature requires Javascript. Click on a formula to zoom.
ABSTRACT
Kendu (Diospyros melanoxylon Roxb.) is an underutilized nutritious fruit found in most of the Asian countries. The proper design and development of a grading system would help in improving the utilization of the fruit. Mass-based grading is more economical than the size-based grading of fruits. The present study determines the best-suited models for predicting the Kendu mass using various physical attributes. The physical attributes like linear dimensions, diameters, areas, volumes, aspect ratio, sphericity, and frictional properties of Kendu fruit were measured. The true volume, surface area, and porosity of the fruit were 21,840 mm3, 3522.77 mm2, and 54.72%, respectively. The fruit was spherical with a sphericity value of 1. Four different models viz. linear, quadratic, power, and s-curve were used to correlate the mass of fruit with its physical attributes. The quadratic and linear models were found to be the best models for predicting the mass of Kendu using different physical attributes. The best fit of the model was selected according to the high coefficient of determination (R2) values. The results obtained from this work would contribute to the scientific knowledge base for designing grading, sorting, and processing equipment.
Introduction
Kendu (Diospyros melanoxylon Roxb.) fruit is native to India and Sri Lanka. The fruit is also found in other Asian countries like Japan, China, Pakistan, Thailand, and Philippines. It belongs to the Ebenaceae family under genus Diospyros. Kendu is harvested in summer during May to June every year. The fruit is spherical with a hardcover, fibrous pulp, and three to four oblong brown color seeds. The ripe fruit has a pleasing taste with a gritty texture. The fruit has high nutritive values and is a rich source of phenols and antioxidants (Gupta et al., Citation2013; Hmar et al., Citation2017b). The Tribal communities rely on Kendu fruit and leaves for their livelihood. The leaves are used for commercial production of Bidi and vermicompost (Kadam and Pathade, Citation2014; Rathore, Citation1972). The fruits are widely used for the preparation of anti-inflammatory and antipyretic drug in traditional medicines (Maridass et al., Citation2008). Despite all the nutritional and health benefits, the Kendu fruit remains unutilized due to lack of proper postharvest processing techniques and equipment. Physical and chemical characteristics of the fruit play an important role in while designing and developing postharvest processing techniques and equipment. (Khoshnam et al., Citation2007; Lorestani and Tabatabaeefar, Citation2006; Shahbazi and Rahmati, Citation2013b; Tabatabaeefar and Rajabipour, Citation2005). The knowledge of physicochemical properties also improves the postharvest management of the fruit. Fruit mass, length, width, thickness, volume, and projected areas are important in sizing systems used for grading and sorting. Fruits with similar weight and uniform shape have high consumer acceptability in the market. The development of a proper grading system is essential for achieving the homogeneous dimensions and mass of the fruits. Size-based grading for classifying the fruits is the widely followed commercial grading technique. Some indirect methods, like the computer vision system, have also been proposed for grading the fruits based on size (Gürbüz et al., Citation2018; Phate et al., Citation2020). All these methods involve high initial capital investment and maintenance costs. The grading system could be improved efficiently by constructing the relation between fruit physical properties and mass by mass modeling (Vivek et al., Citation2018). Various authors have reported the advantage of mass-based grading of apricot, apple, kiwi, orange, pomelo, pomegranate, Sohiong, tangerine, and kinnow (Al-Maiman and Ahmad, Citation2002; Khanali et al., Citation2007; Lorestani and Tabatabaeefar, Citation2006; Mahawar et al., Citation2019; Naderi-Boldaji et al., Citation2008; Salihah et al., Citation2015; Tabatabaeefar and Rajabipour, Citation2005; Tabatabaeefar et al., Citation2000; Vivek et al., Citation2018). Mass grading is more economical than the size grading and also reduces packaging and handling costs. The determination of fruit mass based on easily measurable geometrical properties could decrease the grading time and avoid excessive workloads and labor costs in the industries (Demir et al., Citation2020). Therefore, the present work aims to determine various physical parameters of Kendu and establish a valid correlation between the physical properties and the fruit mass. The validated regression models like quadratic, s-curve, power, and linear were used to predict the mass of the fruit. The results of the present work would boost the livelihood of rural people and generate income.
Materials and Methods
Sample Collection
Fresh Kendu fruits without bruises were procured from the local tribal market in Rourkela (22.2604° N, 84.8536° E), Odisha, India. Fruits were then immediately transported to the food processing laboratory in the National Institute of Technology Rourkela, Odisha, India. The fruits were thoroughly cleaned with 0.5 ppm sodium hypochlorite solution (McGlynn, Citation2004). The initial moisture content of the fruits was determined using a hot air oven method at 105°C ± 1°C for 24 hours (Pathak et al., Citation2019; Suthar and Das, Citation1996). Good quality uniform sized fruits without cuts and bruises were selected for the measurement of all the physical properties.
Valuation of Mass and Principal Dimensions
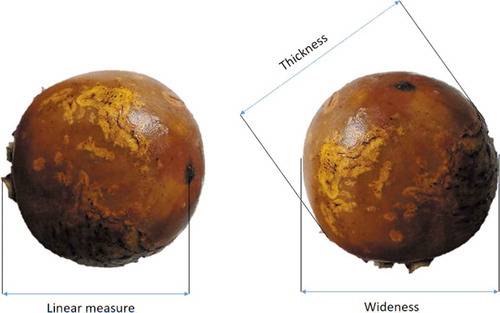
Randomly selected 100 fruits from a lot were used for the experiment. A digital electronic balance (Wensar, HPB501, India) with a precision of 0.001 g was used for measuring the mass (M) of the Kendu fruit (Pliestic et al., Citation2006). The distance from hilum end to the tip end of fruit measured as x-axis known as length (L); the width (W) of the fruit was measured as the y-axis from the right angle to the x-axis in the suture plane; the thickness (T) of Kendu was measured along the z-axis that forms a right angle with the suture plane (Altuntas and Özkan, Citation2008). A digital Vernier caliper (Mitutoyo, 500–196-30, Japan) was used to measure the dimensions such as length, width, and thickness of the fruit. The principal dimensions of the Kendu fruit are shown in .
Figure 1. Principal dimensions of the Kendu fruit
Determination of Physical Parameters
The dimensional parameters of the whole fruit viz. equivalent mean diameter (de), geometric mean diameter (dg), and arithmetic mean diameter (da) were calculated using the following standard equations (Mohsenin, Citation1986; Pathak et al., Citation2019; Vivek et al., Citation2018).
where de stands for equivalent mean diameter; L stands for length (mm), W stands for width (mm), and T stands for the thickness (mm) of fruit.
where dg stands for geometric mean diameter
where da stands for arithmetic mean diameter
The shape of the fruit was determined by calculating the sphericity and aspect ratio of the fruit (Pradhan et al., Citation2012). Flakiness ratio (FR), the ratio of thickness to the wideness of fruit, was calculated by following the standard equation (Mansouri et al., Citation2017).
where Ø represents sphericity
where AR is the aspect ratio
where, FR is the flakiness ratio
The projected area perpendicular to length (L), thickness (T), width (W) of the fruit, respectively, and criteria projected area (CPA) for the whole fruit was calculated by following the standard equations (Rafiee et al., Citation2007; Vivek et al., Citation2018).
where PL represents the projected area perpendicular to the length of fruit (mm2)
where PT represents the projected area perpendicular to the thickness of fruit (mm2)
where PW represents, projected area perpendicular to the width of fruit (mm2)
where CPA stands for criteria projected area (mm2)
The surface area of the Kendu fruit was calculated by referring to the expression (R. Pradhan et al., Citation2009; Sharma et al., Citation2017).
where SA is the surface area (mm2) of fruit
The true volume (VT) of Kendu fruit was computed by using the toluene displacement method (Garnayak et al., Citation2008).
The volume of Kendu fruit was also computed as a measure of a prolate spheroid, oblate spheroid, and ellipsoid volume by referring the following equation (Shahbazi and Rahmati, Citation2013a):
where Vpro is the prolate spheroid volume (mm3) of fruit
where Vobl is the oblate spheroid volume (mm3) of fruit
where Vellip is the ellipsoid volume (mm3) of fruit
Determination of Gravimetric Properties
The standard bulk density of the fruit sample was measured using a cardboard box with dimension (137 × 130 × 49) mm3 using the following equation.
where ρB represents the bulk density of fruit (g/cm3)
The true density of the fruit was computed using the toluene displacement method. It is the ratio of a unit mass of each fruit to its true volume (Razavi et al., Citation2010).
where ρT is the true density of fruit (g/cm3)
The void fraction or porosity of fruit is defined as the ratio of inter-granular voids to the total space occupied by the fruit (Jain and Bal, Citation1997; Razavi et al., Citation2010). In terms of percentage, its upper limit is a hundred, and the lower limit is zero.
where ε represents porosity in percentage
Determination of Frictional Property
The static coefficient of friction for the fruit sample was determined using a friction apparatus. Four different materials viz. plywood, galvanized iron sheet (GI), mild steel sheet, and Aluminum sheet were considered for the study. The measurements were made by considering both the radial and axial direction to the calyx end of the fruit. The fruit was placed on top of the different sheets, and the inclination angle was increased gradually until the fruit freely rolls and falls. The static coefficient of friction for the fruits are then calculated taking the angle of inclination as the angle of friction as follows (Akbolat et al., Citation2008; Mansouri et al., Citation2017):
where µ represents the static coefficient of friction and α stands for the angle of friction (ᵒ)
Mass Modeling of Kendu Fruit
A suitable model can be developed to predict the mass of the fruit by developing a correlation between mass and different physical properties. These physical properties are broadly categorized into dimensional properties, area, and volume.
Relationship of mass with different dimensional characteristics viz. length, width, and thickness of fruit as well as equivalent mean diameter (de), geometric mean diameter (dg), and arithmetic mean diameter (da).
Relationship of mass with its surface area, criteria projected area, and projected area perpendicular to the length (PL), width (PW), and thickness (PT) of fruit, respectively.
Relationship of mass with its ellipsoid volume (Vellip), prolate spheroid volume (Vpro), and oblate spheroid volume (Vobl) (Naderi-Boldaji et al., Citation2008; Shahbazi and Rahmati, Citation2013a).
The most appropriate model for prediction of mass was based on fitting four different regression models, namely linear, quadratic, power, and s-curve with the measured physical properties (Khodabakhshian and Emadi, Citation2016).
where M denotes the predicted mass of fruit, denotes independent variable (dimensional properties, projected areas, volume, etc.,) and B0, B1, B2 are model constants known as curve fitting parameters in the differential equations.
Statistical Analysis and Model Validation
The coefficient of determination (R2) and the standard error of the estimates (SEE) were selected as the criteria to evaluate the suitability of the regression models. The models with the R2 value close to unity and the lowest SEE values were selected as appropriate models. The derived mass models for dimensions, areas, and volume were validated by taking 50 random samples of the Kendu fruits. Data analysis, analysis of variance test (ANOVA), regression analysis, and predicting the adequacy of the model were performed using SPSS (version 22.0) (Pradhan et al., Citation2009; Vivek et al., Citation2018).
Results and Observations
Physical Parameters of Kendu
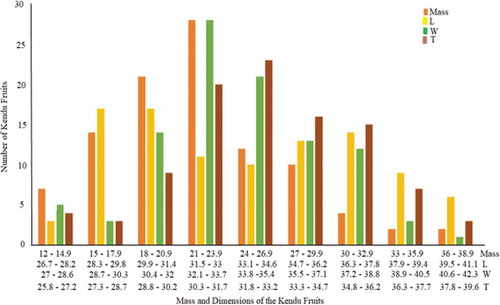
All the physical parameters of Kendu fruit were measured at a moisture content of 61.23 ± 1.39% (dry basis) (). The results were then compared with the similar varieties of fruits like persimmon and plums to get an idea of how small or big the fruit size. The average primary dimensions of the Kendu fruit, such as length, width, and thickness were 33.62, 33.96, and 32.70 mm, respectively. The dimensions of Kendu are very close to the dimension of Stanley cultivar of plums but lower than the values for persimmon and Frenze 90 plums cultivar (Ertekin et al., Citation2006). A clear depiction of the distribution of mass, length, width, and thickness of Kendu fruit is shown in .
Table 1. Physical parameters of Kendu fruit
Figure 2. Bar chart for distribution of mass, length, width, and thickness of Kendu fruit
The average diameters of Kendu would be useful to obtain the projected area of fruit. These properties are also useful in evaluating the aperture size of the equipment used for the sorting of fruits (Vivek et al., Citation2018). The average equivalent mean diameter (de), average geometric mean diameter (dg), and average arithmetic mean diameter (da) of the Kendu were 33.39, 33.39, and 33.43 mm, respectively. The geometric mean diameters of persimmon and different cultivars of plums and apple are higher compared to Kendu fruit (Celik and Ercisli, Citation2008; Ertekin et al., Citation2006; Kheiralipour et al., Citation2008).
Different areas like surface area, projected area perpendicular to the length (PL), width (PW), and thickness (PT), were also calculated for Kendu fruit. Measurement of these areas helps to indicate the permeability of gases, water loss, respiration rate, and ripening index. Fruits of the same variety with a larger surface area have higher respiration rates than smaller ones (Vivek et al., Citation2018). The average surface area of the Kendu fruit was 3522.77 mm2 which was lower than the persimmon fruit and plum cultivars (Celik and Ercisli, Citation2008; Ertekin et al., Citation2006). The projected area values perpendicular to the length, width, and thickness were 900.39, 911.62, and 877.61 mm2, respectively. The projected areas of Kendu were less compared to persimmon cv. Hachiya variety (Celik and Ercisli, Citation2008).
The volume of the fruit plays an important role in calculating the densities during the postharvest and storage period. Also, it helps in horticultural crop processing and in monitoring the rate of heat transfer during the period of drying and cooling. Four different volumes were calculated viz. true volume (VT), ellipsoid volume (Vellip), oblate spheroid volume (Vobl), and prolate spheroid volume (Vprl) for Kendu. The values for these volumes were 21840.00, 19856.40, 20626.51, and 20512.75 mm3, respectively. For designing of the silos, quality evaluation of products, and separation of the desired material from undesired materials, densities of the fruit are of prime importance (Pradhan et al., Citation2008). True density and bulk density of fruit is useful for grading of fruits with the aerodynamic process of separation and for hydrodynamic means of transportation. The average true density and bulk density of Kendu fruits were 1.06 and 0.48 g/cm3, respectively. The true density of Kendu fruit was found higher compared to Redspar and Delbarstival cultivars of apple (Kheiralipour et al., Citation2008) and Stanley and Frenze 90 cultivars of plums (Ertekin et al., Citation2006). While the bulk density of both the plum cultivars is higher than the Kendu fruit (Ertekin et al., Citation2006).
The porosity values signify the portion of fruit occupied with inter-granular spaces and useful in studying the heat and airflow characteristics. Fruits with higher porosity are more prone to lose their internal temperature as compared to fruits with lower porosity percentage (Rao, Citation2015; Vivek et al., Citation2018). The porosity of Kendu was found to be 54.72%. This value is higher than the porosity for Diospyros kaki thumb (Celik and Ercisli, Citation2008) and Stanley and Frenze 90 cultivar of plums (Ertekin et al., Citation2006). Therefore, kendu fruit could lose its internal temperature rapidly compared to plums.
The values of aspect ratio and sphericity of fruits help determine the fruit shape and flowability characteristics. The value of aspect ratio for Kendu was 1.02 ± 0.01, and that of sphericity was 0.99 ± 0.006. This value of sphericity signifies that the shape of Kendu completely resembles a sphere. This means the fruit will show a greater tendency to roll on any specified surface rather than sliding down, and it is one of the important parameters for designing hoppers (Patel et al., Citation2011). The sphericity and aspect ratio of Kendu is higher than that of plum cultivars (Ertekin et al., Citation2006) but possesses a lower value when compared with persimmon (Celik and Ercisli, Citation2008) and Redspar and Delbarstival cultivars of apple (Kheiralipour et al., Citation2008). The flakiness ratio and skin thickness for the fruit were 0.99 and 0.33, respectively. The skin thickness was less than the persimmon cv. Hachiya variety (Celik and Ercisli, Citation2008). The knowledge on skin thickness of fruit helps in the study of optical transmission characteristics in fruit tissues (Shi et al., Citation2015).
Frictional Properties of Kendu
The static coefficient of friction value for Kendu fruit was found highest for mild steel sheet and lowest in case of galvanized iron sheet both in axial as well as radial direction for four different materials. In every case, the coefficient of friction value in the axial direction was found greater as compared to the radial direction. The values obtained for the mild steel sheet were 0.324 in the axial direction and 0.218 in the radial direction and for GI sheet 0.266 in the axial direction and 0.185 in the radial direction, respectively. A similar trend was reported by Hmar et al. (Citation2017b) for Kendu fruit. The understanding of the coefficient of friction is a key factor in designing storage bins, pneumatic conveyors, screw conveyors, and hopper of the machine. The angle of friction followed the same trend as that of the coefficient of friction, which is used for designing of conveyor belt that will facilitate the free flow of product, and for determining the angle of inclination of the conveyor and chute (Vivek et al., Citation2018).
Mass Modeling of Kendu
The best regression models with an accurate correlation between the mass and other properties of the fruit were developed. For this purpose, the mass was taken as a dependent parameter in every case, dimensions viz. L, W, T; diameters of the fruit viz. de, dg, da; various projected areas and surface area viz. PL, PW, PT, CPA, SA; and different volumes viz. Vellip, Vobl, Vprl were chosen as independent parameters. Among four different models used for mass modeling, the one with a higher value of R2 and lowest SEE was selected as the best model and are enlisted in .
Table 2. Best fitted models for mass prediction of Kendu fruit
Modeling Based on Fruit Dimensions
The result of mass modeling based on fruit dimensions revealed that, among length, width and thickness, the thickness showed the quadratic model had the highest R2 and lowest SEE values of 0.917 and 0.154, respectively (). Tabatabaeefar and Rajabipour (Citation2005) recommended an equation to determine the mass of apple based on intermediate diameter (width). Shahbazi and Rahmati (Citation2014) and Tabatabaeefar et al. (Citation2000) also reported similar kinds of models for persimmon and orange fruit with length and width as determining physical parameters for predicting mass. The mass of Kendu could be easily predicted from equivalent mean diameter, geometric mean diameter, and arithmetic mean diameter. Since these three diameters fit well to the quadratic model with the same R2 and SEE values of 0.955 and 0.113, respectively. The regression equations for prediction of mass of Kendu fruit based on its physical dimensions and different diameters are given below;
Best fit dimensional parameter ─ Thickness (T)
Best fit diameter ─ Arithmetic mean diameter (da)
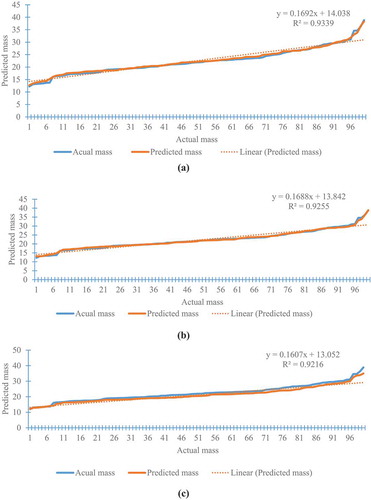
The relation between actual and predicted mass obtained from the proposed model based on the fruit dimension was shown in .
Figure 3. Actual mass vs predicted mass based on the proposed model for (a) dimension, (b) area, and (c) volume
Modeling Based on Areas
The results of mass modeling of Kendu fruit based on the projected areas showed that the quadratic model based on criteria projected area (CPA) showed the highest R2 and lowest SEE values of 0.975 and 0.085, respectively. However, for the calculation of criteria projected area, all the three projected areas viz. perpendicular to the length, width, and thickness are essential. This increases the cost of grading and sorting operation and also affects the processing speed. So, an individual projected area must be chosen to overcome these difficulties. Among the three projected areas, the quadratic model for the projected area perpendicular to the thickness (PT) of fruit was preferred over other models with an R2 value of 0.933 and SEE value of 0.138. The mass prediction of Kendu fruit using surface area yields a better R2 value (R2 = 0.955) than the projected area perpendicular to the thickness of fruit. However, the measurement of all the three principal dimensions is required to obtain the surface area of fruit. This, in turn, adds more cost and increases the complexity of the grading mechanism. Therefore, it is recommended to develop a mass model for Kendu fruit based on its projected area perpendicular to thickness. The regression equations for mass modeling of Kendu based on areas are as follows;
Best fit projected areas ─ PT, surface area (SA) and CPA
The relation between actual and predicted mass obtained from the proposed model based on the fruit area was shown in . Shahbazi and Rahmati (Citation2013b, Citation2014) also suggested similar quadratic models for mass prediction of sweet cherry and persimmon based on projected areas perpendicular to the length of fruit. The best fit models in mass modeling of different fruits were shown in .
Table 3. Mass modeling of different fruits and proposed models
Modeling Based on Volumes of Fruit
The modeling of Kendu mass based on true volume was a time-intensive process; hence, ellipsoid (Vellip), prolate (Vpro), and oblate (Vobl) volumes were taken into consideration for mass prediction. Then, the most appropriate model was chosen among Vellip, Vpro, and Vobl of the Kendu fruit. Among these volumes, ellipsoid volume showed a better fit for both linear as well as quadratic models. The R2 value for both the models obtained was 0.955. Similar results were reported by Shahbazi and Rahmati (Citation2014) on persimmon fruit. The best fit models and respective regression equations for Kendu are shown as follows:
Best fit volume ─ Ellipsoid volume (Vellip)
The relation between actual and predicted mass obtained from the proposed model based on fruit volume was shown in . All the best fit models were cross-verified and validated using another set of samples to identify the predictive nature of the selected model. All the models showed a non-significant difference when physical parameters were predicted using the mass from the obtained equations.
Conclusion
The present work comprises determining various physical properties of Kendu and correlating the fruit mass with physical properties. The fruit mass varied from 12.226 g to 38.853 g. The average length, width, and thickness of the fruit were 33.62 ± 3.64 mm, 33.96 ± 2.90 mm, and 32.70 ± 2.72 mm, respectively. The sphericity and aspect ratio of Kendu were 0.99 ± 0.006 and 1.02 ± 0.01, respectively, suggesting spherical shape of the fruit. The static coefficient of friction was highest for mild steel sheet and lowest in case of a galvanized iron sheet for both radial and axial directions. Moreover, the dependency of the mass of the fruit on measured physical properties was well established by regression equations. The quadratic model was more efficient among other models in correlating the fruit mass. The properties viz. thickness of the fruit, arithmetic mean diameter, projected area perpendicular to the thickness, and ellipsoid volume of the fruit were more relevant to co-relate the mass with the highest R2 values, i.e., 0.917, 0.955, 0.933 and 0.955, respectively. The results obtained from the study can be used to design, develop, and fabricate different grading and sorting equipment for commercial processing. The storage and handling of the fruits would be more reliable, precise, and convenient, thus saving operation time, money, and labor.
Literature Cited
- Akbolat, D., C. Ertekin, H. Menges, K. Ekinci, and I. Erdal. 2008. Physical and nutritional properties of jujube (Zizyphus jujuba Mill.) growing in Turkey. Asian J. Chem. 20(1):757.
- Al-Maiman, S.A., and D. Ahmad. 2002. Changes in physical and chemical properties during pomegranate (Punica granatum L.) fruit maturation. Food Chem. 76(4):437–441. doi: 10.1016/S0308-8146(01)00301-6.
- Altuntas, E., and Y. Özkan. 2008. Physical and mechanical properties of some walnut (Juglans regia L.) cultivars. Int. J. Food Eng. 4(4). doi: 10.2202/1556-3758.1349.
- Celik, A., and S. Ercisli. 2008. Persimmon cv. Hachiya (Diospyros kaki Thunb.) fruit: Some physical, chemical and nutritional properties. Int. J. Food Sci. Nutr. 59(7–8):599–606. doi: 10.1080/09637480701538221.
- Demir, B., İ. Eski, F. Gürbüz, Z.A. Kuş, Y. Sesli, and S. Ercişli. 2020. Prediction of walnut mass based on physical attributes by Artificial Neural Network (ANN). Erwerbs-Obstbau 62(1):47–56. doi: 10.1007/s10341-019-00468-8.
- Ertekin, C., S. Gozlekci, O. Kabas, S. Sonmez, and I. Akinci. 2006. Some physical, pomological and nutritional properties of two plum (Prunus domestica L.) cultivars. J. Food Eng. 75(4):508–514. doi: 10.1016/j.jfoodeng.2005.04.034.
- Garnayak, D., R. Pradhan, S. Naik, and N. Bhatnagar. 2008. Moisture-dependent physical properties of jatropha seed (Jatropha curcas L.). Ind. Crops Prod. 27(1):123–129. doi: 10.1016/j.indcrop.2007.09.001.
- Gupta, V., V. Maithili, and P.K. Vishwakarma. 2013. Comparative study of analgesic activity of diospyros melanoxylon (Roxb.) bark and root bark. J. Nat. Remedies 13(1):2013. January.
- Gürbüz, F., B. Demi̇r, E.S.K.İ. İkbal, Z.A. Kuş, K.U. Yilmaz, E. İlikçioğlu, and S. Ercişli. 2018. Estimation of the weights of almond nuts based on physical properties through data mining. Not. Bot. Horti. Agrobot. Cluj. Napoca. 46(2):579–584. doi: 10.15835/nbha46210631.
- Hmar, B.Z., S. Mishra, and R.C. Pradhan. 2017a. Physico-chemical and sensory analysis of Kendu (Diospyros melaxoxylon Roxb.) jam using fuzzy logic. J. Food Meas. Charact. 11(4):1928–1935. doi: 10.1007/s11694-017-9575-5.
- Hmar, B.Z., S. Mishra, and R.C. Pradhan. 2017b. Physico-chemical, mechanical and antioxidant properties of Kendu (Diospyros Melanoxylon Roxb.). Curr. Res. Nutr. Food Sci. 5(3):214–222. doi: 10.12944/CRNFSJ.5.3.05.
- Jain, R., and S. Bal. 1997. Properties of pearl millet. J. Agric. Eng. Res. 66(2):85–91. doi: 10.1006/jaer.1996.0119.
- Kadam, D., and G. Pathade. 2014. Effect of tendu (Diospyros melanoxylon RoxB.) leaf vermicompost on growth and yield of French bean (Phaseolus vulgaris L.). Int. J. Recycl. Org. Waste Agric. 3(1):44. doi: 10.1007/s40093-014-0044-4.
- Khanali, M., M. Ghasemi Varnamkhasti, A. Tabatabaeefar, and H. Mobli. 2007. Mass and volume modelling of tangerine (Citrus reticulate) fruit with some physical attributes. Int. Agrophys. 21(4):329–334.
- Kheiralipour, K., A. Tabatabaeefar, H. Mobli, S. Rafiee, M. Sharifi, A. Jafari, and A. Rajabipour. 2008. Some physical and hydrodynamic properties of two varieties of apple (Malus domestica Borkh L.). Int. Agrophys. 22(3):225–229.
- Khodabakhshian, R., and B. Emadi. 2016. Mass model of date fruit (cv. Mazafati) based on its physiological properties. Int. Food Res. J. 23(5):2057–2062.
- Khoshnam, F., A. Tabatabaeefar, M.G. Varnamkhasti, and A. Borghei. 2007. Mass modeling of pomegranate (Punica granatum L.) fruit with some physical characteristics. Sci. Hortic. 114(1):21–26. doi: 10.1016/j.scienta.2007.05.008.
- Lorestani, A.N., and A. Tabatabaeefar. 2006. Modelling the mass of kiwi fruit by geometrical attributes. Int. Agrophys. 20(2):135–139.
- Mahawar, M.K., B. Bibwe, K. Jalgaonkar, and B.M. Ghodki. 2019. Mass modeling of kinnow mandarin based on some physical attributes. J. Food Process. Eng. 42(5). doi: 10.1111/jfpe.13079.
- Mansouri, A., A.H. Mirzabe, and A. Ráufi. 2017. Physical properties and mathematical modeling of melon (Cucumis melo L.) seeds and kernels. J. Saudi Soc. Agric. Sci 16(3):218–226. doi: 10.1016/j.jssas.2015.07.001.
- Maridass, M., S. Ghanthikumar, and G. Raju. 2008. Preliminary phytochemical analysis of Diospyros species. Ethnobot. Leaflets 2008(1):868–872.
- McGlynn, W. 2004. Guidelines for the use of chlorine bleach as a sanitizer in food processing operations.
- Mohsenin, N.N. 1986. Physical properties of plant and animal materials.
- Naderi-Boldaji, M., R. Fattahi, M. Ghasemi-Varnamkhasti, A. Tabatabaeefar, and A. Jannatizadeh. 2008. Models for predicting the mass of apricot fruits by geometrical attributes (cv. Shams, Nakhjavan, and Jahangiri). Sci. Hortic. 118(4):293–298. doi: 10.1016/j.scienta.2008.06.025.
- Patel, M., R. Pradhan, and S. Naik. 2011. Physical properties of fresh mahua. Int. Agrophys. 25(3):303–306.
- Pathak, S.S., R.C. Pradhan, and S. Mishra. 2019. Physical characterization and mass modeling of dried Terminalia chebula fruit. J. Food Process. Eng. 42(3):e12992. doi: 10.1111/jfpe.12992.
- Phate, V.R., R. Malmathanraj, and P. Palanisamy. 2020. An indirect method to estimate sweet lime weight through machine learning algorithm. Paper presented at the 2020 Fourth International Conference on Computing Methodologies and Communication (ICCMC). Erode, India
- Pliestic, S., N. Dobricevic, D. Filipovic, and Z. Gospodaric. 2006. Physical properties of filbert nut and kernel. Biosyst. Eng. 93(2):173–178. doi: 10.1016/j.biosystemseng.2005.11.008.
- Pradhan, R., S. Naik, N. Bhatnagar, and S. Swain. 2008. Moisture-dependent physical properties of Karanja (Pongamia pinnata) kernel. Ind. Crops Prod. 28(2):155–161. doi: 10.1016/j.indcrop.2008.02.006.
- Pradhan, R., S. Naik, N. Bhatnagar, and V. Vijay. 2009. Moisture-dependent physical properties of jatropha fruit. Ind. Crops Prod. 29(2–3):341–347. doi: 10.1016/j.indcrop.2008.07.002.
- Pradhan, R.C., P.P. Said, and S. Singh. 2012. Physical properties of bottle gourd seeds. Agric. Eng. Int. 15(1):106–113.
- Rafiee, S., M. Keramat Jahromi, A. Jafari, M. Sharifi, R. Mirasheh, and H. Mobli. 2007. Determining some physical properties of bergamot (Citrus medica). Int. Agrophys. 21(3):293–297.
- Rao, C.G. 2015. Engineering for storage of fruits and vegetables: Cold storage, controlled atmosphere storage, modified atmosphere storage. Academic Press. ISBN: 0128033657.
- Rathore, J.S. 1972. Diospyros melanoxylon, a Bread-Winner Tree of India. Econ. Bot. 26(4):333–339. doi: 10.1007/BF02860703.
- Razavi, S.M., A. Pourfarzad, A.H. Sourky, and S.R. Jahromy. 2010. The physical properties of fig (Ficus carica L.) as a function of moisture content and variety. Philipp. Agric. Sci. 93(2):170–181.
- Salihah, B., R. Shamsudin, and A.A. Norashikin. 2015. Mass modeling of Malaysian varieties pomelo fruit (Citrus Grandis L. Osbeck) with some physical characteristics. Int. Food Res. J. 22:488–493.
- Shahbazi, F., and S. Rahmati. 2013a. Mass modeling of fig (Ficus carica L.) fruit with some physical characteristics. Food Sci. Nutr. 1(2):125–129. doi: 10.1002/fsn3.20.
- Shahbazi, F., and S. Rahmati. 2013b. Mass modeling of sweet cherry (Prunus avium L.) fruit with some physical characteristics. Food Sci. Nutr. 4(1):1–5. doi: 10.4236/fns.2013.41001.
- Shahbazi, F., and S. Rahmati. 2014. Mass modeling of persimmon fruit with some physical characteristics. Agric. Eng. Int. 16(1):289–293.
- Sharma, V., B. Sudipta, S. Lal 1, A. Anand, H. Firoz, and A. Munshi. 2017. Comparison of physical and physiological properties of specialty maize inbred lines. Chem. Sci. Rev. Lett. 6(23):1758–1763.
- Shi, S., Z. Tan, J. Xie, and J. Lu. 2015. The effects of skin thickness on optical transmission characteristics in fruits tissues. Guang Pu Xue Yu Guang Pu Fen Xi= Guang Pu 35(7):1817–1823.
- Suthar, S., and S. Das. 1996. Some physical properties of karingda [Citrullus lanatus (Thumb) Mansf] seeds. J. Agric. Eng. Res. 65(1):15–22. doi: 10.1006/jaer.1996.0075.
- Tabatabaeefar, A., and A. Rajabipour. 2005. Modeling the mass of apples by geometrical attributes. Sci. Hortic. 105(3):373–382. doi: 10.1016/j.scienta.2005.01.030.
- Tabatabaeefar, A., A. Vefagh-Nematolahee, and A. Rajabipour. 2000. Modeling of orange mass based on dimensions. J. Agric. Sci. Technol. 2(4):299–305.
- Vivek, K., S. Mishra, and R.C. Pradhan. 2018. Physicochemical characterization and mass modelling of Sohiong (Prunus nepalensis L.) fruit. J. Food Meas. Charact. 12(2):923–936. doi: 10.1007/s11694-017-9708-x.