
 ?Mathematical formulae have been encoded as MathML and are displayed in this HTML version using MathJax in order to improve their display. Uncheck the box to turn MathJax off. This feature requires Javascript. Click on a formula to zoom.
ABSTRACT
The aim of the present study was to construct agroclimatic zoning for the conilon coffee crop in the state of Bahia, Brazil, using fuzzy logic. Historical data series on rainfall, mean air temperature, and relative air humidity were used. Analyses were carried out considering the mean values of the accumulated variables for each month in the historical series. The data were subjected to geostatistical analysis to verify and quantify the existence of spatial dependence between the values of the studied variables. Subsequently, maps with representations of the monthly means of the variables were subjected to continual classification using fuzzy mapping to identify suitable areas and areas of climate favorability for the implantation of conilon coffee in the state of Bahia. Bahia presents great spatial variability in regard to suitability for conilon coffee cultivation, with highly favorable areas, but no totally unsuitable region. The south and extreme south of Bahia were the regions with the lowest temporal-spatial variability for climate favorability for the development of conilon coffee trees, these being the most suitable regions for this crop. The zoning through fuzzy logic assisted in decision-making on which regions of the state had the highest suitability for crop implantation.
Introduction
Brazil is the world’s leading producer and exporter of coffee, making coffee one of the most valuable commodities in the Brazilian economy. Around 24% of total Brazilian coffee production comes from the Coffea canephora Pierre ex Frohner, variety Conilon, with an estimated production of 13.71 million bags in 2018 (CONAB, Citation2018).
In Brazil, conilon coffee is cultivated in many states, especially in regions of low altitude such as Espírito Santo, Minas Gerais, Rondônia, Bahia, Mato Grosso, and Rio de Janeiro. Conilon coffee cultivation in the extreme south of Bahia has expanded considerably, with a high degree of investment in highly technological plantations. One of the reasons for the expansion of coffee-growing in the region is the favorable climate with well-distributed rains all year round, enabling a mean yield of 64 bags. ha−1 (CONAB, Citation2018).
The suitability of areas for agricultural crops can be determined through agroclimatic zoning, which is constructed based on indicators of the physical environment of a given region. Zoning enables the definition of areas with similar climate patterns, to identify, independently of technological level and inputs, the most appropriate sub-regions for cultivation, where maximum agricultural efficiency can be expected (Pezzopane et al., Citation2010).
For arabica coffee, agroclimatic zoning work has already been carried out for several Brazilian states (Andrade et al., Citation2012; Nunes et al., Citation2007), whereas for Espírito Santo, Taques and Dadalto (Citation2007) present the agroclimatic zoning for conilon coffee. In this context, the probabilistic aspect began to be considered in zoning studies for coffee, quantifying the chances of adverse phenomena occurring in critical phases of the crop. In addition, computer programs based on climate favorability zoning have been studied to simulate agricultural scenarios for the Brazilian coffee crop, and this type of model is an efficient tool for assessing the environmental effects of new technologies and future climate change scenarios. (Camargo, Citation2010).
To consider the climate characteristics of the place in which it is intended to begin or expand production, one has to temporally describe the atmospheric phenomena in relation to the mean sequential values on a predetermined scale. In nature, phenomena are generally not represented by rigid or static limits, so it is necessary to find spatial analysis methodologies that produce new information on natural phenomena in a more complex manner. Due to the imprecise nature intrinsic to the classification of climate units, fuzzy logic serves as an alternative methodology for this process (Ferreira, Citation2012).
Fuzzy logic has been used in various areas of agricultural and environmental sciences (Cardoso et al., Citation2018; Carvalho et al., Citation2016; Ferreira, Citation2012; Lima and Silva, Citation2018; Lima et al., Citation2018) as it involves characterizing classes that do not possess, or cannot define, strict limits between one another. It is recommended to deal with abstractions and ambivalences in complex mathematical models, representing diffuse limits that are common in natural processes. When zoning agricultural capacity for the municipality of Santa Lúcia – SP, Adorno et al. (Citation2017) indicated that fuzzy logic is a powerful tool for dealing with ambiguities, enabling the attainment of more reliable and effective results for establishing potential areas for the development of agriculture.
Therefore, the aim of the present study was to construct agroclimatic zoning for the cultivation of conilon coffee in the state of Bahia using fuzzy logic.
Material and Methods
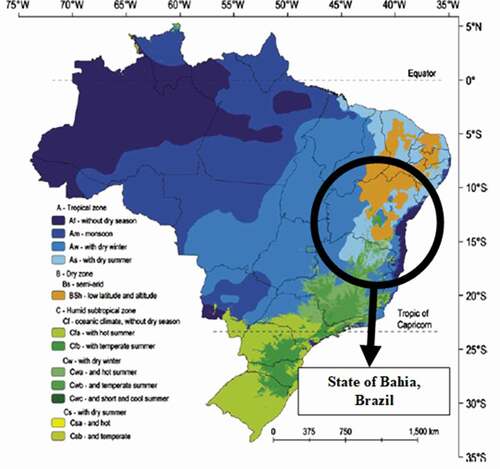
The state of Bahia is located in the northeast of Brazil and covers an area of 564,732.642 km2. The climate, according to the Köppen classification (Alvares et al., Citation2013) is Af, Aw, As, BSh, and Cfb namely humid tropical, tropical with a dry winter season, tropical with dry summer season, hot arid and humid subtropical with summer temperature, respectively (). Accumulated annual rainfall is in excess of 1,600 mm on the coast and 400 mm in the extreme north of the state, while mean annual air temperatures are high, with a maximum of over 30°C.
Figure 1. Climate classification for Brazil, according to the Koppen criteria, highlighting the state of Bahia
Climate variables of rainfall, mean air temperature, and relative air humidity were used to carry out the present study. For rainfall, 36 years of historical data series were used, from the period between 1975 and 2011. The data on mean air temperature and relative air humidity refer to the historical means in the period between 1961 and 2009, available in a grid with 10ʹ x 10ʹ cells of latitude and longitude (New et al., Citation2002). To complement the data series of these variables, daily data on mean monthly temperatures in a historical series from the National Meteorology Institute (INMET) were used. Furthermore, information obtained from 519 measuring points distributed throughout Bahia was also used, from stations of the National Waters Agency (ANA) and INMET and data from the Climate Research Unit (CRU).
Analyses were based on values of the accumulated variables for each month from the historical series. Monthly accumulated totals were divided by the number of years of observation, obtaining the monthly average values of rainfall, mean air temperature, and relative air humidity for each measuring point.
Subsequently, geostatistical analysis was carried out to verify the existence of and quantify the degree of spatial dependence between values of the studied variables, by adjusting theoretical functions to the models of experimental variograms, based on the assumption of the hypothesis of intrinsic stationarity, as per EquationEquation 1(1)
(1) (Matheron, Citation1963):
where N(h) is the number of pairs of values [Z (xi), Z (xi + h)] separated by an h-vector and xi is a spatial position of the variable Z, which corresponds to the monthly mean of the variable.
In the segment of adjustments of theoretical functions to the experimental variograms, several models were tested: linear with baseline, Gaussian, exponential, and spherical. The models were selected according to the least squares criterion, resulting in selection of models with the highest R2 (coefficient of determination) value, lowest SQR (squared sum of the residuals) and highest correlation coefficient of the cross-validation.
For the analysis of the spatial dependence index (SDI), the relationship between the nugget effect and the threshold, C0/(C0 + C), was used, with and the intervals proposed by Cambardella et al. (Citation1994), which consider strong (SDI < 25%); moderate (25% ≤ SDI < 75%) and weak (SDI ≥ 75%) spatial dependence. After proving spatial dependence, the ordinary kriging method of geostatistical interpolation was used to estimate values at unmeasured locations. This method has been widely used in studies on spatial distribution of climatic variables for data interpolation in non-sampled locations (Almeida et al. Citation2017).
Subsequently, the representations of the monthly means of the studied variables were subjected to continual classification using fuzzy mapping. The association function chosen for rainfall was linear, as described by Bönisch et al. (Citation2004). The exponential function presented by Meirelles et al. (Citation2007) was used for the values of temperature and relative air humidity.
- Rainfall data set
- Temperature and relative air humidity data set
where MFA = variable pertinence of the function Z; FI = inclination factor, considered equal to 0.05, according to Silva et al. (Citation2010); LS and LI = class limit values of two fuzzy sets belonging to set A; α = LS – LI. The fuzzy transition zone is given by the inclination of the straight lines to set A with increasing values (rainfall) and with exponential values (temperature and relative air humidity), as per .
Figure 2. Fuzzy sets adjusted to rainfall data – linear model (a), temperature – exponential model (b) and for relative air humidity – exponential model (c)
The class limit values of two fuzzy sets () were defined in function of the interval values considered optimal for the development and production of conilon coffee trees, as established by Nobrega et al. (Citation2008) and Silva et al. (Citation2015), respectively.
Table 1. Criteria for class limit determination of two fuzzy sets for rainfall
Table 2. Criteria for class limit determination of two fuzzy sets for temperature and relative air humidity
For this, values lower than the LI of each variable were assigned a value of 0 and values greater than the LS were assigned a value of 1. The intermediate values of the LS and LI were assigned values between 0 and 1, defining the pertinence values. Thus, months with an optimal set of pertinence with values close to or equal to 1 indicate greater climatic favorability, while values of pertinence close to 0 indicate less climatic favorability for the cultivation of conilon coffee.
The combined effect of the climate variables was measured using algebra map functions through a convex mean fuzzy operator, as per Silva et al. (Citation2010). Equal weight was attributed to all the representations, that is, it was considered that the variables contribute equally to the possibility of conilon coffee cultivation in the state of Bahia.
Results and Discussion
The geostatistical analyses for rainfall, temperature, and relative air humidity in the state of Bahia are presented in . For all the variables, the existence of spatial dependence can be observed in every analyzed month, justified by the variograms with well-defined thresholds (C0 + C). The adjustment of theoretical models to experimental models indicates that the hypothesis of intrinsic stationarity was fulfilled and that the variables do not present random distribution, with distribution dependent on the distance separating the samples (Silva et al., Citation2010).
Table 3. Models and parameters of the mean variograms adjusted to mean monthly rainfall, temperature, and relative air humidity in the state of Bahia
For rainfall, the theoretical models that best adjusted to the experimental variograms were the spherical (41.7%), exponential (41.7%), and Gaussian (16.6%). For temperature data, only the spherical (75%) and exponential (25%) models adjusted to the variograms, while for relative humidity, the spherical (50%), exponential (33%), and Gaussian (17%) models adjusted to the experimental variograms.
The spatial dependence index (SDI) for rainfall for almost every month in the historical series for the state of Bahia was considered strong (), with the exception of February, March, and April, in which spatial dependence was moderate, as per the classification described by Cambardella et al. (Citation1994). For the temperature and relative air humidity, all of the months presented strong spatial dependence, with the exception of July and August (temperature), which had moderate spatial dependence. The existence of spatial dependence is essential in geostatistics for the elaboration of maps for kriging with high levels of reliability (Vieira, Citation2000).
The range value (a) of the variograms for the rainfall variable varied from 85 km (September) to 1020 km (December). For temperature, the variation was from 269 km (July) to 1113 km (December), while for humidity, it was from 180 (December) to 880 (September). Evaluation of spatial variability through range values of spatial dependence revealed that rainfall presents greater spatial variability for most months when compared to the other analyzed variables. This difference is due to the greater discrepancy between the regions of the state, some of which have more uniformly distributed rainfall (close to the coast) or very low rainfall rates (semi-arid region of Bahia).
In general, for all the variables the highest range values are observed for spring-summer and the lowest range values are observed in autumn-winter, demonstrating the influence of seasons on the spatial behavior of these variables in the state of Bahia. Range is an important parameter of the variogram, enabling practical interpretations, since it indicates the distance between two points at which spatial dependence exists (Almeida et al. Citation2017).
Thematic maps of the fuzzy classification for mean monthly rainfall are presented in . The maps with the spatial distribution of the fuzzy classification were not constructed for the months of February, April, May, June, July, August, September, and October, in view of all the fuzzified values of the series being equal to one. For these months, rainfall values fit into the established optimal set for all rainfall points used in the study. Despite the maps not having been constructed, their values were considered in the algebraic operation for elaboration of the final product of climate favorability for the cultivation of conilon coffee in the state of Bahia.
Figure 3. Thematic maps of the fuzzy classification of mean monthly rainfall for the state of Bahia. Jan – (A); Mar – (B); Nov – (C); Dec – (D); Pertinence with values close to or equal to 0 – Less climatic favorability for the development of conilon coffee; Pertinence with values close to or equal to 1 – Greater climatic favorability for the development of conilon coffee
Spatial variability was high for the other months for the entire state (with the exception of the North) in relation to the optimal set for conilon coffee production, especially in the months of November and January, justified by the highest range values (). In these months, the south and extreme south presented pertinence values that varied between 0.6 and 1, thus demonstrating that the spatial distribution of rainfall does not compromise conilon coffee cultivation. However, according to Araújo et al. (Citation2011), it is important to emphasize that planting should occur in periods with greater rainfall distribution, as any shortage of water at the start of development stunts the growth of conilon coffee trees.
Molion (Citation2016), working with climate data in the state of Espírito Santo and in the south of Bahia, states that rainfall temporal-spatial distribution is complex with significantly different annual totals, affecting the diversification of zones suitable for distinct agricultural crops.
presents thematic maps for the fuzzy classification of mean monthly temperature for the state of Bahia. From May to September, this variable presented greater variability in relation to the optimal data set for coffee production, justifying that previously discussed; that is, the smaller the range the greater the spatial discontinuity. Rodrigues et al. (Citation2016) stated that temperature values above the mean can affect coffee production, as they restrict the growth of the coffee tree due to physiological and biochemical alterations such as a decrease in photosynthetic capacity and an increase in respiratory rate.
Figure 4. Thematic maps of the fuzzy classification of mean monthly temperature for the state of Bahia. Jan – (A); Feb – (B); Mar – (C); Apr – (D); May – (E); Jun – (F); Jul – (G); Aug – (H); Sep – (I); Oct – (J); Nov – (K); Dec – (L); Pertinence with values close to or equal to 0 – Less climatic favorability for the development of conilon coffee; Pertinence with values close to or equal to 1 – Greater climatic favorability for the development of conilon coffee
For temperature, almost the entire state of Bahia presents high pertinence to the optimal set for coffee production, the variable not being an impediment to the cultivation of conilon coffee trees. It is worth highlighting that the regions with lower pertinence values, from May to August, are traditionally used for cultivating arabica coffee due to the milder temperatures favoring this species.
In contrast to that observed for temperature, thematic maps of the fuzzy classification for mean monthly relative air humidity () present greater restrictions to coffee production, especially when the values were below ideal limits, from October to April.
Figure 5. Thematic maps of the fuzzy classification of mean monthly relative air humidity for the state of Bahia. Jan – (A); Feb – (B); Mar – (C); Apr – (D); May – (E); Jun – (F); Jul – (G); Aug – (H); Sep – (I); Oct – (J); Nov – (K); Dec – (L)); Pertinence with values close to or equal to 0 – Less climatic favorability for the development of conilon coffee; Pertinence with values close to or equal to 1 – Greater climatic favorability for the development of conilon coffee
Humidity below ideal conditions provokes higher levels of plant transpiration increasing the hydric demand of the crop, severely damaging photosynthetic processes. Similarly, high relative air humidity reduces rates of leaf transpiration (Rodrigues et al., Citation2016) and causes excessive dehydration of developing flower buds. Moreover, high relative air humidity increases the incidence of diseases, such as coffee leaf rust, phoma leaf spot, cercosporiosis, and anthracnose.
The south and extreme south of Bahia showed greater temporal stability in relation to temperature and relative air humidity, characterized by pertinences closer to one throughout the year (). These results corroborate with the study of Mota (Citation2015), which analyzed the dynamic of conilon coffee vegetation in relation to temperature and relative air humidity from 2007 to 2014, in the municipality of São Mateus, ES, Brazil, and found low variability and, consequently, high temporal stability.
Such behavior favors conilon coffee production, as it ensures lower instability and, consequently, does not put stress on the plants that may compromise its development in any phenological phase. Temperatures above 17°C and below 31.5°C favor vegetative and reproductive development of coffee trees (Partelli et al., Citation2010), especially when associated with relative air humidity around 70% (Silva et al., Citation2015).
The maps in show zones of potential favorability for the cultivation of conilon coffee in the state of Bahia according to the 12 months of the year. As can be seen, the south and extreme south of the state present the lowest climate favorability for conilon coffee cultivation throughout the year, while the north and central-west have the highest favorability for conilon coffee cultivation and, in some cases, exhibit levels considered unsuitable for cultivation (pertinences close to zero). Dourado et al. (Citation2013) identified five different rainfall zones for the state of Bahia and reported the south and extreme south as having a high volume of rains with relatively regular rainfall throughout the year. According to these authors, under normal conditions, this region has a low favorability of climatic anomalies.
Figure 6. Fuzzy mapping of monthly climate favorability for the cultivation of conilon coffee in the state of Bahia. Jan – (A); Feb – (B); Mar – (C); Apr – (D); May – (E); Jun – (F); Jul – (G); Aug – (H); Sep – (I); Oct – (J); Nov – (K); Dec – (L)); Pertinence with values close to or equal to 0 – Less climatic favorability for the development of conilon coffee; Pertinence with values close to or equal to 1 – Greater climatic favorability for the development of conilon coffee
Ferreira (Citation2012), in a study on the application of fuzzy logic to the definition and mapping of climate units in a river basin, observed that the technique enabled continual analysis of the geographical space rather than through strict limits, enabling description and modeling of climate variables that are nebulous in themselves. The author comments that the use of fuzzy logic in climate studies makes the creation of a decision surface possible, making definition of climate categories more flexible.
Pezzopane et al. (Citation2010) presented climate zoning based on relative evapotranspiration for different phenological phases of conilon coffee in the state of Espírito Santo. The authors observed that rainfall heterogeneity in the state confers high spatial variation on climate favorability, similarly to that found in the present study, indicating the most suitable zones for cultivation to minimize production losses.
In general, it is possible to state that the regions of the south and extreme south of Bahia present the lowest climate favorability, making them suitable for the cultivation of conilon coffee in the state of Bahia. In that respect, zoning of the spatial and temporal distribution of climate favorability applied to agriculture, through mathematical models such as fuzzy logic, favors decision-making in the selection of species to be cultivated and the development of public policies to better explore agricultural potential.
Conclusions
The state of Bahia presents great spatial variability regarding suitability for the cultivation of conilon coffee, with highly favorable areas, but with no region considered totally unsuitable.
Due to the seasonality of rainfall and the climatic diversity of the state of Bahia, the months corresponding to the rainy period exhibited the greatest spatial variability for climate favorability in conilon coffee production.
The south and extreme south of Bahia presented the lowest temporal-spatial variability for climate favorability to the development of conilon coffee and are, consequently, the most suitable regions for this crop.
References
- Adorno, H.A., A.A. Zorgetto, D.P. Trevisan, L.E. Moschini, and A.A. Cassiano. 2017. Aptidão agrícola do município de Santa Lúcia – SP. Revista Conhecimento Online. 2:51–65. doi: https://doi.org/10.25112/rco.v2i0.946.
- Almeida, A.Q., R.M.S. Souza, D.C. Loureiro, D.R. Pereira, M.A.S. Cruz, and J.S. Vieira. 2017. Modelagem da dependência espacial do índice de erosividade das chuvas no semiárido brasileiro. Pesquisa Agropecuária Brasileira 52(6):371–379. doi: https://doi.org/10.1590/s0100-204x2017000600001.
- Alvares, C.A., J.L. Stape, P.C. Sentelhas, J.L.M. Gonçalves, and G. Sparovek. 2013. Köppen’s climate classification map for Brazil. Meteorologische Zeitschrift 22(6):711–728. doi: https://doi.org/10.1127/0941-2948/2013/0507.
- Andrade, G.A., W. Silva Ricce, P.H. Caramori, G.C. Zaro, and C. Conti Medina. 2012. Zoneamento agroclimático de café robusta no Estado do Paraná e impactos das mudanças climáticas. Semina: Ciências Agrárias 33:1381–1389.
- Araújo, G.L., E.F. Reis, W.B. Moraes, G.D.O. Garcia, and A.A. Nazário. 2011. Influência do déficit hídrico no desenvolvimento inicial de duas cultivares de café conilon. Irriga 16(2):115–124. doi: https://doi.org/10.15809/irriga.2011v16n2p115.
- Bönisch, S., M.L. Lopes-Assad, A.M.V. Monteiro, and G. Câmara. 2004. Representação e propagação de incertezas em dados de solos, 2- Atributos numéricos. Revista Brasileira De Ciência Do Solo 28(1):21–32. doi: https://doi.org/10.1590/S0100-06832004000100003.
- Camargo, M.B.P. 2010. The impact of climatic variability and climate change on arabic coffee crop in Brazil. Bragantia. 69:239–247. doi: https://doi.org/10.1590/S0006-87052010000100030.
- Cambardella, C.A., T.B. Moorman, J.M. Novak, T.B. Parkin, D.L. Karlen, R.F. Turco, and A.E. Konopka. 1994. Field-scale variability of soil properties in Central Iowa Soils. Soil Science Society of America Journal 58(5):1501–1511. doi: https://doi.org/10.2136/sssaj1994.03615995005800050033x.
- Cardoso, Y.S., M.R. Lopes, S.A. Silva, D.A. Alves, and J.S.S. Lima. 2018. Distribuição e incerteza da precipitação pluviométrica e do potencial erosivo das chuvas para o estado da Bahia, Brasil. Revista Engenharia Na Agricultura 26(2):149–159. doi: https://doi.org/10.13083/reveng.v26i2.835.
- Carvalho, P.S.M., L.B. Franco, S.A. Silva, G.A. Sodré, D.M. Queiroz, and J.S.S. Lima. 2016. Cacao crop management zones determination based on soil properties and crop yield. Revista Brasileira De Ciência Do Solo. 40:1–17. doi: https://doi.org/10.1590/18069657rbcs20150520.
- CONAB. 2018. Companhia Nacional de Abastecimento. Acompanhamento da safra brasileira: Café, p. 70. Conab, Brasília.
- Dourado, C.D.S., S.R.D.M. Oliveira, and A.M.H.D. Avila. 2013. Análise de zonas homogêneas em séries temporais de precipitação no Estado da Bahia. Bragantia 72(2):192–198. doi: https://doi.org/10.1590/S0006-87052013000200012.
- Ferreira, C.C.M. 2012. Aplicação da lógica nebulosa (fuzzy cluster) na definição de unidades climáticas: Estudo de caso na bacia do Rio Paraibuna-MG/RJ. Revista Brasileira De Climatologia 10(1):85–97. doi: https://doi.org/10.5380/abclima.v10i1.30589.
- Lima, J.S.S., and S.A. Silva. 2018. Fuzzy logic application and cluster analysis in the quality of the beverage from conilon coffee. Coffee Science 13(4):439–447. doi: https://doi.org/10.25186/cs.v13i4.1467.
- Lima, J.S.S., S.A. Silva, A.A. Santos, and M.S. Altoé. 2018. Fuzzy logic and geostatistics in studying the fertility of soil cultivated with the rubber tree. Revista Ciência Agronômica 49(2):228–238. doi: https://doi.org/10.5935/1806-6690.20180026.
- Matheron, G. 1963. Principles of geostatistics. Economy Geology 46(8):1246–1266. doi: https://doi.org/10.2113/gsecongeo.58.8.1246.
- Meirelles, M.P., F.R. Moreira, and G. Camara. 2007. Técnicas de inferência espacial, p. 593. In: M.S.P. Meirelles, G. Camara, and C.M. Almeida (eds.). Geomática: Modelos e aplicações ambientais. Embrapa, Brasília, DF.
- Molion, L.C.B. 2016. O clima no Espírito Santo e sul da Bahia, p. 57–80. In: F.L. Partelli and R. Bonomo (eds.). Café conilon: O clima e o manejo da planta. CAUFES, Alegre, ES.
- Mota, F.M. (2015). Dinâmica temporal de índices de vegetação e elementos meteorológicos no café conilon. Dissertação (Mestrado em Agricultura Tropical), Universidade Federal do Espírito Santo, São Mateus-ES.
- New, M., D. Lister, M. Hulme, and I. Makin. 2002. A high-resolution data set of surface climate over global land areas. Climate Research. 21:1–25. doi: https://doi.org/10.3354/cr021001.
- Nobrega, N.E.F., J.G.F. Silva, H.E. Ramos, and F.S. Pagung. 2008. Balanço hídrico climatológico e classificação climática de Thornthwaite e köppen para o município de Marilândia – ES. INCAPER-ES. Boletim Técnico. São Mateus, Espírito Santo - Brasil.
- Nunes, E.L., R.C.F. Amorim, W.G. Souza, A. Ribeiro, M.C.A. Senna, and B.G. Leal. 2007. Zoneamento agroclimático da cultura do café para a bacia do Rio Doce. Revista Brasileira De Meteorologia 22(3):297–302. doi: https://doi.org/10.1590/S0102-77862007000300002.
- Partelli, F.L., H. Duarte-Vieira, M. Gabeto-Silva, and J. Cochicho-Ramalho. 2010. Seasonal vegetative growth of different age branches of Conilon coffee tree. Semina: Ciências Agrárias 31:619–626.
- Pezzopane, J.R.M., F.S. Castro, J.E.M. Pezzopane, R. Bonomo, and G.S. Saraiva. 2010. Zoneamento de risco climático para a cultura do café Conilon no Estado do Espírito Santo. Revista Ciência Agronômica 41(3):341–348. doi: https://doi.org/10.1590/S1806-66902010000300004.
- Rodrigues, W.P., L.D. Martins, F.L. Partelli, F.J.C. Lidon, A.E. Leitão, A.I. Ribeiro-Barros, F.M. Matta, and J.C. Ramalho. 2016. Interação de altas temperaturas e déficit hídrico no cultivo de café Conilon (Coffea canephora Pierre ex A. Froehner), p. 39–56. In: F.L. Partelli and R. Bonomo (eds.). Café conilon: O clima e o manejo da planta. CAUFES, Alegre, ES.
- Silva, M.J.G., F.A.M. Saraiva, A.A.G. Silva, L.A. Santos Neto, and C.A.S. Querino. 2015. Clima, p. 41–54. In: A.L. Marcolan and M.C. Espindula (eds.). Café na Amazônia. Embrapa, Brasília, DF.
- Silva, S.A., J.S.S. Lima, G.S. Souza, and R.B. Oliveira. 2010. Lógica fuzzy na avaliação da fertilidade do solo e produtividade do café conilon. Revista Ciência Agronômica 41:9–17.
- Taques, R.C., and G.G. Dadalto. 2007. Zoneamento agroclimatológico para a cultura do café Conilon no Estado do Espírito Santo, p. 53–66. In: R.G. Ferrão, A.F.A. Fonseca, S.M. Bragança, M.A. Ferão, and L.H.D. Muner (eds.). Café Conilon. Incaper, Vitória, ES.
- Vieira, S.R. 2000. Geoestatística em estudos de variabilidade espacial do solo, p. 1–54. In: R.F. Novais, V.V.H. Alvarez, and G.R. Schaefer (eds.). Tópicos em ciência do solo. Sociedade Brasileira de Ciência do Solo, Viçosa.