
 ?Mathematical formulae have been encoded as MathML and are displayed in this HTML version using MathJax in order to improve their display. Uncheck the box to turn MathJax off. This feature requires Javascript. Click on a formula to zoom.
ABSTRACT
Kendu (Diospyros melanoxylon Roxb.), an underutilized seasonal fruit of India, is a rich source of many medicinal and nutritional properties. However, due to lack of proper postharvest practices, the fruit remains unutilized. The present work is aimed at the optimization of enzyme assisted juice extraction process based on selected quality characteristics of the final product. Pectinase enzyme was used to extract the juice. Box-Behnken design in response surface methodology (RSM) was adopted to optimize the three process variables viz. incubation time (30–90 min), incubation temperature (30–45 °C), and enzyme concentration (0.01–0.1%, w/w). Various quality parameters of the product, such as juice yield, clarity, pH, viscosity, titratable acidity, and total soluble solids were characterized, and the process was optimized. An acceptable quality juice was obtained at the optimal conditions of 30 min incubation time, 30 oC incubation temperature, and 0.053%, w/w enzyme concentration.
Introduction
Kendu (Diospyros melanoxylon Roxb.) fruit belongs to the Ebenaceae family and grown abundance in India, Japan, Sri Lanka, and some other Asian countries. It is a rich source of various bioactive constituents like antioxidants, alkaloids, essential oils, flavonoids, saponin, tannins, and terpenoids. Different studies also reported the kendu fruit potency in terms of antipyretic and anti-inflammatory properties (Hmar et al., Citation2017; Maridass et al., Citation2008). Kendu is a summer fruit available in India from May to July. It appears yellow and tastes sweet during its mature stage. Usually, tribal people pluck the matured fruits and sell in the local market for a lower price. Due to the lack of proper knowledge on postharvest practices and processing techniques, the reach of kendu fruit in the urban market is limited. Therefore, valorization of the fruit would help in commercial cultivation, reduce fruit wastage, better market penetration, and would support the tribal in terms of economy.
Valorization is an effective and quick strategy to convert the fruit into various value-added products. Value addition includes converting fresh fruits to products such as jam, fruit juices, cordial, wine, jelly, fruit bars, and pickles. Among all these products, fruit juice could be a simple and economical way to increase the intake of beneficial nutrients (Brasil et al., Citation1995). Fruit juice shows increased consumer acceptance because of the close resemblance to the raw fruit in terms of taste and convenience (Kumar and Sharma, Citation2012; Vivek et al., Citation2019). Commercial fruit juices from apple, orange, guava, grape, pomegranate, litchi, and jamun are already well established and available in the market (Chopda and Barrett, Citation2001; Galaverna et al., Citation2008; Ghosh et al., Citation2016; Shah, Citation2007; Talcott et al., Citation2003; Vardin and Fenercioǧlu, Citation2003). Despite having many nutrients and health benefits, there is no evidence of Kendu juice available in the market. Therefore, Kendu juice could be a potential option to bridge the utility gap between rural and urban society. Moreover, it will contribute to the widespread in marketing of the fruit. Mechanical presses, decanter centrifuge, and diffusion extraction have been used as conventional fruit juice extraction methods (Sharma et al., Citation2017; Vivek et al., Citation2019). However, these methods lead to reduced juice yield, cloudy appearance, cross-contamination, high initial, and maintenance cost. The conventional methods also utilize high energy to extract the juice. Cloudiness attributed by the protein, metal, tannin, pectin, lignin, cellulose, and hemicellulose is the major problem in the juice industries (Vaillant et al., Citation2001). Due to these compounds, the juice extraction process becomes time-consuming and cumbersome. Clarity of juice is a decisive factor for consumer acceptability, therefore, there is a need for new methods that can increase the juice yield with better clarity (Sandri et al., Citation2011; Tribess and Tadini, Citation2006). Enzyme assisted juice extraction is gaining more attention. It is considered as an eco-friendly extraction technique that improves processing efficiency and enables the delivery of visually attractive final products. Many researchers have tried for many fruits to increase juice recovery and reduce the turbidity (Kashyap et al., Citation2001; Landbo et al., Citation2007; Sandri et al., Citation2011; Vaillant et al., Citation1999) The application of enzyme to the fruit pulp is attributed to a reduction in viscosity and cluster formation that makes separation through filtration or centrifugation a little easier. As a result, it improves the property of juice by concentrating its flavor and color (Abdullah et al., Citation2007; Blanco et al., Citation1999; Kaur et al., Citation2004; Mutlu et al., Citation1999; Sandri et al., Citation2011). The mode of action of the same enzyme produced from different strains acts differently on the same substrate (Ghosh et al., Citation2016).
In the present scenario, the fruit juice industries are seeking improved methodology to enhance the system performance and process efficiency using various enzymes and strains. Response Surface Methodology (RSM) could be used as the most effective tool for the optimization of the juice extraction process (Baş and Boyacı, Citation2007; Yolmeh and Jafari, Citation2017). RSM comprises of a collection of mathematical and statistical techniques to design the number of experimental runs and to examine the interactive effect of independent parameters on responses. Based on the interdependency of responses on independent variables, suitable models, and optimal conditions for the experiment are developed with reduced experimental runs (Ceylan et al., Citation2008; Habibi et al., Citation2018). Therefore, the present work aims at optimizing the process conditions viz. enzyme concentration, incubation temperature and incubation time for Kendu juice extraction using RSM. In addition, influence of process parameters with different combinations on juice yield and other quality characteristics of the juice were also investigated.
Materials and Methods
Raw Material Collection
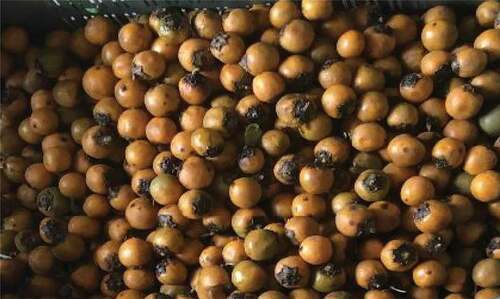
Fresh and fully ripened Kendu fruits were collected from the local market of Rourkela, Odisha, India (). The collected fruits were immediately transported to the Food Processing Laboratory, National Institute of Technology, Rourkela, within an hour. The defect-free fruits were carefully selected and washed thoroughly with sodium hypochlorite solution to remove surface dirt and microbes. Cleaned fruits were used for all the juice extraction experiments. The excess fruits were packed in the polythene bags and stored in the deep freezer −30 oC to avoid any further damage to the fruit.
Figure 1. Kendu fruit
Enzyme and Chemicals
Pectinase enzyme derived from Aspergilus niger (activity 8000–12000 U/g, EC 232–885-6), hexamine LR grade, hydrazine sulfate, and potassium sodium tartrate were ordered from HiMedia Laboratories Private Limited, Mumbai, India. The glassware used during the experiment were procured from Borosil Glass Works Limited, Mumbai, India. Analytical grade chemicals were used for all the experiments.
Juice Extraction
The cleaned fruits were deseeded, and the pulp was extracted. The extracted pulp was then homogenized using a mixer grinder (Bajaj Mixer, India) for 5 minutes at 2500 rpm (Ghosh et al., Citation2017). The viscosity of the homogenized pulp was very high. Therefore, distilled water was added to the pulp at 1:1 (w/v) proportion for better enzyme action and juice recovery. The diluted pulp was filtered thoroughly using a muslin cloth. The 1:1 (w/v) pulp without the addition of any enzyme was taken as the control sample.
Enzymatic Extraction of Kendu Juice
Different concentrations (0.01–0.1%) of pectinase enzyme were used per 100 g of pulp for each experiment. The upper and lower limit of the enzyme concentration was fixed based on the preliminary experiment. From the preliminary experiment, it was found that the higher concentration (> 0.1%) and the lower concentration of enzyme (< 0.01%) did not show any significant effect on the juice yield. The enzyme was homogenously mixed with the pulp using a lab agitator at 300 rpm for 2 min. After mixsing the enzyme, the pulp was then kept in an incubated orbital shaker (REMI Laboratory Instrument, Mumbai, India) at different temperatures for a specified time according to the experimental combinations. The shaker speed was kept constant at 150 rpm. After the incubation, the kendu pulp was kept at −2 oC for 5 min to inactivate the enzyme (Ghosh et al., Citation2016; Molinari and Silva, Citation1997; Sandri et al., Citation2011). Muslin cloth was used as a filtering medium to obtain a clear juice from the enzyme-treated kendu pulp.
Experimental Design
The Design of Expert Software (Version 11.0.3.0 Statease Inc, Minneapolis) was used to optimize the enzyme extraction condition for kendu juice. Box-Behnken design (BBD) with three numerical factors was chosen to design all the experimental runs. In this study, three critical, independent parameters viz. incubation time (30–90 min), incubation temperature (30–45°C), and enzyme concentration (0.01–0.1%), which has a considerable effect on high-quality juice extraction were selected. The working ranges of all the parameters were fixed based on preliminary studies. A total of 17 experimental runs with five replicates at the center point were done. All the experimental runs in their actual and coded forms are shown in . In each experimental run, the effect of various combinations of independent parameters on different responses viz. juice yield, turbidity, clarity, viscosity, titratable acidity, total soluble solids (TSS), refractive index and pH were analyzed. A second-order polynomial equation is suggested to predict the response variables using independent variables as linear, quadratic, and interaction terms, as shown in Equationequation 1(1)
(1) (Vivek et al., Citation2019).
Table 1. Coded and real values of the experimental runs
where Y is the response, Xi and Xj stand for levels of variables, β0 is the model constant, βi, βii, and βij are coefficients of linear terms, quadratic terms, and interaction terms respectively. All the experiments were repeated thrice to validate the designed model. The results obtained for enzymatically extracted juice were then compared with the control sample.
Characterization of Kendu Juice
Different physical properties such as viscosity, clarity, turbidity, yield, refractive index, and chemical properties viz. pH, titratable acidity, TSS of the juice were determined as follows.
Juice Yield
The quantity of kendu juice recovered from a measured amount of kendu pulp was considered as the juice yield and expressed in percentage as per the following equation (Handique et al., Citation2019).
where
Viscosity
The viscosity of enzyme extracted kendu juice was measured using Brookfield viscometer (DV2TLV, Brookfield, USA) at 150rpm. UL adopter was used, and the results were expressed in centipoise units.
Turbidity and pH
The turbidity of the kendu juice after each treatment was measured using a portable digital turbidity meter, and the results were expressed in terms of Nephelometric Turbidity Units (NTU). The pH of the filtrate was checked by using a digital pH meter.
Clarity of Juice
The clarity of the kendu juice was checked using UV–VIS spectrophotometer (AU 2701, Systronics, India). The percentage transmittance (%T) was measured at a wavelength of 660 nm. Distilled water was taken as a reference in this study (Tapre and Jain, Citation2014).
Titratable Acidity
The titratable acidity (TA) of kendu juice was measured using the titration method with a 0.1 N Sodium hydroxide solution. The titration was carried out to an endpoint of pH 8.2 till the color changes to pink. The phenolphthalein indicator was used for the purpose. The titratable acidity was expressed as % citric acid equivalent.
Total Soluble Solids and Refractive Index
The determination of Total Soluble solids (TSS) and Refractive index (RI) of kendu juice was measured out using a benchtop digital refractometer (RFM 700, Bellingham, and Stanley, UK). The results obtained for TSS were expressed in terms of oBrix units.
Statistical Analysis
The analysis of variance was performed to study the effect of regression coefficients for linear, quadratic, and interaction terms. The significance of all terms was statistically determined by computing model F-value at the probability of less than 0.001, 0.05, and 0.1, respectively. The performance of the model was reported by determining the root mean square error (RMSE) and mean absolute error (MAE) values, as shown in Equationequations 3(3)
(3) and Equation4
(4)
(4) , respectively.
where Rp is the predicted value; Robs is the observed value, and N is the number of observations.
Results and Discussions
The juice obtained by the manual extraction process (control sample) was analyzed for different quality parameters like pH, titratable acidity, turbidity, clarity, viscosity, and total soluble solids and refractive index ().
Table 2. Juice properties of the control sample
Effect of Independent Parameters on Enzymatically Extracted Juice Properties
Model Fitting
The coefficients of all quadratic equations were determined using Box-Behnken design in the Design of Experts software. The coefficient estimate represents the expected change in response per unit change in factor value when all remaining factors are held constant. The values of response variables for different experimental combinations were shown in . The significant effect of different independent variables on response values was analyzed by performing an analysis of variance test and tabulated in . The accuracy and adequacy of models were checked by lack of fit (LoF) test and by considering various determining parameters viz. coefficient of determination (R2), predicted R2, adjusted R2, adequate precision, coefficient of variation (CV), root mean square error (RMSE) and mean absolute error (MAE). The non-significant lack of fit value and an adequacy precision value higher than four makes a model adequate to use. The higher values of R2, adjusted R2, and predicted R2 result in the high accuracy of the developed model. The lower values of CV results in smaller relative standard deviation, i.e., less fluctuation of data from the mean value. The performance of the models was evaluated from RMSE and MAE values, i.e., lower the values, less error in the data.
Table 3. Box – Behnken design matrix and response variables
Table 4. Regression coefficients of the responses
Effect of Enzyme on Juice Yield
Enzyme concentration showed a significant positive effect on juice yield at p < .001 (). The juice yield increased with an increase in enzyme concentration. The cell wall of Kendu is primarily composed of Pectin. The protopectin liberates water soluble pectin which results in extraction of juice from the fruit pulp(Vivek et al., Citation2019).This phenomenon may be attributed due to increased activity of the enzyme at higher concentrations. The degradation of soluble pectin is mainly responsible for increased recovery of fruit juice. Similar kinds of results were reported for Sohiong and palm, where juice recovery increased with the enzyme concentration (Mohanty et al., Citation2018; Vivek et al., Citation2019). The quadratic and interactive terms of enzyme concentration with incubation time and the temperature were insignificant at p > .05. The juice yield also dependent on the incubation temperature because its linear and quadratic terms showed a significant negative effect at p < .001. The interactive terms of incubation time and temperature showed a negative effect and were significant at p < .001. The regression analysis of the data on juice yield (Y) was performed and a second-order polynomial equation was obtained as follows;
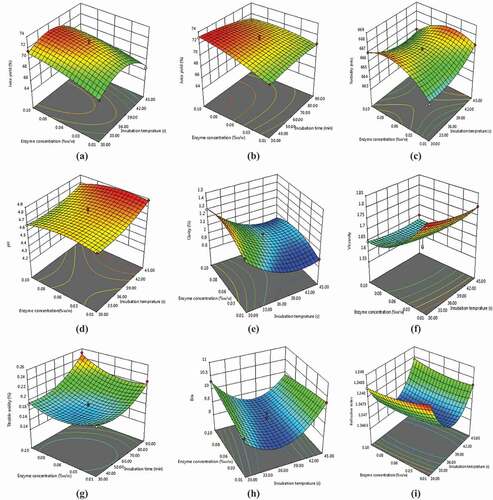
The above equation is expressed in terms of coded factors and can be useful for identifying the relative impact of the factors by comparing the factor coefficients. The model F value was obtained to be 23.12, which implies the model is significant. The higher values of R2 (0.96) and adjusted R2 (0.92) signifies the higher accuracy of the model. Also, the predicted R2 value (0.82) is in reasonable agreement with the adjusted R2. The coefficient of variation was found very low (0.79), which means less fluctuation of data from the mean value. From the lower values of RMSE (0.35) and MAE (0.27), it is obvious that there is less error in the data. The effect of independent process parameters on juice yield, three-dimensional response surface plots are employed, as shown in . The response surface plots showed the influence of two independent parameters on the dependent variable, while the third independent parameter was kept constant. There is a linear increase in juice yield with an increase in both enzyme concentration and incubation time. This may be due to the more availability of time for the enzyme to interact with the fruit pulp. But, this linear increase in yield is slightly higher for enzyme concentration compared to time. Similar result was obtained for enzymatic juice extraction from banana(Handique et al., Citation2019). The extraction of juice increased considerably with an increase in incubation temperature up to 40°C and then decreased. This may be attributed to the inability of the enzyme to act efficiently at higher temperatures.
Figure 2. 3D response surface plots showing the effect of enzyme concentration and incubation temperature on (a) juice yield, (c) turbidity, (d) pH, (e) clarity, (f) viscosity, (h) TSS, (i) refractive index and effect of enzyme concentration and incubation time on (b) juice yield and (g) titratable acidity
Effect of Enzyme on Turbidity and pH
Turbidity is the measure of the cloudiness of the juice due to the presence of suspended particles. A juice with lesser turbidity value appears clear to the naked eye. The incubation time showed a significant linear positive effect on the turbidity value of the juice at p < .001. While its quadratic and interactive terms with incubation temperature and enzyme concentration exhibit a negative impact on the turbidity of juice at p < .05. The quadratic term of incubation temperature showed a positive effect on turbidity, but its interaction with time and enzyme concentration showed an adverse effect and was significant at p < .05. The effect of enzyme concentration on turbidity showed a negative effect in its quadratic form, and it was found significant at p < .001. This may be due to the enzyme maceration of the pulp results in a more cloud stable juice with lower turbidity and viscosity. A similar kind of result was reported for the viscosity of Sohiong and pitaya juice (Nur ‘Aliaa et al., Citation2010). The regression model for turbidity in terms of its coded value is given as follows.
The model fits better with a high R2 value of 0.94 and an adequacy precision of 13.46. The RMSE value (0.24) and MAE value (0.18) are quite lower, and the lack of fit is insignificant, which is desirable. A positive slope was observed, which indicates the effect of concentration and incubation temperature on the turbidity of juice (). The enzymatically extracted juice exhibits less pH value as compared to the untreated juice. This signifies it is slightly acidic as compared to the control sample. So, there is a minimum possibility of microbial multiplication, and hence, increased shelf life of the juice. From , it was observed that the incubation time is the most significant parameter that affects the pH value. Both the linear and quadratic terms of incubation time had a negative impact (p < .001). The interaction of time with temperature showed a positive effect, and with enzyme concentration, incubation time showed a negative effect on the pH of juice. The following equation is showing the relationship between different process variables in their coded form and pH of Kendu juice.
The coefficient of determination value for this model is 0.95, and the adjusted R2 value is 0.89, which is very close to the R2 value. The CV value for the model is 1.08, which signifies that the relative standard deviation is very low. The response surface plots showed the effect of independent parameters viz. enzyme concentration and incubation temperature on pH of juice are depicted in .
Effect of an Enzyme on Clarity
Clarity is an important quality parameter that draws the attention of consumers to buy the product. The incubation temperature showed a linear negative effect on the clarity of juice. The quadratic term showed a significant positive effect at p < .001. The incubation time showed a significant effect at p < .05, where the linear and interaction terms with temperature showed a positive influence on the clarity of Kendu juice. As the concentration of the enzyme increases the clarity of the juice increases because of the maceration of pulp compounds by the enzymes leads to better clarity of the juice. A similar kind of result was reported for the viscosity of pitaya juice (Nur ‘Aliaa et al., Citation2010). The regression model showing the effect of process parameters on the clarity of juice is given below.
The R2 value for this model was found to be 0.96, which means this regression model can explain 96% of the variability of the data. Also, the predicted R2 value (0.77) is in reasonable agreement with the adjusted R2 (0.91). The lack of fit value is non-significant, which makes the model fit. In , it can be clearly observed that at lower incubation temperature with an increase in enzyme concentration, there is an improvement in the clarity of the juice. But, by increasing the temperature, the enzyme has a negligible effect in improving the clarity of the juice.
Effect of an Enzyme on Viscosity
Viscosity is one of the critical parameters to be taken care of juice because it affects the filtration process of juice. More viscous juice can lead to clogging of the filtration apparatus (Jacob et al., Citation2008). Pectin is responsible for the high viscosity of juice. So, pectin is to be hydrolyzed, which results in the degradation of pectin. Thereby, the water holding capacity is lowered, and it reduces the viscosity of juice because of the free release of water into the system (Nur ‘Aliaa et al., Citation2010). The linear term of enzyme concentration showed a negative correlation on the viscosity of juice and significant at p < .001. But, the quadratic term of enzyme concentration showed a positive impact on the viscosity at a significance level of p < .05. A similar kind of result was reported for the viscosity of pitaya juice (Nur ‘Aliaa et al., Citation2010). The interactive term of enzyme concentration with incubation temperature showed a negative effect on viscosity at a significance level of p < .05. The polynomial equation developed for the viscosity of Kendu juice in relation to different coded process variables is as follows.
The above model has higher R2 (0.91), adjusted R2 (0.81), and predicted R2 (0.63) value, which leads to greater accuracy of the model. The CV value for the model was obtained to be 2.08. The lower CV value signifies that there is less fluctuation of data from the mean value. There is very less chance of error in the model as the RMSE value (0.02), and the MAE value (0.01) are quite lower. depicts that, with increasing the enzyme concentration, the viscosity of the juice decreases, and the juice becomes thinner. The increase in temperature has resulted in a slight decrease of viscosity of juice to a certain limit and then increased with further increase in temperature.
Effect of Enzyme on Titratable Acidity
Titratable acidity deals with the measurement of total acid concentration present in the juice. The titratable acidity provides a better prediction of the impact of acid on the flavor of the food than pH (Sadler and Murphy, Citation2010). All three process parameters viz. incubation time, incubation temperature, and enzyme concentration showed a significant effect on the titratable acidity. Both the linear and quadratic effect of incubation time showed a positive effect on the acidity of juice and significant at p < .001. The interaction terms of time with temperature showed a negative effect. In contrast, the interaction term of time with enzyme concentration showed a positive response on acidity, and both are significant at p < .05. Individually, the incubation temperature and enzyme concentration showed a linear positive effect on titratable acidity of juice at a significance level p < .05. The increase in the titrable acidity may be due to the decrease in the pH this results in the breakdown of the cell wall releases organic acids. Similar results were shown for enzymatically extracted Sohiong juice (Vivek et al., Citation2019). The following regression model is explaining the relation between acidity and process parameters in its coded form.
The adequacy precision of the model is 21.07. The model possesses a higher R2 value (0.97). So, the model can explain 97% of the variability of data. Also, the predicted R2 value (0.73) is in reasonable agreement with the adjusted R2 value (0.93). The RMSE value and MAE value for this model are 0.003 and 0.002, respectively. Increase in incubation time significantly increases the titratable acidity value (). This might be attributed to the release of a degradation product of pectin, called galacturonic acid. The acidity was slightly decreased by the addition of enzyme upto a certain concentration, after which it again increased.
Effect of Enzyme on Total Soluble Solids and Refractive Index
The quadratic effect of incubation time and temperature showed a positive effect on the TSS content of the juice at p < .001. The TSS content increased with time and significant at p < .05. The interaction term of time and temperature exhibits a positive response. Whereas interaction of temperature and enzyme concentration exhibit a negative response on TSS and showed a significant difference at p < .05. The increase in TSS may be due to the release of solids i.e., sugars and organic acids due to the enzyme breakdown of cell wall of the pulp. The regression model developed for TSS and other coded variables is given below.
The model showed a higher R2 value of 0.95, which results in better accuracy of the model. The lack of fit was found insignificant that is desirable. The RMSE (0.11) and MAE (0.08) values were found to be very less. An increase in the enzyme concentration increased TSS content (). The incubation temperature in its quadratic form showed a significant positive response at p < .001, while its linear form has a negative impact on the refractive index value of juice at p < .05. The interaction effect of temperature with incubation time and enzyme concentration on the refractive index showed a significant positive difference at p < .05. The regression model developed for the refractive index indicating the effect of process variables in their coded form is as follows.
This model fits better and has good accuracy because of a higher coefficient of determination value (0.98). The predicted R2 value (0.85) and adjusted R2 value (0.96) are very close and are in reasonable agreement with each other. From , it can be observed that the temperature showed a significant effect in the refractive index of the juice. The enzyme concentration has relatively less influence on the refractive index value.
Conclusion
The present study on optimization of enzymatic extraction process of juice from Kendu fruit had shown a good result on juice yield and other juice quality factors. The RSM technique using Box – Behnken design was used to optimize the process variables. The optimum conditions obtained from the design were incubation time (30 min), incubation temperature (30°C), and enzyme concentration (0.053% w/w). The responses obtained at optimal process conditions were juice yield (68.60%), turbidity (665.81 NTU), pH (4.76), clarity (1.4), viscosity (1.71cP), titratable acidity (0.16% citric acid), TSS (10.5°brix) and refractive index (1.3486). The model showed acceptable desirability of 0.73. Hence, the enzymatic juice extraction can be used as an effective means to add value to Kendu fruit and thus promoting its commercialization and value addition.
References
- Abdullah, A.L., N. Sulaiman, M. Aroua, and M.M.M. Noor. 2007. Response surface optimization of conditions for clarification of carambola fruit juice using a commercial enzyme. J. Food Eng. 81(1):65–71. doi: https://doi.org/10.1016/j.jfoodeng.2006.10.013.
- Baş, D., and I.H. Boyacı. 2007. Modeling and optimization I: Usability of response surface methodology. J. Food Eng. 78(3):836–845. doi: https://doi.org/10.1016/j.jfoodeng.2005.11.024.
- Blanco, P., C. Sieiro, and T.G. Villa. 1999. Production of pectic enzymes in yeasts. FEMS Microbiol. Lett. 175(1):1–9. doi: https://doi.org/10.1111/j.1574-6968.1999.tb13595.x.
- Brasil, I.M., G.A. Maia, and R.W. de Figueiredo. 1995. Physical-chemical changes during extraction and clarification of guava juice. Food Chem. 54(4):383–386. doi: https://doi.org/10.1016/0308-8146(95)00066-R.
- Ceylan, H., S. Kubilay, N. Aktas, and N. Sahiner. 2008. An approach for prediction of optimum reaction conditions for laccase-catalyzed bio-transformation of 1-naphthol by response surface methodology (RSM). Bioresour. Technol. 99(6):2025–2031. doi: https://doi.org/10.1016/j.biortech.2007.03.018.
- Chopda, C.A., and D.M. Barrett. 2001. Optimization of guava juice and powder production. J. Food Process. Preserv. 25(6):411–430. doi: https://doi.org/10.1111/j.1745-4549.2001.tb00470.x.
- Galaverna, G., G. Di Silvestro, A. Cassano, S. Sforza, A. Dossena, E. Drioli, and R. Marchelli. 2008. A new integrated membrane process for the production of concentrated blood orange juice: Effect on bioactive compounds and antioxidant activity. Food Chem. 106(3):1021–1030. doi: https://doi.org/10.1016/j.foodchem.2007.07.018.
- Ghosh, P., R.C. Pradhan, and S. Mishra. 2016. Optimization of process parameters for enhanced production of Jamun juice using Pectinase (Aspergillus aculeatus) enzyme and its characterization. 3 Biotech 6(2):241. doi: https://doi.org/10.1007/s13205-016-0561-0.
- Ghosh, P., R.C. Pradhan, and S. Mishra. 2017. Low‐temperature extraction of Jamun juice (Indian Black Berry) and optimization of enzymatic clarification using Box‐Behnken design. J. Food Process Eng. 40(2):e12414. doi: https://doi.org/10.1111/jfpe.12414.
- Habibi, H., A. Mohammadi, and M. Kamankesh. 2018. Hydroxymethylfurfural in fruit puree and juice: Preconcentration and determination using microextraction method coupled with high-performance liquid chromatography and optimization by Box–Behnken design. J. Food Meas. Charact. 12(1):191–199.
- Handique, J., S.J. Bora, and N. Sit. 2019. Optimization of banana juice extraction using combination of enzymes. J. Food. Sci. Technol. 56(8):3732–3743. doi: https://doi.org/10.1007/s13197-019-03845-z.
- Hmar, B.Z., S. Mishra, and R.C. Pradhan. 2017. Physico-Chemical, Mechanical and Antioxidant Properties of Kendu (Diospyros Melanoxylon Roxb.). Curr. Res Nutr. Food Sci. J. 5(3):214–222.
- Jacob, N., R.K. Sukumaran, and P. Prema. 2008. Optimization of enzymatic clarification of sapodilla juice: A statistical perspective. Appl. Biochem. Biotechnol. 151(2–3):353–363. doi: https://doi.org/10.1007/s12010-008-8198-z.
- Kashyap, D., P. Vohra, S. Chopra, and R. Tewari. 2001. Applications of pectinases in the commercial sector: A review. Bioresour. Technol. 77(3):215–227. doi: https://doi.org/10.1016/s0960-8524(00)00118-8.
- Kaur, G., S. Kumar, and T. Satyanarayana. 2004. Production, characterization and application of a thermostable polygalacturonase of a thermophilic mould Sporotrichum thermophile Apinis. Bioresour. Technol. 94(3):239–243. doi: https://doi.org/10.1016/j.biortech.2003.05.003.
- Kumar, S., and H. Sharma. 2012. Comparative effect of crude and commercial enzyme on the juice recovery from Pineapple (Ananas comosus) using Principal Component Analysis (PCA). Food Sci. Biotechnol. 21(4):959–967. doi: https://doi.org/10.1007/s10068-012-0126-x.
- Landbo, A.-K., K. Kaack, and A.S. Meyer. 2007. Statistically designed two step response surface optimization of enzymatic prepress treatment to increase juice yield and lower turbidity of elderberry juice. Innovative Food Sci. Emerg. Technol. 8(1):135–142. doi: https://doi.org/10.1016/j.ifset.2006.08.006.
- Maridass, M., S. Ghanthikumar, and G. Raju. 2008. Preliminary phytochemical analysis of Diospyros species. Ethnobotanical Leafl. (2008(1):118.
- Mohanty, S., S. Mishra, and R.C. Pradhan. 2018. Optimisation of enzymatic extraction and characterization of palm (Borassus flabellifer) juice. J. Food Meas. Charact. 12(4):2644–2656.
- Molinari, A., and C. Silva (1997). Freezing and storage of orange juice: Effects on pectinesterase activity and quality.
- Mutlu, M., K. Sarıoǧlu, N. Demir, M.T. Ercan, and J. Acar. 1999. The use of commercial pectinase in fruit juice industry. Part I: Viscosimetric determination of enzyme activity. J. Food Eng. 41(3–4):147–150.
- Nur ‘Aliaa, A., M. Siti Mazlina, F. Taip, and A. Liew Abdullah. 2010. Response surface optimization for clarification of white pitaya juice using a commercial enzyme. J. Food Process Eng. 33(2):333–347. doi: https://doi.org/10.1111/j.1745-4530.2008.00277.x.
- Sadler, G.D., and P.A. Murphy. 2010. pH and titratable acidity, p. 219–238. In: Food analysis. Springer, Boston, MA. https://doi.org/https://doi.org/10.1007/978-1-4419-1478-1_13
- Sandri, I.G., R.C. Fontana, D.M. Barfknecht, and M.M. da Silveira. 2011. Clarification of fruit juices by fungal pectinases. LWT-Food Sci. Technol. 44(10):2217–2222. doi: https://doi.org/10.1016/j.lwt.2011.02.008.
- Shah, N. 2007. Optimization of an enzyme assisted process for juice extraction and clarification from litchis (Litchi Chinensis Sonn.). Int. J. Food Eng. 3(3). https://doi.org/https://doi.org/10.2202/1556-3758.1073
- Sharma, H.P., H. Patel, and S. Sugandha. 2017. Enzymatic added extraction and clarification of fruit juices–A review. Crit. Rev. Food Sci. Nutr. 57(6):1215–1227. doi: https://doi.org/10.1080/10408398.2014.977434.
- Talcott, S.T., C.H. Brenes, D.M. Pires, and D. Del Pozo-Insfran. 2003. Phytochemical stability and color retention of copigmented and processed muscadine grape juice. J. Agric. Food Chem. 51(4):957–963. doi: https://doi.org/10.1021/jf0209746.
- Tapre, A., and R. Jain. 2014. Optimization of an enzyme assisted banana pulp clarification process. Int. Food Res. J. 21(5):2043.
- Tribess, T.B., and C.C. Tadini. 2006. Inactivation kinetics of pectin methylesterase in orange juice as a function of pH and temperature/time process conditions. J. Sci. Food Agric. 86(9):1328–1335. doi: https://doi.org/10.1002/jsfa.2512.
- Vaillant, F., A. Millan, M. Dornier, M. Decloux, and M. Reynes. 2001. Strategy for economical optimisation of the clarification of pulpy fruit juices using crossflow microfiltration. J. Food Eng. 48(1):83–90. doi: https://doi.org/10.1016/S0260-8774(00)00152-7.
- Vaillant, F., P. Millan, G. O’Brien, M. Dornier, M. Decloux, and M. Reynes. 1999. Crossflow microfiltration of passion fruit juice after partial enzymatic liquefaction. J. Food Eng. 42(4):215–224. doi: https://doi.org/10.1016/S0260-8774(99)00124-7.
- Vardin, H., and H. Fenercioǧlu. 2003. Study on the development of pomegranate juice processing technology: Clarification of pomegranate juice. Food/Nahrung 47(5):300–303. doi: https://doi.org/10.1002/food.200390070.
- Vivek, K., S. Mishra, and R.C. Pradhan. 2019. Optimization of ultrasound‐assisted enzymatic extraction of Sohiong (Prunus nepalensis) juice. J. Food Process Eng. 42(1):e12948. doi: https://doi.org/10.1111/jfpe.12948.
- Yolmeh, M., and S.M. Jafari. 2017. Applications of response surface methodology in the food industry processes. Food Bioprocess Technol. 10(3):413–433. doi: https://doi.org/10.1007/s11947-016-1855-2.