
 ?Mathematical formulae have been encoded as MathML and are displayed in this HTML version using MathJax in order to improve their display. Uncheck the box to turn MathJax off. This feature requires Javascript. Click on a formula to zoom.
ABSTRACT
In the past few decades, both academicians and industries have shown interest toward the agricultural post-harvest operation aiming to reduce the post-harvest losses. In order to assist farmers in post-harvest decision-making some effective and innovative methodological frameworks are required. The fruit weight measurement is of prime importance in many food processing industries during sorting, grading, and packaging. In this work, different Support vector machine (SVM) classifiers as well as weighing models developed using the optimized adaptive neuro-fuzzy inference system (ANFIS) coupled with a computer vision system are proposed. More precisely, the weighing models based on the hybrid ANFIS approach using two well-known optimization algorithms are analyzed. In the first approach, a series of GA-ANFIS models have been evaluated for different population size. In the later approach, different PSO-ANFIS models have been evaluated by varying the most influential parameters. The comprehensive self-built color image database has been used for both calibration and validation of the models. From an economic point of view, this indirect way of weighing fruits may be useful to fruit growers and traders in deciding the market depending on the fruit size and weight before packaging. The result shows the higher reliability and prediction capability of the proposed meta-heuristics (GA-ANFIS) model in estimating the weight of sweet lime fruit.
Introduction
Automatic classification and precise weighing of different fruits are becoming the most popular area of research not only in academic institutions but also in the fruit processing and packaging industry. The sweet lime (Citrus limetta) locally known as “Sathukudi or mosambi” belongs to Rutaceae family, Citrus genus, and Limetta species. It is an industrial fruit used in traditional medicines as well as a source of Potassium and Vitamin C to restore energy with low calories and fats. The nutritional contents of sweet lime fruit are Potassium (182 ± 39.4 mg), Vitamin C (46.96 ± 7.64 mg), Iron (0.11 ± 0.02 mg), Calcium (25.79 ± 5.02 mg), Copper (0.03 ± 0.00 mg), Sodium (1.17 ± 0.45 mg), and Energy (114 ± 5 KJ) all units are per 100 g of its edible portion (Longvah et al., Citation2017). Along with this, the d-limonene found as major chemical composition in sweet lime fruit peels have explored and established as a good alternative to modern medicines for primary health care and to cure chronic disease (Khan et al., Citation2016). Hence, because of these well-proven health benefits of sweet lime fruit, it places itself as the major ingredient of fruit juice and food industries as well as pharmaceutical and beauty product industries. The productivity of sweet lime fruit in India has increased from 10.8 to 17.7 (metric tons per hectare) in between 2006 and 2018 (Horticultural Statistics at a glance Citation2018 report, 2020). Though the productivity has increased, but the post–harvest operations like grading and sorting of fruit are still performed manually. This manual handling of the fruits is one of the reasons for the qualitative and quantitative loss which leads to the economic loss to the grower (Ladaniya, Citation2008). A report shows that 5.8-18.1% fruits are lost during harvest, post-harvest, handling and storage in India. The overall post-harvest loss of citrus fruit in India is 6.3% (Nanda et al., Citation2012). The worldwide grading and packaging of all the fruits coming under the citrus family is performed by considering their size as the main attributes. The equal size and regular shape fruits always attract the attention of the consumer. Also, the size and weight of the fruit are considered as one of the quality measures along with an aroma, physical defect, color, shape and many more (El-Mesery et al., Citation2019). Hence, it is more important to know the relation between the size and weight of the fruit (Moreda et al., Citation2009). Cubero et al. (Citation2014) have developed the computer vision system to inspect the citrus fruits concerning their size and color before the packaging line.
In a similar study, Spreer and Muller (Citation2011) have developed a good correlation equation between geometric features and weight of a mango fruit which is to be used in contact-less sizing of mango fruit. Ercisli et al. (Citation2012) have investigated the size and shape attributes of ten different Walnut cultivators using image processing techniques. The relation was determined between the attributes extracted and the Walnut cultivator using principle component analysis (PCA). Schulze et al. (Citation2015) have applied length, width and thickness of the mango fruit as inputs to develop a non-linear feed-forward ANN model for its mass prediction. Jorquera-Fontena et al. (Citation2017) have communicated the relationship between the blueberry fruit weight with its diameter. In the recent past few years, computer vision has proved itself as one of the alternatives for the manual post-harvest operation like sorting and grading especially in the supermarket to help a customer as well as a cashier (Hossain et al., Citation2019). In order to provide a smart classification and packaging solution to agricultural industries, a computer vision along with intelligent soft computing techniques was recommended (Iraji, Citation2019). Yuan-Yuan Pu et al. (Citation2019) have investigated three ripening stages of Bananito fruit using three different classifiers. The firmness, some color features, and soluble solids content (SSC) of the fruit have been used for internal quality and peel color identification of the fruit. Arun Kumar et al. (Citation2019) have classified Indian pomegranate fruit in three different grades using 134 features extracted through image processing and ANN. Wenwen Zhang et al. (Citation2019) have developed the multispectral vision system for potato defect identification and classification using the method of a single shot.
Miraei Ashtiani et al. (Citation2020) have developed forecasting models for almond kernel mass prediction from the geometric attributes of its shell using different soft computing techniques. The authors have practiced various forecasting algorithms viz multi-linear regression (MLR), multi-layer perceptron (MLP), radial basis function (RBF), support vector machine (SVM), and ANFIS for three varieties of almond.
So far within this field, appreciable work has been done. summarizes the outcomes of different fruit mass modeling studies using manual and image processing for the past few years. In the aforementioned weighing models studied for different fruits have one or more flaws as mentioned below.
Most of the mass prediction models were developed using simple or multiple linear regression.
The non-linearly in fruit mass modeling was not learned up to the mark.
Most of the studies performed have used more than two views of the fruit.
Table 1. Different fruit mass prediction models based on manual and image processing in literature
In order to conquer these flaws, this work presents an optimized and efficient ANFIS network. The application of meta-heuristics algorithms GA and PSO in the field of food process engineering for estimating the weight of fruit is both effective and novel. The ANFIS is being used as one of a non-linear function approximator in different engineering areas. As it takes the advantages of both, the uncertainty in a fuzzy system and the learning capability of a neural network (Jang, Citation1993). Recently, the studies pointing toward the environmental issue, ANFIS has been used as a modeling tool for forecasting of Indian River “Satluj” water quality index (Tiwari et al., Citation2018). Similarly, considering agricultural growth, post-harvest operations, and health as a prime concern, many efforts have been made by different researchers all over the world using ANFIS. They recommended different models using ANFIS for forecasting of the weight percentage of flocculated Asphaltene in oil (Keybondorian et al., Citation2018), strawberry yield under the greenhouse (Khoshnevisan et al., Citation2014a), wheat grain yield (Khoshnevisan et al., Citation2014b). The result obtained in the aforementioned studies encourages us to employ GA and PSO optimized ANFIS for predicting the sweet lime fruit weight.
The relation between fruit weight with its size is more important during post-harvest operations and packaging. Hence, for the potential application of the sorting, grading and packaging machines toward bulk agricultural products, a more accurate weighing model is required. From this aspect, this work tends to contribute mainly as follows:
First, the computer vision system which consists of an image acquisition chamber, camera, illumination system and a computer has been used to prepare a more comprehensive self-built database.
Second, the image processing algorithm has been used to extract seven features viz. length, average width, depth, two perimeters, and two projected areas from two views of the sweet lime fruit.
Lastly, the Support Vector Machine (SVM) classifier and ANFIS have been applied to these 1D and 2D features aiming to develop a forecasting model for sweet lime fruit class and weight. The developed supervised models have been improved with the use of meta-heuristics GA and PSO optimization algorithm.
The performance of the ANFIS model developed is improved by the use of GA and PSO algorithm for optimizing the weights of the if-then rules. The performance of these two models with high predictive potential is evaluated statistically and the results obtained are compared with the weighing models reported previously. This study reduces the need for an exhaustive, laborious and time-consuming weighing system used in the packaging line.
Thus, this indirect method of weighing fruits will be helpful to a researcher, food scientist and agriculture-based industries in grading as well as the packaging of bulk agricultural products. Using such a similar combination of weighing and classification model will be useful in developing many industrial applications. It can be utilized in packing of bulk post-harvested fruits in supermarkets, wholesale traders, exporters and fruit processing industries.
Material and Methods
Dataset Preparation
In this investigative work, the study of computation as well as extraction of features, and their modeling was important. As the benchmark public dataset for sweet lime fruit to estimate its weight is not available, we decided to create our dataset. The weight of fruit not only depends on its size but also depends on its chemical composition and the maturity level. Hence, in order to develop more general weight forecasting model total 793 (≈ 206 kg) good quality (without any physical damage), ripened and semi-ripened Indian sweet lime fruits were procured a number of times. The sweet lime fruits were procured from the nearest local traders located in Trichy (78.7047° E and 10.7905° N), Tamil Nadu (India) from March 2018 to July 2019. The samples used for calibration and validation of the model were 70% (553) and 30% (240) respectively. The samples were hand-picked to ensure the observed variability referring to size and weight. For ensuring the wide range validity of the developed model, the data set used for calibration as well as validation was divided in four ranges (>200 g as Class A; 150−200 g as Class B; 100–150 g as Class C and <100 g as Class D).
The weight and dimensions of the samples were measured using a digital balance (Equal®, India, Model: EquationEQ3(3)
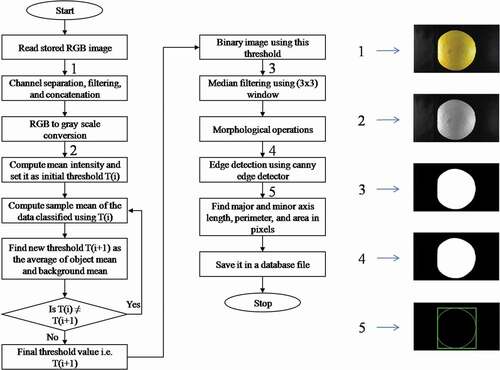
(3) , capacity: 3 kg and accuracy: 0.1 g), and digital caliper (Dedso™, India, capacity: 200 mm, accuracy: 0.01 mm) respectively. The processes adapted to measure the above-said attributes, the color image acquisition set up to capture two different views of fruit were the same as used in the previous studies (Phate et al., Citation2019a, Citation2019b). The algorithm developed for 1D and 2D feature extraction from the captured color image is shown in . The threshold value which was automatically determined using the gray level histogram was applied for converting the gray image into a binary image (Otsu, Citation1979). summarizes different input features extracted from images and output feature used for calibration and validation of the weighing models. The self-built dataset consists of total 1586 color images each have a resolution of 1920 × 1080.
Table 2. Summary of the input output features used
Figure 1. Flow chart of preprocessing steps for image features extraction
Proposed Methodology
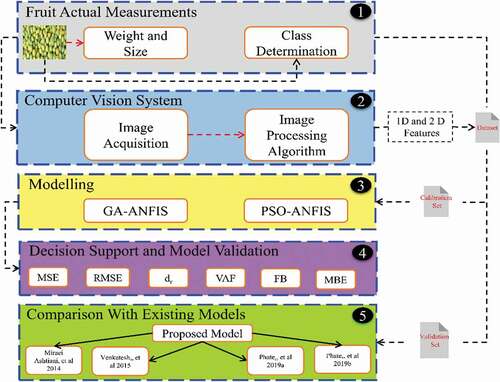
The actual computer vision system consists of the imaging chamber, three illumination lamps, a CCD image device having resolution 16.1 megapixels, and a personal computer (2.7 GHz, Intel core i7) with MATLAB 2019b installed. shows the proposed methodology used in this work.
Figure 2. Methodology adopted for calibration and validation of the models
Model Development
SVM Classifier
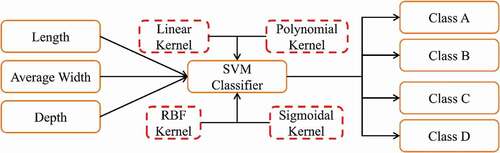
The SVM has been used as the non-linear classifier to classify the sweet lime fruits into four different classes. In order to simplify the calculations, the loss function used transferees the quadratic programming problem into a linear problem. In the research work, four different kernel functions have been used. The optimal kernel parameters and hyperparameter have been found using ten-fold cross-validation using STATISTICA 10 (Data mining tool). shows the process adopted for classifying the sweet lime fruits using the SVM classifier of type 1 and using different kernel functions. Three diameters of the fruit extracted using image processing technique have been used as the input features. The target class assigned to the particular sample has been determined based on their respective weight. The different parameters were set during classification viz. C = 10; degree of polynomial = 3; γ = 0.9; coefficient = 0; maximum number of epochs = 1000; stop at error = 0.001 and cache size = 40 MB.
Figure 3. Schematic of SVM type 1 classifier
ANFIS
The ANFIS network was first proposed by Jang (Citation1993). In this study, the ANFIS network was used as a function approximator because of its good learning ability and the capability to adapt itself quickly toward the system changes. The ANFIS structure has five layers. The output of layer 1 defines the membership degree. The shape of the Gaussian membership function used in this layer is determined by the non-linear premise parameters. The layer 2 output represents the firing strength for the respective rule. The layer 3 normalizes the firing strength. With the help of the input variables, defuzzification is performed in layer 4. The linear parameters used for output membership function are called the consequent parameters. Finally, the summation is carried out in the last layer. The nodes in layer 1 and layer 4 are adaptive while the nodes in other layers are non-adaptive. The parameters used in the adaptive layer has been updated using the calibration dataset.
In the present work, Takagi-Sugeno type FIS with fuzzy c means (FCM) clustering method has been used because of the well-proven benefits of it over the other two methods viz. the subtractive clustering and the grid partitioning (Phate et al., 2019b). The FCM has been used for rule extraction and also for determining the membership function (MFs) of antecedents and consequents. The consequent and premise parameters have been updated during the learning process. The predictive network may fall in a local minimum because of the difficulty in complex problem-solving. Hence, for solving this problem, the optimization method viz. PSO and GA have been used for updating ANFIS network parameters. For that initially, the ANFIS model has been tuned using a hybrid learning algorithm, subsequently, the MFs and the parameters of each MFs have been optimized using this well-known optimization algorithm to tune the MFs for achieving lower error and improving model performance.
GA Optimized ANFIS
GA is a stochastic and investigative search-based optimization algorithm. In order to optimize the parameters of ANFIS, optimization techniques have been used. The well-known optimization algorithm based on a gradient like back-propagation has a drawback that it will easily trap in local maxima. In recent literature, many global optimization techniques have been used to train the ANFIS Model. shows the detailed flowchart applied for developing a GA optimized ANFIS model. The techniques like GA and PSO have been used by many researchers in recent years (Khandelwal et al., Citation2018; Wang et al., Citation2019) to optimize the performance of ANN and ANFIS. Moayedi et al. (Citation2019) have discussed and concluded that the most encouraging and influential factors in optimization using GA is a population’s size. The models are developed with crossover percentage (pc = 40%), mutation percentage (pm = 70%), mutation rate (mu = 0.15), and maximum iteration 1000.
Figure 4. Schematic of GA optimized ANFIS model
PSO Optimized ANFIS
Moayedi et al. (Citation2019) have discussed the most important and influential factors in optimization using PSO as the population size, the personal and global learning coefficient, viz. C1 and C2 respectively and the inertial weight (IW). shows the detailed flowchart applied for developing the PSO optimized ANFIS model.
Figure 5. Schematic of PSO optimized ANFIS model
Statistical Metrics
The performance of the developed models using ANFIS optimized using GA and PSO are examined and validated using the different statistical indices. The various error evaluation terms and goodness-of-fit measures used are defined by Equationequations (1(1)
(1) ) to (Equation6
(6)
(6) ). In the said equations N represents the sample size while Pi, and Oi represent the predicted and measured value of the ith sample, respectively. Also,
and
are the mean of the N measured and the predicted samples, respectively. Mean square errors (MSE) and Root mean square error (RMSE) are most commonly used as a measure of residuals. Their values equal to zero indicates the perfect forecasting and are defined by Equationequations (1
(1)
(1) ) and (Equation2
(2)
(2) ) respectively. The mean bias error (MBE) shown in Equationequation (3)
(3)
(3) is used to convey the average model bias. Its value equal to zero indicates the model predictions are unbiased.
Fractional bias (FB) well stated by Equationequation (4)(4)
(4) is used to decide the model’s prediction ability toward the ‘under prediction’ or the ‘over predictions’. Its positive value points toward the, ‘under prediction’ and the negative value, signifies the ‘over prediction’, while the value zero implies the perfect agreements.
Refined index of agreement (dr) is a refined version of index of agreement (d) introduced by Willmott et al. (Citation2012) is expressed in Equationequation (5)(5)
(5) . It is a descriptive statistical measure describing the model’s ability to produce error-free prediction. Its bounded value between −1 and 1 decides the extent to which the prediction made by the model will be agreed or not. Willmott et al. (Citation2015) have compared refined index of agreement (dr) with Nash and Sutcliffe’s coefficient of efficiency (NSE) and Legates and McCabe’s measure (E1). It shows the better utility of dr to judge the goodness-of-fit.
Value account for (VAF) also known as variance account for is one of the metrics used for indicating the prediction capability of the model. It is well-defined in Equationequation (6)(6)
(6) . Its value equals to a hundred indicates the model’s excellent performance.
Sensitivity Analysis
The recognition of the relative effect of each model input feature on the model output would be important in the applications using automatic weighing of fruits. The strength of the relation between
and
is well expressed by Equationequation (7)
(7)
(7) for sensitivity analysis using the cosine amplitude method (Mohamad et al., Citation2017). The value of
obtained for the model inputs viz. length, average width, depth, projected area view1, projected area view2, perimeter view1, and perimeter view2 are 0.9896, 0.9895, 0.9899, 0.9998, 0.9997, 0.9903, and 0.9901, respectively. Thus, it is worth to monitor all the extracted features as their
values are close to unity. The result of this section shows a good agreement with the previous studies (Phate et al., Citation2019a, Citation2019b).
Results and Discussion
This section presents the results obtained for various classification and weighing models. In total, four SVM classifiers and sixty-five different ANFIS weighing models are developed and the results obtained are compared and investigated using different statistical metrics explained in the previous section.
SVM Classification
Three diameters of the sweet lime fruit have been used as the input features for developing the SVM classifier. Using four different kernel functions the classifier has been developed and their performance has been evaluated. In order to calibrate the classifier in total 553 samples and for validation in total 240 samples have been used. shows the confusion matrix during calibration and validation of the classifier also, it shows the number of support vectors required. It shows least support vectors required for the SVM classifier using RBF kernel. illustrates the performance of the developed classifiers during calibration as well as validation. The average accuracy found for classifier using linear kernel is 96.11% and 97.29% during calibration and validation, respectively. Also, for polynomial kernel the classifier accuracy is noted as 96.56% and 97.71% during calibration and validation, respectively. Similarly, for the RBF kernel, the classifier accuracy is found to be 95.93% during calibration and 97.29% during validation. Lastly, for sigmoidal kernel, it is noted as 89.96% and 91.25% during calibration and validation, respectively.
Table 3. Confusion matrix for different SVM classifier and support vector (SV) count
Table 4. SVM classifier performance measure
Weighing Model Evaluation
ANFIS Cluster Size Optimization
In this section, fourteen different FCM clustered ANFIS models are evaluated by varying their cluster count from 2 to 15. The cluster size of the FCM clustered ANFIS network is optimized by ranking the model output using several statistical metrics like dr, RMSE, and VAF. In order to select the best cluster size, the model ranking procedure is followed. In which, the ranking of each statistical term used is done using the ordinal ranking method for both calibration and validation data. Lastly, for each model, the rank assigned is summed up. The model with the highest total rank is considered as an optimal model. The model with a cluster count fifteen shows the optimal performance. The same cluster count is then used throughout the work.
GA-ANFIS Models
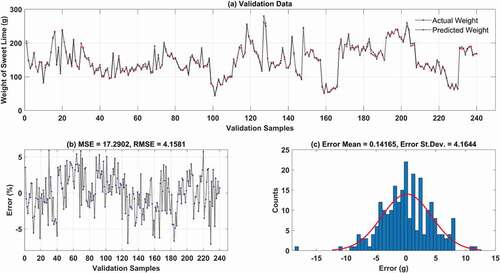
Using this hybrid network, fourteen different weighing models are evolved by changing the population size from 25 to 600. The convergence plot of various GA-ANFIS models for different population size is shown in . For determining the optimized model, the performance of the model during calibration and validation is ranked as shown in . The model with population size 75 shows the highest total rank which indicates the better performance of it over the other models. The results obtained for the proposed GA-ANFIS model with population size 75 during model validation is shown in . The MBE and FB found for the proposed GA-ANFIS model during model calibration are 0.0159 and −0.0001, respectively. While during model validation the said values are noted as −0.1417 and 0.00096, respectively.
Table 5. Analysis of population size and ranking of GA–ANFIS models
Figure 6. Performance of GA optimized ANFIS model for different population size
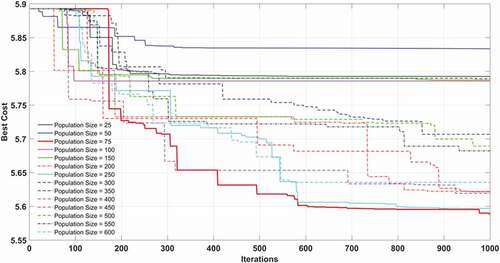
Figure 7. Proposed GA-ANFIS model validation. (a) Predicted and actual weight. (b) Error percentage. (c) Error histogram
PSO-ANFIS Models
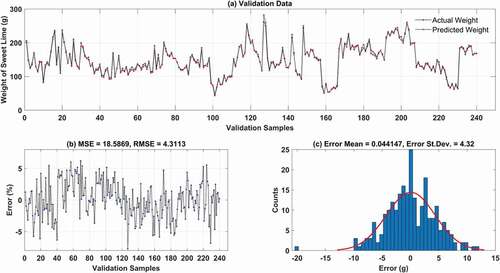
In this hybrid network in total thirty-seven models are developed and evaluated. The inertia weight damping ratio is kept as 0.99. The parameters of the PSO are judged through the trial and error process. At first, the population size is varied from 25 to 600, then the obtained optimized population is kept fixed, and both personal learning coefficients (C1) and global learning coefficients (C2) are change by trial and error. Lastly, by keeping the optimized population size, and learning coefficients fixed, the inertia weight (IW) is varied for 0.2 to 1.0. The performance of PSO-ANFIS models for different population size during calibration is shown in . shows the model with population size 300 has a maximum rank. shows that the model with the learning coefficients C1 = 1 and C2 = 2 has the optimal rank compared to the other models developed for different learning coefficients. Also, and show the performance of PSO-ANFIS modes during model calibration for different learning coefficients and different IW respectively. shows for different inertia weights the model with IW = 1, has the maximum rank. The results obtained for the proposed PSO-ANFIS model with population size 300, learning coefficients C1 = 1; C2 = 2 and IW = 1 during model validation is shown in . The MBE and FB found for the proposed PSO-ANFIS model during model calibration are −0.0084 and 0.00006, respectively, while during model validation the said values are noted as −0.0441 and 0.0003, respectively.
Table 6. Analysis of population size and ranking of PSO–ANFIS models
Table 7. Analysis of personal and global learning coefficients and ranking of PSO–ANFIS models
Table 8. Analysis of inertia weight and ranking of PSO–ANFIS models
Figure 8. Performance of PSO optimized ANFIS model for different population size
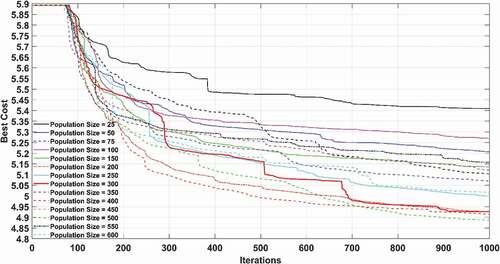
Figure 9. Performance of PSO optimized ANFIS model for different personal and global learning coefficients
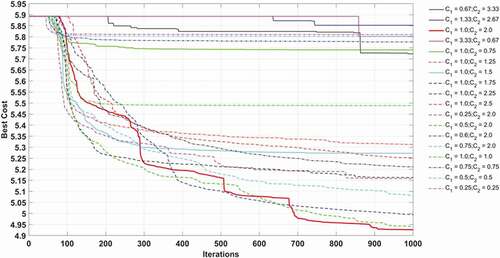
Figure 10. Performance of PSO optimized ANFIS model for different inertia weight
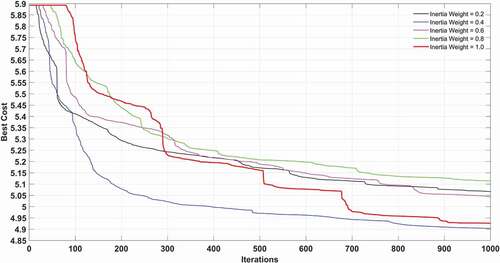
Figure 11. Proposed PSO-ANFIS model validation. (a) Predicted and actual weight. (b) Error percentage. (c) Error histogram
Assessments with Literature
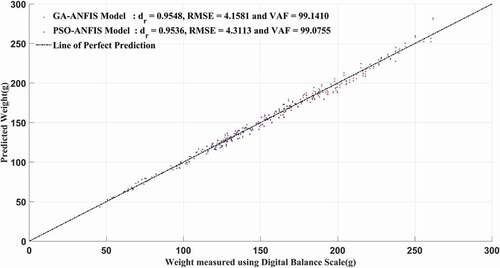
In this section, the comparison of the proposed model with the existing models is presented. For that, the best weighing models presented for sweet lime fruit are compared with the proposed model using the validation data set as shown in . It shows the best performance of the proposed GA-ANFIS model over the existing models. In , the comparison between the two optimized ANFIS models investigated in this work is shown.
Table 9. Comparison of the different sweet lime weighing models
Figure 12. Comparison of the optimized ANFIS models for validation samples
Conclusion
The SVM classifier developed using polynomial kernel shows better performance over the other classifiers during calibration as well as validation. The optimized ANFIS weighing models are proposed in this work using GA and PSO. The most influential parameters of GA and PSO are optimized using the trial and error process. Along with some important statistical terms, the ranking procedure is followed to judge the model’s optimal performance. In almost all predictive models, the higher value of dr, VAF and a low value of RMSE shows the learning process is excellent. The comparative result shows the superiority of the proposed hybrid GA–ANFIS model (dr = 0.9548, RMSE = 4.1581, and VAF = 99.1410) over the PSO-ANFIS model (dr = 0.9536, RMSE = 4.3113, and VAF = 99.0755) in predicting the sweet lime fruit weight. Also, the execution time required to calibrate the proposed optimized GA-ANFIS model (397.214 seconds) is very less as compared to the optimized PSO-ANFIS model (1334.6214 seconds) for a thousand iterations. The proposed model compared with the existing models shows its robustness and accurate prediction capability. The positive value of FB noted for both the models during model validation indicates their ability toward under prediction. The sensitivity analysis shows the higher impact of the projected areas on the predicted weight compared to other inputs applied to the model. Also, the strength of the relation found for all the inputs is more than 0.98 which shows the good relation between inputs and output. Since the weight estimation models mentioned in this work have a promising future, the prospects of this research work are listed below,
The mentioned indirect method of weight estimation will be helpful in the development and design of the weight-based post-harvested equipment for sweet lime fruits sorting, grading and packaging.
A similar approach can be useful for other axisymmetric fruits in estimating their weight as well as volume.
This may be the starting step toward the on-tree weight estimation of fruits to monitor their growth as well as the yield.
References
- Arun Kumar, R., V.S. Rajpurohit, and K.Y. Bidari. 2019. Multi class grading and quality assessment of pomegranate fruits based on physical and visual parameters. Nt. J. Fruit Sci. 19(4):372–396. doi: https://doi.org/10.1080/15538362.2018.1552230.
- Cubero, S., N. Aleixos, F. Albert, A. Torregrosa, C. Ortiz, O. Garcai-Navarrete, and J. Blasco. 2014. Optimised computer vision system for automatic pre-grading of citrus fruit in the field using a mobile platform. Precision Agric. 15(1):80–94. doi: https://doi.org/10.1007/s11119-013-9324-7.
- El-Mesery, H.S., H. Mao, and A.-F. Abomohra. 2019. Applications of non-destructive technologies for agricultural and food products quality inspection. Sensors 19(4):846. doi: https://doi.org/10.3390/s19040846.
- Ercisli, S., B. Sayinci, M. Kara, C. Yildiz, and I. Ozturk. 2012. Determination of size and shape features of walnut (Juglans regia L.) cultivars using image processing. Sci. Hortic. 133:47–55. doi: https://doi.org/10.1016/j.scienta.2011.10.014.
- Horticultural Statistics at a glance 2018 report, Horticulture Statistics Division, Dept. of Agric., Cooperation & Farmers Welfare, Ministry of Agric. & Farmers Welfare, Government of India. (2020, November 28) retrieved from http://agricoop.nic.in/sites/default/files/Horticulture%20Statistics%20at%20a%20Glance-2018.pdf
- Hossain, M.S., M. Al-Hammadi, and G. Muhammad. 2019. Automatic fruit classification using deep learning for industrial applications. IEEE Trans. Ind. Inf. 15(2):1027–1034. doi: https://doi.org/10.1109/TII.2018.2875149.
- Iraji, M.S. 2019. Comparison between soft computing methods for tomato quality grading using machine vision. J. Food Meas. Charact. 13(1):1–15. doi: https://doi.org/10.1007/s11694-018-9913-2.
- Jang, J.-S.R. 1993. ANFIS: Adaptive-Network-Based Fuzzy Inference System. IEEE Trans. Syst. Man Cybern. 23(3):665–685. doi: https://doi.org/10.1109/21.256541.
- Jorquera-Fontena, E., M. Genard, A. Ribera-Fonseca, and N. Franck. 2017. A simple allometric model for estimating blueberry fruit weight from diameter measurements. Sci. Hortic. 219:131–134. doi: https://doi.org/10.1016/j.scienta.2017.03.009.
- Keybondorian, E., B.S. Soulgani, and A. Bemani. 2018. Application of ANFIS-GA algorithm for forecasting oil flocculated asphaltene weight percentage in different operation conditions. Pet. Sci. Technol. 36(12):862–868. doi: https://doi.org/10.1080/10916466.2018.1447960.
- Khan, A.A., T. Mahmood, H.H. Siddiqui, and J. Akhtar. 2016. Phytochemical and pharmacological properties on Citrus limetta (Mosambi). J. Chem. Pharm. Res. 8(3):555–563.
- Khanali, M., M.G. Varnamkhasti, A. Tabatabaeefar, and H. Mobli. 2007. Mass and volume modelling of tangerine (Citrus reticulate) fruit with some physical attributes. Int. Agrophys. 21:329–334.
- Khandelwal, M., A. Marto, S.A. Fatemi, M. Ghoroqi, D.J. Armaghani, T.N. Singh, and O. Tabrizi. 2018. Implementing an ANN model optimized by genetic algorithm for estimating cohesion of limestone samples. Eng. Comput. 34(2):307–317. doi: https://doi.org/10.1007/s00366-017-0541-y.
- Khoshnevisan, B., S. Rafiee, and H. Mousazadehm. 2014a. Application of multi-layer adaptive neuro-fuzzy inference system for estimation of greenhouse strawberry yield. Measurement. 47:903–910. doi: https://doi.org/10.1016/j.measurement.2013.10.018.
- Khoshnevisan, B., S. Rafiee, M. Omid, and H. Mousazadeh. 2014b. Development of an intelligent system based on ANFIS for predicting wheat grain yield on the basis of energy inputs. Inf. Process. Agric. 1(1):14–22. doi: https://doi.org/10.1016/j.inpa.2014.04.001.
- Ladaniya, M.S. 2008. Citrus fruit: biology, technology and evaluation. Elsevier Inc., Atlanta, USA. doi:https://doi.org/10.1016/B978-012374130-1.50003-6
- Longvah, T., R. Ananthan, K. Bhaskarachary, and K. Venkaiah. 2017. Indian food composition tables. National Institute of Nutrition, India.
- Mahawar, M.K., B. Bibwe, K. Jalgaonkar, and B.M. Ghodki. 2019. Mass modeling of kinnow mandarin based on some physical attributes. J. Food Process. Eng. 42(5):e13079. doi: https://doi.org/10.1111/jfpe.13079.
- Miraei Ashtiani, S.H., A. Rohani, and M.H. Aghkhani. 2020. Soft computing-based method for estimation of almond kernel mass from its shell features. Sci. Hortic. 262:109071. doi: https://doi.org/10.1016/j.scienta.2019.109071.
- Miraei Ashtiani, S.H., J. Baradaran Motie, B. Emadi, and M.H. Aghkhani. 2014. Models for predicting the mass of lime fruits by some engineering properties. J. Food Sci. Technol. 51(11):3411–3417. doi: https://doi.org/10.1007/s13197-012-0862-1.
- Moayedi, H., M. Raftari, A. Sharifi, W.A.W. Jusoh, A. Safuan, and A. Rashid. 2019. Optimization of ANFIS with GA and PSO estimating α ratio in driven piles. Eng. Comput. 1–12. doi: https://doi.org/10.1007/s00366-018-00694-w.
- Mohamad, E.T., R.S. Faradonbeh, D.J. Armaghani, M. Monjezi, and M.Z.A. Majid. 2017. An optimized ANN model based on genetic algorithm for predicting ripping production. Neural Comput. & Applic. 28(Suppl S1):393–406. doi: https://doi.org/10.1007/s00521-016-2359-8.
- Moreda, G.P., J. Ortiz-Canavate, F.J. Garcia-Ramos, and M. Ruiz-Altisent. 2009. Non-destructive technologies for fruit and vegetable size determination– A review. J. Food Eng. 92(2):119–136. doi: https://doi.org/10.1016/j.jfoodeng.2008.11.004.
- Nanda, S.K., R.K. Vishwakarma, H.V.L. Bathla, A. Rai, and P. Chandra 2012. Harvest and Post harvest losses of major crops and livestock produce in India. All India Coordinated Research Project on Post-Harvest Technology, (ICAR), Ludhiana.
- Omid, M., M. Khojastehnazhand, and A. Tabatabaeefar. 2010. Estimating volume and mass of citrus fruits by image processing technique. J. Food Eng. 100(2):315–321. doi: https://doi.org/10.1016/j.jfoodeng.2010.04.015.
- Otsu, N. 1979. A threshold selection method from gray-level histograms. IEEE Trans. Syst. Man Cybern. 9(1):62–66. SMC doi:https://doi.org/10.1109/TSMC.1979.4310076.
- Pathak, S.S., R.C. Pradhan, and S. Mishra. 2019. Physical characterization and mass modeling of dried Terminalia chebula fruit. J. Food Process. Eng. 42(3):e12992. doi: https://doi.org/10.1111/jfpe.12992.
- Phate, V.R., R. Malmathanraj, and P. Palanisamy. 2019a. Classification and weighing of sweet lime (Citrus limetta) for packaging using computer vision system. J. Food Meas. Charact. 13(2):1451–1468. doi: https://doi.org/10.1007/s11694-019-00061–3
- Phate, V.R., R. Malmathanraj, and P. Palanisamy. 2019b. Clustered ANFIS weighing models for sweet lime (Citrus limetta) using computer vision system. J. Food Process. Eng. e13160. doi: https://doi.org/10.1111/jfpe.13160
- Ponce, J.M., A. Aquino, B. Millan, and J.M. Andujar. 2018. Olive-fruit mass and size estimation using image analysis and feature modeling. Sensors 18(9):2930. doi: https://doi.org/10.3390/s18092930.
- Pu, -Y.-Y., D.-W. Sun, M. Buccheri, M. Grassi, T.M.P. Cattaneo, and A. Gowen. 2019. Ripeness classification of bananito fruit (Musa acuminata, AA): A comparison study of visible spectroscopy and hyperspectral imaging. Food Anal. Methods 12(8):1693–1704. doi: https://doi.org/10.1007/s12161-019-01506-7.
- Sabzi, S., P. Javadikia, H. Rabani, and A. Adelkhani. 2013. Mass modeling of bam orange with ANFIS and SPSS methods for using in machine vision. Measurement 46(9):3333–3341. doi: https://doi.org/10.1016/j.measurement.2013.06.005.
- Schulze, K., M. Nagle, W. Spreer, B. Mahayothee, and J. Muller. 2015. Development and assessment of different modeling approaches for size-mass estimation of mango fruits (Mangifera indica L., cv. ‘Nam Dokmai’). Comput. Electron. Agric. 114:269–276. doi: https://doi.org/10.1016/j.compag.2015.04.013.
- Sharifi, M., S. Rafiee, A. Keyhani, A. Jafari, H. Mobli, A. Rajabipour, and A. Akram. 2007. Some physical properties of orange (var. Tompson). Int. Agrophys. 21:391–397.
- Spreer, W., and J. Muller. 2011. Estimating the mass of mango fruit (Mangifera indica, cv. Chok Anan) from its geometric dimensions by optical measurement. Comput. Electron. Agric. 75(1):125–131. doi: https://doi.org/10.1016/j.compag.2010.10.007.
- Tiwari, S., R. Babbar, and G. Kaur. 2018. Performance evaluation of two anfis models for predicting water quality index of river Satluj (India). Adv. Civil Eng. 2018:10. Article ID 8971079 doi: https://doi.org/10.1155/2018/8971079.
- Utai, K., M. Nagle, S. Hammerle, W. Spreer, B. Mahayothee, and J. Muller. 2019. Mass estimation of mango fruits (Mangifera indica L., cv. ‘Nam Dokmai’) by linking image processing and artificial neural network. Eng. Agric. Environ. Food 12(1):103–110. doi: https://doi.org/10.1016/j.eaef.2018.10.003.
- Venkatesh, G.V., S.M. Iqbal, A. Gopal, and D. Ganesan. 2015. Estimation of volume and mass of axi-symmetric fruits using image processing technique. Int. J. Food Prop. 18(3):608–626. doi: https://doi.org/10.1080/10942912.2013.831444.
- Wang, B., H. Moayedi, H. Nguyen, L.K. Foong, A. Safuan, and A. Rashid. 2019. Feasibility of a novel predictive technique based on artificial neural network optimized with particle swarm optimization estimating pullout bearing capacity of helical piles. Eng. Comput. 1–10. doi: https://doi.org/10.1007/s00366-019-00764-7.
- Willmott, C.J., S.M. Robeson, and K. Matsuura. 2012. A refined index of model performance. Int. J. Climatol. 32(13):2088–2094. doi: https://doi.org/10.1002/joc.2419.
- Willmott, C.J., S.M. Robeson, K. Matsuura, and D.L. Ficklin. 2015. Assessment of three dimensionless measures of model performance. Environ. Model. Softw. 73:167–174. doi: https://doi.org/10.1016/j.envsoft.2015.08.012.
- Zhang, W., Q. Zhu, M. Huang, Y. Guo, and J. Qin. 2019. Detection and classification of potato defects using multispectral imaging system based on single shot method. Food Anal. Methods 12(12):2920–2929. doi: https://doi.org/10.1007/s12161-019-01654-w.