
 ?Mathematical formulae have been encoded as MathML and are displayed in this HTML version using MathJax in order to improve their display. Uncheck the box to turn MathJax off. This feature requires Javascript. Click on a formula to zoom.
ABSTRACT
Persimmon (Diospyros kaki) is an important, underutilized fruit crop of India. The thin layer drying of persimmon slices would make it a perfect snack that can be used in various recipes. The drying process of persimmon slices was optimized using Box–Behnken design in response surface methodology. Three categorical independent drying variables, such as temperature (50–70°C), air velocity (0.5–1.5 m/s), and sample thickness (4–8 mm), were considered for the study. The response variables include drying time, ascorbic acid content, browning index, and rehydration ratio were investigated. The air temperature and sample thickness showed a significant effect on drying time. Browning index and rehydration ratio were significantly affected by air temperature and air velocity. As per the given experimental design constraints, the optimum solutions obtained were air temperature (58°C), air velocity (1.40 m/s), and slice thickness (4 mm). The predicted responses for the optimized combination of the drying process were drying time (442.55 min), ascorbic acid (8.61 mg/g dry matter), browning index (0.396 absorbance unit), and rehydration ratio (5.47%). Therefore, this study would be beneficial for scaling up industrial drying of persimmon slices for commercial production to ensure smooth processing and achieve a profitable path.
Introduction
Persimmon (Diospyros kaki) belongs to the family Ebenaceae. The first persimmon fruits may have been cultivated at least a thousand years ago (Karaman et al., Citation2014). It is native to China and introduced later to Korea and Japan, where it is considered as a traditional crop (Giordani et al., Citation2011; Karaman et al., Citation2014). In India, it was introduced by European settlers in the last century. Now small orchards of persimmon are available in Jammu and Kashmir, Tamil Nadu, Himachal Pradesh, Uttar Pradesh, and in north-eastern India. It is a minor and underutilized fruit crop of India and is not popular among people besides having enormous health benefits (Subbarao and Vivek, Citation2017). The fruit is a good source of phenolic compounds, dietary fiber, and minerals, which makes this fruit a nutritious fruit (Luo, Citation2006). All of these nutrients are generally considered as functional components that act against free radicals and helps in diabetes, cardiovascular diseases and curing cancer (Giordani et al., Citation2011). The fruit is mostly eaten fresh due to its pleasant flavor and taste. It can also be frozen, canned and dried for improving the shelf-life (Subbarao and Vivek, Citation2017). Dried persimmon slices can be added as an ingredient in many products such as breakfast cereals, muesli, and snacks (Carcel et al., Citation2007; Jia et al., Citation2019; Senadeera et al., Citation2020).
Drying is considered as a vital approach in the processing of fruits and vegetables (Abano et al., Citation2014). In this process, the moisture content in the food material is removed to a certain level where the growth of spoilage microorganisms is checked. As a result, the shelf life of the product may be extended with reduced bulk volume and storage costs (Swain et al., Citation2012). In large-scale drying units, high temperature and air velocities could be used to reduce drying time (Kucuk et al., Citation2014). Drying at higher velocity (above 2.5 m/s) and high temperature (above 80°C) (Mothibe et al., Citation2011) might negatively affect the nutritional and textural properties of the food and increases the energy requirement (Sturm et al., Citation2012). Similarly, size and shape parameters play an important role in the drying of fruits and vegetables (Onwude et al., Citation2016). When dying process parameters (temperature, air velocity, and sample thickness) are not wisely selected, it may result in loss in volatile compounds, brown color, and caramel flavor of fruits and vegetables (Abano et al., Citation2014). Thus, selection of drying parameters and optimizing the drying process reduces energy requirement, thermal destruction, and to preserve the nutrient components in the final product (Gupta et al., Citation2013).
To improve and optimize any process, response surface methodology (RSM) is generally used in food processing (Vivek et al., Citation2016). RSM plays a major role in reducing the number of experiments to evaluate multiple variations and their interactions on the dependent variables (Burande et al., Citation2008). Many researchers worked on optimization of drying process of pear (Amiripour et al., Citation2015), tomato (Abano et al., Citation2014), tannia (Borah and Sit, Citation2015), and cauliflower (Gupta et al., Citation2013). However, few works are available in the literature on drying of persimmon (Demiray and Tulek, Citation2017; Doymaz, Citation2012; Jia et al., Citation2019), where ascorbic acid was identified as the essential bio-active compound present in persimmon. We suggested that the better quality of dried persimmon slices might be achieved by optimizing the drying process variables with respect to the ascorbic acid content, browning index, and rehydration ratio. Therefore, the main objective of this study was to study the effects of drying parameters (air temperature, air velocity, and sample thickness) on quality attributes such as ascorbic acid content, drying time, browning index, and rehydration ratio of the dried persimmon slices using RSM.
Materials and Methods
Sample Preparation
Uniform ripe fresh persimmon fruits were procured from the orchids of Dirang valley in Arunachal Pradesh, India. These fruits were shifted immediately to the laboratory within 10 h and stored at 4°C until drying. Fruits having uniform size and shape were selected for all the experiments. Before starting the drying experiment, cold samples were brought into ambient conditions. Peel portion of the fruit was removed with stainless steel knife, and remaining pulp portion was cut into 4, 6, and 8 mm thick slices using a manual slicer (Khawas et al., Citation2015).
Drying of Persimmon Slices
All dying experiments were performed on a laboratory-scale tray dryer (Armfield – UOP8-A, UK). The drier has proportional controllers for maintaining the airflow rate and temperature. Fresh air is drawn into the tunnel of the dryer using an axial flow fan impeller. The sliced samples were placed on the trays provided in the dryer. The trays were connected to a weighing balance. A digital anemometer (Airflow Instruments Anemometer LCA301, UK) was placed at the end of the tunnel to measure airflow velocity (Velic et al., Citation2004).
Drying Procedure
The dryer was operated at three different air velocities and temperatures of 0.5, 1, and 1.5 m/s and 50, 60, and 70°C, respectively. The drying surface was parallel to the flow of hot air. Thin slices of the sample were spread over the sample plate without touching the other. Weight loss was monitored at every 15 min time interval until constant weight was recorded. The final moisture content of dried persimmon slices was determined by oven method (Gupta et al., Citation2013). After completion of each drying experiment, the samples were immediately transferred into desiccators and cooled to room temperature. Finally, the dried slices were wrapped in aluminum foil and kept at −18°C for further analysis.
Experimental Design of the Drying Process
Box–Behnken Design (BBD) in RSM was selected for optimizing the process variables such as hot air temperature (A), air velocity (B), and sample thickness (C) on drying time (DT), ascorbic acid content (AA), browning index (BI), and rehydration ratio (RR) were investigated. BBD is a useful experimental design for drying experiments. It does not consider the combination of factors where all factors at lowest or highest levels (Bezerra et al., Citation2008). Independent variables and their level used for the drying experiments are presented in . The empirical model (quadratic) used for explaining the effects of factors on responses (Yr) is given in Eq. (1).
Table 1. The levels of different process variables in coded and actual forms for drying of persimmon slices
where a0, a1, a2, a3. a4, a5, a6, a7, a8, and a9 are the coefficients; X, Y, and Z are independent variables in coded values, and Rv represents the response variables.
Determination of Ascorbic Acid Content
The ascorbic acid content of the dried persimmon samples was determined by 2, 4-dichloro phenol indophenol dye method (Gupta et al., Citation2013). For preparing dye solution, 21 mg of sodium bicarbonate and 26 mg of 2,6–dichlorophenol indophenols were dissolved in small volume of distilled water and made up to 100 ml. The stock ascorbic acid standard solution (1 mg/ml) was prepared by dissolving 100 mg of ascorbic acid standard in 100 ml of 4% oxalic acid solution. Working standard was prepared by diluting 10 ml stock solution to 100 ml using 4% oxalic acid solution. Furthur 10 ml of working standard was diluted with 20 ml of 4% oxalic acid in a 250 ml conical flask and titrated against the dye (DV1 ml). The appearance of the pink color indicates the endpoint of titration and the dye consumed is equivalent to the amount of ascorbic aicd. To extract ascorbic acid from dried persimmon slices, 0.5 g of ground sample was mixed with 50 ml of 4% oxalic acid and centrifuged (Sigma Laborzentrifugen, 3-18 KS, Germany) at 3,000 rpm for 15 min.
Then, 20 ml of 4% oxalic acid was added to 10 ml of obtained supernatant, and the solution was titrated against the dye (DV2 ml) in triplicates. The quantity of ascorbic acid (mg/g) was calculated using the Eq. (2).
Browning Index
The nonenzymatic browning index was determined using spectrophotometric method (Abano et al., Citation2014). Then, 100 ml of 60% ethyl alcohol (v/v) was added to 4 g of dried ground persimmon powder. The mixture was kept in the dark chamber for 10 h. After the incubation period, the sample was stirred using magnetic stirrer at 500 rpm for 1 h and then the sample was filtered through filter paper (Whatman No. 42). Finally, the browning index (absorbance) of the filtrate was measured at 420 nm using UV-VIS spectrophotometer (Spectrascan UV-2600, Thermo Fisher Scientific, India) against 60% ethyl alcohol as blank. All the readings were taken in triplicates. The obtained absorbance values represent the degree of browning.
Rehydration Ratio
The rehydration ratio of dried persimmon slices was measured according to (Gupta et al., Citation2013). Ten grams of dried persimmon slices were taken into 150 ml container, and cold water (100 ml) was added to it. The container was covered with watch glass and heated gently for 20 min. After heating, the contents inside the container were filtered using filter paper. The filtrate was discarded, and the residue weight was recorded as sample weight after rehydration. The rehydration ratio was calculated using Eq. (3):
Statistical Analysis
The experimental values of each response were fitted to the quadratic equation to obtain a regression model using Design-Expert software (Version 7.1.0, SateEase Inc). Analysis of variance (ANOVA) was carried out to estimate the statistical significance of fitted equations and their parameters at a significant level of 95%. The capability of the regression equation to explain and predict the response values was determined against lake of fit test, coefficients of determination (R2), adjusted R2, adequate precision, and coefficient of variation (CV) and PRESS values.
Results and Discussion
Effect of Drying Parameters on Responses
Experimental combinations of all the three independent variables (factors) and their corresponding dependent variables (responses) are shown in . The upper and lower limits of each factor considered for the optimization study were based on the preliminary experiments. The optimization of these process variables was carried out using BBD of RSM. Second-order quadratic models for each response variable were obtained from multiple linear regression analyses of experimental values. ANOVA was used to identify the significance of the independent variables (). The adequacy check for the fitted regression models was determined using R2, adjusted R2, PRESS value, adequate precision, and coefficient of variation (CV). Highest R2 and adjusted R2 values are recommended. Lack of fit test was insignificant and CV values were less than 10 for all the suggested quadratic models, which is recommended (). The synergistic effects of two factors on given response variables were visualized based on the 3D surface plots generated by the RSM (). Similar adequacy measurements were considered for optimization of process variables in drying of tomatoes and cauliflower (Abano et al., Citation2014; Gupta et al., Citation2013).
Table 2. Box–Behnken design for three factors and results of DT, AA, BI, and RR
Table 3. ANOVA evaluation of linear, quadratic, and interaction terms for responses, and coefficient of prediction models
Figure 1. The effects of (a) temperature and air velocity, (b) temperature and sample thickness, and (c) air velocity and sample thickness on response surface plots of the drying time
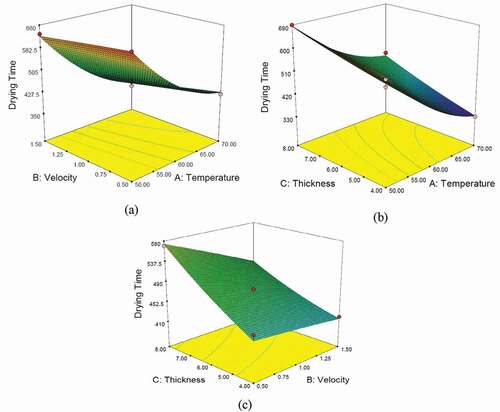
Figure 2. The effects of (a) temperature and air velocity, (b) temperature and sample thickness, and (c) air velocity and sample thickness on response surface plots of the ascorbic acid content
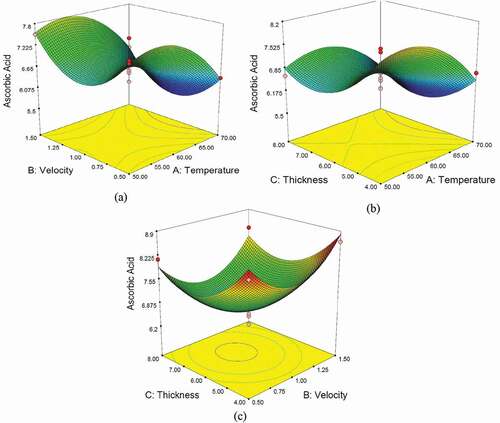
Figure 3. The effects of (a) temperature and air velocity, (b) temperature and sample thickness, and (c) air velocity and sample thickness on response surface plots of the browning index
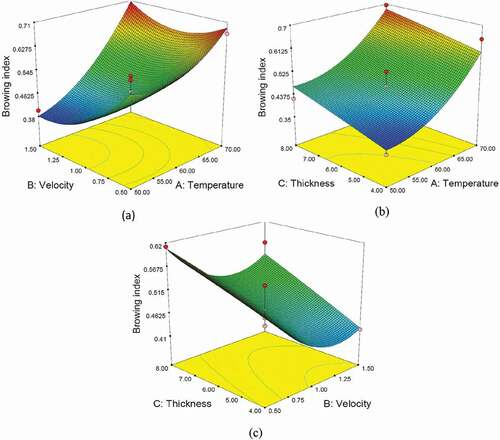
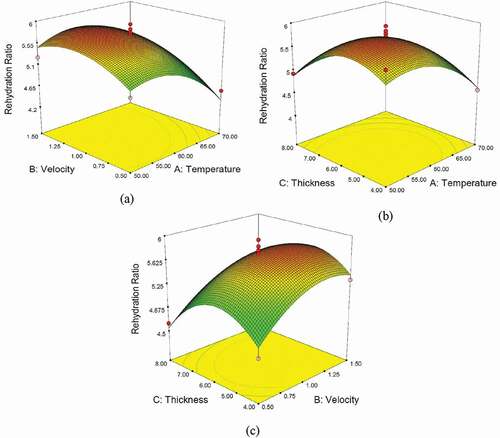
Figure 4. The effects of (a) temperature and air velocity, (b) temperature and sample thickness, and (c) air velocity and sample thickness on response surface plots of the rehydration ratio
Drying Time
Drying time is an important quality parameter in the drying of fruits and vegetables. Longer drying times diminish the nutritional value of dried product. Therefore, determination of optimum drying time is very important in drying process to maintain the quality of the product (Link et al., Citation2017). The drying time results of persimmon slices were obtained between 330 and 690 min at different drying conditions, i.e., temperature and air velocity (). As the drying temperature and air velocity increased drying time decreased. The second-order quadratic equation was obtained by fitting the drying time values as given in Eq. (4). All the linear terms in the quadratic model showed a significant effect on the drying time. While the quadratic and interaction terms showed insignificant difference at p > .05 (). The air temperature had the highest influence on the drying time followed by thickness and air velocity. The 3D figures showed that the drying time for persimmon slices decreased with increased drying temperature and air velocity (). The drying time of the persimmon slices increased with increased slice thickness. This may be due to the lower moisture diffusivity from the slices (Doymaz, Citation2012). Similar results were reported on tomato (Abano et al., Citation2014) and thyme (Doymaz, Citation2011) slices. The synergistic effect of air velocity and temperature of persimmon slices agreed with a similar study reported on drying of olive leaves. Where the minimum drying time was observed at the highest temperature but not at the high air velocity. The most effective temperature and air velocity obtained for olive leaves were at 70°C and 1.0 m/s, respectively (Erbay and Icier, Citation2010). This phenomenon is attributed to the case hardening of the dried products. In the study case, hardening of persimmon slices was attributed due to high temperature used in the drying process. Hence, drying of persimmon slices at higher temperatures is not recommended.
Ascorbic Acid Content
Ascorbic acid is a natural water-soluble heat-sensitive vitamin. Persimmon slices are a rich source of ascorbic acid; therefore, it is considered as an important quality parameter during drying. The ascorbic acid content of persimmon slices was obtained between 5.82 and 8.61 mg/g. Linear terms such as temperature and thickness in the quadratic model showed significant difference at p < .05. While all the interaction and quadratic terms showed insignificant (p > .05) and significant (p < .05) difference, respectively (). The ascorbic acid content was highly affected by the temperature followed by sample thickness and air velocity as shown in the Eq. (5). The ascorbic acid was found less at high drying temperature and less sample thickness. This may be due to the volatile nature of ascorbic acid (Nicoleti et al., Citation2007). All the quadratic terms in the equation showed significant difference at p < .05. The 3D figures () showed the effect of different factors on the ascorbic acid content during drying. Similar results were obtained for dried tomato (Abano et al., Citation2014) and cauliflower (Gupta et al., Citation2013). Where ascorbic acid content reduced with high drying temperature and less sample thickness. Djendoubi Mrad et al. (Citation2012) determined the ascorbic acid content of whole persimmon at 40–70°C and 0.8 –2.0 m/s. The study revealed that 38% and 93% of the ascorbic acid content were lost during drying process operated at 40 and 70°C drying temperature, respectively. Drying is attributed to the occurrence of irreversible oxidative reactions of the food products (Djendoubi Mrad et al., Citation2012). From the study, it can be concluded that the reduction of ascorbic acid content of all dried persimmon slices is caused by the combined effect of thermal and oxidative damage.
Browning Index
The color of a dried food product is closely associated with consumer preference. Drying imparts non-enzymatic browning reactions in the fruits and vegetables. Fruits like persimmon are highly susceptible to non-enzymatic browning because of high reducing sugars present in it (Karaman et al., Citation2014). Therefore, browning is considered an important quality attribute during the drying process (Khawas et al., Citation2015). The degree of browning mainly depends on the drying temperature and time. In the study, browning index was expressed as absorbance of ethanolic extract of dried persimmon observed at 420 nm. The higher the absorbance value the greater will be the browning index (Cernisev, Citation2010). Browning index values of dried persimmon slices ranged between 0.352 and 0.672 (Abs. unit). All the linear and interaction terms in the quadratic model were significant and insignificant at p < .05 and p > .05, respectively. While the quadratic terms of temperature and air velocity were found significant at p < .05 (). The browning index decreased with increased air velocity. This may be due to decrease in drying time with increase in air velocity and consequently less brown pigment formation (Cernisev, Citation2010). Drying temperature and slice thickness are the influencing factors for browning of persimmon slices (Eq. 6). Similar results were reported on drying of tomatoes (Abano et al., Citation2014) and cauliflower (Gupta et al., Citation2013). The 3D response surface graphs of persimmon slices also showed a similar trend ().
Rehydration Ratio
Rehydration is an important quality attribute depends on the microstructure of the dried product. The higher values of the rehydration ratio indicate the good quality of the final product (Swain et al., Citation2012). The rehydration ratio of persimmon slices ranged from 4.10 to 5.94%. Linear terms of air temperature and velocity in the quadratic equation showed significant effect at p < .05. All the interaction terms showed insignificant difference at p > .05 (). However, all the quadratic terms showed a significant effect on rehydration ratio. Drying air temperature had a higher influence on rehydration ratio followed by the air velocity and slice thickness. The rehydration ratio of dried persimmon slices decreased as the air temperature, and slice thickness increased (Eq. 7). This phenomenon may be due to the coagulation of proteins present in the fruit (Giordani et al., Citation2011). The heat generated during drying destroys the osmotic properties of the cell membrane, which results in less swelling of fruit slices (Galvez et al., Citation2008). The 3D surface graphs showed the increasing trend of rehydration ratio with the air velocity as shown in . Similar results were reported on drying of cauliflower (Gupta et al., Citation2013), at temperature (55–65°C) and air velocity (55–60 m/min). The rehydration of tannia slices initially decreased then increased to maximum with increase in air temperature (Borah and Sit, Citation2015). In case of persimmon, the rehydration ratio is found to be less at high temperature. This is due to the increased case hardening at higher temperatures used in the drying process, resulting in decreased moisture diffusivity (Abano et al., Citation2012). Hence, drying of persimmon slices may not be recommended at high temperature and increased slice thickness. Similar observations were also reported by other researchers on apple (Velic et al., Citation2004), water chestnut (Singh et al., Citation2008), and onion slices (Li et al., Citation2015).
Optimization of the Drying Parameters
Numerical optimization was performed for the process variables involved in the drying process of persimmon slices. The desired goals for each factor and response are presented in . The equal importance of “3” was assigned to all the variables involved in the optimization. Based on the given constraints, the RSM software-generated possible solutions for factors and their corresponding responses. The combination with highest desirability factor (0.81) was selected as the optimized solution for the drying of persimmon slices. The optimized values of factors obtained were 58°C air temperature, 1.40 m/s air velocity, and 4 mm slice thickness. At this optimum factors combination, the optimized response variables obtained were drying time (442.55 min), ascorbic acid content (8.61 mg/g dry matter), browning index (0.396 absorbance unit), and rehydration ratio (5.47%). The obtained combinations were repeated thrice for validation. The validation results are shown in .
Table 4. Optimization criteria for different factors and responses
Table 5. Predicted and experimental values for the responses at optimum conditions
Conclusion
In this work, the influence of air temperature, air velocity, and slice thickness on drying time, ascorbic acid content, browning index, and rehydration ratio of persimmon slices was investigated. BBD in RSM was used for optimizing the process variables involved in the drying process. Experimental data of each response was fitted to second-order polynomial equation. ANOVA was employed to estimate the statistical significance of model terms on response. 3D response surface plots were generated to visualize the interaction effect of all the factors. Results revealed that increased air temperature significantly reduced the drying time. Non-enzymatic browning index had significantly increased with temperature. The ascorbic acid content was also significantly affected by increasing air temperature and sample thickness. On the other hand, a significant increase in ascorbic acid content and reduced drying time was observed with an increase in air velocity. The numerical optimization predicted the overall optimum drying condition at 58°C, 1.40 m/s, and 4 mm for air temperature, air velocity, and slice thickness, respectively. At this optimum condition, the respective values of the drying time, ascorbic acid content, non-enzymatic browning index, and rehydration ratio were found to be 442.55 min, 8.61 mg/g dry matter, 0.396 absorbance unit, and 5.47%, respectively. From the study, it can be concluded that controlling the drying process significantly improved the quality of the final dried product.
References
- Abano, E.E., H. Ma, and W. Qu. 2012. Influence of combined microwave-vacuum drying on drying kinetics and quality of dried tomato slices. J Food Qual 35(3):159–168. doi: https://doi.org/10.1111/j.1745-4557.2012.00446.x.
- Abano, E.E., H. Ma, and W. Qu. 2014. Optimization of drying conditions for quality dried tomato slices using response surface methodology. J. Food Process. Preserv. 38(3):996–1009. doi: https://doi.org/10.1111/jfpp.12056.
- Amiripour, M., M.B. Habibi-Najafi, M. Mohebbi, and B. Emadi. 2015. Optimization of osmo-vacuum drying of pear (Pyrus communis L.) using response surface methodology. J. Food Meas. Charact. 9(3):269–280. doi: https://doi.org/10.1007/s11694-015-9232-9.
- Bezerra, M.A., R.E. Santelli, E.P. Oliveira, L.S. Villar, and L.A. Escaleira. 2008. Response surface methodology (RSM) as a tool for optimization in analytical chemistry. Talanta 76(5):965–977. doi: https://doi.org/10.1016/j.talanta.2008.05.019.
- Borah, P., and N. Sit. 2015. Optimization of drying conditions of xanthosoma sagittifolium (Tannia) tubers in tray dryer using response surface methodology. J. Food Process. Preserv. 39(2):190–198. doi: https://doi.org/10.1111/jfpp.12221.
- Burande, R.R., B.K. Kumbhar, P.K. Ghosh, and D.S. Jayas. 2008. Optimization of fluidized bed drying process of green peas using response surface methodology. Drying Technol. 26(7):920–930. doi: https://doi.org/10.1080/07373930802142739.
- Carcel, J.A., J.V. García-Pérez, E. Riera, and A. Mulet. 2007. Influence of high-intensity ultrasound on drying kinetics of persimmon. Drying Technol. 25(1):185–193. doi: https://doi.org/10.1080/07373930601161070.
- Cernisev, S. 2010. Effects of conventional and multistage drying processing on non-enzymatic browning in tomato. J Food Eng 96(1):114–118. doi: https://doi.org/10.1016/j.jfoodeng.2009.07.002.
- Demiray, E., and Y. Tulek. 2017. The effect of pretreatments on air drying characteristics of persimmons. Heat & Mass Transfer 53(1):99–106. doi: https://doi.org/10.1007/s00231-016-1797-2.
- Djendoubi Mrad, N., N. Boudhrioua, N. Kechaou, F. Courtois, and C. Bonazzi. 2012. Influence of air drying temperature on kinetics, physicochemical properties, total phenolic content and ascorbic acid of pears. Food Bioprod. Process. 90(3):433–441. doi: https://doi.org/10.1016/j.fbp.2011.11.009.
- Doymaz, I. 2011. Drying of thyme (Thymus Vulgaris L.) and selection of a suitable thin-layer drying model. J. Food Process. Preserv. 35(4):458–465. doi: https://doi.org/10.1111/j.1745-4549.2010.00488.x.
- Doymaz, İ. 2012. Evaluation of some thin-layer drying models of persimmon slices (Diospyros kaki L.). Energy Convers. Manage. 56:199–205. doi: https://doi.org/10.1016/j.enconman.2011.11.027.
- Erbay, Z., and F.I. Icier. 2010. Thin-layer drying behaviors of olive leaves (Olea Europalea L.). J Food Process Eng 33(2):287–308. doi: https://doi.org/10.1111/j.1745-4530.2008.00275.x.
- Galvez, A.V., R.L. Mondaca, C.B. Sainz, P. Fito, and A. Andres. 2008. Effect of air drying temperature on the quality of rehydrated dried red bell pepper (var. Lamuyo). J Food Eng 85(1):42–50. doi: https://doi.org/10.1016/j.jfoodeng.2007.06.032.
- Giordani, E., S. Doumett, S. Nin, and M. Del Bubba. 2011. Selected primary and secondary metabolites in fresh persimmon (Diospyros kaki Thunb.): A review of analytical methods and current knowledge of fruit composition and health benefits. Food Res. Int. 44(7):1752–1767. doi: https://doi.org/10.1016/j.foodres.2011.01.036.
- Gupta, M.K., V.K. Sehgal, and S. Arora. 2013. Optimization of drying process parameters for cauliflower drying. J Food Sci Technol 50(1):62–69. doi: https://doi.org/10.1007/s13197-011-0231-5.
- Jia, Y., I. Khalifa, L. Hu, W. Zhu, J. Li, K. Li, and C. Li. 2019. Influence of three different drying techniques on persimmon chips’characteristics: A comparison study among hot-air, combined hot-air-microwave, and vacuum-freeze drying techniques. Food Bioprod. Process. 118(1):67–76. doi: https://doi.org/10.1016/j.fbp.2019.08.018.
- Karaman, S., O.S. Toker, M. Çam, M. Hayta, M. Doğan, and A. Kayacier. 2014. Bioactive and physicochemical properties of persimmon as affected by drying methods. Drying Technol. 32(3):258–267. doi: https://doi.org/10.1080/07373937.2013.821480.
- Khawas, P., K.K. Dash, A.J. Das, and S.C. Deka. 2015. Drying characteristics and assessment of physicochemical and microstructural properties of dried culinary banana slices. Int. J. Food Eng.:667–678. doi: https://doi.org/10.1515/ijfe-2015-0094.
- Kucuk, H., A. Midilli, A. Kilic, and I. Dincer. 2014. A review on thin-layer drying-curve equations. Drying Technol. 32(7):757–773. doi: https://doi.org/10.1080/07373937.2013.873047.
- Li, W., M. Wang, X. Xiao, B. Zhang, and X. Yang. 2015. Effects of air-impingement jet drying on drying kinetics, nutrient retention and rehydration characteristics of onion (allium cepa) slices. Int. J. Food Eng. 11(3):435–446. doi: https://doi.org/10.1515/ijfe-2014-0269.
- Link, J.V., G. Tribuzi, and J.B. Laurindo. 2017. Improving quality of dried fruits: A comparison between conductive multi-flash and traditional drying methods. LWT. 84:717–725. doi: https://doi.org/10.1016/j.lwt.2017.06.045.
- Luo, Z. 2006. Extending shelf-life of persimmon (Diospyros kaki L.) fruit by hot air treatment. European Food Res. Technol. 222(1–2):149–154. doi: https://doi.org/10.1007/s00217-005-0156-1.
- Mothibe, K.J., M. Zhang, J. Nsor-atindana, and Y.-C. Wang. 2011. Use of ultrasound pretreatment in drying of fruits: drying rates, quality attributes, and shelf life extension. Drying Technol. 29(14):1611–1621. doi: https://doi.org/10.1080/07373937.2011.602576.
- Nicoleti, J.F., V. Silveira, J. Telis-Romero, and V.R.N. Telis. 2007. Influence of drying conditions on ascorbic acid during convective drying of whole persimmons. Drying Technol. 25(5):891–899. doi: https://doi.org/10.1080/07373930701370365.
- Onwude, D.I., N. Hashim, R.B. Janius, N.M. Nawi, and K. Abdan. 2016. Modeling the thin-layer drying of fruits and vegetables: a review. Compr. Rev. Food Sci. Food Saf. 15(3):599–618. doi: https://doi.org/10.1111/1541-4337.12196.
- Senadeera, W., G. Adiletta, B. Önal, M. Di Matteo, and P. Russo. 2020. Influence of different hot air drying temperatures on drying kinetics. Shrinkage and Colour of Persimmon Slices,** Foods 9(1):101–112.
- Singh, G.D., R. Sharma, A.S. Bawa, and D.C. Saxena. 2008. Drying and rehydration characteristics of water chestnut (Trapa natans) as a function of drying air temperature. J Food Eng 87(2):213–221. doi: https://doi.org/10.1016/j.jfoodeng.2007.11.027.
- Sturm, B., W.C. Hofacker, and O. Hensel. 2012. Optimizing the drying parameters for hot-air–dried apples. Drying Technol. 30(14):1570–1582. doi: https://doi.org/10.1080/07373937.2012.698439.
- Subbarao, K.V., and K. Vivek. 2017. Models for predicting the mass of persimmon (Diospyros kaki) fruits by some physical properties. Int. Food Res. J. 24(6):2353–2359.
- Swain, S., D.V.K. Samuel, L.M. Bal, A. Kar, and G.P. Sahoo. 2012. Modeling of microwave assisted drying of osmotically pretreated red sweet pepper (Capsicum annum L.). Food Sci. Biotechnol. 21(4):969–978. doi: https://doi.org/10.1007/s10068-012-0127-9.
- Velic, D., M. Planinić, S. Tomas, and M. Bilić. 2004. Influence of airflow velocity on kinetics of convection apple drying. J Food Eng 64(1):97–102. doi: https://doi.org/10.1016/j.jfoodeng.2003.09.016.
- Vivek, K., K. Subbarao, and B. Srivastava. 2016. Optimization of postharvest ultrasonic treatment of kiwifruit using RSM. Ultrason Sonochem. 32:328–335. doi: https://doi.org/10.1016/j.ultsonch.2016.03.029.