
 ?Mathematical formulae have been encoded as MathML and are displayed in this HTML version using MathJax in order to improve their display. Uncheck the box to turn MathJax off. This feature requires Javascript. Click on a formula to zoom.
ABSTRACT
Moisture content is an important quality feature that directly influences the storability of fruits and vegetables. The main goal of the present study was to estimate the drying behavior of apple slices (Malus Domestica) in a laboratory dryer at the drying temperatures of (40.9, 45, 55, and 65°C) and the time interval of (155.2, 180, 240, 300 and 324.9 minutes) with response surface method. The response surface methodology is used to optimize the dehydration of apple slices, and three thin-layer drying models are applied to the drying data. The effect of drying temperature and time interval tested at three levels on the percentage of moisture content, drying rate, hardness, and rehydration ratio were determined, with R2 values of 0.0761, 0.0519, 0.0564, and 0.2341, respectively. From the results, the actual optimum drying temperature with a time interval of 55°C and 240 min was better suited for the dehydration of apple slices. Therefore, the exact values of moisture content, drying rate, hardness, and rehydration ratio were noted in 11.40%, 0.030 (gwater. gdry. matter−1 cm−2 min−1), 2.35 N m, and 1.03 with a run factor of seven, respectively. Newton, Henderson & Pabis, and Page mathematical models are applied to the drying data, and consistent quality of the proposed models determined by using the calculation of the coefficient of determination (R2), reduced chi-square (X2), and root mean square error (RMSE). Further, from the results, it was conducted that the Newton model was better describing the data with R2, X2, and RMSE values of 0.9989, 0.00014, and 0.0145, respectively, of the apple slices. This manuscript will be helpful for researchers working on commercializing Apple slice processes in China as well as in other countries.
Introduction
Many types of the fruit must be processed to maintain their quality because they are seasonal, and their shelf life is limited. Apple (Malus Domestica) is a member of the Rosaceae family that also includes apricots, cherry, peaches, pear, and plum and is the most widely consumed fruit in the UK reported by (An et al., Citation2010). The total apple production for the year 2018/2019 is estimated at 576,850 MT (metric tons). In the year 2019/2020, the entire production is expected to reach a record level of 593,000 metric tons. The whole fruit is edible except seeds; apart from that many other products are produced from them: Ciders and juices, jams, compotes, tea, wine, or dry apples. They are irreplaceable in human nutrition since they increase immunity, have a positive effect on stress resistance, and they contain many bioactive substances that are beneficial for humans (Ullah et al., Citation2018).
Apple is the most vital nourishing garden fruit and is used as the fresh material for different foods. Doymaz (Doymaz, Citation2010) tried to decrease the spoilage of fresh apple fruits and dried them to prevent them from collapsing. He also reported that during drying, the temperature is the most critical parameter, which decreased the water activity level with the increase in temperatures. Similarly, water activity reduced in the drying also reduced the moisture content to the desired level reported by (Ullah et al., Citation2016a). Drying is a well-known method in food processing, aiming to decrease the moisture content in the fruits and increase the storage time without any significant changes in flavor, color (Vesali et al., Citation2011). Convective apple slice drying has thoroughly studied in a range of temperatures from 40°C to 90°C (Fahim et al., Citation2016b). Hot air drying of apples hastens color and aroma poverty and central to unwanted case-hardening (Yousaf et al., Citation2017). In the last era, substantial efforts were made to research and develop substitute technologies for apple slice drying, using microwaves, infrared, or vacuum freeze-drying in the range of temperature 35°C to 85°C (Seiiedlou et al., Citation2010). Azoubell and Francinaide (Azoubell and Francinaide, Citation2008) investigated the effect of dehydration on mango fruit by varying pressure (30–50 oC), solution concentration (40–60%), and immersion time (60–150 min); the maximum water removal was obtained under the optimal condition comprising sucrose solution of 44%, the processing time of 80 min, and temperature of 38 oC. Liu and Peng (Liu and Peng, Citation2017) studied the optimal conditions contained dehydration temperature of 59.5°C, time of 245.6 min, and sorbitol concentration at 66.8% with a response value of 52.5% for the water loss (WL) rate. Ibrahim and Fergun (İbrahim and Fergun, Citation2011) experimentally examined in a laboratory dryer at drying temperatures of 55, 65, and 75 ◦C and a constant air velocity of 2.0 m/s. The calculated effective diffusivity ranged from 8.059 × 10⁻¹¹ to 1.973 × 10⁻¹⁰ m2/s for the studied temperature range. The values of activation energy (Ea) were 22.01, 26.86, 30.31, and 30.99 kJ/mol for samples pretreated with citric acid; control samples, samples pretreated with ethyl oleate, and blanched samples, respectively. Shrestha et al. (Shrestha et al., Citation2020) test the utility of physical (hot-water, HWB and steam blanching, SB) and chemical (1% ascorbic acid, AA; and 1% citric acid, CA) treatments, alone or in combination in reducing surface discoloration as well as oxidative enzyme activity in apple slices (cv. Golden Delicious and Elstar) exposed to air at room temperature for 0, 30 and 60 min. However, the two apple cultivars (Golden Delicious and Elstar) showed great variation of color discoloration and sensitivity to the (EA) enzyme activity with the applied treatments at 30 min and 60 min air exposure at room temperature.
The response surface method (RSM) is an excellent approach used by many researchers to optimize their research studies’ various factors (Antal, Citation2015). Chong et al. (Chong et al., Citation2014) reviewed the combined effects of various components on biomass growth using RSM. Response surface method is a unique combination of mathematical and statistical approaches to evaluate the optimal conditions by reducing the number of experiments between factors and responses (Rakesh et al., Citation2014). (İsmail, Citation2016) optimized the effect of two independent variables (soaking temperature and steaming time) on the quality characteristics of parboiled rice. (Aktaş et al., Citation2009) also used the RSM for the optimization of drying conditions (temperature and drying time) to minimize the moisture content and rehydration ratio of peach fruits.
The study’s scope covers the optimization and mathematical modeling of Apple quality properties during the dehydration process by considering two independent variables (drying temperature and drying time). This study was carried out to investigate (1) the apple drying condition affected by process indicators (drying temperature and drying time) during the dehydration process to check the dried fruit moisture content, drying rate, hardens and rehydration ratio; (2) the prediction of dried apple slice quality indicators by mathematical modeling affected by two independent variables.
Methods and Materials
Description of Sample Preparation
The testing was carried out using an Apple (Malus Domestica) fruits, which purchased from a market in Nanjing, China. The samples were stored in a refrigerator at 4◦C until used. Before drying, the fruits were washed with tap water, peeled and sliced manually. The average moisture content of fresh fruits was determined by using an oven (Memmert UM-400) drying method at 105 ± 1°C for 24 h (w.b.) and was found to be 83.3% ± 0.3 for Apples on a wet weight basis. The moisture content was determined by taking the initial weight and final weight after 24 hours of drying in the oven with the help of an electric balance and the moisture lost determined by the given equation (2). The moisture content in apples was determined in one-hour intervals of drying until it reached an equilibrium value of 10% which is recommended to reduce insect attack, molds, and bacteria.
Description of the Experimental Procedure
Before starting the experiment, samples were washed from unwanted materials with tap water. Apples of uniform size and color were selected for the experiments. The apples were cored using a stainless-steel corer of 250 mm (Lurch AG, Hildesheim, Germany) and sliced to 5 mm thickness using an electrical slicer (Graef, Allesschneider Vivo V 20, Arnsberg, Germany). Apple slices were cut into equal outer diameter using a cookies dicer of 620 mm diameter (Lurch AG, Hildesheim, Germany).
A total of 300 g samples were used for the experiments. After this, the samples were pretreated with 1% preservative solution of citric acid and dipped for 3 min for reducing the browning phenomena during drying for achieving high-quality and less degradation. After pretreatment with a preservative solution, the sample was subjected to dehydration until moisture content becomes less than 20%. Then, apple samples were dried in an oven at different temperatures with a different time interval, and we designed the experiment using a Design Expert® 8.0.6 (Stat-Ease, Inc., USA). All analyses were performed in the laboratory with triplicates. Hot air drying tests were conducted in a convective oven (Zanussi FCV/E6L3) with an airspeed of 2.3 m/s. Weight changes during hot air drying from a moisture content of about 83.3% ± 0.3 to a 15.1%± 0.2 moisture content with different time intervals were registered offline and online, respectively, by a technical balance (Gibertini EU-C1200 RS). shows a central composite design (CCD) design for independent variables of temperature and time with the coded and actual factors.
Table 1. Design of CCD for independent variables in coded and actual forms of factors
Description of Texture Analysis
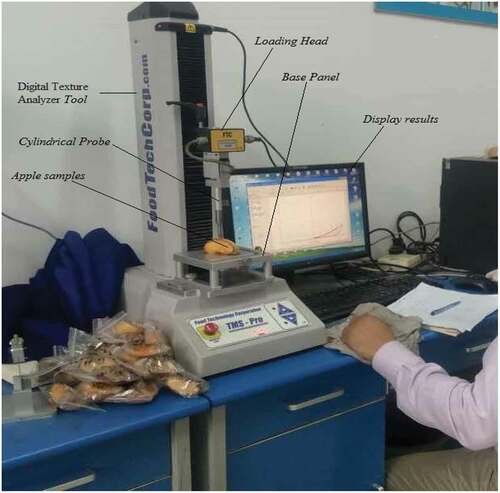
shows that the dried apple sample was placed horizontally on the texture analyzer’s baseplate with a 5.0 mm clearance. The hardness (Nm) of the sample was measured regarding the elastic force (Rakesh et al., Citation2014). The texturometer (Model, TPA-XT2 Stable Micro Sys., UK) was used for texture analysis with TPA test (texture profile analysis test). As shown in , the apple samples were placed horizontally on the base plate with a clearance of 3.0 mm and a flat loading head of 1.0 mm thickness was used with a deformation rate of 0.5 mm/s. The load of 0.15 N was applied to each dried sample of apple fruit with the texture lab computer program’s help up to 5% accuracy level to measure the force (N). The parameters were analyzed before and after drying with the hardness, and the samples were subject to a constant compression speed of 20 mm min−1 at room temperature. All the replicated dried apple samples were tested for hardening, and the average values of replication were stated as final hardens of the example.
Figure 1., Photographic view of two-point bending deformation of apple
Rehydration Ratio
For the rehydration ratio, the dried samples are allowed to stabilize at room temperature. Before putting the dehydrated apple slices for the rehydration in the water bath, firstly, about 3 g of the dried samples were added in the 300 ml purified water in a 600 ml beaker and then put in the water bath with the temperature of 70 °C (±1 °C) for 180 min with the experimental procedure. Glass beaker placed on a temperature-controlled stirrer. A perforated lid was used to keep the samples at the bottom of the glass beaker during rehydration. Samples were removed after 180 min, dried with tissue paper, and the samples’ weight is measured using a sensitive balance at 10 min intervals. The rehydration process terminated once the examples gain about 30% of the moisture removed during drying. The sample’s rehydration rate is determined from Equationequation (1)(1)
(1) reported by (Baigvand et al., Citation2015).
Description of Moisture Content and Drying Rate
Moisture content (w.b) of the samples is determined with a time interval of drying and calculated from equation (2) cited in the literature by (Fahim et al., Citation2016). The symbols represent in the comparison, “Mc” moisture content (% w.b), “Wi” initial weight (g), and “Wf” final weight (g). Moisture ratio (MR) is determined from equation (3) reported in the literature (Fahim et al., Citation2017). In equation (3), the symbol “Mt” denoted the moisture content at the time interval of drying (%), “Mi” is the initial weight (g), and Me represents the equilibrium moisture content (%).
(2)
Therefore, the drying rate (gwater.gdrymatter−1 cm−2 min−1) of apple slices derived from EquationEquation (4)(4)
(4) . Where “Mt+dt” represents the moisture content at “t+ dt” and “t” is the time (min).
Mathematical Modeling of Drying Curves
shows the thin-layer drying models used to determine the moisture ratio, the drying time function – the selected thin-layer drying models fitted to the drying curves (MR versus time). The estimation of the coefficient of the given models the nonlinear estimation package (SPSS 7.1) used.
Table 2. Mathematical models applied to the Malus Domestica apple slices drying curves
For describing the model for the drying curves, the ratio of R2 is one of the primary criteria. Further, to evaluate the fit’s quality, the values of R2, X2, and RMSE are the parameters determined from EquationEquations (5(5)
(5) –Equation6
(6)
(6) ). Such as “MR,act,i” and “MR,pre,i” represented the actual and predicted dimensionless moisture ratios, respectively; “N” is some observations, and “z” is some constants which are shown in the given below equations. The samples’ drying characteristics were chosen to describe the model values with the highest coefficient of R2, the least amount of X2 and RMSE stated by the (Yousaf et al., Citation2017).
Description of Experimental Design
shows the layout of a central composite design CCD for independent variables in coded and actual forms of factors. The RSM combined with the central composite design was used to investigate the effect of two factors on the response surface in the area of study. A CCDwith two factors at five levels was investigated (Yousaf et al., Citation2017). The present research conducted with 13 experiments was performed according to the designing of design Expert software usage and determined by 2k + 2k + 5, where k is the total number of factors in the experiment. The responses related to the elements by linear or quadratic models are shown in the following EquationEquation (7)(7)
(7) reported by (Yousaf et al., Citation2017).
Design Expert 8.0.6 (Stat-Ease, Inc., USA) software used to apply CCD design, while the software SPSS Statistics 24.0 analysis of variance (ANOVA) was applied between independent variables and responses. For the estimation of pure error, 13 experiments were carried out with a combination of three-time replicated. The coefficient of determination (R2) determined the model’s suitability, while F-test was used for the significance of the data.
Results and Discussion
CCD and Model Development
In the experiment of drying the Malus Domestica L, apple fruits consist of two significant steps, i.e., temperature (40.86, 45, 55, 65 and 69.14°C) and time interval (155.15, 180, 240, 300 and 324.85 min).
The drying process benefits with the different temperatures and different time intervals are generally to obtain a maximum reduction of moisture content, drying rate hardens, and the rehydration ratio of apples and increase nutritional value and achieve resistance to spoilage by insects. Drying is a significant factor in the dehydration of fruits, but the current study evaluated the two elements at different temperatures with a different time interval. These two factors were chosen as independent variables, and their effect on the responses of moisture content, drying rate, hardness, and the rehydration ratio of the dried apples were determined. shows the actual responses and predicted values of each run for moisture content, drying rate, hardness, and apple rehydration. According to the reference reported (Yousaf et al., Citation2017), they also used the CCD model for the experiment paddy parboiling consisting of three significant steps, soaking, steaming, and drying of rough rice before milling. Another study (Carranza-Concha et al., Citation2012; Hassan-Beygi et al., Citation2009) experimented with the handling of CCD models for dehydration of different fruits. They reported that the neural network estimated the moisture content of apples with higher accuracy than the previous one (0.92). These procedures appeared to be a suitable method for the assessment of apples’ moisture content, nondestructively.
Table 3. Actual and predicted values for moisture content, drying rate, hardness, and re-hydration of apple
shows the regression equation in the original form with R2, Adj. R,2 and Lack of Fit. However, the moisture content, drying rate, hardness, and rehydration were positively affected by the temperature and time interval. The finding results nearly matched with the references reported (Igual et al., Citation2012). They reported that the optimal condition was validated and found to be fitted well with the experimental data. Therefore, osmotic dehydration of strawberry highly depends on osmotic temperature, time, and solute concentration. (Doymaz, Citation2009) Stated results are similar to our findings for the regression equation used for the dehydration of apple fruits. That the coefficient R2 of the regression model was 0.990, greater than 90%, indicating the significant relationship between the independent and response value.
Table 4. Regression equation in the original form with R2, Adj. R2 and Lack of Fit
Moisture Content
Moisture content was the removal of water content from the sample through a dehydration process. Form the results, the least value of MC (%) was obtained on the run of seven (7) when the drying temperature and time interval were 55 °C and 155.15 min, respectively. In contrast, the highest values of MC (%) were noted 32.32% at the run of 12 (12), and these factors were 69 °C with the time of 240 min, respectively, as shown in . shows the inter-relationship between the drying temperature, time interval, and the apple fruits’ moisture content. The figure results clearly show that increasing the time interval while drying the sample’s moisture content removal increased. There is a direct relationship between the time interval and the moisture content. Shrestha et al. (Shrestha et al., Citation2020) stated that optimization of processing time and pre-treatments are crucial factors before apple drying to produce a high-quality product. They reported that the total color change (DE) for Golden Delicious was equal to 2.38, 2.68, and 4.05 after 0, 30, and 60 min of air exposure, respectively.
Figure 2., The moisture content (a), drying rate (b), hardness (c), and re-hydration ratio (d) concerning temperature (oC) and time interval (min)
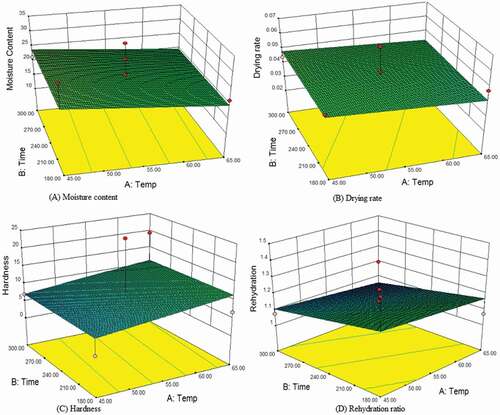
Further, the established linear equation’s implication was cross-checked with F-test, as shown in . The results are nearly matched with the results of the findings of the studies. They reported that removing moisture content increased with the time interval increase during the dehydration (Seiiedlou et al., Citation2010). Fahim and Kang, (Citation2017 stated results were in agreement with the findings of the present study. That the apples were dried at the range of 3.3 kg/m2s and 2.9 kg/m2s mass air velocity from 4.8 (gwater/gdry.matter) to 1.0 (gwater/gdry.matter) moisture content in the same period in a solar dryer. Another study (Mahesh et al., Citation2016) experimented and reported that time and moisture content have a direct relationship and stated that increasing time in dehydration removes moisture content increased.
The figure show results that the removal of moisture content increased with the increase in drying temperature. Our findings agreed with the study results (Igual et al., Citation2012). They reported that increasing the drying temperature decreased the moisture content in the products. Another survey (İbrahim and Fergun, Citation2011) also conducted research on the dehydration of apple fruits and reported results matched with our study; they stated that temperature is directly proportional to its moisture content. (Doymaz, Citation2009) conducted an experiment on the dehydration of banana fruits and stated results agreed with the present study; they noted that removal of moisture content increased with the increase in drying temperature. Ullah et al. (Ullah et al., Citation2018) Researched the dehydration of apple fruits using solar collectors. They stated that the removal of moisture content increased with the increasing drying temperature, which agrees with the study’s present results. The software analysis shows that the actual values for drying temperature and time intervals were 55 °C with 155.15 min, respectively, resulting in the actual moisture content of 11.40%. The response surface method generated by the equation for MC (%) using the linear model (R2 = 0.0761 and Adj R2 = −0.1087) is shown in .
Drying Rate
The relationship between the drying rate and the independent variables was captured with a linear model (R2 = 0.0519 and Adj R2 = – 0.1377), as shown in . shows the drying rate results concerning different drying temperatures and time intervals. Statistically, the analysis indicates that the drying temperature (p < .05) significantly affected the apple slices’ drying rate with the time interval. The maximum drying rate was noted from the experimental results at the run of 12 (12) of 0.063 (gwater.gdry matter−1 cm−2 min−1). Simultaneously, the minimum was recorded in the sequence of seven (7) of 0.030 (gwater.gdry matter−1 cm−2 min−1) when these factors of 55°C and 155.15 min and 69 °C with the time of 240 min, respectively. The figure shows the interrelation between the drying temperature, time interval, and the apple slices’ drying rate. It is indicated in the figure results that by increasing the drying temperature, the drying rate of the apple slices decreased, which is an indirect relationship between them. While there is a direct relationship between the time interval and drying rate shown in , which increases the time interval, it also increased the apple slices’ drying rate. The present study results agree with the findings by (Vesali et al., Citation2011). They reported that increasing the temperature decreased the drying rate of the product. Drying air temperature can be increased as the usage ratio of the internal air is increased; however, the drying air’s relative humidity will increase, and their moisture absorption capacity will decrease for the dryers. Another survey (Chong et al., Citation2014) also stated a direct relationship between the product’s time and drying rate, increased drying time, and increased drying rate. The drying rate decreases continuously with time and decreasing moisture content. The linear regression equation was validated by an F-test, as shown in .
Further, from the study results, the actual values of 0.030 (gwater.gdry matter−1cm−2min−1) for drying rate concerning drying temperature and time interval of 55°C with the time 155.15 min, respectively, and shows the generated equation of response surface method for drying rate. Drogoudi et al. (Drogoudi et al., Citation2008) reported the average drying rate values at 50, 60 and 70°C and air velocity of 1.2 m s−1 were as 0.0164, 0.025 and 0.0336 (gwater g dry solid−1 min−1), respectively. When the temperature was increased from 50 to 70°C, the drying rate almost doubled. Other researchers (Fudholi et al., Citation2010; Markowski et al., Citation2009; Vijayavenkataraman et al., Citation2012) experimented with the dehydration of apricots fruit and reported that the drying rate of the product increasing the temperature decreased the drying rate in the product. Misha et al. (Misha et al., Citation2015) stated that results were nearly matched with the study’s present results; they noted that increasing the time interval dehydration decreased the drying rate in the products. Carranza-Concha et al. (Carranza-Concha et al., Citation2012) found results using the study’s present results. They studied the drying behavior of red apples and were experimentally examined in a laboratory dryer at drying temperatures of 55, 65, and 75 ◦C and a constant air velocity of 2.0 m/s. It was observed that both the drying temperature and pre-treatment affected the drying time.
Hardness
Hardness is one of the essential factors in the dried products; it determined the dried products’ characteristics by measuring the products’ hardness. The relationship between hardness and the independent variables was generated with the linear model (R2 = 0.0564, Adj R2 = −0.1324, and Lack of Fit = 0.7869) shown in . The highest values of hardness were noted up to 24.40 N m at the run of twelve (12), while the minimum hardness was recorded up to 2.35 N m at the sequence of seven (7) when these factors of 55°C and 155.15 min and 69 °C with the time of 240 min, respectively. The statistical analysis shows a direct relationship between drying temperature and hardness because when the temperature increased, then the hardness of the products increased. The analysis indicated the relationship between time interval and hardness because shows a small effect on hardness concerning changing the time interval. The study results agreed with the findings (İbrahim and Fergun, Citation2011). They reported that Increased temperature and time above the optimum condition resulted in lower hardness. Similarly, increased time affected color and lightness and increased hardness and cooking time due to starch’s severe gelatinization.
Similarly, another study by (El-Shobaki et al., Citation2010; Rakesh et al., Citation2014) experimented with the dehydration of apricot fruits, and they noted the increasing temperature would affect the hardness of the products. shows the generated linear equation with the user response surface method and cross-checked with an F-test. From the results, the best drying temperature and time interval were 55 °C and 155.15 min, respectively. (Aktaş et al., Citation2009) reported results matched with the present results of the study. The dried products’ quality is characterized by the appearance, color, and other physical properties, such as shrinkage and porosity. The drying kinetics is greatly affected by air temperature and velocity and material characteristics. (İsmail, Citation2016) stated that the dehydration of agricultural products in the laboratory and industry. He noted that the best-suited drying was 55 °C, which agreed with the study’s present results.
Rehydration Ratio
The rehydration ratio is the process used for the determination of dried fruit quality. It indicated the chemical and physical properties during the drying as influenced by the processing conditions (Yousaf et al., Citation2017). From the results in , the maximum value of the rehydration ratio was recorded up to 1.23 at the run of twelve (12), while the minimum amount recorded up to 103 at the sequence of seven (7) when these factors of 55 °C and 155.15 min and 69 °C with the time of 240 min, respectively. EquationEquation (1)(1)
(1) is used to determine the rehydration ratio of apple slices at different temperatures with a different time interval, and the results shown in . The figure results show that increasing the drying temperature and the rehydration ratio of the dried apple slices decreased while increasing the time interval. The rehydration ratio is also reduced, which shows that it is inversely proportional between the drying temperature with different time intervals and the rehydration ratio. İbrahim and Fergun Citation2011) reported similar study results for water chestnut, which strongly agree with the current study’s findings. They noted that the rehydration ratio of the dried samples highest with decreasing the drying temperature. Azoubell and Francinaide (Citation2008) experimented and the results were contradictory with the study’s present results, he noted that dried samples treated with a citric acid preservative solution have the highest rehydration ratio, decreasing the time interval dehydration process. shows the relationship between the rehydration ratio and the independent variables of dried apple slices generated with the user of the linear model of R2, Adj R2, and lack of Fit with 0.2341, 0.0810, and 0.0875, respectively. The results agree with the findings (Fudholi et al., Citation2010; Markowski et al., Citation2009). They studied the fit quality of the proposed models was evaluated by using the determination of coefficient (R2), reduced chi-square (2), root means square error (RMSE), and mean relative percent error (P). They reported that the linear model was better at describing the R2 values.
Fitting of Drying Curves
shows the three thin-layer drying models provided from the experimental drying data. A linear regression model was used to obtain each parameter value of drying temperature with a time interval. The statistical results from the model applied to the experimental data were summarized in . The best model describing the thin-layer drying characteristics of apple slices chose one with the highest R2 values and lowest X2 and RSME values of the model from the statistical analysis.
Table 5. The criteria for fitting drying curves for the various mathematical models
shows that all the statistical parameters approximation cases R2, X2, and RSME values ranged from 0.9788 to 0.9989, 0.00014 to 0.00412, and 0.0145 to 0.2858, respectively. According to statistical analysis, the Newton model shows the highest R2 values of 0.9989 and the lowest values of X2 and RSME of 0.000142 and 0.0145, respectively, using 55°C drying temperature. The results are similar to the finding results by (Vesali et al., Citation2011). They conducted experiments on the dehydration of apple slices using different drying temperatures. They noted that the Newton model was better describing the thin-layer drying characteristics of apple slices. Other researchers (Antal, Citation2015; Doymaz, Citation2010) found results contradict the study’s present results; they noted that the Page model was best suited for describing the thin-layer drying characteristics of banana slices. Another survey by (Aktaş et al., Citation2009; Azoubell and Francinaide, Citation2008) reported results are nearly matched with the study’s present results. They studied that according to the statistical criteria (R2, SSE & RMSE), the Newton model was the best model to describe apple slices’ drying behavior.
Conclusion
In this paper, we have investigated the effect of different drying temperatures with a different time interval for the dehydration of apple slices (Malus Domestica). The response surface method used to optimize set responses, and Design Expert Software was used to determine actual values for resolving the variables’ regression equation. The results concluded that augmented arrangements of different drying temperatures and time intervals determined to improve the moisture content, drying rate, rehydration ratio, and fitting of drying curves. The drying process was observed to occur in the falling-rate period. Drying data obtained were fitted to three thin-layer drying models and goodness of fit determined using R2, X2, RMSE. According to the results, the Newton model gave better representation with the drying temperature of 55 °C of dried apple slices under all the preliminary heat with time interval conditions. Therefore, from the initial results, it was concluded that drying temperature with a time interval of 55 °C and 240 minutes were better suited for the dehydration of apple slices.
Recommendation
The experiments recommended that the drying temperature of 55 °C was better with the time interval of 240 min for the dehydration process. Further, supported that the linear model was a better representation with R2, Adj R2, and RMSE values, and also, the Newton model was best among the three thin-layer drying models for dried apple slices.
Author Contributions
The research article with several authors has their individual Contributions to work. Fahim Ullah and Kamran Hasrat conducted the experimental work; Methodology and formal analysis formatted by Fahim Ullah; Software used by Sami Iqbal ; Data Curation collected by Azam Hussian and Yasir Mumtaz; Writing-Original Draft Preparation; Writing-Review and Editing by Fahim Ullah, Kamran Hasrat, Sami Iqbal, and Imtiaz Hussain; Supervision, Fahim Ullah.
Acknowledgments
This work edited for proper English language, grammar, punctuation, Spelling and overall style by native English speaking editors at American Journal Experts (AJE).
The author(s) received no financial support for the research, authorship, and publication of this article.
Disclosure Statement
No potential conflict of interest was reported by the author(s).
References
- Aktaş, M., I. Ceylan, and S. Yilmaz. 2009. Determination of drying characteristics of apples in a heat pump and solar dryer. Desalination 239(1–3):266–275. doi: https://doi.org/10.1016/j.desal.2008.03.023.
- An, D., S. Arntfield, T. Beta, and S. Cenkowski. 2010. Hydration properties of different varieties of Canadian field peas (Pisum sativum) from different locations. Food Res. Int. (2): 520–525. doi: https://doi.org/10.1016/j.foodres.2009.09.034.
- Antal, T. 2015. Comparative study of three drying methods: Freeze, hot airassisted freeze and infrared-assisted freeze modes. Agron. Res. 13(4):863–878.
- Azoubell, P.M., and O.S. Francinaide. 2008. “Optimisation of osmotic dehydration of ’Tommy Atkins’ mango fruit. Int. J. Food Sci. Technol. 43(7):1276–1280. doi: https://doi.org/10.1111/j.1365-2621.2007.01605.x.
- Baigvand, M., A. Banakar, S. Minaei, J. Khodaei, and K.N. Behroozi. 2015. Machine vision system for grading of dried figs. Comput. Electron. Agric. 119:158–165. doi: https://doi.org/10.1016/j.compag.2015.10.019.
- Carranza-Concha, J., M. Benlloch, M.M. Camacho, and N. Martinez-Navarrete. 2012. Effect of drying and pretreatment on the nutritional and functional quality of raisins. Food Bio. Products Pro 90(90):243–248. doi: https://doi.org/10.1016/j.fbp.2011.04.002.
- Chong, C.H., A. Figiel, C.L. Law, and A. Wojdyło. 2014. Combined drying of apple cubes by using of heat pump, vacuum-microwave, and intermittent techniques. Food Bioprocess Technol. 7(4):975–989. doi: https://doi.org/10.1007/s11947-013-1123-7.
- Doymaz, I. 2009. An experimental study on drying of green apples. Drying Technol. 27:478–485. doi: https://doi.org/10.1080/07373930802686065.
- Doymaz, I. 2010. Effect of citric acid and blanching pre-treatments on drying and rehydration of Amasya red apples. Food Bioprod. Process. 88(2–3):124–132. doi: https://doi.org/10.1016/j.fbp.2009.09.003.
- Drogoudi, P., S. Vemmos, G. Pantelidis, E. Petri, C. Tzoutzoukou, and I. Karayiannis. 2008. Physical characters and antioxidant, sugar and mineral nutrient contents in fruit from 29 aprioct (Pruns armeniaca L). cultivars and hybrids. J. Agr. Food, Chem. 56:10754–10760. doi: https://doi.org/10.1021/jf801995x.
- El-Shobaki, F.A., A.M. El-Bahay, R.S.A. Esmail, A.A. Abd El-Megeid, and N.S. Esmail. 2010. Effect of figs fruits (Ficus carica. L) and its leaves on hyperglycemia in alloxan diabetic rate. World J. Dried. Food Sci. 5(1):47–57.
- Fahim, U., and M. Kang. 2017. Impact of air flow rate on drying of apples and performance assessment of parabolic trough solar collector. Appl. Therm. Eng. 127:275–280. doi: https://doi.org/10.1016/j.applthermaleng.2017.07.101.
- Fahim, U., M. Kang, X. Fu, and M. Jin. 2017. Performance estimation of solar collectors for dehydration process of apricot fruit with preservative solutions. Int. Agri. Eng. J. 26(2):164–172.
- Fahim, U., H. Lubna, M.M. Sohail, and H. Kamran. 2016. Effect of Irradiation on the Quality of Dried Figs. Res. J. Of App Sci. Eng. Tech. 12(10):1007–1010. doi: https://doi.org/10.19026/rjaset.12.2819.
- Fudholi, A., K. Sopian, M.H. Ruslan, M.A. Alghoul, and M.Y. Sulaiman. 2010. Review of solar dryers for agricultural and marine products. Rene. Sustain. Energy Revi. 14(1): 1-30.
- Hassan-Beygi, S.R., M. Aghbashlo, M.H. Kianmehr, and J. Massah. 2009. Drying characteristics of walnut (Juglans regia L.) during convection drying. Int. Agrophys. 23:129–135.
- İbrahim, D., and K. Fergun. 2011. Drying and rehydration behaviors of convection drying of green peas. Drying Technol. 29:11.
- Igual, M., M.E. Garcia, M.E. Martín-Esparza, and N. Martínez-Navarrete. 2012. Effect of processing on the drying kinetics and functional value of dried apricot. J. Food Res. Int. 47(47):284–290. doi: https://doi.org/10.1016/j.foodres.2011.07.019.
- İsmail, O. 2016. Effect of drying methods on drying characteristic. Energy 2(2):801–806.
- Liu, B., and B. Peng. 2017. Modelling and optimization of process parameters for strawberry osmotic dehydration using central composite rotatable design. J. Food Qual. 2017:1–7. doi: https://doi.org/10.1155/2017/2593213.
- Mahesh, K., K.S. Sunil, and K. Pankaj. 2016. Progress in solar dryers for drying various commodities. Rene. Sustain. Energy Revi. 55:346-360.
- Markowski, M., J. Bondaruk, and W. Blaszczak. 2009. Rehydration behavior of vacuum-microwave-dried potato cubes. Drying Technol. 27:296–305. doi: https://doi.org/10.1080/07373930802606600.
- Misha, S., S. Mat, M.H. Ruslan, E. Salleh, and K. Sopian. 2015. Performance of a solar assisted solid desiccant dryer for kenaf core fiber drying under low solar radiation. Solar Energy 112(112):194–204. doi: https://doi.org/10.1016/j.solener.2014.11.029.
- Rakesh, S., V.K. Joshi, and M. Kaushal. 2014. Effect of pre-treatments and drying methods on quality attributes of sweet bell-pepper (Capsicum annum) powder. J. Food Sci. Tech. doi: https://doi.org/10.1007/s13197-014-1374-y.
- Seiiedlou, S., H.R. Ghasemzadeh, N. Hamdami, F. Talati, and M. Moghaddam. 2010. Convective drying of apple: Mathematical modeling and determination of some quality parameters. Int. J. Agric. Biol. 12(2):171–178.
- Shrestha, L., B. Kulig, R. Moscetti, R. Massantini, E. Pawelzik, O. Hensel, and B. Sturm. 2020. Optimisation of physical and chemical treatments to control browning development and enzymatic activity on fresh-cut apple slices. Foods 9:1. doi: https://doi.org/10.3390/foods9010076.
- Ullah, F., M. Kang, L. Hassan, L. Ninghui, J. Yang, X. Wang, and M.K. Khattak. 2016a. Impact of drying method of figs with small-scale flat-plate solar collector. World J. Eng. 13:407–412. doi: https://doi.org/10.1108/WJE-08-2016-0054.
- Ullah, F., M.K. KhattaK, and L. Hassan. 2016b. Effect of irradiation on the quality of dried figs. Res. J. Appl.Sci. Eng. Technol. 12(10):1007–1010. doi: https://doi.org/10.19026/rjaset.12.2819.
- Ullah, F., K. Min, M.K. Khattak, S. Wahab, N. Wahab, M. Ameen, M.S. Memon, W. Xingsheng, A.S. Soomro, Y. Khurram, et al. 2018. Effects of different drying methods on some physical and chemical properties of loquat (eriobotrya japonica) fruits. Int. J. Fruit Sci. 18(4):345–354. doi: https://doi.org/10.1080/15538362.2018.1435330.
- Vesali, F., M. Gharibkhani, and M.H. Komarizadeh. 2011. An approach to estimate moisture content of apple with image processing method. Aust. J. Crop Sci. 5(2):111–115.
- Vijayavenkataraman, S., S. Iniyan, and R. Goic. 2012. A review of solar drying technologies. Rene. Sustain. Energy Revi. 16:2652–2670. doi: https://doi.org/10.1016/j.rser.2012.01.007.
- Yousaf, K., C. Kunjie, C. Cairong, A. Abbas, Y. Huang, C. Arslan, and Z. Xuejin. 2017. The optimization and mathematical modeling of quality attributes of parboiled rice using a response surface method. J. Food Qual. 2017:1–13. doi: https://doi.org/10.1155/2017/5960743.