
 ?Mathematical formulae have been encoded as MathML and are displayed in this HTML version using MathJax in order to improve their display. Uncheck the box to turn MathJax off. This feature requires Javascript. Click on a formula to zoom.
ABSTRACT
The main purpose of the present study is to predict the optimal values of the ultrasound-extraction conditions by employing the response surface method based on Box–Behnken design from Moringa oleifera leaves. The impact of three independent variables, namely the extraction time (5,15, and 25 min), solid to the solvent ratio (60%, 70%, and 80%), and ultrasonic amplitude (20%, 60%, and 100%) on the extraction yield and total phenolic/flavonoid content were studied. Analysis of variance (ANOVA) was employed to estimate the significance of the independent parameters and the model. An extraction time of 15 min, an ultrasonic amplitude of 100%, and a solid to solvent ratio of 80% were found to be optimal values. The findings of this investigation revealed that at optimal independent factors, the values of the extraction yield, total flavonoids, and phenolics content were found to be 83.75 mgL−1,50 mgL−1, and 0.974 g, respectively. The obtained results indicated that BBD-RSM design could effectively be used in the optimization of the ultrasonic-assisted extraction process. To the best of our knowledge, this is the first study assessing the effect of US power, time of extraction, and solid to the solvent ratio on the extraction yield and phenolics content/flavonoids content of Moringa oleifera leaves cultivated in Iran.
Introduction
In recent years, some reports suggested that leaf extracts of Moringa oleifera could exhibit antioxidant activity both in vivo and in vitro due to their large amount of flavonoid and phenolic acids (Vázquez-León et al., Citation2019; Vongsak et al., Citation2013). The extraction of polyphenols from natural plants is a critical step in sample pretreatment due to the possibility of the interaction of the phenolic compounds with other plant components, which in turn this process results in the co-extraction of undesirable by-products (Calinescu et al., Citation2017; Garcia-Salas et al., Citation2010). The efficiency of polyphenols extraction significantly depends on the extraction time and the polarity of the solvent as well as the method of the extraction (Jiang et al., Citation2019; Mani et al., Citation2007; Sungpud et al., Citation2020). Several environmentally friendly techniques are available for the extraction of bioactive compounds from bio-based materials (Dai et al., Citation2014; Oroian et al., Citation2020; Shirsath et al., Citation2012a). Compared to classical methods, ultrasound-assisted extraction is recognized as an efficient extraction technique, providing lower energy requirements and shorter extraction time (Vilkhu et al., Citation2008). The application of ultrasound (US) as a novel extraction method for assisting extraction from bio-based materials is extensively reviewed (Chemat et al., Citation2017). A number of studies investigated the impact of US on the extraction of biologically active compounds, such as polyphenols/methylxanthines from Camellia sinensis (Horžić et al., Citation2012), polyphenols from thyme leaves (Jovanović et al., Citation2017), capsicum oleoresin from hot chili pepper (Sricharoen et al., Citation2017), polysaccharides from Rhododendron leaves (Guo et al., Citation2017), phenolic compounds from palm pressed fibers (Dal Prá et al., Citation2017), antioxidant polyphenols from Mandarin (Şahin et al., Citation2018), polyphenols/flavonoids from Moringa oleifera seeds (Bindes et al., Citation2019), and polyphenols from chicory grounds (Pradal et al., Citation2016). However, most studies have employed low-frequency, high-power ultrasonic devices for intensifying the extraction process (Martínez-Ramos et al., Citation2020; Shirsath et al., Citation2012b). The nutritional value of Moringa oleifera differs depending upon genotype, environment, and cultivation methods (Pradal et al., Citation2016). The ultrasonic-assisted extraction of polyphenols widely depends on the extraction conditions applied, including ultrasound power, time, and solvent to solid ratio (Bimakr et al., Citation2012; Zhang et al., Citation2009). Although several research works have been performed on the ultrasonic-assisted extraction process of Moringa oleifera; however, the optimum extraction condition is not clear. Hence, the necessity of optimizing the extraction parameters for determining the best condition seems indispensable (Kırbaşlar and Şahin, Citation2021; Samli et al., Citation2020). Optimization of independent parameters in the extraction process by adopting conventional statistical methods, such as full factorial design, is much time-consuming and costly (Esonye et al., Citation2019; Kurtulbaş et al., Citation2019; Şahin et al., Citation2017). Nowadays, the response surface methodology (RSM) technique has been widely used as a powerful tool to determine the optimum condition of variables in several engineering fields (Barzegar et al., Citation2019; Şahin et al., Citation2020; Vebber et al., Citation2019). The works on the optimization of ultrasonic-assisted extraction using RSM have been widely investigated (Poyraz et al., Citation2021; Şahin et al., Citation2020).
The extraction of phenolic compounds from plants depends on several parameters, including geographical origin, plant variety, and extraction method. To the best of authors’ knowledge, this is the first report assessing the effect of the ultrasonic power, extraction time, and solvent ratio on the phenolics content/flavonoids compound of leaf extracts of Moringa oleifera leaves cultivated in Iran. Hence, the present study was devoted to investigating the effect of specific parameters (i.e., ultrasonic intensity, extraction time, and concentration of the solvent) on the total phenolics and flavonoids compounds extraction yield with the US treatment. Also, BBD-based RSM design was employed to model/predict the combination of independent parameters and their corresponding responses in the present work.
Material and Methods
Material
Moringa oleifera leaves were harvested from the Hormozgan Province of Iran. Fresh leaves were washed with distilled water twice and, finally, dried at room temperature (25 ± 2 °C) for 72 h. The dried leaves were milled into powder by using a laboratory mill, and a part of the resulting powder sample sieved through a 250 µm sieve. Finally, the prepared sample was stored in a dark bottle under lab conditions. All reagents, such as ethanol (99%), Folin-Ciocalteu reagents, sodium carbonate, sodium hydroxide, aluminum chloride, and sodium nitrite, were purchased from Merck. Also, quercetin and gallic acid were obtained from Sigma-Aldrich.
Ultrasound-Assisted Extraction
In this study, the US treatment was performed using an ultrasonic processor UP 200S (24 kHz, 200 W, Hielscher GmbH, Germany) equipped with a versatile power meter. Dried particles of Moringa oleifera leaves (3 g) were sonicated in round-bottom flasks with 120 mL of solvent. The extract was filtered using a filter paper (Whatman paper filter No. 5) and finally was concentrated as a powder at 40 °C by rotary evaporator.
Procedure
In this study, the method provided by Oldoni et al. (Citation2019) was used for the determination of total phenolic content (TPC) (Oldoni et al., Citation2019). Under dark conditions, 0.5 mL of extracts, 2.5 mL of Folin-Ciocalteu reagent diluted (1:10), and 2 mL of 4% Na2CO3 were vigorously mixed on a mechanical shaker for ~2 h. The absorbance was measured using a spectrophotometer (model JENWAY-6705 UV/VIS, UK) at 750 nm. Finally, the TPC content calculated using absorbance versus concentration curves of gallic acid (5 to 100 mgL−1), and the obtained results were illustrated as gallic acid equivalents (mgL−1).
Furthermore, total flavonoids (TF) content was also determined by the methodology provided by (Zhishen et al., Citation1999). In order to make 2 mL, distillate water was added, and then 0.15 mL NaNO2 was added. After 5 min, 0.15 mL AlCl3 (1:10) were added. Subsequently, the prepared sample was mixed well, and the absorbance was measured at 510 nm with a JENWAY-6705 UV/VIS spectrophotometer. The TF content was determined using a standard plot of quercetin (25–250 mg/mL) and the results of quercetin equivalent (QE) expressed in mgL−1.
Multi-Objective Optimization
In this study, the goal is mainly to evaluate the influence of the input parameters, including ultrasonic power, residence time, and solvent ratio, on the phenolics content and total flavonoids extraction yield, and then optimize the yield of the extraction process. RSM was performed using Box Behnken Design to evaluate the relationship between response parameters and input factors. The desirability function (DF) was used to find a multi-objective optimal solution. Design Expert 11 was applied to obtain the interaction of significant variables and to generate regression models. A quadratic regression model is expressed as follows (Jagadeesan et al., Citation2019; Safieddin Ardebili et al., Citation2019b):
where y is the corresponding responses (i.e., phenolics content and flavonoids extraction yield), Xi and Xj are input variables; n is the number of independent parameters; ,
,
, and
are the coefficients of regression models for the intercept, linear, quadratic, and interaction terms; ε is the experimental error term. The optimal values of the above-mentioned coefficients were calculated. The different stages of multi-objective optimization for the input/response using RSM are depicted in .
Figure 1. Design of experiment for extraction yield and total phenolic/flavonoid
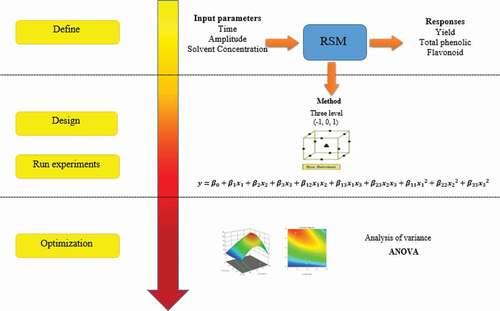
The independent parameters and their control levels are depicted in . In this study, the minimum amount of defined variables was the target to achieve maximum extraction yield.
Table 1. Independent parameters and range of variables used in this study
Besides, the analysis of variance (ANOVA) was employed to analyze the interaction between input parameters and determine the statistical significance (i.e., P-value and F-value) of the fitted quadratic models.
The optimal values of the studied parameters for the extraction process were calculated using the desirability approach and then validated by the experimental results. For simultaneous optimization, a desirability function was developed and is given below (Safieddin Ardebili et al., Citation2019a):
where are the response parameters, and n stands for the total number of the dependent factors. Different desirability functions can be utilized depending on whether a particular output parameter Yi is to be minimized or maximized (Candioti et al., Citation2014). If the specific parameter has to be minimized, the following equation describes the DF (
) (Giordano et al., Citation2020):
Similarly, if a specific response has to be maximized, DF(Yi), the desirability will be defined by the following equation (Giordano et al., Citation2020):
Maximizing the desirability function in the range of response defined is the primary goal of the optimization. In this investigation, the purpose of maximum extraction yield is employed to obtain the most significant value of desirability for dependent parameters.
Results and Discussion
The Effect of US Amplitude, Solvent Ratio, and Time on the Extraction Yield
Based on the numerical finding of BBD, the quadratic regression models for evaluating the US amplitude, solvent ratio, and extraction time on the extraction yield of the Moringa oleifera leaves are derived by RSM. presents the statistical analysis results for the yield of the extraction.
Table 2. ANOVA results for extraction yield
As depicted in , the model developed was significant in terms of the time of extraction and US amplitude at the 5% level. In addition, the fitted model was significant at the 5% level, indicating the model developed has a good fit for the above-mentioned factors. The lack of fit of the model was not significant at the level of 1%. Similar findings were also reported by other researchers (Şahin, Citation2015). The predicted second-order polynomial model for extraction yield based on the independent variables was estimated by using RSM-based BBD methodology (EquationEquation (5)(5)
(5) ):
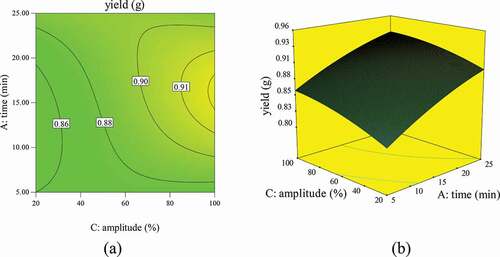
The second-order quadratic model was generated with an R-square of 0.95. F-critical values for extraction time, solvent ratio, and US amplitude were 27.22, 5.66, and 9.18, respectively. High F-value with a very low P-value (p < .001) indicates that RSM techniques could successfully model the extraction process. According to the F-values reported in , the parameter with a positive effect on the yield of extraction was the solvent ratio, followed by US amplitude. show the 3-D and 2-D representations of the interaction of residence and solvent ratio on the extraction yield.
Figure 2. 3-D and 2-D plots of yield against extraction time and solvent ratio

As shown in , the extraction yield first increased with increasing solvent ratio (up to 9.6%). This enhancement could probably be due to the increased propagation of ultrasonic waves in the solvent, leading to more solubility of the components (Shirsath et al., Citation2012a). Then, a decrease in extraction yield was observed at high levels of solvent ratio. According to the results in , by increasing the extraction time from 5 to 25 min, yield increased dramatically by ~8.3%. Also, the yield of extraction increased with enhancing of the solid-to-solvent ratio. A similar phenomenon has been observed by other researchers (Karabegović et al., Citation2013; Ma et al., Citation2008; Pan et al., Citation2003). depicted the effects of the US amplitude and time of extraction on the extraction yield, while the solvent ratio was kept constant.
Figure 3. 3-D/2-D plots of yield against of ultrasonic amplitude and extraction time
As can be seen in , increasing US amplitude from 20% to 100% lead to an increase in extraction yield from 0.85% to 0.92%. The increase in the US power could result in more efficient cavitation in the solution, leading to a shear/temperature gradient, thus intensifying the extraction process (Ma et al., Citation2008; Zhang et al., Citation2017).
The Effect of US Amplitude, Time on the Extraction, and the Solvent Ratio of Phenolic Compounds
The following mathematical representation of the model (EquationEquation (6)(6)
(6) ) for phenolic compounds with respect to the independent parameters was developed by applying RSM based on multi-variate regression analysis.
The significance and adequacy of the predicted model were analyzed by ANOVA. The ANOVA results of the model are illustrated in .
Table 3. ANOVA results for total phenolic compounds
shows that the interaction effect of extraction time was significant for extraction yield (p < .05). The model fitted the experimental data with an R-squared of 0.93. The lack of fit of the model was found to be significant. Similar results were also observed in the investigation by the Şahin et al. (Citation2018) who studied the US-assisted extraction of flavonoids/polyphenols from mandarin leaves (Şahin et al., Citation2018). shows the 2-D and 3-D plots of total PC for different solvent ratio (%) and extraction time (min).
Figure 4. 3D/2D plots of total phenolics content against solvent ratio and extraction time
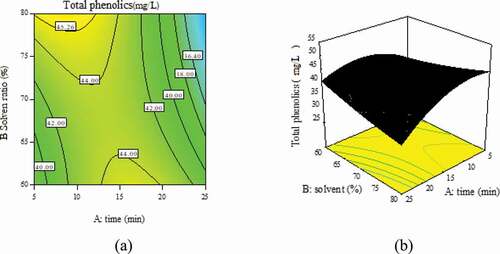
As shown in , when the ultrasonic was constant, with increasing the extraction time from 5 to 25, the extraction yield decreased by ~2.2%. The same trend also was observed for the extraction time. The longer the extraction times, the lower the extraction yield of total phenolics. This reduction can be due to the oxidation taking place when ultrasonic irradiation is employed (Rostagno et al., Citation2003). illustrates the 2-D/3-D response surface plots of total phenolics content against US amplitude and extraction time.
Figure 5. 3D/2D plots of total phenolic against of US amplitude and solvent ratio
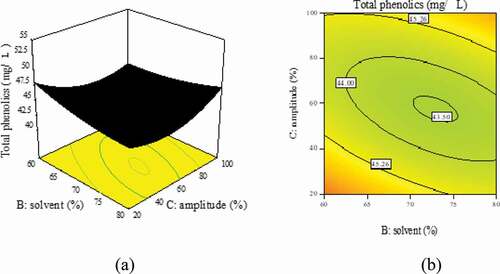
As depicted in , total phenolic content increased with an increase in US amplitude for all tests. With increasing US amplitude from 60% to 100%, the total phenolic content increased by about 5%. The maximum phenolic extraction was obtained at an extraction time of 15 min and US amplitude of 60%. A similar trend has also been observed in the previously reported investigation, in which Menezes et al. (Menezes et al., Citation2019) investigated the effect of ultrasonics on the extraction of bioactive compounds from green tea leaves. They stated that a US amplitude of 70% provided the highest concentration of total polyphenols/flavonoid.
The Effect of US Amplitude, Solvent Ratio, and Time on the Extraction of Total Flavonoids Content
The quadratic curve based on the independent variables derived from the RSM-based multivariate regression analysis of flavonoid is expressed by EquationEquation (7)(7)
(7) :
Also, an analysis of variance (ANOVA) was applied to determine the significance of independent parameters on total flavonoid extraction. The ANOVA results are summarized in .
Table 4. ANOVA results for the developed model based on RSM
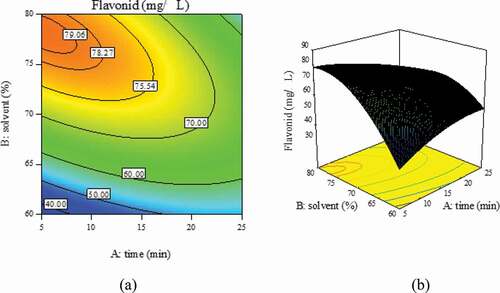
The F-values and P-values for all independent parameters are shown in . According to the results obtained, the P-value of the model is less than 0.05, indicating the fitted regression equation is considered to be statistically significant. The lack of fit value of the model was found to be 0.06, which is insignificant at 5% level. The value of lack of fit should be insignificant to provide the desired model (Şahin et al., Citation2020). This indicates that the proposed model is desired to predict. The coefficient of determination of the derived model was recorded as ~94%. The 3-D and 2-D response surface plots for identifying the optimal values of the independent variables and also determining the maximum flavonoid extraction condition are depicted in . It can be observed from that the extraction of flavonoids content first increased with increasing solvent ratio (up to 75%) in the extraction process. Then, a decrease in extraction yield was observed at high levels of solvent ratio. It was also found that, by increasing extraction time, the yield of the extraction first followed a rising trend and then a falling trend after the extraction time of 15 min. Similar results reported by (Wang et al., Citation2017), who investigated the super-subcritical ethanol extraction of flavonoids from the Moringa oleifera leaf (Wang et al., Citation2017). They stated that as the extraction time increased from 1.5 to 2 h, the flavonoids yield increased. Then, a remarkable decrease in flavonoids yield was observed as the time of extraction increased from ~2.1 to 2.5 h.
Figure 6. 3D/2D plots of total flavonoids content against of solvent ratio and extraction time
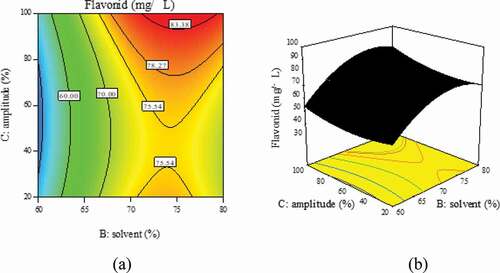
present the interactive effects of the US amplitude and solvent ratio on extraction yield while fixing other variables. A lower extraction yield is observed at a lower US intensity. The experimental results demonstrated that by rising from 40% to 100% in the US amplitude increased the extraction yield. The mechanism for US enhancement could be attributed to a disrupt plant cell wall due to the collapse of cavitation bubbles near cell walls, leading to higher extraction yield of flavonoids compounds from Moringa oleifera leaves (Albu et al., Citation2004)
Figure 7. 3D/2D plots of total flavonoid against solvent ratio and US amplitude
Multi-Objective Optimization
in this study, A desirability function (DF) has been used to evaluate the effects of residence time, US intensity, and solvent ratio on the extraction yield of different components of Moringa oleifera leaves. An optimal extraction condition can be achieved under the multi-objective constraints using the desirability function. The lower/upper limits, weight, and the significance of each input/output parameters are illustrated in . According to the multi-objective constraints, the maximum yield and flavonoid/phenolics content can be calculated using a numerical method.
Table 5. Constraints for multi-objective optimization
Considering the optimization constraints, the DF function offered different values for independent variables. The highest value of the DF was found to be 94% in the extraction process. The highest possible extraction yield and lower combined values of US amplitude, extraction time, and solvent ratio were predicted. According to the analysis of RSM-based BBD method, the solvent ratio of 80%, US amplitude of 100%, and extraction time of 15 min were determined as optimal conditions with a maximum extraction yield of 83.75 mgL−1, FC of 50 mgL−1, and TPC of 0.974 g, which was validated through laboratory experiments with an absolute error of less than 4%.
Conclusion
In present work, an optimized US-assisted extraction technique has been proposed as an alternative downstream process to extract high-added value components, that is, flavonoid and phenolics from Moringa oleifera leaves. The RSM based on BBD was successfully employed to identify the process factors that are most impacting on the extraction yield of FC/TPC content of Moringa oleifera. The results obtained indicate that ultrasonic extraction is a breakthrough process for extracting flavonoid/phenolic material from Moringa oleifera leaves. The results suggest that 15 min of extraction time, US amplitude of 100%, and solvent ratio of 80% should be applied as an optimal operating condition. Besides, the US-assisted extraction as a green, easy to set up, efficient and inexpensive separation technique could be an alternative to conventional extraction methods to achieve extracts rich in high-value added components.
Acknowledgments
We are grateful to the Research Council of Shahid Chamran University of Ahvaz for financial support (GN:SCU.AA98.29840).
Additional information
Funding
Literature Cited
- Albu, S., E. Joyce, L. Paniwnyk, J.P. Lorimer, and T.J. Mason. 2004. Potential for the use of ultrasound in the extraction of antioxidants from Rosmarinus officinalis for the food and pharmaceutical industry. Ultrason. Sonochem. 11:261–265. doi: https://doi.org/10.1016/j.ultsonch.2004.01.015.
- Barzegar, F., M. Kamankesh, and A. Mohammadi. 2019. Development and application of microwave-assisted extraction and advanced low density microextraction technique coupled with high-performance liquid chromatography for the successful determination of heterocyclic aromatic amines in barbecued meat sample and method optimization using response surface methodology. J. Food Meas. Charact. 13:1755–1764.
- Bimakr, M., R.A. Rahman, F.S. Taip, N.M. Adzahan, M. Sarker, Z. Islam, and A. Ganjloo. 2012. Optimization of ultrasound-assisted extraction of crude oil from winter melon (Benincasa hispida) seed using response surface methodology and evaluation of its antioxidant activity, total phenolic content and fatty acid composition. Molecules 17:11748–11762. doi: https://doi.org/10.3390/molecules171011748.
- Bindes, M.M.M., M.H.M. Reis, V.L. Cardoso, and D.C. Boffito. 2019. Ultrasound-assisted extraction of bioactive compounds from green tea leaves and clarification with natural coagulants (chitosan and Moringa oleífera seeds). Ultrason. Sonochem. 51:111–119. doi: https://doi.org/10.1016/j.ultsonch.2018.10.014.
- Calinescu, I., V. Lavric, I. Asofiei, A.I. Gavrila, A. Trifan, D. Ighigeanu, D. Martin, and C. Matei. 2017. Microwave assisted extraction of polyphenols using a coaxial antenna and a cooling system. Chem. Eng. Process. Process Intensif. 122:373–379. doi: https://doi.org/10.1016/j.cep.2017.02.003.
- Candioti, L.V., M.M. De Zan, M.S. Cámara, and H.C. Goicoechea. 2014. Experimental design and multiple response optimization. Using the desirability function in analytical methods development. Talanta 124:123–138. doi: https://doi.org/10.1016/j.talanta.2014.01.034.
- Chemat, F., N. Rombaut, A.-G. Sicaire, A. Meullemiestre, M. Abert-vian, A.-S. Fabiano-Tixier, and M. Abert-vian. 2017. Ultrasound assisted extraction of food and natural products. Mechanisms, techniques, combinations, protocols and applications. A review. Ultrason. Sonochem. 34:540–560. doi: https://doi.org/10.1016/j.ultsonch.2016.06.035.
- Dai, Y.-M., K.-T. Chen, and -C.-C. Chen. 2014. Study of the microwave lipid extraction from microalgae for biodiesel production. Chem. Eng. J. 250:267–273. doi: https://doi.org/10.1016/j.cej.2014.04.031.
- Dal Prá, V., F.C. Lunelli, R.G. Vendruscolo, R. Martins, R. Wagner, A.P. Lazzaretti Jr, D.M.G. Freire, M. Alexandri, A. Koutinas, and M.A. Mazutti. 2017. Ultrasound-assisted extraction of bioactive compounds from palm pressed fiber with high antioxidant and photoprotective activities. Ultrason. Sonochem. 36:362–366. doi: https://doi.org/10.1016/j.ultsonch.2016.12.021.
- Esonye, C., O.D. Onukwuli, and A.U. Ofoefule. 2019. Optimization of methyl ester production from Prunus Amygdalus seed oil using response surface methodology and artificial neural networks. Renewable Energy 130:61–72. doi: https://doi.org/10.1016/j.renene.2018.06.036.
- Garcia-Salas, P., A. Morales-Soto, A. Segura-Carretero, and A. Fernández-Gutiérrez. 2010. Phenolic-compound-extraction systems for fruit and vegetable samples. Molecules 15:8813–8826. doi: https://doi.org/10.3390/molecules15128813.
- Giordano, P.C., V. Pereyra, A.J. Beccaria, S. Vero, and H.C. Goicoechea. 2020. nnnnApplication of pareto-optimal front as an option to desirability function for the optimization of a microbiological process. Microchem. J. 104682. doi: https://doi.org/10.1016/j.microc.2020.104682.
- Guo, X., X. Shang, X. Zhou, B. Zhao, and J. Zhang. 2017. Ultrasound-assisted extraction of polysaccharides from Rhododendron aganniphum: Antioxidant activity and rheological properties. Ultrason. Sonochem. 38:246–255. doi: https://doi.org/10.1016/j.ultsonch.2017.03.021.
- Horžić, D., A.R. Jambrak, A. Belščak-Cvitanović, D. Komes, and V. Lelas. 2012. Comparison of conventional and ultrasound assisted extraction techniques of yellow tea and bioactive composition of obtained extracts. Food Bioprocess Technol. 5:2858–2870. doi: https://doi.org/10.1007/s11947-012-0791-z.
- Jagadeesan, G., K. Muniyandi, A.L. Manoharan, S. Thamburaj, S. Sathyanarayanan, and P. Thangaraj. 2019. Optimization of phenolic compounds extracting conditions from Ficus racemosa L. fruit using response surface method. J. Food Meas. Charact. 13:312–320. doi: https://doi.org/10.1007/s11694-018-9946-6.
- Jiang, Z., R. Shi, H. Chen, and Y. Wang. 2019. Ultrasonic microwave-assisted extraction coupled with macroporous resin chromatography for the purification of antioxidant phenolics from waste jackfruit (Artocarpus heterophyllus Lam.) peels. J. Food Sci. Technol. 56:3877–3886. doi: https://doi.org/10.1007/s13197-019-03858-8.
- Jovanović, A.A., V.B. Đorđević, G.M. Zdunić, D.S. Pljevljakušić, K.P. Šavikin, D.M. Gođevac, and B.M. Bugarski. 2017. Optimization of the extraction process of polyphenols from Thymus serpyllum L. herb using maceration, heat-and ultrasound-assisted techniques. Sep. Purif. Technol. 179:369–380. doi: https://doi.org/10.1016/j.seppur.2017.01.055.
- Karabegović, I.T., S.S. Stojičević, D.T. Veličković, N.Č. Nikolić, and M.L. Lazić. 2013. Optimization of microwave-assisted extraction and characterization of phenolic compounds in cherry laurel (Prunus laurocerasus) leaves. Sep. Purif. Technol. 120:429–436. doi: https://doi.org/10.1016/j.seppur.2013.10.021.
- Kırbaşlar, Ş.İ., and S. Şahin. 2021. Recovery of bioactive ingredients from biowaste of olive tree (Olea europaea) using microwave-assisted extraction: A comparative study. Biomass Convers. Biorefin. 2021 Jan 6. 1–13. https://doi.org/https://doi.org/10.1007/s13399-020-01194–y
- Kurtulbaş, E., D. Makris, and S. Şahin. 2019. Optimization of bioactive substances in the wastes of some selective Mediterranean crops. Beverages 5:42. doi: https://doi.org/10.3390/beverages5030042.
- Ma, Y., X. Ye, Y. Hao, G. Xu, G. Xu, and D. Liu. 2008. Ultrasound-assisted extraction of hesperidin from Penggan (Citrus reticulata) peel. Ultrason. Sonochem. 15:227–232. doi: https://doi.org/10.1016/j.ultsonch.2007.03.006.
- Mani, S., S. Jaya, and R. Vadivambal. 2007. Optimization of solvent extraction of Moringa (Moringa oleifera) seed kernel oil using response surface methodology. Food Bioprod. Process. 85:328–335. doi: https://doi.org/10.1205/fbp07075.
- Martínez-Ramos, T., J.J. Benedito-Fort, N.J. Watson, I.I. Ruiz-López, G. Che-Galicia, and E. Corona-Jiménez. 2020. Effect of solvent composition and its interaction with ultrasonic energy on the ultrasound-assisted extraction of phenolic compounds from Mango peels (Mangifera indica L.). Food Bioprod. Process. 122:41–54. doi: https://doi.org/10.1016/j.fbp.2020.03.011.
- Menezes, M., M. Bindes, M. Hespanhol, M. Reis, V. Luiz, and D. Camilla. 2019. Ultrasound-assisted extraction of bioactive compounds from green tea leaves and clari fi cation with natural coagulants (chitosan and Moringa oleífera seeds). Ultrason. Sonochem. 51:111–119. doi: https://doi.org/10.1016/j.ultsonch.2018.10.014.
- Oldoni, T.L.C., N. Merlin, M. Karling, S.T. Carpes, S.M. De Alencar, R.G.F. Morales, E.A. Da Silva, and E.J. Pilau. 2019. Bioguided extraction of phenolic compounds and UHPLC-ESI-Q-TOF-MS/MS characterization of extracts of Moringa oleifera leaves collected in Brazil. Food Res. Int. 125:108647. doi: https://doi.org/10.1016/j.foodres.2019.108647.
- Oroian, M., F. Dranca, and F. Ursachi. 2020. Comparative evaluation of maceration, microwave and ultrasonic-assisted extraction of phenolic compounds from propolis. J. Food Sci. Technol. 57:70–78. doi: https://doi.org/10.1007/s13197-019-04031-x.
- Pan, X., G. Niu, and H. Liu. 2003. Microwave-assisted extraction of tea polyphenols and tea caffeine from green tea leaves. Chem. Eng. Process. Process Intensif. 42:129–133. doi: https://doi.org/10.1016/S0255-2701(02)00037-5.
- Poyraz, Ç., G. Küçükyıldız, Ş.İ. Kırbaşlar, Z. Ciğeroğlu, and S. Şahin. 2021. Valorization of Citrus unshiu biowastes to value-added products: An optimization of ultrasound-assisted extraction method using response surface methodology and particle swarm optimization. Biomass Convers. Biorefin. 01 February 2021. 1–11. https://doi.org/https://doi.org/10.1007/s13399-021-01329-9
- Pradal, D., P. Vauchel, S. Decossin, P. Dhulster, and K. Dimitrov. 2016. Kinetics of ultrasound-assisted extraction of antioxidant polyphenols from food by-products: Extraction and energy consumption optimization. Ultrason. Sonochem. 32:137–146. doi: https://doi.org/10.1016/j.ultsonch.2016.03.001.
- Rostagno, M.A., M. Palma, and C.G. Barroso. 2003. Ultrasound-assisted extraction of soy isoflavones. J. Chromatogr. A 1012:119–128. doi: https://doi.org/10.1016/S0021-9673(03)01184-1.
- Safieddin Ardebili, S.M., H. Solmaz, and M. Mostafaei. 2019a. Optimization of fusel oil–Gasoline blend ratio to enhance the performance and reduce emissions. Appl. Therm. Eng. 148:1334–1345. doi: https://doi.org/10.1016/j.applthermaleng.2018.12.005.
- Safieddin Ardebili, S.M., X. Ge, G. Cravotto, S.M. Safieddin Ardebili, X. Ge, and G. Cravotto. 2019b. Flow-mode biodiesel production from palm oil using a pressurized microwave reactor. Green Process. Synth. 8:8–14. doi: https://doi.org/10.1515/gps-2017-0116.
- Şahin, S. 2015. A novel technology for extraction of phenolic antioxidants from mandarin (Citrus deliciosa Tenore) leaves: Solvent-free microwave extraction. Korean J. Chem. Eng. 32:950–957. doi: https://doi.org/10.1007/s11814-014-0293-y.
- Şahin, S., R. Samli, A.S.B. Tan, F.J. Barba, F. Chemat, G. Cravotto, and J.M. Lorenzo. 2017. Solvent-free microwave-assisted extraction of polyphenols from olive tree leaves: Antioxidant and antimicrobial properties. Molecules 22:1056. doi: https://doi.org/10.3390/molecules22071056.
- Şahin, S., Z. İlbay, and Ş.İ. Kırbaşlar. 2018. Pulsed ultrasound-assisted extraction of natural antioxidants from mandarin (Citrus deliciosa Tenore) leaves: Experimental and modeling study. Chem. Eng. Commun. 205:717–726. doi: https://doi.org/10.1080/00986445.2017.1328414.
- Şahin, S., A.G. Pekel, and İ. Toprakçı. 2020. Sonication-assisted extraction of Hibiscus sabdariffa for the polyphenols recovery: Application of a specially designed deep eutectic solvent. Biomass Convers. Biorefin. 01 July 2020. 1–11. https://doi.org/https://doi.org/10.1007/s13399-020-00837–4
- Samli, R., Z.B.G. Aydin, and S. Şahin. 2020. Computer modelling of the enrichment process of sunflower and corn oils with olive leaves through ultrasound treatment. Biomass Convers. Biorefin. 29 August 2020. 1–11. https://doi.org/https://doi.org/10.1007/s13399-020-00974–w
- Shirsath, S.R., S.H. Sonawane, and P.R. Gogate. 2012a. Chemical Engineering and Processing : Process Intensification Intensification of extraction of natural products using ultrasonic irradiations — A review of current status. Chem. Eng. Process. Process Intensif. 53:10–23. doi: https://doi.org/10.1016/j.cep.2012.01.003.
- Shirsath, S.R., S.H. Sonawane, and P.R. Gogate. 2012b. Intensification of extraction of natural products using ultrasonic irradiations—A review of current status. Chem. Eng. Process. Process Intensif. 53:10–23. doi: https://doi.org/10.1016/j.cep.2012.01.003.
- Sricharoen, P., N. Lamaiphan, P. Patthawaro, N. Limchoowong, S. Techawongstien, and S. Chanthai. 2017. Phytochemicals in Capsicum oleoresin from different varieties of hot chilli peppers with their antidiabetic and antioxidant activities due to some phenolic compounds. Ultrason. Sonochem. 38:629–639. doi: https://doi.org/10.1016/j.ultsonch.2016.08.018.
- Sungpud, C., W. Panpipat, A. Sae Yoon, and M. Chaijan. 2020. Ultrasonic-assisted virgin coconut oil based extraction for maximizing polyphenol recovery and bioactivities of mangosteen peels. J. Food Sci. Technol. 57 : 4032–4043. https://doi.org/https://doi.org/10.1007/s13197-020-04436–z
- Vázquez-León, L.A., J.A. Olguín-Rojas, D.E. Páramo-Calderón, M. Palma, G.F. Barbero, V.J. Robles-Olvera, M.A. García-Alvarado, and G.C. Rodríguez-Jimenes. 2019. Modeling of counter-current multistage extraction of Moringa oleifera leaves using a mechanistic model. Food Bioprod. Process. 115:165–174. doi: https://doi.org/10.1016/j.fbp.2019.04.003.
- Vebber, M.C., J. Da Silva Crespo, and M. Giovanela. 2019. Self-assembled thin films of PAA/PAH/TiO2 for the photooxidation of ibuprofen. Part I: Optimization of photoactivity using design of experiments and surface response methodology. Chem. Eng. J. 360:1447–1458. doi: https://doi.org/10.1016/j.cej.2018.10.189.
- Vilkhu, K., R. Mawson, L. Simons, and D. Bates. 2008. Applications and opportunities for ultrasound assisted extraction in the food industry—A review. Innov. Food Sci. Emerg. Technol. 9:161–169. doi: https://doi.org/10.1016/j.ifset.2007.04.014.
- Vongsak, B., P. Sithisarn, S. Mangmool, S. Thongpraditchote, Y. Wongkrajang, and W. Gritsanapan. 2013. Maximizing total phenolics, total flavonoids contents and antioxidant activity of Moringa oleifera leaf extract by the appropriate extraction method. Ind. Crops Prod. 44:566–571. doi: https://doi.org/10.1016/j.indcrop.2012.09.021.
- Wang, Y., Y. Gao, H. Ding, S. Liu, X. Han, J. Gui, and D. Liu. 2017. Subcritical ethanol extraction of flavonoids from Moringa oleifera leaf and evaluation of antioxidant activity. Food Chem. 218:152–158. doi: https://doi.org/10.1016/j.foodchem.2016.09.058.
- Zhang, L., C. Zhou, B. Wang, A.E.-G.A. Yagoub, H. Ma, X. Zhang, and M. Wu. 2017. Study of ultrasonic cavitation during extraction of the peanut oil at varying frequencies. Ultrason. Sonochem. 37:106–113. doi: https://doi.org/10.1016/j.ultsonch.2016.12.034.
- Zhang, Q.-A., Z.-Q. Zhang, X.-F. Yue, X.-H. Fan, T. Li, and S.-F. Chen. 2009. Response surface optimization of ultrasound-assisted oil extraction from autoclaved almond powder. Food Chem. 116:513–518. doi: https://doi.org/10.1016/j.foodchem.2009.02.071.
- Zhishen, J., T. Mengcheng, and W. Jianming. 1999. The determination of flavonoid contents in mulberry and their scavenging effects on superoxide radicals. Food Chem. 64:555–559. doi: https://doi.org/10.1016/S0308-8146(98)00102-2.