
 ?Mathematical formulae have been encoded as MathML and are displayed in this HTML version using MathJax in order to improve their display. Uncheck the box to turn MathJax off. This feature requires Javascript. Click on a formula to zoom.
ABSTRACT
The purpose of this study is to investigate socioeconomic inequality in fruit and vegetable (F&V) intake and contributing factors. Data of 9981 participants from the recruitment phase of Ravansar Non-Communicable Diseases (RaNCD) cohort study were included in the final analysis. The concentration index was calculated to measure the inequality. The prevalence of adequate F&V intake was 55.8% and concentration index was 0.178, indicating that more people in the higher SES group are consuming enough F&V. Place of residence, followed by SES, had the greatest contribution to F&V intake inequality in the west of Iran. It is suggested that villagers and the poor be the target group for interventions to increase fruit and vegetable access.
Introduction
Many chronic diseases, such as diabetes, cardiovascular diseases, osteoporosis and hypertension and various cancers are related to the pattern of nutrition and food consumption, especially the consumption of fruit and vegetable (F&V) intake (aaa, Citation2017; Ebrahim et al., Citation2015; Liu et al., Citation2016; Miller et al., Citation2017). F&V have a particular nutritional importance since they are low in calories in proportion to the amount required by the body and have a high nutritional value due to being rich in vitamins and minerals (AICR, Citation2008). An estimated 5.6 and 7.8 million premature deaths worldwide in 2013 may be attributable to a F&V intake below amount recommended by the World Health Organization (500 and 800 g/day), respectively (Aune et al., Citation2017)
Plenty of factors are involved in F&V intake inequality, including behavioral, social, cultural and economic factors, such as education level, place of residence and income, which play different roles in different societies (De Menezes et al., Citation2018; Liu et al., Citation2018; Schreinemachers et al., Citation2018). The reduced consumption of high-quality essential foods, such as F&V reduces the intake of micronutrients that are necessary for the proper and timely functioning of the body(Bock et al., Citation2018). The reason for the under-consumption of F&V is mostly associated with socio-economic status (SES)-related factors. In terms of expenses, the price of fresh F&V is higher than the price of fatty and sweet foods in many societies (Darmon et al., Citation2004; Drewnowski et al., Citation2004; Putnam et al., Citation2002).
Although the importance of the relationship between daily consumption of F&V and SES is clear, the majority of studies on this subject have been conducted in developed countries, especially European countries. People with a lower SES especially in developing countries such as Iran have a lower quality of nutrition, and mostly supply their nutritional needs through fatty foods (fried foods) and sweets, while people with a higher SES have better nutritional quality and mostly consume F&V (Darmon and Drewnowski, Citation2008; Giskes et al., Citation2010). In Iran, given the vastness of agriculture and fruit orchards, on the one hand, and the high price of meat and dairy products, on the other, F&V access and consumption are expected to be suitable for different socioeconomic groups. Nonetheless, conducted studies in Iran have produced conflicting results. The average consumption of fruits and vegetables varied from 1.74 units per day to 5.5 units. In the study Third National Surveillance of Risk Factors of Non-communicable Diseases (SuRFNCD-2007), on average, 1 · 26 servings of fruit and 1 · 32 servings of vegetables were consumed daily (Esteghamati et al., Citation2012; Mollahosseini et al., Citation2017; Salehi et al., Citation2010). Another study conducted on Iranian urban households from all provinces, among the socio-economic factors on the consumption of fruits and vegetables, maternal education, and paternal education has been effective (Shahraki and Ghaderi, Citation2017). So far, no study has been conducted to investigate the impact of socio-economic factors on fruit and vegetable consumption in Kurdish regions to determine the situation in west of Iran in this regard.
In general, the present study therefore seeks to answer two questions: First, is there a difference in the prevalence of F&V intake in the adult population of the west of Iran, and if so, what is the extent of inequality? Second, what contributions do different factors have to this severity?
Materials and methods
Study population
This study is a secondary analysis carried out using data from the recruitment phase of Ravnsar Non-Communicable Diseases (RaNCD) cohort. RaNCD cohort as a part of Prospective Epidemiological Research Studies in IrAN (PERSIAN) was started in 2014. We recruited 10,065 adults aged 35–65 years old from both rural and urban areas of Ravansar, of whom 9981 participants had completed data Food Frequency Questionnaire (FFQ) and therefore were included in this research. Details for rational and design of study have been published before (Eghtesad et al., Citation2017; Farvid et al., Citation2016).
Study Variables and Data Collection
Data collection and all measurements were performed in the study site. Smoking status was evaluated base on National Health Interview Survey (NHIS). People who had smoked less than 100 cigarettes during their life were considered nonsmokers, those who had smoked more than 100 cigarettes in the past were taken as former smokers and those who had smoked more than 100 cigarettes and were still smoking were called current smokers (Ryan et al., Citation2012).
Physical activity was measured in metabolic equivalents (METs) using 21 questions (Ainsworth et al., Citation2011), which measured the average daily physical activity in terms of MET hours per day. Participants’ physical activity was then divided into three levels, including inactive (24–36.5 MET- hours per week), moderate (36.6–44.9 MET- hours per week) and active (≥45 MET- hours per week). Participants’ weight was measured using a Bio Impedance Analyzer (In Body 770 BIOSPACE, KOREA) and their height was measured with a precision of 0.1 cm. BMI was measured by dividing weight in kilograms by height in meters squared. Alcohol consumption has been measured in the past by asking about the consumption of any alcoholic beverages (wines, beers, and spirits). The years of education were also considered according to the formal education system of Iran: illiterate, 1–5 years (primary school), 6–9 years (secondary school), 10–12 years (high school) and more than 13 years of academic education
Household size meant the number of people living under one roof (Bongaarts, Citation2001) and was divided into three categories: 1–3 members, 4–6 members, and 7 or more members. Based on the principle components analysis (PCA), the study subjects were divided into five groups according to their SES, including the poorest, poor, moderate, rich, and the richest. SES was determined using a questionnaire inquiring about factors employment status, spouse’s job, household size, type of housing, internet access, owning a personal computer and cellphone, household furniture and appliances (owning a dishwasher, washing machine, TV [LCD/LED/Plasma], fridge and freezer and bathroom), number of rooms in the household, type of kitchen, source of drinking water, type of transportation and frequency of traveling abroad (Rutstein et al., Citation2004).
Nutrition evaluation was carried out using the FFQ in all the subjects, which is regarded as the best tool for collecting data on F&V intake (Bingham et al., Citation1997; Mohammadifard et al., Citation2015). Using the cohort questionnaire, data were collected on the subjects’ choice of common food items taken over the past year. This questionnaire was designed to be compatible with the Iranian population and validity and reliabity was checked (Mohammadifard et al., Citation2015) and contained 130 general items and 45 F&V-specific items (21 items about vegetable intake and 24 items about the fruits and juices intake). This questionnaire was developed with standard units, including count, glass, piece, spoonful, and it filled with good training. According to the World Health Organization (WHO), a balanced daily consumption of F&V per person is at least 400 grams/day. Based on their total combined daily consumption of F&V, the subjects were assigned to either the balanced consumption (400 grams or more per day) or the inadequate consumption (less than 400 grams/day) groups (Agudo, Citation2005). Also the intake of fruits and vegetables in the participants in the cohort was roughly the same. That way, in each quintile, about 100 grams of vegetable consumption was greater than the fruit. So we considered our totally food intake and did not separate it.
Statistical analysis
Descriptive analysis (using mean and standard deviation for quantitative variables and percentage for qualitative variable), t-test, chi-square test and multivariate logistic regression analysis by entering all the independent variables in the model were used to compare means and proportions among groups.
Inequality was measured in this study using the concentration index (Cn) of F&V intake for the entire population as well as for each independent variable. The numerical value of the Cn varied from −1 to +1. The number zero in the concentration curve aligns with the 45° line, indicating complete equality in different socioeconomic groups, and the curve will lie below (above) the equality line if the numerical value of the index is positive (negative), indicating the greater prevalence of the dependent variable (F&V adequate consumption) in people with a high (low) SES in the concentration curve, the horizontal axis shows the cumulative population proportion from the poorest to the richest people, while the vertical axis represents the cumulative proportion of F&V consumption.
where is the mean health variable in the entire population and ri each person’s rank in the socioeconomic quintile. ri = 1/N for the poorest person and ri = N/N for the richest. hi is the health variable for person i. According to Equationequation 1
(1
(1 , for binary dependent variables, the Cn may not fall in the −1 to +1 range, in which case the normalized Cn should be used (Wagstaff, Citation2005).
(2
Using the decomposition analysis, the net contribution of each factor to the overall inequality was quantified in the outcome variable. Comparison of groups by analyzing mathematical functions of rates, incidence densities, and exposure prevalence. This simplifies identification of relevant contributing factors in risk analysis (Li et al., Citation1998). This method uses the regression analysis (Equationequation 3(3)
(3) ) and shows the relationship between the intended variable and the socioeconomic factors affecting it. The normalized Cn is decomposed according to the following equation (O’donnell et al., Citation2008).
where is the mean of each explanatory factor and Ck the Cn for X; the elasticity of each variable is calculated by
. βk is the marginal effect for each variable. EquationEquation 3
(3)
(3) thus reveals two parts for C; first,
, which is the absolute contribution and shows the sum of the Cn explained by the study variables, and if all the study variables are unable to explain the total Cn with a systematic variation in Xu, the residual component is explained by
, where
is the generalized Cn for
(O’donnell et al., Citation2007; Van Doorslaer and Jones, Citation2003). The percentage contribution of each factor is obtained through dividing the absolute contribution by the Cn of the factor’s dependent variable.
The marginal effect was used to show the relationship between each variable and F&V consumption. A negative (positive) numerical value indicates the lower (higher) prevalence of the intended variable in that subgroup compared to the reference subgroup and is reported as a percentage. If the confidence intervals reported in the marginal effect contain the number zero, the relationship obtained is not statistically significant. All the data were analyzed in Stata-14.2 using appropriate statistical tests. P < .05 was considered significant.
Results
Descriptive Results
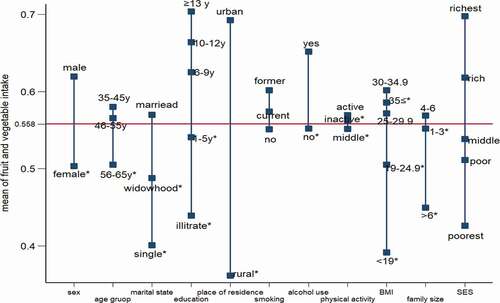
From 10036 participants of RaNCD cohort 9981 people (99.1%) responded to all questions, and 5240 (52.5%) were women and 4741 (47.5%) were men, with a mean age of 47.8 years and 48.3 years, respectively. The majority of the participants (44.1%) belonged to the 35–45 year-old age group; 24.5% were illiterate; and 59.5% were from urban areas ().
Table 1. Characteristics of RaNCD cohort participants in terms of their F&V intake
The prevalence of adequate F&V intake based on the WHO criteria was 61.9% (n = 2936) for men and 50.4% (n = 2636) for women (P < .001).
Consumption of F&V increased with increasing level of education so that 70.7% of people with academic degree (≥13) had adequate F&V intake.
A statistically significant difference (P < .001) was observed in F&V intake based on participants’ place of residence, as 4110 (69.3%) of those in urban areas consumed over 400 grams/day of F&V and only 1464 (36.2%) of the rural participants had adequate F&V consumption.
Other significant factors affecting differences in F&V intake included age, marital status, household size, alcohol use, BMI and SES.
The other findings of this study showed that F&V intake matched the SES in the study groups, and those with a low SES often consumed less F&V than the average of the population under study (the groups marked with asterisk are in the poor and poorest SES on average; ).
Figure 1. means of variables by F&V intake
The Inequality Results in Terms of Concentration Index and the Decomposition Analysis
The Cn was +0.178 for the entire population, 0.2 for the women and +0.169 for the men, which indicates that more people in the higher SES group are consuming enough F&V. Inequality was significant in all three groups (P < .001), but had a higher severity among women (). The positive sign Cn shows the greater prevalence of the dependent variable (F&V adequate consumption) in people with a high SES.
Figure 2. concentration curve for F&V intake
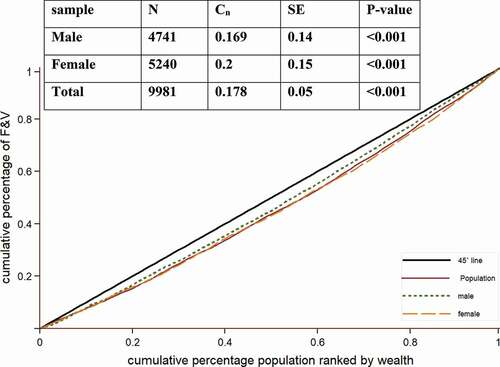
Based on the marginal effect results, women consumed F&V − 0.06(−0.89, −0.04) less than the men, and the rural residents consumed −0.30(−0.32, −0.28) less than the urban residents. Mean F&V intake increased with an increase in BMI, education level, physical activity level and SES, and this relationship was significant ().
Table 2. The decomposition analysis of F&V intake inequality
The Cn show that factors including age 46–55 years, education more than six years, being a current smoker or former smoker, alcohol use, BMI of 25–29.9 and BMI of 30–34.9 and household size of 4–6 were more commonly observed in groups with a higher SES. In contrast, the female gender, rural residence, age over 55 years, education less than six years, BMI of 19–24.9 and BMI over 30, household size of more than six, moderate to severe physical activity and single and widowed marital status were mostly associated with a poor SES ().
The largest share of contribution in consumed F&V inequality was place of residence, living in different place of residence increased 27.03% inequality. The next factors affecting F&V intake inequality were SES, level of education and gender, with contributions of 20.81%, 7.24%, and 4.47%, respectively. Physical activity reduced inequality by 3.42% ().
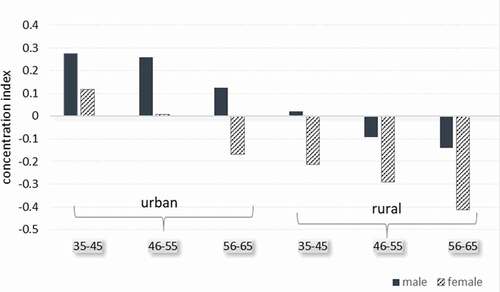
The results of the decomposition analysis show that the total absolute contribution is 0.1041, which means that the study variables have been able to explain 58.4% of the inequality in F&V consumption, and 41.6% of the total Cn was claimed by the generalized Cn . 0.1 is the sum of the Cn of the variables entered in the model. The difference between the total Cn and the sum of the Cn is the residual value. The residual does not represent the Cn, the residual represents the contribution of variables affecting inequality that is not included in the current model. Place of residence had the biggest contribution (27.03%) of F&V intake inequality. Overall, men had better status than women in both urban and rural areas ().
Figure 3. concentration index by place and age group and gender
Discussion
The present study was conducted for better understanding the association between SES and F&V consumption, since these valuable foods contain fiber and many nutrients needed to maintain health and prevent chronic diseases. The present findings showed the positive relationship between SES and F&V consumption and based on the Cn for the entire population, inequality was obtained as 0.178, indicating a significant inequality and indicates that more people in the higher SES group are consuming enough F&V. The main factors affecting F&V intake were SES and education level (Assari and Lankarani, Citation2018; Honrath et al., Citation2018). People with a lower SES consume more of high-calorie food groups, such as carbohydrates, fats and sweets, and their food consumption pattern is less in harmony with food guidelines in terms of quality. People’s nutritional knowledge also affects their consumption of F&V (Cotugna et al., Citation1992; Rutter, Citation2018; Wang et al., Citation2018).
An interesting finding was that place of residence had the main contribution to F&V intake inequality (27.03%). It has the highest coefficient, suggesting that F&V intake is 30% less in rural residents compared with urban residents. The negative sign for the regression coefficient as well as the Cn among the rural residents shows their unfavorable F&V intake and low SES. In our study, according to the subgroup analysis, 92% of people with academic education live in city and, on the other hand, 73% of villagers have primary education or are illiterate, although by estimating the odds ratio at each level of education by place of residence, F&V consumption had an odds ratio between 0.23 for the illiterate to 0.44 for academic education, meaning that even in the best conditions (in terms of education), villagers have a 0.44 times higher odds of consuming F&V than urbanites. Even according to the SES, in the poorest group of villagers, 29% consume enough F&V, and this rate has increased, by the improvement of the SES respectively, to 55.5% in the richest group. Therefore, other important factors in the lack of adequate F&V consumption in rural should be considered; such as less access of villagers to F&V and possibly lack of sufficient knowledge about the importance of consuming these two food groups are important and worth considering. A study conducted in Kermanshah on the factors affecting nutrition in rural households showed that nutritional status is affected significantly by factors such as education, monthly income, employment status and access to food substances in these populations (Farvid et al., Citation2010). According to the results of a study by Ghiasvand et al. which was conducted on urban and rural households in different parts of Iran, the concentration index for F&V consumption was 0.35, and it was a little more in the villagers (Ghiasvand et al., Citation2015).
Other studies on inequality and the factors affecting F&V intake have also noted the lower consumption of F&V in rural populations (Miller et al., Citation2017; Storey and Anderson, Citation2018). This lower consumption in poorer areas, such as most villages, is said to be due to their low SES (Pillsbury, Citation2018).
The physical activity factor shows that, irrespective of their activity level, people consume the average amount of F&V, and this factor was able to reduce the total inequality by −3.42%. The relationship between smoking status and F&V intake was found to be independent of the SES.
It is not unexpected that the SES contribution is 20.81%, and that SES is considered an important factor for F&V intake inequality, since various studies have demonstrated the role of favorable socioeconomic factors in a good nutrition quality and a higher consumption of F&V.(Epstein et al., Citation2012; Mackenbach et al., Citation2015; Storey and Anderson, Citation2018) In a study conducted in Australia, the odds of F&V intake also increased with SES(Giskes et al., Citation2002).
Women consume F&V significantly less than men (by 6%) and have a lower SES than men. In the population under study according the cultural factors men have a higher priority in choosing the kind of food. Some studies have shown that healthy diet and eating habits are influenced by the gender (Simonsen et al., Citation2015; Varì et al., Citation2017) .In European men consume more meat and less F&V than women (Prättälä et al., Citation2006); however, studies conducted in Iran on F&V intake by men and women show conflicting results that in Iran women’s lower F&V intake is probably due to the lower education and SES in this gender(Khoramabadi et al., Citation2016; Mokari_yamchi et al., Citation2019).
Among all the factors, the more-than-13-year education category had the highest Cn (0.7), which shows the favorable SES of this group of the society. Furthermore, the contribution of this level of education to inequality was only 2.4%, due to the small regression coefficient (non-significance of the marginal effect) and the low mean of this group, which resulted in a small elasticity as well. These factors made education have less effect on the overall inequality (Cn = 0.178), this finding is consistence with other studies in Iran and Kurdish ethnic(Rezazadeh et al., Citation2016) . A higher level of education can certainly add to people’s knowledge and the effect of this factor on people’s performance is therefore evident. A similar study also proposed a low level of education as a factor causing less F&V intake (Khoramabadi et al., Citation2016; Mackenbach et al., Citation2015).
Strengths and weaknesses
No studies with a similar sample size were found to have examined the extent of inequality and factors which may have led to this inequality in F&V intake in Iran. More importantly, the study population consisted of different socioeconomic groups of both genders and can therefore reflect the level of inequality in the Iranian society. In addition to showing the severity of F&V intake inequality, the present study was also able to show the contribution of each factor to the inequality. A limitation of this study is that it did not examine the diversity and types of fruits and vegetables consumed or their freshness and quality, which are recommended to be simultaneously examined in future studies.
Conclusion
Overall, since fruits and vegetables are very important for people’s health, their lower consumption and the increased inequality in their consumption negatively affect the poorer socioeconomic groups of societies, the poor and poorest groups had a lower F&V intake than the minimum recommended by the WHO. As regard as place of residence and socioeconomic status were the most important factors causing socioeconomic inequality in F&V intake. After more accurate assessments of the subject, interventions should be carried out to resolve the issue with respect to different factors, especially interventions for improving the general level of education in these areas.
Declarations of interest
none
Ethical standards
Informed written consents were obtained from all the candidates who were willing to participate, and they were ensured that they could withdraw from the study at any time they wished. The research was registered (No: 92472) at the Research and Technology Deputy and was approved by the ethics committee of Kermanshah University of Medical Sciences under the code KUMS.REC.1394.318.
Competing Interests
The authors declare no conflict of interest.
Acknowledgments
RaNCD is part of PERSIAN national cohort and we would like to thank Professor Reza Malekzadeh Deputy of Research and Technology at the Ministry of Health and Medical Education of Iran and Director of the PERSIAN cohort and also Dr. Hossein Poustchi, Executive Director of PERSIAN cohort for all their supports during design and running of RaNCD.
Additional information
Funding
References
- http://www.who.int/elena/titles/fruit_vegetables_ncds/en/ 2017
- Agudo, A. measuring intake of fruit and vegetable[electronic resource]. background paper for the joint FAO/WHO Workshop on Fruit and Vegetable for health. 2005.
- AICR. 2008. World cancer research fund/American Institute for Cancer Research. Food, nutrition, physical activity, and the prevention of cancer: A Global perspective. American Institute for Cancer Research, Washington DC.
- Ainsworth et al., 2011. 2011 Compendium of Physical Activities: A second update of codes and MET values. Med Sci Sports Exerc. 43(8):1575–1581.
- Assari, S., and M. Lankarani. 2018. Educational attainment promotes fruit and vegetable intake for whites but not blacks. J 1(1):29–41.
- Aune et al., 2017. Fruit and vegetable intake and the risk of cardiovascular disease, total cancer and all-cause mortality—a systematic review and dose-response meta-analysis of prospective studies. Int J Epidemiol. 46(3):1029–1056.
- Bingham et al., 1997. Validation of dietary assessment methods in the UK arm of EPIC using weighed records, and 24-hour urinary nitrogen and potassium and serum vitamin C and carotenoids as biomarkers. Int J Epidemiol. 26(suppl_1):S137.
- Bock et al., 2018. Renal cell carcinoma risk associated with lower intake of micronutrients. Cancer Med 7(8):4087–4097. doi:https://doi.org/10.1002/cam4.1639.
- Bongaarts, J. 2001. Household size and composition in the developing world in the 1990s. Popul. Stud. 55(3):263–279.
- Cotugna, N., A.F. Subar, J. Heimendinger, and L. Kahle. 1992. Nutrition and cancer prevention knowledge, beliefs, attitudes, and practices: The 1987 National Health Interview Survey. J. Am. Dietetic Ass 92(8):963–968.
- Darmon, N., A. Briend, and A. Drewnowski. 2004. Energy-dense diets are associated with lower diet costs: A community study of French adults. Public Health Nutr 7(1):21–27. doi: https://doi.org/10.1079/PHN2003512.
- Darmon, N., and A. Drewnowski. 2008. Does social class predict diet quality? Am. J. Clin. Nutr. 87(5):1107–1117. doi: https://doi.org/10.1093/ajcn/87.5.1107.
- De Menezes, M.C., A.V.D. Roux, and A.C.S. Lopes. 2018. Fruit and vegetable intake: Influence of perceived food environment and self-efficacy. Appetite. 127:249–256.
- Drewnowski, A., N. Darmon, and A. Briend. 2004. Replacing fats and sweets with vegetables and fruits—a question of cost. Am. J. Public Health 94(9):1555–1559. doi: https://doi.org/10.2105/AJPH.94.9.1555.
- Ebrahim, S., A. Poneh, M. Mehrzadi, S. Pishvaee, B. Larijani, and M. Kimiagar. 2015. Does the increase in the consumption of fruits and vegetables affect the indices of bone destruction and rebuild in postmenopausal women with osteopenia? . Iranian Journal of Nutrition Sciences and Food Industry.10(1):41–50.
- Eghtesad, S., Z. Mohammadi, A. Shayanrad, E. Faramarzi, F. Joukar, B. Hamzeh, M. Farjam, M.J. Zare Sakhvidi, M. Miri-Monjar, M. Moosazadeh, et al. 2017. The PERSIAN Cohort: Providing the Evidence Needed for Healthcare Reform. Arch Iran Med. 20(11):691–695.
- Epstein, L.H., N. Jankowiak, C. Nederkoorn, H.A. Raynor, S.A. French, and E. Finkelstein. 2012. Experimental research on the relation between food price changes and food-purchasing patterns: A targeted review. Am. J. Clin. Nutr. 95(4):789–809.
- Esteghamati, A., S. Noshad, A. Nazeri, O. Khalilzadeh, M. Khalili, and M. Nakhjavani. 2012. Patterns of fruit and vegetable consumption among Iranian adults: A SuRFNCD-2007 study. Br J Nutr. 108(1):177–181. doi: https://doi.org/10.1017/S0007114511005393.
- Farvid et al., 2016. Dairy Food Intake and All-Cause, Cardiovascular Disease, and Cancer Mortality: The Golestan Cohort Study. Am. J. Epidemiol. 185(8):697–711. doi:https://doi.org/10.1093/aje/kww139.
- Farvid, M.S., S. Rabiee, F. Homayoni, B. Rashidkhani, and V. Arian. 2010. Determinants of fruit and vegetable consumption in type 2 diabetics in Tehran. Iranian J. Endocrinol Metabolism 12(2):89–98.
- Ghiasvand, H., S. Naghdi, N. Abolhassani, N. Shaarbafchizadeh, and J. Moghri. 2015. Iranian households’ payments on food and health out-of-pocket expenditures: Evidence of inequality. Iran. J. Public Health 44(8):1103.
- Giskes, K., M. Avendaňo, J. Brug, and A. Kunst. 2010. A systematic review of studies on socioeconomic inequalities in dietary intakes associated with weight gain and overweight/obesity conducted among European adults. Obesity Rev. 11(6):413–429. doi: https://doi.org/10.1111/j.1467-789X.2009.00658.x.
- Giskes, K., G. Turrell, C. Patterson, and B. Newman. 2002. Socio-economic differences in fruit and vegetable consumption among Australian adolescents and adults. Public Health Nutr 5(5):663–669.
- Honrath, K., M.G. Wagner, and Y. Rhee. 2018. Does Nutrition Education with Fruit and Vegetable Supplementation Increase Fruit and Vegetable Intake and Improve Anthropometrics of Overweight or Obese People of Varying Socioeconomic Status? Ecol Food Nutr 57(1):32–49.
- Khoramabadi et al., 2016. Effects of education based on health belief model on dietary behaviors of Iranian pregnant women. Glob J Health Sci. 8(2):230.
- Li, G., S.P. Baker, J.A. Langlois, and G.D. Kelen. 1998. Are female drivers safer? An application of the decomposition method. Epidemiology. 9(4):379–384. Lippincott Williams & Wilkins.
- Liu, H., J.J. Hall, X. Xu, G.D. Mishra, and J.E. Byles. 2018. Differences in food and nutrient intakes between Australian‐and Asian‐born women living in Australia: Results from the Australian Longitudinal Study on Women’s Health. Nutr.Dietetics 75(2):142–150.
- Liu et al., 2016. Prevalence, awareness, treatment, control of type 2 diabetes mellitus and risk factors in Chinese rural population: The RuralDiab study. Sci Rep 6(1):31426. doi:https://doi.org/10.1038/srep31426.
- Mackenbach, J.D., S. Brage, N.G. Forouhi, S.J. Griffin, N.J. Wareham, and P. Monsivais. 2015. Does the importance of dietary costs for fruit and vegetable intake vary by socioeconomic position? Br J Nutr. 114(9):1464–1470.
- Miller et al., 2017. Fruit, vegetable, and legume intake, and cardiovascular disease and deaths in 18 countries (PURE): A prospective cohort study. Lancet 390(10107):2037–2049. doi:https://doi.org/10.1016/S0140-6736(17)32253-5.
- Mohammadifard, N., F. Sajjadi, M. Maghroun, H. Alikhasi, F. Nilforoushzadeh, and N. Sarrafzadegan. 2015. Validation of a simplified food frequency questionnaire for the assessment of dietary habits in Iranian adults: Isfahan Healthy Heart Program, Iran. ARYA Atheroscler 11(2):139.
- Mokari_yamchi et al., 2019. Socioeconomic Inequality in Fruit and Vegetable Consumptions in Elderly People: A Cross Sectional Study in North West of Iran. Nutr.Food Sci. Res. 6(4):17–22.
- Mollahosseini, M., E. Daneshzad, M.H. Rahimi, M.S. Yekaninejad, Z. Maghbooli, and K. Mirzaei. 2017. The association between fruit and vegetable intake and liver enzymes (aspartate and alanine transaminases) in Tehran, Iran. Ethiop J Health Sci 27(4):401–410. doi: https://doi.org/10.4314/ejhs.v27i4.11.
- O’donnell, O., E. Van Doorslaer, A. Wagstaff, and M. Lindelow Analyzing health equity using household survey data: A guide to techniques and their implementation: The World Bank; 2007.
- O’donnell, O., E. Van Doorslaer, W. Wagstaff, and M. Lindelow. 2008. Analyzing health equity using household survey data.World Bank Institute Development Studies.
- Pillsbury, R. 2018. No foreign food: The American diet in time and place. Routledge.
- Prättälä, R., L. Paalanen, D. Grinberga, V. Helasoja, A. Kasmel, and J. Petkeviciene. 2006. Gender differences in the consumption of meat, fruit and vegetables are similar in Finland and the Baltic countries. Eur J Public Health 17(5):520–525.
- Putnam, J., J. Allshouse, and L.S. Kantor. 2002. US per capita food supply trends: More calories, refined carbohydrates, and fats. Food Rev. 25(3):2–15.
- Rezazadeh, A., N. Omidvar, H. Eini-Zinab, M. Ghazi-Tabatabaie, R. Majdzadeh, S. Ghavamzadeh, et al. 2016. Food insecurity, socio-economic factors and weight status in two Iranian ethnic groups. Ethn Health. 21(3):233–250.
- Rutstein, S.O., K. Johnson, and O.M. Measure The DHS wealth index: ORC Macro, MEASURE DHS; 2004.
- Rutter, H. The Obesity Problem and its Relationship. Core Topics in Anaesthesia and Perioperative Care of the Morbidly Obese Surgical Patient. 2018:1.
- Ryan, H., A. Trosclair, and J. Gfroerer. 2012. Adult current smoking: Differences in definitions and prevalence estimates—NHIS and NSDUH, 2008. J Environ Public Health. 2012.
- Salehi, L., H. Eftekhar, K. Mohammad, S.S. Tavafian, A. Jazayery, and A. Montazeri. 2010. Consumption of fruit and vegetables among elderly people: A cross sectional study from Iran. Nutr J 9(1):2. doi: https://doi.org/10.1186/1475-2891-9-2.
- Schreinemachers, P., E.B. Simmons, and M.C. Wopereis. 2018. Tapping the economic and nutritional power of vegetables. Global Food Security 16:36–45.
- Shahraki, M., and S. Ghaderi. 2017. Socioeconomic factors determining fruit and vegetable consumption among urban households in Iran. J. Res Health 7(4):887–898.
- Simonsen et al., 2015. A gender-based approach to developing a healthy lifestyle and healthy weight intervention for diverse Utah women. Eval Program Plann. 51:8–16.
- Storey, M., and P. Anderson. 2018. Total fruit and vegetable consumption increases among consumers of frozen fruit and vegetables. Nutrition. 46:115–121.
- Van Doorslaer, E., and A.M. Jones. 2003. Inequalities in self-reported health: Validation of a new approach to measurement. J Health Econ 22(1):61–87.
- Varì, R., B. Scazzocchio, and S. Del Papa. 2017. Dietary habits and gender differences. Italian J. Gender-Specific Med 3(2):55–58.
- Wagstaff, A. 2005. The bounds of the concentration index when the variable of interest is binary, with an application to immunization inequality. Health Econ 14(4):429–432.
- Wang et al., 2018. Relationship between socioeconomic status and weight gain during infancy: The BeeBOFT study. PloS One. 13(11):e0205734.