
ABSTRACT
Despite Kenya’s favorable climate for both exotic and indigenous commercial guava production, neglect has limited research on the fruits’ physicochemical and processing qualities. The white-fleshed, red/pink-fleshed guava, and, to a lesser extent, strawberry guavas that grow in different agroecological zones are the most common Kenyan varieties. The purpose of this study was to determine the physicochemical properties and processing qualities of the common Kenyan guava fruits. A completely randomized study design was used to profile the fruits' physicochemical composition and processing qualities. Approximately 1000kg of the red and white-fleshed guava fruits and 150 kg of strawberry guavas were procured in duplicates from randomly selected trees in farms within Taita Taveta and Kitui counties. These were pooled into respective varieties and subjected to triplicate batches for the analysis of physicochemical and processing qualities. The fruits had distinct flesh colors and sizes that varied significantly (p<0.05), with shapes ranging from oval to round to pear-shaped. The chemical composition of the fruits varied significantly (p<0.05), with a PCA biplot explaining approximately 58% of the variability due to intra (61%) and inter (39%) varietal differences. The strawberry guava’s vitamin C levels were significantly (p=0.0001) lower than the red and white guavas’, at 164.11±11.85, 1365.15± 50.56 and 1665.56±126.50 mg100−1g, respectively. The white-fleshed guavas, on the other hand, were low in β-carotenes (0.04±0.06 mg100−1g) in comparison to the red-fleshed (1.98±0.62mg100−1g) and strawberry guava (1.55 ± 0.30mg100−1g). The strawberry guavas had significantly (p<0.05) higher mineral and total flavonoids contents whereas the total phenolics (1649.14±329.70mgGAE100−1g) and antioxidant activities (1989.14±383.47µMTE100−1g) were significantly (p=0.048) higher in the red-fleshed guava. While strawberry production would be a processing constraint, the red-fleshed guavas had significantly (p<0.05) higher beta-carotene, phytochemicals, and minerals than the white, and therefore best suited for processing.
KEYWORDS:
Introduction
Guavas are nutritious fruits that grow in tropical and subtropical climates worldwide (Yousafi et al., Citation2021). Apart from several bioactive compounds and minerals such as calcium, iron, and phosphorus, the fruits are high in vitamin C, exceeding most common fruits such as oranges and lemons by up to four to eight times. The phytochemical composition contains a high concentration of beneficial compounds, including saponins, oleanolic acid, lyxopyranoside, arabopyranoside, guaijavarin, quercetin, phenolic compounds, and flavonoids which are prominent among these (Naseer et al., Citation2018). Besides, the free radical scavenging activity, the guava fruits antioxidants are also high compared to other fruits (Naseer et al., Citation2018).
In Kenya, the fruits naturally grow from wild cultivars that are distinguished by various white and red varieties of exotic and indigenous nature (Chiveu, Citation2018). Despite the fruits’ high productivity across several of Kenya’s agro-ecological zones, there have been few studies on the fruit’s value chains, resulting in underutilization and, as a result, negligence (Omayio et al., Citation2020). Guavas have thus been some of Kenya’s orphaned crops, despite their nutritional value and potential for income generation as horticultural produce (Omayio et al., Citation2020).
The guavas have climatic characteristics (de Abreu et al., Citation2012) and undergo high metabolic activities, respiration, and low stability at ambient storage temperatures. They also suffer post-harvest losses, which often accelerate the rates of these physiological processes (Yousafi et al., Citation2021). The fruits reach their peak climacteric perishability three to five days after harvest, depending on the variety, postharvest handling practices, and storage conditions (Katumbi, Citation2020). However, fruit commercialization in domestic and export markets is frequently hampered by poor postharvest stability, necessitating processing into shelf-stable products.
The guava is suitable for raw consumption and processing into various commercial products (Nisha et al., Citation2016). However, limited commercial production and breeding programs, besides poor post-harvest handling and inadequate good agricultural practices toward guava production, lead to Kenyan fruits’ poor processing qualities (Chiveu, Citation2018). Industrially, the processing of the locally produced guavas has been a significant constraint leading to escalation of the annual losses among more than 75% of the households producing the fruits (Omayio et al., Citation2020). Due to limited research, there is a scarcity of information on the Kenyan guavas' nutritional and processing properties. The current study evaluated the physicochemical characteristics and processing qualities of guava varieties commonly grown in Kenya's fruit-growing regions.
Materials and Methods
Procurement of Raw Materials
Approximately 1000 kg mature firm-ripe red/pink-fleshed, white-fleshed, and strawberry guava fruits were procured from the Taita Taveta and Kitui counties of Kenya by picking 10 – 15 fruits from randomly selected trees in duplicates in the mornings hours of 6- 10 am . A previous study by Katumbi (Citation2020) found no significant differences between the ripe white- and red-fleshed guava fruits sourced from the two respective counties, so the fruits were pooled into either red or white-fleshed batches. However, a duplicate of only 150 kg of the strawberry variety was found in Taita Taveta county. The fruits were transported to the Department of Food Science and Technology at the University of Nairobi. They were stored in modified atmosphere packaging using hermetically sealed sacks lined with polythene paper and stored in a cold room at 8±2oC and relative humidity of 75% (Huato- HE174 Data loggers Shenzen China) until further analysis and subsequent evaluation of processing quality.
Sample Preparation
The fruits were sorted based on subjective judgment for the size, shape of fruit, and flesh color as described by García-Rivera et al. (Citation2016) and Diniz et al. (Citation2014), while the overripe, spoilt fruits, and those infested with fruit flies (approximately 10%) were removed before being randomly subdivided into roughly equal triplicate batches of 50 kg for each variety respectively. A subsample of the fruits were used to assess the physical characteristis of each variety wile the rest were mechanically pressed into purees using a commercial locally fabricated fruit crusher and pulper fitted with a 0.5 mm stainless screen (D. K Engineering, Kenya). Random samples from the pulper were collected in quadruplicates of 2 kg of each variety and immediately frozen at -20°C for further analysis. The purees were then used to determine the proximate, chemical, and phytochemical composition for each variety.
Analytical Methods
Physical fruit characterization
The fruits, seed and pulp weights were determined using the AR3130 KERN® PCB 3500 precision weighing balance (Balingen, Germany).The fruit diameters and length were determined using a Mitutoyo digital vernier caliper (Japan). Both flesh and skin color were recorded using the PCE (Citation2014) colorimeter as per the manufacturer’s manual (PCE Instruments, London, UK).
Proximate Composition
The moisture content was determined in duplicates using forced-air oven driers (Memmert 40500-IP20-Schutzart, Germany) as per AOAC (Citation2005) method 930.15. Five grams of samples were weighed using the AR3130 KERN® PCB 3500 precision weighing balance (Balingen, Germany) and dried for approximately three hours at 105°C on aluminum dishes. The ash content was determined by weighing approximately 3 g of sample into silica crucibles and charring on hot plates for two hours, followed by 24 hours of ashing in a muffle furnace set to 550±5°C. The lipid content was determined using solvent extraction. Approximately 5 g of sample was weighed into thimbles and placed in a soxhlet extraction apparatus with petroleum ether as the solvent, as specified in AOAC (Citation2005) method 960.39. The crude protein concentration was determined using the Kjeldahl method and a protein conversion factor of 6.25, as specified in method 990.03 AOAC (Citation2006). Carbohydrates were determined using the difference method, where CHO = 100 – (Moisture% +Protein% + Fat% +Fibre% + Ash%)(Kr Chauhan, Citation2014)). The total energy Kj/100 g was calculated using the Atwater factors of 4, 4, and 9, respectively for the protein, carbohydrate, and fat respctively, as described by Turck et al. (Citation2016). All the other parameters, except for moisture, were calculated on a dry weighty (d.b) basis.
Determination of total soluble solids (TSS), pH and total titratable acidity (TTA)
A handheld refractometer was used to determine the TSS (SK106R.- SATO, Japan). To extract the fruit pulp, randomly selected fruits were pulped using a commercial blender. A drop of the extract was placed on the refractometer screen, and the reading was directly recorded in degree Brix. Readings were taken in triplicate and expressed as fresh weight (f.w) basis. The pH values of fruit were determined using adigital Five Easy pH meter, model F20 (Mettler, Toledo, USA), calibrated with 4.1, 7.0, and 9.1 pH water. The fruits’ total titratable acidity (TTA) was determined using the AOAC method 942.15 (AOAC, Citation2000) in duplicates. Ten grams of fruit pulp were diluted in 25 ml of distilled water and titrated against 0.1 N sodium hydroxide using phenolphthalein indicator. The results were expressed in mg of citric acid per 100 grams of sample. Duplicate readings were recorded and expressed on fresh weight (f.w) basis.
Phytochemical analysis
Determination of Vitamin C Content
The vitamin C content in fresh guavas was determined using the procedure described by Puwastien et al. (Citation2011) by reducing 2,6-standardized dichlorophenolindophenol (DCPIP) solution to a colorless dye. Standardization of the DCPIP solution was accomplished through triplicate titrations with a standardized ascorbic acid solution. Approximately 40 g of filtered extracted pulp was weighed in a 100 mL volumetric flask and filled to volume with metaphosphoric acid solution. Two (2mls) of these aliquots were then titrated in triplicates against indophenol solution. The vitamin C content was recorded as mg/100 g of sample on dry weight basis.
Determination of Beta-carotene
The beta-carotene concentrations were determined using modified spectrophotometric techniques as described by Mustapha and Babura (Citation2010). A standard curve was constructed using beta-carotene standards with concentrations of 0, 0.4, 0.8,1.2, 1.6, 2.0, and 2.4 µg/ml using a Hitachi 2900 UV/VIS spectrophotometer (Tokyo, Japan) set to 450 nm. Two (2) grams of the sample was placed in a motor and pestle and extracted with acetone in small amounts until a colorless residual was obtained. Following this, approximately 25 ml of the extract was transferred to a round-bottomed flask, and the acetone was evaporated at 60°C using a rotary evaporator. The evaporated sample was dissolved in 1 ml petroleum ether, eluted with pet ether utilizing a silica gel column, and collected in a 25 ml volumetric flask. After reading the absorbance at 450 nanometers, the beta-carotene concentrations were determined using a standard curve created with Hitachi 2900 UV/VIS spectrophotometer (Tokyo, Japan) against pet ether as a blank. The extraction was performed twice, and the results were expressed as mg per 100 g of dry weight sample.
Determination of Total Phenolics
The total phenolics were determined according to the Folin-Ciocalteu method as reported by Otieno et al. (Citation2016). Approximately 0.5 g dried guavas were combined with 10 ml 80% (v/v) methanol in a falcon tube, followed by vortexing for 15 minutes at 3,000 g centrifugation. After that, the flask was filled to the ten milliliter mark with 80% methanol. An aliquot (0.5 ml) of each extract was diluted with 2.5 ml of 10% (v/v) Folin reagent and 2.0 ml of 7.5% (w/v) sodium carbonate. After that, the mixture was incubated for 30 minutes at 40°C. Total phenolic compounds in each extract were determined using a UV-VIS spectrophotometer at a wavelength of 765 nm using Hitachi 2900, UV/VIS spectrophotometer (Tokyo, Japan). A standard calibration curve prepared by obtaining readings for concentrations ranging 0.25–2.0 µg/ml was used to measure the samples’ phenolics concentration. The total phenolic compounds content of guavas was expressed as mg per gallic acid equivalent (mg.GAE.g-1) per 100 g dry weight.
Determination of Antioxidant Activity
The antioxidant activity of the guava samples was determined using the 2, 2 diphenyl-1-picrylhydrazyl (DPPH) assay as described by Abon’g et al. (Citation2020), with minor modifications. The antioxidant activity was determined from a standard curve (R2 = 0.988) using Trolox standard stock solution (0, 5, 10, 25, and 50 µg/ml) and 1 ml of the methanolic 80%(v/v) extraction solution. For the sample assay, 0.25 g of the sample was mixed with 10 ml of 80% (v/v) methanol solution and placed in a continuous shaker (Heto JB SH02, Birkerod Denmark) for overnight extraction at 50 revolutions per minute. One (1) ml of the extract was transferred to boiling tubes, and 1 ml of 0.002% DPPH added and homogenously mixed. These were then placed in cuvettes, and spectrophotometric readings at 515 nm were taken using Hitachi 2900, UV/VIS spectrophotometer (Tokyo, Japan). Results were read in duplicates and expressed as µM Trolox Equivalents (TE) per 100 g dry weight.
Determination of the Flavonoid Contents
The total flavonoids were quantified using the aluminum chloride colorimetric method described by Otieno et al. (Citation2016), with catechin used as the standard. Catechin was dissolved in methanol to make a stock solution (100 µg/ml concentration), from which aliquots of 0.1, 0.2, 0.4, 0.6, 0.8, and 1.0 ml were filled in 10 ml volumetric flasks containing 4 ml distilled water for the standard curve (R2 = 0.995). To this 0.3 mL of sodium nitrite (5%w/v) was added. After 5 minutes, 0.3 ml aluminum chloride (10% w/v) was added followed with 2 ml of 1 M sodium hydroxide after another 6 minutes. The total volume was then made up to 10 ml with distilled water. Absorbance was read at 510 nm using Hitachi 2900, UV/VIS spectrophotometer (Tokyo, Japan) against a blank reagent (distilled water). For the samples, 10 mg of each extract were dissolved in 10 ml of methanol to yield a solution with a concentration of 1 mg/ml. An aliquot (1 ml) of each extract was added to 10 ml volumetric flasks containing 4 ml distilled water, to which the same reagents similar to the standards were added in the same manner, resulting in a total volume of 10 ml. The tests were repeated twice, and the flavonoids concentrations in the samples were calculated using extrapolation from the standard calibration curve and expressed as milligrams of catechin equivalents per gram of dry weight (mgCE. g−1).
Determination of Mineral Contents
The AOAC (Citation2005) method 2005.08 was used to determine the mineral analysis for zinc, iron, calcium, and phosphorous using Atomic Absorption spectrometry on the Buck Scientific Model 210 VGP (Fort Point, USA). Oven driers were used to dry about 5 grams of samples in triplicates until a constant weight was achieved. The dried samples were then milled using Polymix® PX-MFC 90D (Kinematica, AG, Switzerland), with the ash digested in 36% HCL after heating in a furnace at 600°C. Before the spectrophotometric reading, these were filtered. The results were expressed in milligrams per 100 grams of dry weight.
Data Analysis
Xlstat (Addinsoft, Citation2021) Microsoft excel plugin was used to analyze the data for the proximate, chemical, and phytochemical composition. Turkey’s HSD test was used to separate significantly different means (p < 0.05) in a one-way analysis of variance (ANOVA). The Agglomerative Hierarchical Clustering (AHC), and parallel coordinates analyses were used to classify the fruits based on their chemical composition differences. To show the relationships between the variables under study, a principal component analysis (PCA) analysis based on the various nutritional compositions of the fruit varieties was run.
Results
Physical Characteristics of Guava Fruits
The strawberry, white-fleshed, and red-fleshed guava fruits had distinct physical characteristics. In contrast to the reddish-purple strawberries, the red and white ripe fruits had a distinctive yellow or green-yellow skin color. The oval, round, and pear-shaped appearance of the white and red varieties were typical, whereas the strawberry was distinguished by relatively small-rounded berries (). Furthermore, the weight, length, and color of the flesh of the fruits differed significantly (p<0.05) across the fruits (). The red-fleshed weight and length averaged more than 5 cm than the whites, whose average lengths were slightly higher than 4.8 cm. On the other hand, the strawberry guavas were the least, with an average of only 2.8 cm ().
Table 1. Physical characteristics of the common Kenyan guavas varieties.
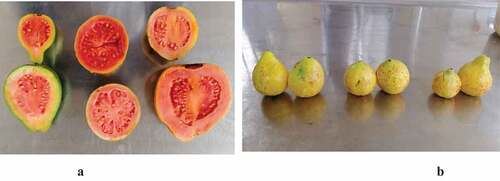
Figure 1. A- Cross-sectional view of the ripe pear-shaped, round, and ovoid red-fleshed guavas. B- Ovoid, round and pear-shaped whole white-fleshed guavas.
The pulp yielded per 100 grams of fresh fruits varied significantly (p=0.019) among the three, with the red-fleshed guava yielding the most (). The red guava variety had a high fruit pulp to seed ratio of up to 31, followed by the white at 18, and the strawberry, whose levels were only 12. Despite its relatively small size, the strawberry guava had a significantly (p=0.034) high seed weight per 100 gram of fruits, averaging 5g compared to the white guava’s 4g and the red guava’s 2g making it difficult to process the variety ().
Guava Fruit Flesh and peel Color
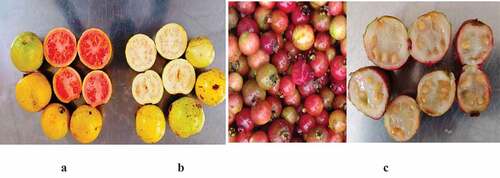
The white-fleshed fruit had the highest lightness, yellowness, chroma, and hue angle of the three fruit varieties. On the other hand, the redness index showed the most significant variation. The red-fleshed guavas were significantly (p<0.05) higher, with strawberries having the lowest readings in all color parameters. These were influenced by the color of the fruit peel and flesh (). The color of the fruit pulp showed significant (p=0.001) variations in all the color parameters on a hunter's CIE scale with significantly high variations in the L* (79) as well as the b* (60) indices leading to distinct differentiations among the fruit varieties (). The fruits’ peel and flesh colors were distinctively differentiated among the three varieties (). Except for the flesh color, there were no visual differences in the skin of the ripe white and red-fleshed guavas, whose color ranged from light green to deep yellow. On the other hand, the ripe strawberry guavas had green-red-purplish skin color and creamy flesh color (Figure 4.2). All the fruit varieties had a characteristically high number of seeds within the pericarp, as shown in the cross-sectional image ().
Table 2. Guava fruit flesh color for the red, white, and strawberry guava varieties.
Figure 2. Color images of whole and cross-sectional fruits' skin and flesh. A - red-fleshed, B - white-fleshed, and C -for strawberry guavas. Proximate composition of guava fruits.
Fruit Chemical Composition
The type III F-statistics ANOVA output revealed significant differences in the proximate and chemical compositions among most of the parameters of the various guava fruits except for the ash, crude protein, fats, and the energy compositions ().
Table 3. ANOVA table for the variations in the fruit’s chemical composition.
Proximate Composition
The guava fruits had significantly (p<0.0001) different dry matter contents, whereby the strawberry varieties had slightly higher levels of more than a fifth of the fruit (20.30 -23.40g 100−1g) as compared to the white and red varieties (). The white and red varieties whose dry matter ranged from 11.03-18.09 and 15.83-18.78g 100−1g were not significantly different (p<0.05). Consequently, the moisture content of the strawberry guava (76.60-79.70g 100−1 g) was significantly (p<0.001) lower than that of the other two (81.22 - 88.97g 100−1g), whose levels did not differ significantly (p>0.05). The levels of ash, crude protein, crude fat, and energy in the guava varieties were not significantly (p>0.05) differen (). On the other hand, the protein and ash levels varied the most at 85% and 50%, respectively, ranging from 0.09 to 1.22mg 100−1g, and 0.35 to 1.94g 100−1g, respectively. The strawberry guavas had the highest crude protein and ash levels, at 0.37-1.94 and 0.09-1.22g 100−1g compared to the red (0.35-0.61 and 0.09-0.91g 100−1g) and white guavas, which had 0.37-0.61 and 0.09-0.94g 100−1g, respectively. The crude fibre was significantly (p=0.046) higher in the strawberry guavas, averaging 37 g 100−1g, and lowest in red guavas, averaging 33 g 100−1g. The carbohydrates contents, which ranged from 54 to 67 g100−1g, were significantly (p=0.039) higher in the red-fleshed guava fruits.
Table 4. Proximate composition of the red, white, and strawberry guava varieties.
Guava Fruit Chemical, Mineral, and Phytochemicals Compositions
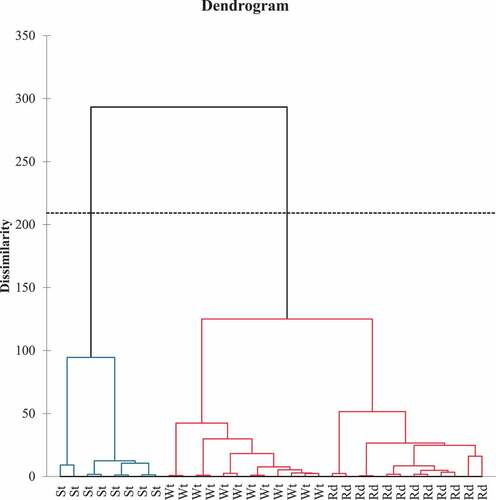
The results of agglomerative hierarchical clustering (AHC) based on the fruit chemical compositions revealed significant intra-class variations (60.7%) compared to inter-class differences with much narrower variances (39.3%), indicating significantly different fruit characteristics (p<0.05). The dissimilarity dendrogram plot () revealed two broad classifications with three homogeneous groups based on the three fruit varieties under consideration (). The TSS, pH, TA, minerals (zinc, iron, calcium, and potassium), and flavonoid content were all high in group 1, which was made up of the strawberry guavas. On the other hand, the vitamin C, beta-carotene, phenolics, antioxidants, TSS/TTA ratio, and color attributes for lightness (L*), redness (a*), and yellowness (b*), chroma, and hue angles were significantly higher in group 2 (Red and white) fruits The vitamin C, beta-carotene, phenolics, antioxidants, TSS/TTA ratio, and color attributes for lightness (L*), redness (a*), and yellowness (b*), chroma, and hue angles were significantly higher in group 2 (Red and white) fruits. The majority of the color parameters, including L*, b*, C*, and hue angles, vitamin C, and pH, were attributed to the white in group two. The red had higher phenolics, redness intensity (a*), antioxidants, carbohydrates, energy, and maturity ratio (TSS/TTA) than the white in group 2 ().
Table 5. Class centroid for the AHC fruit composition classification.
Figure 3. Dendrogram dissimilarity plot classification for the strawberry (St), White (Wt), and Red (Rd) guava varieties.
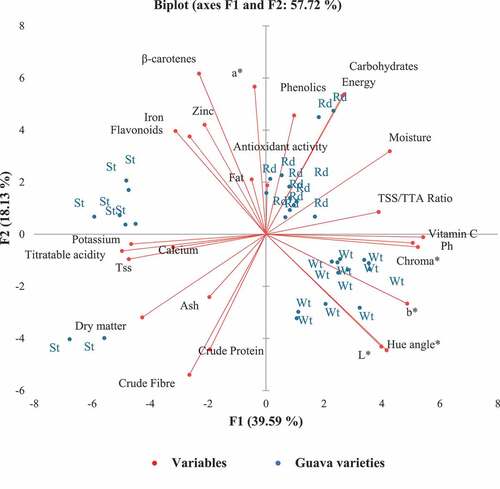
The correlation between physicochemical properties of guavas in relation to varieties using a PCA analysis biplot shows that the first two components explained up to 57.72% of the variability, according to the principal component analysis (). Generally, the energy and carbohydrates and the L* and hue angles all had strong positive correlations. The redness of the fruits was inversely related to the yellowness and lightness indices. The vitamin C levels were positively correlated with the fruit’s pH and weak positive association with the moisture and maturity ratio but inversely related to the TSS, beta carotenes, and minerals (). There were negative correlations between the moisture content and crude protein, fibre, ash and dry matter, calcium, potassium, total soluble solids, and titratable acidity. On the other hand, the zinc, iron, flavonoids, fat, beta carotenes exhibited an orthogonal relationship (). The beta carotenes, antioxidant activities, and the redness index, however, had positive correlations.
Figure 4. The PCA biplot for guava nutrient compositions. St- strawberry, Wt- White and Rd- Red guava.
The total soluble solids (TSS), pH, and titratable acidity (TTA) of the fruits were all significantly (p<0.05) different (). The strawberry guavas had the lowest pH (2.91), which correlated with a much higher TTA (1.4) than the other varieties, with pH values of 3.78-4.10 and 3.60-4.02 for white and red guavas, respectively. They were, however, not statistically significant (p>0.05). The strawberry guavas had significantly (p<0.0001) lower vitamin C levels, ranging from 149.75-181.65 mg 100−1 g, than the highest variety, white guavas, which were approximately ten times more (1371.13-1780.52 mg 100−1g). On the other hand, the latter had the most negligible amounts of beta-carotene (0.00- 0.13mg 100−1 g). The red-fleshed (1.32-2.88 mg 100−1 g) and strawberry guavas (1.10-1.98mg100−1 g), on the other hand, did not differ significantly (p<0.05). The zinc (1.40-9.75 mg 100−1 g), iron (3.34-12.18 mg 100−1g), potassium (171.43-413.87 mg 100−1 g), and calcium (4.35-12.84 mg 100−1 g) levels in white guavas were the lowest, while the strawberry variety had the highest levels, ranging from 6.83 - 1.41, 17.42-46.53, 366.01-467.74, and 13.45-28.01 mg 100−1 g respectively. On the other hand, the red guavas had values ranging from 3.30-8.56, 4.56-43.94, 168.36-288.45, and 2.29-24.58 mg 100−1 g respectively (). The white-fleshed guavas had the lowest phenolic and antioxidant activities (p<0.05). However, the red-fleshed guavas had the highest antioxidant capacity and total phenolics.
Table 6. Chemical, mineral, and phytochemical characterization of red, white and strawberry guava fruits.
Discussion
Physical Characterization of Guava fruits
The current findings show variations in the physicochemical and processing qualities of inter and intra fruit varieties, indicating the diverse morphological and genetic characteristics of indigenous and exotic Kenyan guava varieties, which varies significantly across the country in various agro-ecological zone (Chiveu, Citation2018). According to Chiveu (Citation2018), the Kenyan guava fruit morphological and genetic diversity frequently results in variation between the two most common broad guava varieties, the white and red-fleshed varieties, on which extensive research has been conducted worldwide (Flores et al. Citation2015). While the length and diameter of the fruits in this study were consistent with previous research, the sizes were significantly smaller than the 4.3–56.5–42.6, 57.1–44.8, and 65.6–50.4 cm reported in other studies (Kumari, Citation2016). Furthermore, the fruit diameters were significantly smaller than those reported in other studies, reporting diameters of 4.1–8.6, 3.5–8.4, and 5.8–7.2 cm for various bred guava cultivars by Kumari et al. (Citation2020) Pandey et al. (Citation2007) and Patel et al. (Citation2007). The findings on the variations in the fruit size, shape, length diameter, flesh, and skin color agree with Yusof's (Citation2003) findings, which show that the physical characteristics result from varietal and environmental factors and prevailing weather conditions.The physical guava fruit variation may be attributed to the interactions between the varieties' phenotypic, genotypic and environmental factors (Ali et al., Citation2014). Thus, the fruit’s current small size in this study may be due to a lack of genetic improvement in the local varieties as a result of the crop’s limited research programs (Omayio et al., Citation2020).
There were no differences in the skin color for the ripe red and white fruits, while the flesh colors were distinct, which was consistent with previous research on the genetic and morphological characteristics of the Kenyan guava varieties, as reported by Chiveu (Citation2018). On the other hand, the strawberry guavas had distinct skin colors that could be attributed to genotypic and morphological differences with the other two varieties.
The current study included mature ripe fruits weighing less than 100 g, although the recommended fruits for processing should be medium to large, weighing approximately 100–200 g or more (Yusof, Citation2003). Furthermore, as few seeds as possible are recommended. This was not the case in the current findings, indicating poor processing quality as the seed to pulp ratio was relatively high compared to other studies, indicating somewhat poor processing qualities as these ratios would result in high mass wastes (Devi et al., Citation2018). When compared to the white and strawberry varieties, the red-fleshed guavas had significantly better processing qualities. Furthermore, according to Omayio et al. (Citation2020), the variety is widely grown in Kenya and has a relatively long shelf life (Katumbi et al., Citation2020). Although the strawberry guavas were highly nutritious in most of the parameters tested, their production, short shelf-life, and high seed: pulp ratio made them difficult to process.
During the study, many fruits were found to be infected with the fruit fly, which is in line with Katumbi’s findings (unpublished thesis Citation2020), which stated that the local Kenyan guavas are susceptible to fruit fly infestation and thus require fumigation where necessary. As a result, the quality of the processing is highly affected. Some fruits were also infested with diseases, increasing their susceptibility to losses and resulting in undesirable processing qualities. However, these can be easily disinfected as part of crop husbandry.
chemical Qualities of Guava Fruits
The guava fruits’ proximate composition, pH, TTA, TSS, and vitamins, compositions agree with Chiveu (Citation2018) and Katumbi (Citation2020), who found the levels to be 3.08 – 4.38, 059-2.79 and 5.9-20.0oBrix, 58 – 2262 mg/100g vitamin C and 0.41 -3.0 mg/100g of beta-carotenes. Their findings of chemical differences were attributed to morphological and genetic variations in Kenyan guava fruit, which may have been the case in the current findings. Because the fruits grow from randomly dispersed seeds of various varieties, the agroecological zones had a significant impact on the fruit’s qualities and intra morphological differences, according to his research which resulted in the intra and inter cultivar variations as shown on the AHC and PCA plots. Additionally the fruits’ proximate composition was consistent with the findings of Ali et al. (Citation2014) and Yousafi et al. (Citation2021), on indigenous Sudanese and Pakistani guava cultivars, respectively.
Similar studies on local varieties show that the fruits vitamin C content was within varying levels ranging from 200 to 350 mg/100 g reported by Kaur et al. (Citation2009) and Rana et al. (Citation2015), although the strawberry levels were low and consistent with similar varieties as reported by Adrian et al. (Citation2012). Guava fruits are high in ascorbic acid, containing up to 4–8 times the amount found in other fruits, though the levels vary depending on the variety (Thaipong et al., Citation2005). Even though the whites had significantly higher vitamin C, which is consistent with Ali et al. (Citation2014) and Flores et al. (Citation2015), the low beta carotenes were caused by a lack of coloring carotenoids in the white guavas compared to the other two. Although the levels of beta-carotenes were lower, they were comparable to those found in white and red guava fruits reported in Western Kenya (Mutembete, Citation2020). The fat content positively correlated with the carotenoids, particularly the beta-carotenes, and the redness intensity of the fruits, both of which are based on the accumulation of fat-soluble pigments (Tian et al., Citation2015). However, because they are insoluble in water, they had an orthogonal relationship indicating independent occurrence. The lack of colored pigmentation in the white-fleshed guavas which were practically non-existent, resulted in negligible beta carotenes contents, limiting their potential in contributing to vitamin A intake among consumers. Additionally, all the minerals occurrence in the guava fruits would occur independently of the moisture content as these are bound within the fruit flesh (Rojas-Garbanzo et al., Citation2017).
The minerals in the guava fruits in this study varied significantly, as reported in previous studies by Chiveu et al., (Citation2019) and Pereira et al. (Citation2014) who found much lower levels of zinc (0 – 5.04 mg/100g), iron (6 -10.62 mg/100g) but high quantities of potassium (636- 4230 mg/100g) and calcium (30- 222 mg/100g). As Chiveu et al. (Citation2019) described, the levels of macro and micro minerals evaluated among the Kenyan guava varietis may be attributed to the agroecological, genetic, and environmental interactions. Furthermore, the phytochemical composition of the current fruits revealed significant bioactive compounds- the flavonoids, antioxidants, and phenolic, whose levels were comparable to those found in similar studies (Gutiérrez et al., Citation2008; Naseer et al., Citation2018; Youssef et al., Citation2017). Phytochemicals contribute immensely to boosting consumers' immunity by providing antioxidants that scavenge free radicals suspected to cause diseases within the human body besides playing key roles in the plants' flavor, color, and other functions (Kumar et al. Citation2021).
Conclusion and Recommendation
The guava fruits in the current study showed wide variations in the physicochemical and processing qualities of the Kenyan guava fruits varieties. However, the guava varieties contained significant quantities of nutrients that could aid in macro and micro intake among consumers. The current fruit varieties, particularly the red-fleshed guavas, that were found to have superior nutritional and processing properties should be strengthened to ensure fruits with high processing qualities. However, it is recommendable that good agricultural practices in guava fruit production be combined with appropriate post-harvest handling practices, which have historically been the fruit's greatest hindrance in the country.
Conflict of Interest
No potential conflict of interest was reported by the author(s).
Ethical Clearance
No human or animal subjects were used.
Data Availability
The data that support the findings of this study are available from the corresponding author, [Omayio, D.G], upon reasonable request.
Acknowledgement
We would like to express our gratitude for the technical assistance provided by Mr. Paul Ross Ongaro and the entire staff at the University of Nairobi's Pilot plant, where the Kenyan guava processing evaluation were assessed and extensively tested for viability.
Correction Statement
This article has been corrected with minor changes. These changes do not impact the academic content of the article.
Additional information
Funding
References
- Addinsoft. 2021. XLSTAT statistical and data analysis solution. (23.2.1127.0). XLSTAT. https://www.xlstat.com Accessed 15 June 2021.
- Adrian, J.A.L., N.Q. Arancon, B.W. Mathews, and J.R. Carpenter. 2012. Proximate analysis, in vitro organic matter digestibility, and energy content of common guava (psidium guajava l.) and yellow, strawberry guava (psidium cattleianum var. lucidum) tree parts and fruits as potential forage. J. Agric. Food Chem. 60(42):10398–10405. doi: 10.1021/jf303617p.
- Ali, D.O.M., A.R. Ahmed, and E.B. Babikir. 2014. Physicochemical and nutritional value of red and white guava cultivars grown in Sudan. J. Agri. FoodApp. Sci. 2(2):27–30.
- AOAC 2000 Chapter 37 . Official method 942.15 Acidity (Titrable) of fruit products. 17th Volume 2 . Maryland,USA: AOAC; .
- AOAC. 2005a. Official Methods of Analysis. 18th. Arlington: AOAC.
- AOAC. 2005b. Official Methods of Analysis of AOAC International; Arlington: AOAC International.
- AOAC. 2006. Official methods of analysis. Proximate Analysis and Calculations Total Nitrogen or Crude Protein (CP) - item 76. Reference data: Method 990.03; NITR; NT 17th Edition. Maryland, USA: AOAC.
- Chiveu, J. 2018. Assessment of genetic and nutritional diversity, and salinity tolerance of Kenyan guava (Psidium guajava L.): An underutilized naturalized fruit species [Georg-August-University Göttingen, Germany]. https://ediss.uni-goettingen.de/handle/11858/00-1735-0000-002E-E46B-4 Retrieved 10 October 2021
- Chiveu, J., M. Naumann, K. Kehlenbeck, and E. Pawelzik. 2019. Variation in fruit chemical and mineral composition of Kenyan guava (Psidium guajava L.): Inferences from climatic conditions, and fruit morphological traits. Cytogenetic and Genome Research 159(November 2015):151–159. doi: 10.5073/JABFQ.2019.092.021.
- de Abreu, J.R., C.D. Dos Santos, C.M.P. de Abreu, and E.M. de Castro. 2012. Histochemistry and morphoanatomy study on guava fruit during ripening. Food Sci. Technol. 32(1):179–186. doi: 10.1590/S0101-20612012005000019.
- Devi, R., S. Chawla, R. Devi, and V. Jain. 2018. Changes in physicochemical characteristics of guava fruits due to chitosan and calcium chloride treatments during storage. J. Pharmacogn. Phytochem. 7(3):1035–1044.
- Diniz, R.S., J.S.D.R. Coimbra, M.A. Martins, M. De Oliveira Dos Santos, M.D.M.S. Diniz, E. De Souza Santos, D.D. Santánna, R.A. Da Rocha, and E.B. De Oliveira. 2014. Physical properties of red guava (Psidium guajava L.) Pulp as affected by soluble solids content and temperature. Int. J. Food Eng. 10(3):437–445. doi: 10.1515/ijfe-2012-0250.
- Flores, G., S.B. Wu, A. Negrin, and E.J. Kennelly. 2015. Chemical composition and antioxidant activity of seven cultivars of guava (Psidium guajava) fruits. Food Chem. 170:327–335. doi: 10.1016/j.foodchem.2014.08.076.
- García-Rivera, L.M., H.A. Váquiro-Herrera, and J.F. Solanilla-Duque. 2016. Physicochemical characterization and nutritional composition analysis of Physicochemical characterization and nutritional composition analysis of pineapple guava at three different ripening stages Caracterización fisicoquímica y análisis de la composición. Agronom. Colombia. 34(2):217–227. doi: 10.15446/agron.colomb.v34n2.56030.
- Gutiérrez, R.M.P., S. Mitchell, and R.V. Solis. 2008. Psidium guajava: A review of its traditional uses, phytochemistry and pharmacology. J Ethnopharmacol 117(1):1–27. doi: 10.1016/j.jep.2008.01.025.
- Katumbi, J.N. 2020. Harvesting, postharvest handling, and the physicochemical changes during storage of guavas in two counties of Kenya. In MSc. Dissertation. http://erepository.uonbi.ac.ke/bitstream/handle/11295/153876/NdemeJ_Harvesting%2CPostharvestHandlingandthePhysiochemicalChangesDuringStorageofGuavasinTwoCountiesofKenya.pdf?sequence=1&isAllowed=y (University of Nairobi]) Retrieved 10 August 2021
- Katumbi, J.N., J.K. Imungi, G.O. Abong, and C.K. Gachuiri. 2020. Postharvest handling, hygiene knowledge and practices of guava fruit handlers in Kitui and Taita Taveta Tropentag, 2020 September 9 – 11th, 2020 Germany. : https://www.tropentag.de/2020/abstracts/posters/150.pdf Retrieved 16 September 2021.
- Kaur S, Sarkar B C, Sharma H K, and Singh C. 2009. Optimization of Enzymatic Hydrolysis Pretreatment Conditions for Enhanced Juice Recovery from Guava Fruit Using Response Surface Methodology. Food Bioprocess Technol, 2(1), 96–100. doi: 10.1007/s11947-008-0119-1
- Kr Chauhan A. 2014. Determination of Antioxidant Capacity, Total Phenolics and Antimicrobial Properties of Spray-Dried Guava Extract for Value-Added Processing. J Food Process Technol, 05(09), doi: 10.4172/2157-7110.1000368
- Kumar M et al . 2021. Guava (Psidium guajava L.) Leaves: Nutritional Composition, Phytochemical Profile, and Health-Promoting Bioactivities. Foods, 10(4), 752 doi: 10.3390/foods10040752
- Kumari, Y. 2016. Studies on effect of blending impact of guava (Psidium guajava L.) and papaya (Carica papaya L.) pulp on recipe standardization of blended nectar and RTS (Ready to Serve) beverages.
- Kumari, P., A. Mankar, K. Karuna, F. Homa, K. Meiramkulova, and M. Wasim. 2020. Mineral composition, pigments, and postharvest quality of guava cultivars commercially grown in India. J. Agric. Food Res. 2(July):100061. doi: 10.1016/j.jafr.2020.100061.
- Mitchel Otieno, O., M. James Mucunu, K. Laetitia Wakonyu, G. Daniel Waweru, K. Stephen Gitahi, O. Francis Okumu, and C. Okumu Mitchel Otieno. 2016. Phytochemical profile and antioxidant capacity of leaves of Moringa oleifera (Lam) extracted using different solvent systems. J. Pharmacogn. Phytochem. 5(4):302–308.
- Mustapha, Y., and S. Babura. 2010. Determination of carbohydrate and β-carotene content of some vegetables consumed in Kano metropolis, Nigeria. Bayero J. Pure Appl. Sci. 2(1):119–121. doi: 10.4314/bajopas.v2i1.58515.
- Mutembete, R.W.R. 2020. Assessment of selected essential micronutrients in some indigenous fruits in Kakamega county, Kenya: Kenyatta University. Retrieved 10 August 2021 https://ir-library.ku.ac.ke/bitstream/handle/123456789/21464/Assessment%20of%20selected%20essential%20micronutrients.pdf?sequence=1&isAllowed=y
- Naseer, S., M. Rahman, M. Pervaiz, N. Naeem, and S. Hussain. 2018. The phytochemistry and medicinal value of Psidium guajava (guava). Clin. Phytosci. 4(1). doi: 10.1186/s40816-018-0093-8.
- Nisha , Chandel, Vivek, Kumar Kurrey, Ritu , Rani Minz, Omesh , Thakur. 2016. Fruit nectar as a refreshing beverage an overall review Plant archives . 18():1163–1169 Accessed5 September 2021.
- Omayio, D., G. Abong’, M. Okoth, C. Gachuiri, and A. Mwang’ombe. 2020. Trends and Constraints in Guava (Psidium Guajava L.) Production, Utilization, Processing and Preservation in Kenya. Int. J. Fruit Sci. 20(sup3):S1373–S1384. doi: 10.1080/15538362.2020.1791304.
- Ooko Abong’, G., T. Muzhingi, M. Wandayi Okoth, F. Ng’Ang’A, P.E. Ochieng’, D. Mahuga Mbogo, D. Malavi, M. Akhwale, and S. Ghimire. 2020. Phytochemicals in Leaves and Roots of Selected Kenyan Orange Fleshed Sweet Potato (OFSP) Varieties. Int. J. Food Sci. 2020:1–11. doi: 10.1155/2020/3567972.
- Pandey, D., S.K. Shukla, R.C. Yadav, and A.K. Nagar. 2007. Promising Guava (Psidium guajava L.) Cultivars for North Indian Conditions. Int. Guava Sympos. 1943:91–94.
- Patel, R.K., D.S. Yadav, K.D. Babu, A. Singh, and R.M. Yadav. 2007. Growth, Yield and Quality of Various Guava (Psidium guajava L.) Hybrids/Cultivars under Mid Hills of Meghalaya. Acta Hortic. 2:57–60. doi: 10.17660/ActaHortic.2007.735.5.
- PCE Instruments. 2014 Colour quality control system-CQCS3 . User Manual https://www.pce-instruments.com/english/measuring-instruments/test-meters/colorimeter-pce-instruments-colorimeter-pce-csm-4-det_2155012.htm#tab-files Retrieved 13 June 2021; PCE Instruments UK Ltd.
- Pereira, M.C., W. Boschetti, R. Rampazzo, P.G. Celso, P.F. Hertz, A.D.O. Rios, M. Vizzotto, and S.H. Flores. 2014. Mineral characterization of native fruits from the southern region of Brazil. Food Sci. Technol. 34(June):258–266.
- Puwastien, P., T.E. Siong, J. Kantasubrata, G. Craven, and K.J. Rafael Ryan Feliciano. 2011. The ASEAN Manual of Food Analysis. First Edition. Thailand: Institute of Nutrition, Mahidol University. 196. www.inmu.mahidol.ac.th/aseanfoods Retrieved 6 February 2021.
- Rana S, Siddiqui S, and Goyal A. 2015. Extension of the shelf life of guava by individual packaging with cling and shrink films. J Food Sci Technol, 52(12), 8148–8155. 10.1007/s13197-015-1881-5
- Rojas-Garbanzo C, Zimmermann B F, Schulze-Kaysers N, and Schieber A. 2017. Characterization of phenolic and other polar compounds in peel and flesh of pink guava (Psidium guajava L. cv. ‘Criolla’) by ultra-high performance liquid chromatography with diode array and mass spectrometric detection. Food Research International, 100 445–453. 10.1016/j.foodres.2016.12.004
- Thaipong, K., U. Boonprakob, L. Cisneros-Zevallos, and D.H. Byrne. 2005. Hydrophilic and lipophilic antioxidant activities of guava fruits. Southeast Asian J. Trop. Med. Public Health 4(suppl 4):254–257. doi: 10.1002/1521-3803(20020901)46:5<353::AID-FOOD353>3.0.CO;2-B.
- Tian, S.L., L. Li, S.N.M. Shah, and Z.H. Gong. 2015. The relationship between red fruit colour formation and key genes of capsanthin biosynthesis pathway in Capsicum annuum. Biol. Plantarum 59(3):507–513. doi: 10.1007/s10535-015-0529-7.
- Turck, D., J. Bresson, B. Burlingame, S. Fairweather‐Tait, M. Heinonen, K.I. Hirsch‐Ernst, I. Mangelsdorf, H.J. McArdle, A. Naska, G. Nowicka, et al. 2016. Scientific Opinion on the energy conversion factor of d‐tagatose for labelling purposes. EFSA J. 14(11). doi: 10.2903/j.efsa.2016.4630.
- Yousafi, A.A., K.S. AbbasiI, A. Ahmad, I. Hassan, A. Sohail, A. Qayyum, and M.A. Akram. 2021. Physico-chemical and Nutraceutical Characterization of Selected Indigenous Guava (Psidium guajava L.) Cultivars. Food Sci. Technol. 41(1):47–58. doi: 10.1590/fst.35319.
- Youssef, M.A., E.A.A. Khafar, and A. El Kady. 2017. Studying the adulteration consequences of Guava Juice on vitamin - C loss at different packaging materials. Curr. Sci. Int. 6(3): 570–577. https://www.google.com/url?sa=t&rct=j&q=&esrc=s&source=web&cd=&ved=2ahUKEwjAxcyK6v71AhWBjaQKHUWvDEMQFnoECAYQAw&url=http%3A%2F%2Fwww.curresweb.com%2Fcsi%2Fcsi%2F2017%2F570-577.pdf&usg=AOvVaw29AgrrSFkwFL-g31LbKiEg Retrieved 12 July 2021
- Yusof, S. 2003. Guavas. InEncyclopedia of Food Sciences and Nutrition. 2nd ed., Volume 5. Baltimore, MD, USA: Elsevier. 2985–2992 978-0-12-227055-0. doi:10.1016/B0-12-227055-X/005721