
ABSTRACT
This study primarily analyzed the response of cold tolerance and phenology periods of four pear cultivars to climate differences in central (Gongzhuling) and eastern (Longjing) Jilin, which could provide a theoretical basis for the regional division and cultivation. It showed that there was a significant difference in the cold tolerance of the same cultivars between the two regions. Soluble sugar and soluble starch contents are the most important physiological indicators that determine the cold tolerance of the pear cultivars in Gongzhuling is stronger than that in Longjing. In phenology, only the cessation of terminal shoot extension and growing season length of pear cultivars were significantly related to their contents of soluble sugar and soluble starch. Furthermore, the gray correlation analysis identified the district’s effective accumulated temperature as the key meteorological factors affecting the cessation of terminal shoot extension. The precipitation in the growing season was another major meteorological factor affecting the growing season length. Therefore, in this study, the influence of the main district meteorological factors on the key phenology periods of four pear cultivars, which decided the different accumulation of sugar and starch, eventually lead to the difference in cold tolerance of the same pear cultivar in two regions.
Introduction
Low temperature is a main environmental factor that influences crop productivity, quality and even survival (Chinnusamy et al., Citation2007). Pear (Pyrus) is an influential deciduous fruit tree, and the regional distribution of different pear species is also determined by temperature (Nhorn et al., Citation2011; Ouni et al., Citation2020). In Northeast China, Pyrus ussuriensis is a main species and is commonly used as breeding material for its excellent cold tolerance (Liu et al., Citation2019; Yang and Huang, Citation2018; Zhang et al., Citation2007). But the tolerance performance of some hybrid cultivars from P. ussuriensis was not as expected. In fact, some promising fruit trees possess great tolerance at first, but they may lack the ability to adequately retain it under relatively warm areas in winter, causing serious freezing injury (Caprio and Quamme, Citation1999). However, the related mechanisms of pear trees have received considerably less attention.
The acquisition of plant cold tolerance is a complex physiological response process. Some studies suggest that plants responding to low temperatures will launch changes in the composition, structure and function of the cell membrane (Arisz et al., Citation2013; Dominguez et al., Citation2010). Furthermore, it promotes hormone signal transduction and synthesis of soluble sugars, proteins and other osmotic regulatory substances, improving the activity of antioxidant enzymes contributing to cold tolerance (Habibi et al., Citation2023, Secchi et al., Citation2021; Shi et al., Citation2015; Tauzin and Giardina, Citation2014).
In addition to internal factors, external factors can also affect cold-tolerant capabilities. We found previously that in the same region, the stronger cold tolerance of pear cultivars, their bud bursting period and initial blossoming period were relatively earlier (Rowland et al., Citation2005). It can be seen that cold tolerance may correlate with phenology. Meanwhile, the timing of phenology events is heavily controlled by climate such as temperature, precipitation and photoperiod (Gordo and Sanz, Citation2010; Samtani et al., Citation2015; Wolkovich and Cleland, Citation2014). Numerous studies have demonstrated that most plant species tend to advance and extend their reproductive period in response to higher temperatures (Menzel et al., Citation2006; Moore and Lauenroth, Citation2017; Sherry et al., Citation2007; Valencia et al., Citation2016). However, this is not a universal pattern; previous studies have reported a non-negligible number of species with delayed or non-significant phenological responses to warming (Cook et al., Citation2012; Yu et al., Citation2010). So far, few studies have examined linkages between pear phenology and regional tolerance availability. Meanwhile, it is unknown whether the regional difference in the cold tolerance of pear is caused by the change of phenology due to climate effect.
The objective of this research was to illuminate the reason for the different cold-tolerant performances of the same pear cultivars in different regions. Hence, the relationships among the cold tolerance, phenology and meteorological factors were carried out to analyze the high-quality pear cultivars “Pingguoli,” “Pingxiangli,” “Hanhongli” and “Hanxiangli” planted in central (Gongzhuling) and eastern (Longjing) Jilin, China. We hope to find out the crucial factors affecting cold-tolerant performance of pear cultivars during regional cultivation.
Materials and Methods
Plant Materials
The four pear cultivars included “Pingguoli” (Pyrus bretschneideri), “Pingxiangli” (P. bretschneideri × P. ussuriensis), “Hanhongli” (P. ussuriensis × P. bretschneideri) and “Hanxiangli” (P. ussuriensis × P. ussuriensis) from two orchards of Gongzhuling and Longjing. These cultivars were used as plant materials to compare the cold tolerance and phenology period and analyze their response to regional meteorological factors. The row spacing in both orchards was 3.0 m × 4.0 m, and the soil at both sites was brown coniferous forest soils. Meanwhile, normal management models were all adopted for nutrient and water supplies in two orchards.
Each cultivar was grafted seedlings with sorb (P. ussuriensis) as rootstock. Three plants of each cultivar with the same age (10 years old), normal and moderate vigor of growth were selected separately as three biological replicates to carry out the subsequent experiments. The annual branches with 0.4–0.6 cm thick were collected from each cultivar, put them into liquid nitrogen quickly and then stored at −80°C for determining the physical indexes. Meanwhile, phenology periods of each cultivar from two regions were investigated from 2019 to 2021, respectively.
Meteorological Data
The HOBO meteorological monitoring systems were set in two orchards of Gongzhuling (124°02´E, 43°11´N) and Longjing (128°54´E, 42°21´N). These systems monitored and automatically recorded the meteorological data of individual orchard including annual average air temperature, precipitation, photoperiod, effective accumulated temperature and free-frost days. The meteorological data were stored in the HOBO meteorological monitoring systems and exported in Excel format. The 3 years (2019 to 2021) of meteorological data in each orchard were considered as three replicates.
Phenology Survey
The survey indicators of each cultivar in two orchards contained budding green period, initial flowering period, blooming period, new shoot cease-growing period, fruit maturity period, defoliation period and growing season days. The specific criteria of each phenology period are described in . At the same time, the phenological date is converted by the Julian daily conversion method (Yang et al., Citation2022). The phenology data were repeated thrice as three biological replicates.
Table 1. Criteria for phenology phase investigation.
Malondialdehyde Content
Malondialdehyde (MDA) content was determined using the protocol of Yang et al. (Citation2007). For each cultivar in every tested orchard, a 0.2 g branch sample was homogenized with 2 mL 0.1% (w/v) trichloroacetic acid in an ice bath. The homogenate was then centrifuged at 10,000 ×g for 10 min, and the supernatant liquid was transferred to a test tube. Next, 1 mL 0.5% (w/v) thiobarbituric acid was added, and the tube was placed in a boiling water bath for 10 min. The test tubes were placed in 0°C cold water for rapid cooling and then centrifuged for 15 min at 5000 ×g. Absorption values of the second supernatant liquid were transferred to the 1-cm-thick cuvette and then measured at 532 nm and 600 nm wavelengths. The MDA content was calculated by molar extinction coefficient of 155 mM−1∙cm−1. The malondialdehyde measurements were repeated thrice as three biological replicates.
Soluble Sugar and Soluble Starch Content
To determine the soluble sugar, a 0.5 g branch sample was ground adding 5 mL distilled water. The homogenate was extracted in boiling water for 1 h. After natural cooling, the extracted solution was filtered into a 25 mL volumetric flask, the residue was washed, and the volume was adjusted to the graduation with distilled water. Then 0.5 mL of this solution was placed in 20 mL glass test tube with cover, adding 0.5 mL of anthranone solution (1 g anthrone +50 mL ethylacetate), 5 mL of 98% H2SO4 and 1.5 mL distilled water. The solution was heated in a water bath at 100°C for 1 min. After natural cooling to room temperature, the absorbance of colored solution was measured at 630 nm according to the method of Xiong et al. (Citation2011). The soluble sugar measurements were repeated thrice as three biological replicates.
Soluble starch was determined by the method of Xiong et al. (Citation2011). The residue of soluble sugar determination was added to 3 mL distilled water, then mixed well and gelatinized in 100°C water bath for 15 min. After natural cooling to room temperature, 2.0 mL 9.2 mol L−1 HClO4 was added to extract for 15 min, then filtered into 25 mL volumetric flask. This step was repeated once again. Finally, the residue was rinsed repeatedly, and the volume was adjusted to the graduation with distilled water. The 0.5 mL of extracting solution was placed in 20 mL glass test tube with a cover, adding 0.5 mL mixed reagent (1 g anthrone +50 mL ethylacetate), 5 mL of 98% H2SO4 and 1.5 mL distilled water. The mixture was heated at 100°C for 1 min, and absorbance was read at 630 nm after cooling to 30°C. The soluble starch measurements were repeated thrice as three biological replicates.
Soluble Protein and Superoxide Dismutase
Samples (1 g) were homogenized with 100 mM potassium phosphate (pH7.8) containing 0.1 mM EDTA and 1% (w/v) 50 mM polyvinylpyrrolidone (PVPP) at 4°C. The homogenate was centrifuged at 15,000 ×g for 20 min, and the supernatant was analyzed for soluble protein and superoxide dismutase (SOD) activity. The protein contents were determined according to the method of Bradford (Citation1976) using coomassie brilliant blue G250 to stain, and the absorbance was measured at 595 nm wavelength with bovine serum albumin as standard. The soluble protein measurements were repeated thrice as three biological replicates.
The superoxide dismutase (SOD) activity was measured as described by Beyer and Fridovich (Citation1987). Using SOD inhibition of the reduction of nitroblue tetrazolium (NBT) in light, the activity of SOD enzyme required by NBT under 560 nm was defined as 50% equivalent to the enzyme activity of 1 unit. The reaction mixture contained 50 mM potassium phosphate buffer (pH7.8), 130 mM L-methionine, 750 μM NBT, 100 μM ethylenediaminetetraacetic acid, 20 μM riboflavin and plant extract in a 3 mL volume. The enzyme activity was determined after the reaction mixture was exposed to 10,000 lx light for 20 min at 30°C. The superoxide dismutase measurements were repeated thrice as three biological replicates.
Statistical Analysis
All the statistical analyses were processed using a SAS9.0 system (SAS Institute Inc., Cary, NC, USA) for Windows. Mean separations were performed using Tukey’s Honestly Significant difference (HSD) at the 0.05 level. Pearson’s correlation coefficients and gray correlation degrees were used to assess the associations between the new shoot cease-growing period and the length of the growing season and meteorological factors, respectively. The principal component scores were determined to assess and compare the cold tolerance of four pear cultivars between the two regions. Evaluation of cold tolerance is based on the comprehensive score of each material that was calculated by principal component score and the corresponding proportion of each principal component that transformed from the above five physical indexes. The graphs were constructed using SigmaPlot 10.0 (Systat Software Inc., San Jose, CA, USA).
Results
Comparison on the Cold Tolerance of Pear Cultivars Between Two Regions
According to the comprehensive score, there were significant differences in cold tolerance of the same pear cultivars between two regions. The score of four pear cultivars included “Pingguoli”, “Pingxiangli”, “Hanhongli” and “Hanxiangli” in Gongzhuling were from 0.37 to 0.92, but in Longjing it ranged from −0.19 to −1.27 (), indicating that the cold tolerance of former was stronger than the latter. In addition, the contents of soluble sugar and soluble starch were determined to play a decisive role in pear cold tolerance based on the eigenvalues of the first principal component (). And four pear cultivars’ soluble sugar and soluble starch contents in Gongzhuling were higher than those in Longjing (). But there was no significant difference for the soluble sugar contents between two regions except “Pingguoli” and “Hanxiangli”, while only the soluble starch contents of “Pingxiangli” and “Hanxiangli” showed significant differences between two regions ().
Figure 1. Evaluation on the cold tolerance of four pear cultivars including “Pingguoli,” “Pingxiangli,” “Hanhongli” and “Hanxiangli” in two regions of Gongzhuling and Longjing.
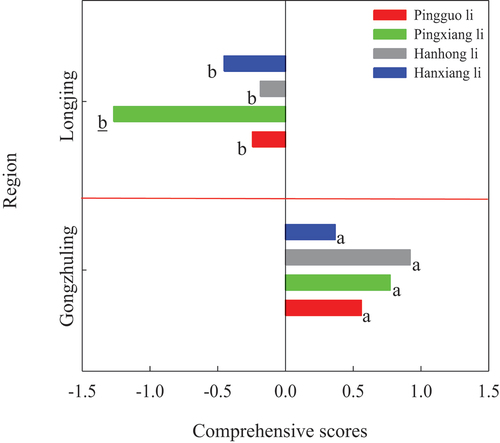
Table 2. Comparison on the physical indexes related to cold tolerance of four pear cultivars including “Pingguoli,” “Pingxiangli,” “Hanhongli” and “Hanxiangli” between two regions of Gongzhuling and Longjing.
Table 3. The principal component analysis on the physiological indexes of four pear cultivars including “Pingguoli,” “Pingxiangli,” “Hanhongli” and “Hanxiangli” in two regions of Gongzhuling and Longjing.
Comparison on the Phenology Periods of Pear Cultivars Between Two Regions
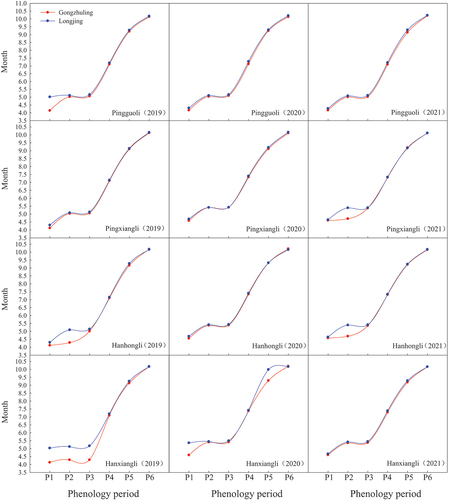
Six phenology periods of tested pear cultivars in two regions were investigated (). On the whole, four periods including budding green, initial flowering, blooming and original shoot cease-growing of tested cultivars in Gongzhuling occurred earlier than that in Longjing. However, the fruit maturity period of “Pingxiangli” in 2021 and the defoliation periods of “Hanhongli” and “Hanxiangli” from 2019 to 2020 were later than Longjing. In addition, there were also certain differences in phenology periods among different years for the same cultivar in the same region.
Figure 2. The phenology periods investigation of four pear cultivars including “Pingguoli,” “Pingxiangli,” “Hanhongli” and “Hanxiangli” in two regions of Gongzhuling and Longjing.
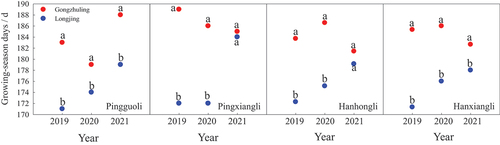
The days from the budding green period to the defoliation period represent the length of the growing season in the pear cultivar. In this study, there was significant difference in the growing season lengths in tested pear cultivars between the two regions. For the same tested cultivars, the growing season days ranged from 179 d to 194 d in Gongzhuling, but in Longjing the days were from 166 d to 181d ().
Figure 3. Comparison on the growing season days of four pear cultivars including “Pingguoli,” “Pingxiangli,” “Hanhongli” and “Hanxiangli” between two regions of Gongzhuling and Longjing.
Correlations Analysis Between the Parameters Related to Cold Tolerance and Phenology Periods
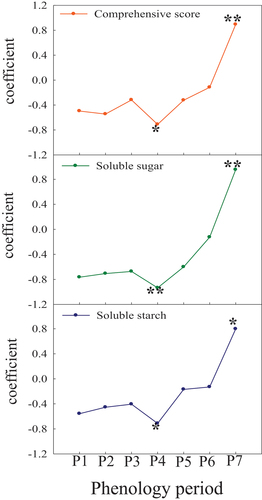
We used the correlations analysis trying to clarify the key phenology periods relevant to the difference in cold tolerance of tested cultivars between two regions (). The main parameters related to cold tolerance were comprehensive score, soluble sugar and soluble starch that were all significant negative correlation with original shoot cease-growing period (r = −0.7100 at p = .05, r = −0.9343 at p = .01, r = −0.7125 at p = .05, respectively; ), while were significant positive correlation with growing season days (r = 0.8934 at p = .01, r = 0.9537 at p = .01, r = 0.7973 at p = .05, respectively; ). There was no significant correlation with additional periods. Thus, among them, it can be seen that original shoot cease-growing stage and growing season days were the most vital phenology factors related to cold-tolerant performances of four pear cultivars in two regions’ winter.
Figure 4. Correlation analysis between the cold-tolerant parameters and phenology periods.
Comparison on the Meteorological Factors Between Two Regions
In this study, the meteorological factors in two regions were recorded during the 3 years from 2019 to 2021. The effective accumulated temperature can reflect the heat demand for biological growth and development in crops. The ranges of effective accumulated temperatures of tested pear cultivars in Gongzhuling were from 3442.2°C·d to 3674.3°C·d, that in Longjing from 3210.6°C·d to 3259.5°C·d, this parameter in Gongzhuling was always significantly greater than that in Longjing during the 3 years ().
Figure 5. Comparison on the effective accumulated temperature (A) and days of frost-free period (B) between two regions of Gongzhuling and Longjing.
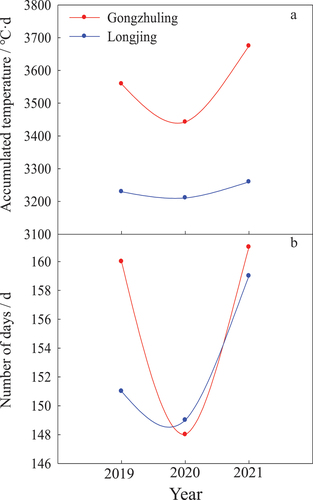
The frost-free period could represent the length of crop growth that was calculated by the interval from the last frost date in spring to the first frost date in autumn. The days of frost-free periods of tested pear cultivars in Gongzhuling ranged from 148 d to 161 d, while those in Longjing were from 149 d to 159 d. Although the difference between the two regions was not significant, the length of the frost-free period in Gongzhuling was commonly more than in Longjing except for 2020 ().
The average temperatures, total precipitation and photoperiod were accounted for the whole year (January to December), growth season (April to September), spring (March to May), summer (June to August), autumn (September to November) and winter (December to February) by the record of meteorological monitoring systems in two regions ().
Figure 6. Comparison on the annual average temperature (A), the average temperature in growth season (B) and four seasons in 2019 (C), 2020 (D) and 2021(E) between two regions Gongzhuling and Longjing.
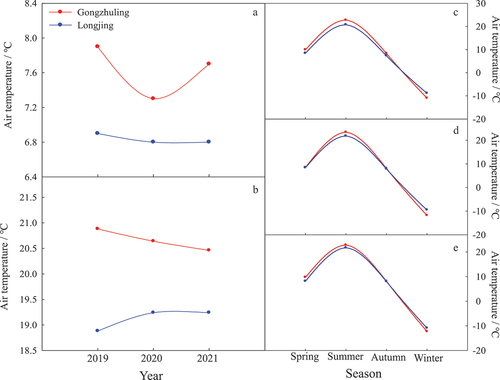
Figure 7. Comparison on the annual precipitation (A), the precipitation in growth season (B) and four seasons in 2019 (C), 2020 (D) and 2021(E) between two regions of Gongzhuling and Longjing.
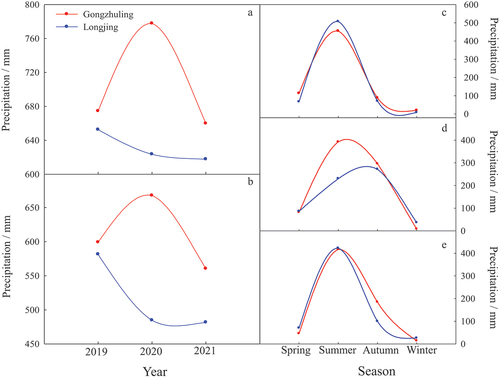
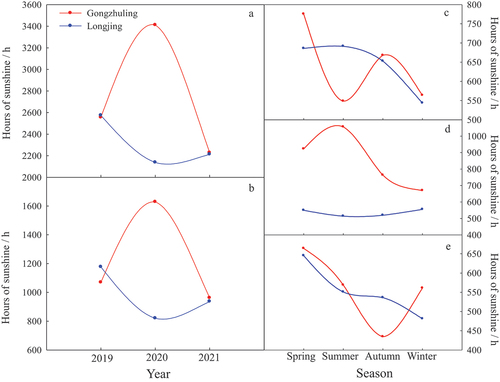
Figure 8. Comparison on the annual sunshine hours (A), sunshine hours in growth season (B) and four seasons in 2019 (C), 2020 (D) and 2021(E) between two regions of Gongzhuling and Longjing.
For the average temperature, the trends in four seasons were similar from 2019 to 2021 in two regions. However, the winter temperatures in Gongzhuling from 2019 to 2021 were 2.2°C, 2.3°C and 1.4°C lower than those in Longjing, respectively. Except for winter, Gongzhuling’s annual average temperatures and corresponding temperatures in the growth season – spring, summer and autumn – were constantly higher than Longjing’s. In addition, Gongzhuling’s temperatures dropping from autumn to winter were faster than Longjing’s, and temperatures returning from winter to spring were also faster than Longjing’s ().
Comparing the precipitation between two regions, the total precipitations of Gongzhuling in the whole year, growth season and autumn were all more than Longjing during the 3 years. But in spring and winter, the total precipitations of Gongzhuling were higher than that of Longjing only in 2019 and lower in the other 2 years; in summer, higher precipitation of Gongzhuling appeared in 2020 compared to Longjing ().
The annual photoperiod in Gongzhuling ranged from 2227.9 h to 3410.8 h, which in Longjing was from 2137.7 h to 2573.5 h. However, there was no significant difference in the annual photoperiod between the two regions except in 2020. Meanwhile, the sunshine hours of Gongzhuling in the growing season and four seasons were higher than Longjing in 2020. In addition, from 2019 to 2021, the sunshine hours of Gongzhuling in spring and winter were always higher than Longjing, but it was lower than Longjing in 2019 of growing season and summer and in 2021 of autumn ().
Grey Correlations Analysis Between Key Phenology Periods and Meteorological Factors in Two Regions
The original shoots cease-growing period and growing-season length had been determined as the key phenology periods related to pear cold tolerance. Moreover, using the gray correlation analysis we identified the main meteorological factors affecting key phenology periods.
The degree of gray correlation between effective accumulated temperature and original shoots cease-growing period was 0.9534, ranking first, while the correlation between the frost-free period, the average temperature in spring, the average temperature in the growing season, annual average temperature and original shoots cease-growing period ranked second to fifth, respectively. In addition, except for the frost-free period, the remaining four meteorological factors were all significantly correlated with original shoots cease-growing period (), which indicated that effective accumulated temperature should be the main meteorological factor causing the difference of original shoots cease-growing period between two regions, followed by the average temperature in spring, growing season and annual temperature.
Table 4. Correlation analysis between key phenology periods and meteorological factors.
Additionally, growing season length was another critical phenology period closely related to the difference in cold tolerance in tested pear cultivars between two regions. Here, among the 20 meteorological factors, the average temperature in growing season ranked first as the highest gray correlation degree with growing-season length (), subsequently, ranking from second to fifth was effective accumulated temperature, annual average temperature, frost-free period and precipitation in the growing season. However, only the correlation between the frost-free period and growing-season length was not significant among the five main meteorological factors. So according to the results, the effective accumulated temperature, the annual average temperature, the average temperature in the growing season and the precipitation in the growing season could be regarded as the main meteorological factors affecting the key phenology periods.
Discussion
The freezing injury index is usually used as an important indicator for cold tolerance in trees (Zhang et al., Citation2002). The average freezing injury indexes of four pear cultivars “Pingguoli,” “Pingxiangli,” “Hanhongli” and “Hanxiangli” in Gongzhuling for two consecutive years ranged from 0.40 to 0.70, were classified into cold-tolerant cultivars based on freezing injury indexes (Liu et al., Citation2022). However, the branches of the same cultivars in Longjing to overwinter suffered from cold damage instead, their freezing injury indexes exceeded 0.85 (data not shown). In 2019, we further evaluated their cold tolerance by the principal component analysis of physical indexes and calculated the comprehensive score of four pear cultivars “Pingguoli,” “Pingxiangli,” “Hanhongli” and “Hanxiangli” in two regions. The results showed that there was a significant difference in cold tolerance of the same pear cultivar between both regions. The comprehensive scores of four pear cultivars in Gongzhuling were positive values, but in Longjing, their scores were all negative values (), still illustrating that the tolerance of the former was stronger than the latter. Hence, environmental conditions may play an essential influence on cold-tolerant formation for pear cultivars. In addition, it caused different responses of cold resistance among different pear species in the same region. P. ussuriensis cultivars had stronger tolerance than P. betulaefolia cultivars (Li et al., Citation2020). There is an urgent need to understand the hardiness mechanisms at low-temperature conditions for developing novel cold-tolerant pear germplasms.
Some studies suggested that cold damage could cause two major types of injury including osmotic stress and oxidative stress (Chu et al., Citation2018; Dreyer and Dietz, Citation2018; Fang et al., Citation2022; Mao et al., Citation2022). Under osmotic stress, the changes in the accumulation of compatible solutes are the most prominent alterations observed among the physiological and biochemical characteristics of plants (Karami et al., Citation2018; Zhao et al., Citation2020). Soluble sugars and soluble starch as compatible solutes participated in multiple metabolic pathways to resist cold stress (Lee et al., Citation2023; Zhang et al., Citation2019). In this study, we confirmed that the contents of soluble sugars and soluble starch played a decisive role in cold tolerance of pear cultivars in two regions. While soluble sugars and soluble starch had significant effects on reactive oxygen species (ROS) scavenging (Cabello et al., Citation2014; Dong et al., Citation2019; Miller et al., Citation2010). It was reported that overexpression of PbrBAM3 isolating from Pyrus betulaefolia in tomato promoted its starch degradation and soluble sugar accumulation, lessened ROS generation, protected the stability of the membrane and improved tomato tolerance to chilling stress (Zhao et al., Citation2019). Compared with the pear cultivars in winter of Gongzhuling, the soluble sugar contents of the same cultivars in Longjing decreased, leading to the membrane damage to some extent, reflected in their MDA contents increase. Therefore, this may be one of the reasons for the loss of pear cold tolerance in Longjing.
Besides physiological characteristics, phenology periods might also reflect the ability of plant cold tolerance (Deng et al., Citation2020, Rowland et al., Citation2005; Szalay et al., Citation2021). But the research on how exactly relate between pear hardiness and phenology is lacking. Liu found that the bud bursting period and initial blossoming period were relatively early in high cold tolerance of pear cultivars (2022). In this research, the phenology periods of four pear cultivars “Pingguoli,” “Pingxiangli,” “Hanhongli” and “Hanxiangli” were investigated and compared between two regions from 2019 to 2021. We found that the phenology periods of the same cultivar in Gongzhuling were earlier than that in Longjing on the whole, but their growing season days were further than that in Longjing instead. Additionally, the correlated analysis indicated that the main parameters relating to pear cold tolerance including comprehensive score, soluble sugar and soluble starch. These three parameters were negatively correlated with cessation of terminal shoot extension and positively correlated with growing season lengths. But they had no significant correlation with alternative phenology periods. Therefore, the critical phenology periods related to cold tolerance of pear were determined as cessation of terminal shoot extension and growing season lengths in this study.
When the cessation of terminal shoot extension occurs, the photosynthetic products will export from leaves to branches and roots gradually (Zhou et al., Citation2015). This period could affect the accumulation of nutrients in branches and roots. In addition, the photosynthetic capacity of four pear cultivars “Pingguoli,” “Pingxiangli,” “Hanhongli” and “Hanxiangli” in Longjing were all weaker than in Gongzhuling (Hu et al., Citation2022). In the research, the growing season length of pear trees in Longjing was also shorter than in Gongzhuling. This may be the other reason for the cold-tolerant loss of pear cultivars planting in Longjing. Changes in the critical phenology periods lead to fewer stored amounts of products such as sugar and starch, making it impossible to effectively maintain the osmotic equilibrium in trees to ensure overwintering safely (Farrar et al., Citation2000).
Plant phenology could be mainly affected by meteorological factors involving temperature, precipitation and photoperiod (Ge et al., Citation2022; Xie et al., Citation2020; Zeng et al., Citation2021). In this research, we also compared the meteorological factors between the two regions from 2019 to 2021. There were differences between Gongzhuling and Longjing. In general, during the 3 years, the effective accumulated temperature, average temperature and total precipitation in Gongzhuling were consistently higher than that in Longjing. Then, the variation of meteorological factors in every season was further analyzed, the main meteorological factors affecting the key phenological periods of pear cultivars had been identified based on the gray correlation analysis and significant analysis. Among the 20 meteorological factors correlated with cessation of terminal shoot extension, the effective accumulated temperature ranked first with the highest gray correlation degree, the second was the average temperature in spring; while for the growing-season days, the average temperature in growing season (April to September) ranked first with the highest gray correlation degree, and precipitation in growing season was also the main factor. These key meteorological factors will affect the growth and development of fruit trees and play some role in regulating the accumulation of soluble sugar and starch content in trees (Iwanami et al., Citation2023; Yang et al., Citation2022). To some extent, whether the trees can survive overwinter safely, not only depending on the district’s absolute low temperature in winter.
Conclusion
Soluble sugar and soluble starch contents played a decisive role in the cold-tolerant ability of pear cultivars in different ecological regions. While the level of sugar and starch in branches were closely associated with the cessation period of terminal shoot extension and growing season length. Higher effective accumulated temperature and precipitation of the growing season as critical meteorological factors would promote the original shoot cease-growing period ahead and prolong the growing season. This directly helped to enhance nutrient accumulation and mature branches ahead of time and ensured safe overwintering of pear trees in cold regions. The cold tolerance performances of pear cultivars in different regions were not exclusively related to the district’s absolute low temperatures in winter. The main physiological, phenology and meteorological factors need to be considered in the process of regional division and popularization of excellent pear cultivars.
Acknowledgments
Thanks to Li Xiong, head of Yanbian Comprehensive Experimental Station of National Pear Industry Technology System for assistance.
Disclosure statement
No potential conflict of interest was reported by the author(s).
Additional information
Funding
References
- Arisz, S.A., R.V. Wijk, W. Roels, J.K. Zhu, M.A. Haring, and T. Munnik. 2013. Rapid phosphatidic acid accumulation in response to low temperature stress in Arabidopsis is generated through diacylglycerol kinase. Front. Plant Sci 4:1–15. doi: 10.3389/fpls.2013.00001.
- Beyer, W.F., and I. Fridovich. 1987. Assaying for superoxide dismutase activity: Some large consequences of minor changes in conditions. Anal. Biochem. 161(2):559–566. doi: 10.1016/0003-2697(87)90489-1.
- Bradford, M.M. 1976. A rapid and sensitive method for the quantitation of microgram quantity of protein utilizing the principle of protein-dye binding. Anal. Biochem. 72(72):248–254. doi: 10.1016/0003-2697(76)90527-3.
- Cabello, J.V., A.F. Lodeyro, and M.D. Zurbriggen. 2014. Novel perspectives for the engineering of abiotic stress tolerance in plants. Curr. Opin. Biotechnol. 26:62–70. doi: 10.1016/j.copbio.2013.09.011.
- Caprio, J.M., and H.A. Quamme. 1999. Weather conditions associated with apple production in the Okanagan Valley of British Columbia. Can. J. Plant Sci 79(1):121–137. doi: 10.4141/P98-028.
- Chinnusamy, V., J.H. Zhu, and J.K. Zhu. 2007. Cold stress regulation of gene expression in plants. Trends Plant Sci. 12(10):444–451. doi: 10.1016/j.tplants.2007.07.002.
- Chu, M.X., J.J. Li, J.Y. Zhang, S.F. Shen, C.N. Li, Y.J. Gao, and S.Q. Zhang. 2018. AtCaM4 interacts with a Sec14-like protein, PATL1, to regulate freezing tolerance in Arabidopsis in a CBF-independent manner. J. Exp. Bot. 69(21):5241–5253. doi: 10.1093/jxb/ery278.
- Cook, B.I., E.M. Wolkovich, and C. Parmesan. 2012. Divergent responses to spring and winter warming drive community level flowering trends. Proc. Natl. Acad. Sci. U.S.A 109(23):9000–9005. doi: 10.1073/pnas.1118364109/DCSupplemental.
- Deng, Q.N., J.N. Li, C. Gao, J.Y. Cheng, X.Z. Deng, D.Z. Jiang, L. Li, and P. Yan. 2020. New perspective for evaluating the main Camellia oleifera cultivars in China. Sci. Rep 10(1):20676–20676. doi: 10.1038/s41598-020-77609-7.
- Dominguez, T., M.L. Hernandez, J.C. Pennycooke, P. Jimenez, J.M. Martinez-Rivas, C. San, E.J. Stockinger, J.J. Sanchez-Serrano, and M. Sanmartin. 2010. Increasing omega-3 desaturase expression in tomato results in altered aroma profile and enhanced resistance to cold stress. Plant Physiol. 153(2):655–665. doi: 10.1104/pp.110.154815.
- Dong, H.Z., C.H. Wang, T.Y. Yang, J.X. Yan, J.Z. Gao, D.L. Li, R. Wang, S.L. Zhang, and X.S. Huang. 2019. Overexpression of PbrNHX2 gene, a Na+/H+ antiporter gene isolated from Pyrus betulaefolia, confers enhanced tolerance to salt stress via modulating ROS levels. Plant Sci. 285:14–25. doi: 10.1016/j.plantsci.2019.04.021.
- Dreyer, A., and K.J. Dietz. 2018. Reactive oxygen species and the redox-regulatory network in cold stress acclimation. Antioxid. Basel 7(11):169. doi: 10.3390/antiox7110169.
- Fang, M.L., Y. Zhang, X.L. Li, S. Wu, M.Y. Yang, H.F. Yin, W.X. Liu, Z.Q. Fan, and J.Y. Li. 2022. Multi-approach analysis reveals pathways of cold tolerance divergence in Camellia japonica. Front. Plant Sci 13:811791–811791. doi: 10.3389/fpls.2022.811791.
- Farrar, J., C. Pollock, and J. Gallagher. 2000. Sucrose and the integration of metabolism in vascular plants. Plant Sci. 154(1):1–11. doi: 10.1016/S0168-9452(99)00260-5.
- Ge, C.H., S. Sun, Y. Rui, and P. Sunm. 2022. Long-term vegetation phenology changes and response to multi-scale meteorological drought on the loess plateau, China. J. Hydrol. 128605. doi: 10.1016/j.jhydrol.2022.128605.
- Gordo, O., and J.J. Sanz. 2010. Impact of climate change on plant phenology in Mediterranean ecosystems. Glob Change. Biol 16(3):1082–1106. doi: 10.1111/j.1365-2486.2009.02084.x.
- Habibi, F., T. Liu, M.A. Shahid, B. Schaffer, and A. Sarkhosh. 2023. Physiological, biochemical, and molecular responses of fruit trees to root zone hypoxia. Environ. Exp. Bot 206:105179. doi: 10.1016/j.envexpbot.2022.105179.
- Hu, M.Y., X.K. Yan, Q. Wang, M.Y. Lu, C.H. Wu, and M.J. Zhang. 2022. Photosynthetic characteristics of pear varieties in central and eastern Jilin. J Northwest A&F Univ. (Nat. Sci. Ed.) 50(9):32–38. doi: 10.13207/j.cnki.jnwafu.2022.09.005.
- Iwanami, H., Y. Moriya-Tanaka, T. Hanada, T. Baba, and D. Sakamoto. 2023. Meteorological and tree-management factors related to soluble solids content of apple fruit and crop load management for producing high soluble solids content fruit in high-density planted ‘Fuji’. Sci. Hort 310:111755. doi: 10.1016/j.scienta.2022.111755.
- Karami, H., M. Rezaei, A. Sarkhosh, M. Rahemi, and M. Jafari. 2018. Beurteilung der Winterhärte von sieben kommerziellen Feigensorten (Ficus Carica L.). L. Gesud. Pflanz 70(4):195–203. doi: 10.1007/s10343018-0431-2.
- Lee, K.S., S. Ryu, J.H. Jeong, J.G. Cho, S.K. Lee, and J.H. Han. 2023. Effect of carbohydrate levels under autumn defoliation on cold tolerance during the subsequent flowering season in pear. Sci. Hort 307(307):111530. doi: 10.1016/j.scienta.2022.111530.
- Li, Q.Y., B. Lu, J.W. Zhao, H. Li, Y. Li, S.Y. Miao, and B.S. Lu. 2020. Physiological response and cold resistance evaluation of different Pyrus calleryan varieties under low temperature stress. J. Northwest A&F University (Nat. Sci. Ed) 48(1):86–110. doi: 10.13207/j.cnki.jnwafu.2020.01.011.
- Liu, M.H., Q. Wang, M.Y. Lu, X.K. Yan, C.H. Wu, and M.J. Zhang. 2022. Cold resistance evaluation of some pears and study on the difference of leaf tissue and anatomical structure. J. Northeast Agri Sci 47(5):93–97. doi: 10.16423/j.cnki.1003-8701.2022.05.021.
- Liu, Y.L., Y.X. Wu, F. Che, Z.M. Zhang, and B.H. Chen. 2019. Physical-chemical composition and quality related changes in “ruaner” pear (Pyrus ussuriensis) during freezing-thawing period. Mol. NLM 24(14):2611. doi: 10.3390/molecules24142611.
- Mao, Y.X., X.T. Ji, Q.Y. Meng, Z.Z. Xu, Y.P. Yuan, M.C. Li, L.X. Niu, Y.L. Zhang, and D.Y. Sun. 2022. Contribution of anthocyanin and polyunsaturated fatty acid biosynthesis to cold tolerance during bud sprouting in tree peony. Ind. Crop. Prod 188:115563. doi: 10.1016/j.indcrop.2022.115563.
- Menzel, A., T.H. Sparks, N. Estrella, E. Koch, A. Aasa, R. Aha, K. Alm-Kubler, P. Bissolli, O. Braslavska, and A. Briede. 2006. European phenological response to climate change matches the warming pattern. Glob Change. Biol 12:1969–1976. doi: 10.1111/j.1365-2486.2006.01193.x.
- Miller, G., N. Suzuki, S. Ciftci-Yilmaz, and R. Mittler. 2010. Reactive oxygen species homeostasis and signaling during drought and salinity stresses. Plant Cell Environ. 33(4):453–467. doi: 10.1111/j.1365-3040.2009.02041.x.
- Moore, L.M., and W.K. Lauenroth. 2017. Differential effects of temperature and precipitation on early- vs. late-flowering species. Ecosphere 8(5):1–18. doi: 10.1002/ecs2.1819.
- Nhorn, T.C., J. Turner, D. Gibeaut, and J.D. Postman. 2011. Characterization of cold hardiness in quince: Potential pear rootstock candidates for northern pear production regions. Acta. Hort 909:137–143. doi: 10.17660/ActaHortic.2011.909.13.
- Ouni, R., A.A. Zborowska, J. Sehic, S. Choulak, H.J. Iñaki, L. Garkava-Gustavsson, and M. Mars. 2020. Genetic diversity and structure of Tunisian local pear germplasm as revealed by SSR markers. Hort. Plant J 6(2):61–70. doi: 10.1016/j.hpj.2020.03.003.
- Rowland, L.J., E.L. Ogden, M.K. Ehlenfeldt, and B. Vinyard. 2005. Cold hardiness, deacclimation kinetics, and bud development among 12 diverse blueberry genotypes under field conditions. J. Am. Soc. Hortic. Sci. 130(4):508–514. doi: 10.21273/JASHS.130.4.508.
- Samtani, J.B., J.E. Appleby, and J.B. Masiunas. 2015. Comparative leaf phenology of White Oak and Northern Red Oak. Horticulturae 1(1):44–54. doi: 10.3390/horticulturae1010044.
- Secchi, M.A., L.M. Bastos, M.J. Stamm, Y. Wright, C. Foster, C.D. Messina, and I.A. Ciampitti. 2021. Winter survival response of canola to meteorological variables and adaptative areas for current canola germplasm in the United States. Agr. Forest Meteorol 297:108267. doi: 10.1016/j.agrformet.2020.108267.
- Sherry, R.A., X. Zhou, S. Gu, J.A. Arnone, D.S. Schimel, P.S. Verburg, L.L. Wallace, and Y. Luo. 2007. Divergence of reproductive phenology under climate warming. Proc. Natl. Acad. Sci. U.S.A. 104(1):198–202. doi: 10.1073/pnas.0605642104.
- Shi, Y.T., Y.L. Ding, and S.H. Yang. 2015. Cold signal transduction and its interplay with phytohormones during cold acclimation. Plant Cell Physiol. 56(1):7–15. doi: 10.1093/pcp/pcu115.
- Szalay, L., J. Bakos, G. Tósaki, B.T. Keleta, V. Froemel-Hajnal, and I. Karsai. 2021. A 15-year long assessment of cold hardiness of apricot flower buds and flowers during the blooming period. Sci. Hortic. 290:110520. doi: 10.1016/j.scienta.2021.110520.
- Tauzin, A.S., and T. Giardina. 2014. Sucrose and invertases, a part of the plant defense response to the biotic stresses. Front. Plant Sci. 5. doi: 10.3389/fpls.2014.00293.
- Valencia, E., M. Méndez, N. Saavedra, and F.T. Maestre. 2016. Plant size and leaf area influence phenological and reproductive responses to warming in semiarid Mediterranean species. Perspect. Plant Ecol. Evol. Syst 21:31–40. doi: 10.1016/j.ppees.2016.05.003.
- Wolkovich, E.M., and E.E. Cleland. 2014. Phenological niches and the future of invaded ecosystems with climate change. AoB. Plants 6:lu013. doi: 10.1093/aobpla/plu013.
- Xie, J., T. Jonas, R. Christian, J. Rogier, G. Irene, N. Claudia, A. Sarah, S. Michael, and K. Mathias. 2020. Land surface phenology and greenness in Alpine grasslands driven by seasonal snow and meteorological factors. Sci. Tot. Environ. 725:138380. doi: 10.1016/j.scitotenv.2020.138380.
- Xiong, J.Q., G.G. Patil, R. Moe, and S. Torre. 2011. Effects of diurnal temperature alternations and light quality on growth, morphogenesis and carbohydrate content of Cucumis sativus L. Sci. Hortic 128(1):54–60. doi: 10.1016/j.scienta.2010.12.013.
- Yang, T.Y., and X.S. Huang. 2018. Deep sequencing-based characterization of transcriptome of Pyrus ussuriensis in response to cold stress. Gene 661:109–118. doi: 10.1016/j.gene.2018.03.067.
- Yang, Q., S.H. Li, J.H. Li, J.F. Du, and J.C. Wang. 2022. Response of phenology phases of four deciduous trees to climate change in Xi’an. Acta Ecologica. Sinica 42(4):1462–1473. doi: 10.5846/stxb202011212992.
- Yang, S.H., L.J. Wang, S.H. Li, W. Duan, W. Loescher, and Z.C. Liang. 2007. The effects of UV-B radiation on photosynthesis in relation to photosystem photochemistryII thermal dissipation and antioxidant defenses in winter wheat (Triticum aestivum L.) seedlings at different growth temperatures. Funct. Plant Biol. 34907–34917. doi: 10.1071/FP07083.
- Yu, H., E. Luedeling, and J. Xu. 2010. Winter and spring warming result in delayed spring phenology on the Tibetan Plateau. Proc. Natl. Acad. Sci. U.S.A 107(51):22151–22156. doi: 10.1073/pnas.1012490107.
- Zeng, Z.Q., W.X. Wu, Q.S. Ge, Z.L. Li, X.Y. Wang, Y. Zhou, Z.T. Zhang, Y.M. Li, H. Huang, G.X. Liu, et al. 2021. Legacy effects of spring phenology on vegetation growth under preseason meteorological drought in the Northern Hemisphere. Agr. Forest Meteoro 310(15):108630. doi: 10.1016/j.agrformet.2021.108630.
- Zhang, M., L. Ding, Q. Wang, M. Feng, and S. Khanizadeh. 2007. ‘Hanhong’ Pear. HortScience 42(2):397–416. doi: 10.21273/hortsci.42.2.397.
- Zhang, H., Y.P. Wang, W.E. Wang, M.Z. Bao, and Z.L. Chan. 2019. Physiological changes and DREB1s expression profiles of tall fescue in response to freezing stress. Sci. Hort 245:116–124. doi: 10.1016/j.scienta.2018.09.052.
- Zhang, M.J., B.B. Zhang, and D.H. Liu. 2002. Investigation report on freezing injury of fruit trees in Jilin Province. Jilin. Agri Sci 3:47–51.
- Zhao, Y., Z.X. Wang, Y.M. Yang, H.S. Liu, G.L. Shi, and J. Ai. 2020. Analysis of the cold tolerance and physiological response differences of amur grape (Vitis amurensis) germplasms during overwintering. Sci. Hort 259:108760. doi: 10.1016/j.scienta.2019.108760.
- Zhao, L.Y., T.Y. Yang, C.H. Xing, H.Z. Dong, K.J. Qi, J.Z. Gao, S.T. Tao, J.Y. Wu, J. Wu, S.L. Zhang, et al. 2019. The β-amylase PbrBAM3 from pear (Pyrus betulaefolia) regulates soluble sugar accumulation and ROS homeostasis in response to cold stress. Plant. Sci 287:110184–110184. doi: 10.1016/j.plantsci.2019.110184.
- Zhou, Y.Q., S.J. Qin, X.X. Ma, J.E. Zhang, P. Zhou, M. Sun, B.S. Wang, H.F. Zhou, and D.G. Lu. 2015. Effect of interstocks on the photosynthetic characteristics and carbon distribution of young apple trees during the vigorous growth periods of shoots. Eur. J. Hortic. Sci. 80(6):296–305. doi: 10.17660/ejhs.2015/80.6.5.