
Abstract
Mitochondria-induced oxidative stress and flawed autophagy are common features of neurodegenerative and lysosomal storage diseases (LSDs). Although defective autophagy is particularly prominent in Pompe disease, mitochondrial function has escaped examination in this typical LSD. We have found multiple mitochondrial defects in mouse and human models of Pompe disease, a life-threatening cardiac and skeletal muscle myopathy: a profound dysregulation of Ca2+ homeostasis, mitochondrial Ca2+ overload, an increase in reactive oxygen species, a decrease in mitochondrial membrane potential, an increase in caspase-independent apoptosis, as well as a decreased oxygen consumption and ATP production of mitochondria. In addition, gene expression studies revealed a striking upregulation of the β 1 subunit of L-type Ca2+ channel in Pompe muscle cells. This study provides strong evidence that disturbance of Ca2+ homeostasis and mitochondrial abnormalities in Pompe disease represent early changes in a complex pathogenetic cascade leading from a deficiency of a single lysosomal enzyme to severe and hard-to-treat autophagic myopathy. Remarkably, L-type Ca2+channel blockers, commonly used to treat other maladies, reversed these defects, indicating that a similar approach can be beneficial to the plethora of lysosomal and neurodegenerative disorders.
Abbreviations:
- AIFM1, apoptosis-inducing factor, mitochondrion-associated, 1
- CCCP, carbonyl cyanide m-chlorophenylhydrazone
- DMEM, Dulbecco's modified Eagle's medium
- EGTA, ethylene glycol-bis(2-aminoethylether)-N, N, N′, N′-tetraacetic acid
- ERT, enzyme replacement therapy
- GAA, glucosidase
- α, acid
- GFP, green fluorescent protein
- LAMP1, lysosomal-associated membrane protein 1
- LSD, lysosomal storage disease
- MAP1LC3A/B (LC3), microtubule-associated protein 1 light chain 3 α/β
- MitoG, MitoTracker Green
- MOPS, 3-morpholinopropane-1-sulfonic acid
- OMM, outer mitochondrial membrane
- RFP, red fluorescent protein
- ROS, reactive oxygen species
- TUNEL, terminal deoxynucleotidyl transferase dUTP nick end labeling
- Ub, ubiquitinated
- VDCC, voltage-dependent Ca2+ channel
Introduction
Mitochondria are the major source of cellular energy in the form of ATP produced through oxidative phosphorylation in the inner membrane of these organelles. However, the role of mitochondria goes far beyond being "power plants" of cells: mitochondria maintain their own small genome that is replicated during mitochondrial division; mitochondria produce critical signaling molecules such as nitric oxide, hydrogen peroxide, and superoxide and fulfill Ca2+ buffering function; they are involved in the control of the cell cycle, cell growth and differentiation, homeostasis of metals, fatty acid oxidation, and cell death.Citation1-3
Dysfunctional mitochondria release proapoptotic proteins and become a source of excessive production of toxic reactive oxygen species (ROS), which can cause oxidative stress and damage to cellular components. Mitochondrial Ca2+ overload can lead to necrosis or apoptosis. Cells have developed an elaborate quality control system to restore mitochondrial function, but when mitochondria are beyond repair, the whole organelle is eliminated by the macroautophagic pathway. Macroautophagy (referred to as autophagy), is an evolutionarily conserved mechanism designed to provide amino acids and energy during starvation. When nutrients are not available, cells mobilize their own resources by sequestering a portion of cytoplasm into autophagic vesicles (autophagosomes) which deliver their content to lysosomes for degradation and recycling.Citation4,5 Starvation-induced autophagy is considered a nonselective degradation of cytosolic components. In contrast, autophagic degradation of damaged mitochondria, called mitophagy, is a selective process.Citation6
Mitophagy is initiated by the accumulation of PINK1, a serine-threonine protein kinase, on the outer mitochondrial membrane (OMM) in response to a collapse in membrane potential (ΔΨm). PINK1 signals mitochondrial dysfunction to PARK2, a cytosolic E3 ubiquitin ligase, which promotes autophagosomal engulfment of damaged mitochondria followed by their degradation in lysosomes.Citation3,7-10
Mitochondrial damage is associated with a large number of human disorders such as mitochondrial and neurodegenerative diseases, cardiomyopathies, and cancer;Citation1,11 mitochondrial abnormalities are also implicated in aging. According to the “lysosomal-mitochondrial axis” of aging, lysosomal inactivation by lipofuscin—an indigestible autofluorescent material—results in accumulation of fragmented dysfunctional mitochondria leading to oxidative stress and cellular damage.Citation12
Lysosomes are major players in the autophagic process, and lysosomal storage disorders (LSDs) have been recently classified as disorders of autophagy—accumulation of any substrate in the lysosome triggers an expansion of the lysosomal compartment and affects the fusion of lysosomes and autophagosomes.Citation13,14 The impaired autophagosomal-lysosomal fusion is likely to affect autophagic degradation of mitochondria. Indeed, mitochondrial dysfunction has been reported in several LSDs: GM1-gangliosidosisCitation15,16 and mucolipidosis II, III, and IV,Citation17,18 neuronal ceroid lipofuscinosis or Batten disease,Citation19 Gaucher disease,Citation20 and multiple sulfatase deficiency.Citation21 However, accumulation of anomalous mitochondria in these diseases is not simply a result of autophagic block, but rather a consequence of a particular mechanism, which is disease- and even tissue-specific.Citation16,17,20,21
Pompe disease is unique among lysosomal storage disorders in that muscle tissue is the organ primarily affected. Very little is known about mitochondrial dysfunction and mitophagy in this disorder. Pompe disease, a deficiency of glycogen degrading lysosomal enzyme GAA (glucosidase; α, acid), is a severe cardiac and skeletal muscle myopathy with a spectrum of clinical manifestations. The most severe and rapidly progressive infantile form is fatal within the first months of life; in milder childhood, juvenile, and adult forms cardiac muscle is usually spared, but slowly progressive muscle disease eventually leads to respiratory insufficiency and a shortened life expectancy.Citation22 Current treatment with enzyme replacement therapy (ERT) is very effective in restoring cardiac function and extending the life span of infants, but it fails to significantly reverse or halt the progression of the disease in skeletal muscle.Citation23-25
We have previously shown in the Gaa-KO mouse model that in addition to the enlargement of glycogen-loaded lysosomes, abnormal autophagy, accumulation of autophagic substrates, and impaired autophagosomal-lysosomal fusion greatly contribute to the pathogenesis of muscle damage and to muscle resistance to ERT.Citation26,27 We have recently established yet another abnormality in the diseased muscle—the accelerated production of large, unrelated-to-aging lipofuscin deposits—a marker of oxidative damage and a sign of mitochondrial dysfunction.Citation28,29 Furthermore, morphologically abnormal mitochondria have been observed in Pompe skeletal muscle.Citation30 Here, we describe the mechanisms that lead to mitochondrial dysfunction in Pompe skeletal muscle. Defining the role of mitochondria and mitophagy in Pompe disease may elucidate aspects of the pathogenesis of muscle damage in this and other autophagic myopathies.
Results
Morphological changes of mitochondria in Pompe muscle cells
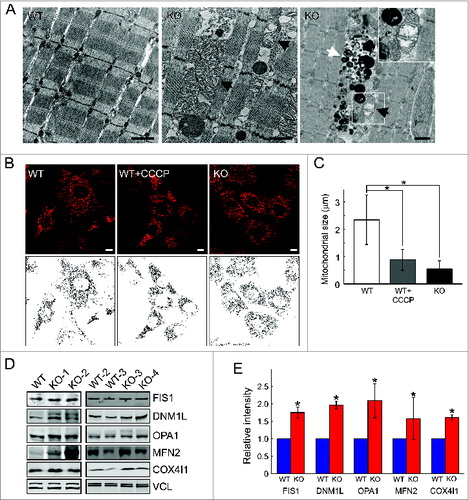
Transmission electron microscopy revealed marked alterations in mitochondrial morphology in muscle from Gaa-KO mice (referred to as KO). Distended mitochondria with disarrayed cristae were seen (), often adjacent to the area of autophagic buildup ( right panel). We have also looked at the morphology of mitochondria in a cellular model of Pompe disease—myoblast lines from KO mice. These cells can undergo multiple passages without losing the ability to differentiate into multinucleated myotubes.Citation27 In KO myoblasts, most mitochondria lost their typical elongated tubular form and appeared shorter and more fragmented as shown by loading the cells with MitoTracker Red, a membrane potential-dependent fluorescent dye (). In fact, the pattern of MitoTracker Red-labeled mitochondria in the diseased cells resembles that of control cells treated with CCCP, a potent uncoupler of oxidative phosphorylation (). Mitochondrial chain length was calculated by tracing unbranched mitochondria on confocal images of myoblasts and measuring their length. The chain length was significantly shorter in Pompe cells compared to controls (). In addition, western analysis for mitochondrial shaping proteins showed an increase in DNM1L, FIS1 (fission 1 [mitochondrial outer membrane] homolog [S. cerevisiae]), OPA1 (optic atrophy 1 [autosomal dominant]), and to a lesser extent MFN2 (mitofusin 2) in KO muscle; an increase in COX4I1 was also seen in the KO (). These data suggest an abnormal mitochondrial fusion-fission and/or mitochondrial accumulation in the diseased muscle; the results are consistent with previous observations of changes in the morphology of mitochondria in muscle biopsies from Pompe patients and in muscle samples from KO mice.Citation30,31
Figure 1. Morphological alterations in KO muscle cells. (A) Electron-microscopy of muscle biopsies (white part of gastrocnemius) from 5-mo-old WT and KO mice. Black arrows point to enlarged mitochondria with distorted cristae (middle and right panels and inset). Abnormal mitochondria are often found within the area of autophagic accumulation (white arrow; right panel). Bar = 1 μm. MitoTracker Red staining of myoblasts (B) reveals abnormal pattern in KO cells. CCCP, carbonyl cyanide m-chlorophenylhydrazone, a mitochondrial-uncoupling reagent, was used at a concentration of 10 μM for 6 h. (C) Graphical representation of the images in (B); mitochondrial chain length in WT and KO myoblasts (n = 6). (D) Western blot analysis of whole muscle from 4- to 5-mo-old WT and KO mice with the indicated antibodies. (E) Graphical presentation of data in (D). Asterisks indicate P < 0.05.
Altered Ca2+ homeostasis in Pompe muscle cells
It is well established that abnormal shape of mitochondria is a reflection of changes in physiological parameters such as Ca2+ homeostasis and ROS production. Cytosolic Ca2+, measured by live imaging of cells loaded with the calcium binding fluorescent dye Fluo-4, was significantly higher in KO myotubes (). Treatment with recombinant human GAA (rhGAA) at 5 μM for 4 d—a dosage that normalized lysosomal size and cleared intralysosomal glycogenCitation32—resulted in a moderate decrease in Ca2+ levels ().
Figure 2. Assessment of Ca2+ levels and flux in WT and KO muscle cells. (A) WT and KO myotubes (7 d in differentiation medium) were loaded with Fluo-4 dye and analyzed by confocal microscopy. The images show a significant increase in the steady-state level of cellular Ca2+ in the KO myotubes. Bar = 10 μm. (B) KO myotubes were treated with rhGAA at 5 μM for 4 d; the treatment resulted in efficient glycogen clearance (top; arrows point to glycogen deposition in untreated KO myotube) and a modest reduction of Ca2+ levels (bottom and (C) graphical representation of the images). Lysosomal glycogen in live cells was detected by the incorporation of fluorescent glucose derivative 2-NBDG [2-(N-(7-nitrobenz-2-oxa-1,3-diazol-4-yl)amino)-2-deoxyglucose] into glycogen. Bars = 10 μm. (D and E) Time-lapse experiment showing progressive influx of Ca2+ after its addition to the medium; the images, taken every 10 sec by confocal microscopy, illustrate a faster uptake of Ca2+ in the KO myotubes. Note the higher level of Ca2+ in the KO myotubes compared to the WT at the onset of the experiment. Ca2+ flux in WT and KO myotubes was calculated by conversion of the intensity of staining to molarity (nMol), which was then plotted versus time; the graph in (D) shows a much higher and sustained rise of Ca2+ in the KO. Asterisks indicate P < 0.05.
![Figure 2. Assessment of Ca2+ levels and flux in WT and KO muscle cells. (A) WT and KO myotubes (7 d in differentiation medium) were loaded with Fluo-4 dye and analyzed by confocal microscopy. The images show a significant increase in the steady-state level of cellular Ca2+ in the KO myotubes. Bar = 10 μm. (B) KO myotubes were treated with rhGAA at 5 μM for 4 d; the treatment resulted in efficient glycogen clearance (top; arrows point to glycogen deposition in untreated KO myotube) and a modest reduction of Ca2+ levels (bottom and (C) graphical representation of the images). Lysosomal glycogen in live cells was detected by the incorporation of fluorescent glucose derivative 2-NBDG [2-(N-(7-nitrobenz-2-oxa-1,3-diazol-4-yl)amino)-2-deoxyglucose] into glycogen. Bars = 10 μm. (D and E) Time-lapse experiment showing progressive influx of Ca2+ after its addition to the medium; the images, taken every 10 sec by confocal microscopy, illustrate a faster uptake of Ca2+ in the KO myotubes. Note the higher level of Ca2+ in the KO myotubes compared to the WT at the onset of the experiment. Ca2+ flux in WT and KO myotubes was calculated by conversion of the intensity of staining to molarity (nMol), which was then plotted versus time; the graph in (D) shows a much higher and sustained rise of Ca2+ in the KO. Asterisks indicate P < 0.05.](/cms/asset/17ca0ce4-798e-44f9-9332-6e25fcbc9d60/kaup_a_1009779_f0002_oc.jpg)
A significant age-dependent increase in Ca2+ levels was also detected in muscle fibers (Fig. S1A–D) derived from KO mice compared to WT controls. Of note, the levels of Ca2+ in the areas of autophagic buildup in the KO fibers were extremely high (Fig. S1A). Human muscle cells from Pompe patients (primary cultures) with adult form of the disease that is characterized by residual enzyme activity also showed an increase in the levels of cytosolic Ca2+, albeit less dramatic than that in KO myotubes with no enzyme activity (Fig. S1E; shown for P#484).
To determine if the high intracellular Ca2+ level is a result of increased entry from outside the cell via calcium channels, we followed changes in Ca2+ levels in KO myotubes by time-lapse microscopy of Fluo-4-loaded myotubes after the addition of 2 mM Ca2+ to the medium. Ca2+ flux is dramatically increased in KO myotubes, as shown by a sharp rise in Ca2+ levels, which remain high over the course of the experiment (; Video S1 and Fig. S2).
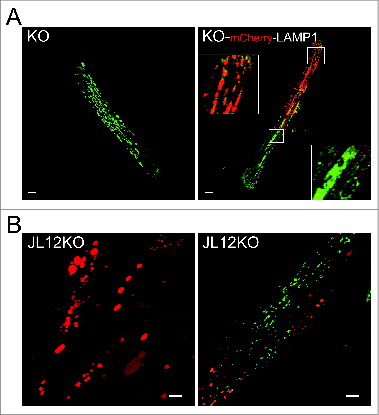
In addition to a diffuse Ca2+ stain throughout the KO myotubes and KO fibers, we observed intensely bright fluorescent spots (microdomains; lower panels) that were reminiscent of enlarged lysosomes, typical of Pompe disease ( and Fig. S2). We addressed the question of Ca2+ location by using live KO muscle fibers that had been transfected in vivo with mCherry-LAMP1 (a lysosomal marker; , right panel) and a newly developed murine KO muscle cell line (JL12KO), which constitutively expresses mCherry-LAMP1 (, left panel). In both systems there was an overall absence of congruency between the red and green stains, thereby ruling out a selective accumulation of Ca2+ in lysosomes ( and Fig. S2, Videos S3 and S4).
Figure 3. Assessment of Ca2+ levels and distribution in KO fibers and in a new cellular model of Pompe disease. (A) Confocal microscopy image of a live fiber derived from a 4-mo-old KO mouse that was loaded with green Fluo-4 dye. The image shows a bright “spotty” pattern of Ca2+ distribution similar to that typically seen in the KO fibers stained for lysosomal marker LAMP1 (left panel). To exclude the intralysosomal accumulation of Ca2+, the fibers were transfected in vivo with mCherry-LAMP1 to visualize lysosomes (red) prior to in vitro staining with the dye. The image (a single frame from the Z series presented in Video S3) shows only occasional overlap (yellow) between the 2 colors indicating that Ca2+ clusters are located primarily outside the lysosomes (right panel). The images are taken with the same laser intensity (n = 4; FDB muscles of each of the 2 hind limbs were electroporated). Bar = 20 μm. Images of additional patterns of Lamp1 expression in KO can be found in Fig. S2. (B) A new immortalized KO muscle cell line (JL12KO), which stably expresses mCherry-LAMP1 (left panel). Right panel shows JL12KO myotubes loaded with green Fluo-4 dye; again there is little overlap between the 2 colors. The image is a single frame from the Z series presented in Video S4. Bar = 10 μm.
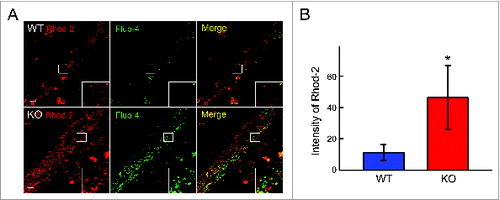
Since mitochondria work as Ca2+ sinks buffering cytoplasmic calcium, we evaluated mitochondrial Ca2+ uptake across the inner mitochondrial membrane (IMM), a process that is important for the ROS generation, opening of mitochondrial permeability transition pore, and regulation of ATP synthesis.Citation33 The WT and KO myotubes were loaded with red Rhod-2, a Ca2+ dye (which preferentially accumulates in mitochondriaCitation34) and with green Fluo-4 probe. In both WT and KO cells this dual labeling resulted in different locations of the red and green fluorescence, thus confirming that the mitochondrial signal is distinct from that of the cytosol (). The mitochondrial Ca2+ signal was much stronger in the KO () compared to WT cell, indicating an overload of Ca2+ in the mitochondria of the diseased cells.
Figure 4. Distribution of the subcellular Ca2+ in the WT and KO myotubes. (A) The cells were incubated with red mitochondrial Ca2+ indicator Rhod-2/AM and green cytosolic Ca2+ indicator Fluo-4/AM. The images show mostly different localization of the 2 dyes (insets) and a much stronger fluorescence in the KO cells. The images are taken with the same laser intensity. Bar = 10 μm. (B) The graph reflects an increase in mitochondrial Ca2+. Asterisk indicates P < 0.05.
Altered physiological parameters and function of mitochondria in Pompe muscle cells
The integrity of the mitochondrial membrane was evaluated by using JC-1 dye—a fluorescent cationic dye that selectively accumulates in mitochondria with intact electrochemical gradient. The normally green fluorescent dye forms red fluorescent JC-1 aggregates in mitochondria with high membrane potential. Mitochondrial depolarization—a significant loss of mitochondrial membrane potential (ΔΨm)—in KO myotubes was indicated by a marked decrease in the red/green fluorescence intensity ratio ().
Figure 5. Changes in mitochondrial physiological parameters in KO myotubes. WT and KO myotubes were analyzed on d 7 in differentiation medium. (A) Green JC-1 dye aggregates and becomes red when ΔΨm is preserved (top). There is a significant degree of mitochondrial depolarization in the KO myotubes (bottom). Bar = 10 μm. (B) Colabeling with TMRM, a potential sensitive fluorophore, and MitoTracker Green (MitoG; a potential-independent mitochondrial dye) confirms mitochondrial depolarization in the KO myotubes (arrowheads; TMRM-negative and MitoG-positive structures). Note that KO cells contain a subset of polarized mitochondria (TMRM and MitoG-double positive; arrow) with profoundly abnormal shape. (C). The graph reflects the extent of mitochondria depolarization in KO myotubes. (D) Incubation with CellROX® Green dye reveals an increase in the amount of ROS (quantified in E) in KO myotubes. DIC (differential interference contrast) images show the presence of myotubes (right panels). Bar = 20 μm. (F) The cell were incubated in the presence of H2O2 in the medium. KO myotubes are more vulnerable to oxidative stress compared to WT as shown by a significant loss of myotubes (lower right panel). (G) Graphical presentation of the data in F. Asterisks indicate P < 0.05.
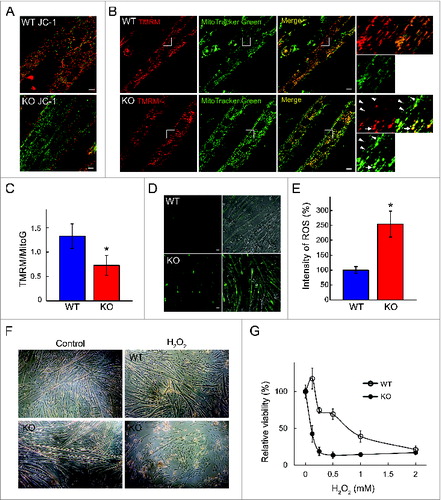
Mitochondrial depolarization in KO myotubes was confirmed by colabeling the cells with potential-sensitive tetramethylrhodamine methyl ester (TMRM) and potential-insensitive MitoTracker Green (MitoG) as reflected by a significant decrease in the TMRM/MitoG ratio in KO myotubes (). Of note, KO cells contain a subset of abnormally shaped clumped mitochondria, which still preserve membrane potential as indicated by their TMRM and MitoG positive staining (; arrow).
As expected, an increase in the permeabilization of the mitochondrial membrane, known as mitochondrial permeability transition, resulted in increased generation of ROS. When the cells were incubated with the cell-permeant dye CellROX® Green, bright green fluorescence due to oxidation by ROS was seen in KO myotubes, but not in controls (). Furthermore, the diseased cells were more vulnerable to oxidative stress as shown by a decrease in cell viability following exposure to H2O2 (1 mM for 4 h) ().
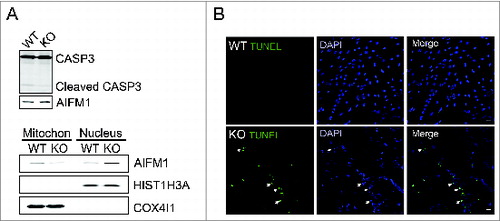
The increase in the permeabilization of the mitochondrial membrane can set off the rupture of the OMM and release of proapoptotic factors such as CYCS (cytochrome c, somatic), which activates caspase-dependent apoptosis. However, the level of cleaved CASP3 (caspase 3, apoptosis-related cysteine peptidase), an indicator of apoptosis, was not changed in KO myotubes (, top). In contrast, the diseased cells showed an increase in the nuclear levels of AIFM1 (apoptosis-inducing factor, mitochondrion-associated 1) with its concomitant decrease in the mitochondrial fraction (, bottom). Apoptosis was assessed by TUNEL staining for fragmented DNA. The number of TUNEL-positive nuclei in KO myotubes was ∼10% to 20% whereas only occasional apoptotic nuclei were detected in controls. No difference in the total number of nuclei was observed between the 2 groups ().
Figure 6. Increased apoptosis in KO myotubes. (A) Western blot of total lysates (top) and nuclear and mitochondrial fractions of WT and KO myotubes grown in differentiation medium for 6 to 7 d. No changes in the levels of activated (cleaved) CASP3 products are detected in the KO cells (top). A slight increase in the amount of AIFM1 in the total lysates of the KO (top) is consistent with its decrease in the mitochondrial and increase in the nuclear fraction (bottom). The purity of the mitochondrial and nuclear fractions was shown by the presence of COX4I1 and HIST1H3A, respectively. (B) TUNEL assay shows absence of apoptotic nuclei (green) in WT myotubes and their presence in the diseased cells (arrows; lower panels). Bar = 20 μm.
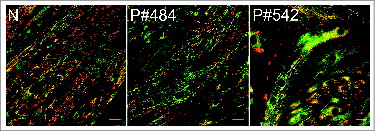
We have also evaluated mitochondrial properties in KO fibers and myotubes from Pompe patients. MitoTracker Red labeling revealed morphologically abnormal mitochondria in the KO fibers (Fig. S3A) and a striking loss of mitochondrial membrane potential in the area of autophagic buildup, which appeared as a “black hole” when stained by JC-1 (Fig. S3B). In addition, as in KO myotubes, apoptotic nuclei were seen in KO fibers (Fig. S3C). An increase in the levels of ROS was also observed in human Pompe myotubes (Fig. S4). A decrease in mitochondrial potential was also found in these cells; a significant decrease in the red/green fluorescence intensity ratio mimicked that observed in KO myotubes as shown by JC-1 staining (). Taken together, the data in all systems examined indicate that Pompe cells house morphologically, chemically, and functionally aberrant mitochondria.
Figure 7. Evaluation of ΔΨm, using JC-1 dye, in myotubes from Pompe patients. Human primary myoblasts were derived from a healthy individual (control; N) and 2 Pompe patients with the adult form of the disease (P#484 & P#542). Cultured myotubes (7 d in differentiation media) were loaded with the dye and analyzed by confocal microscopy. The dye became red upon entry into healthy mitochondria (control). Abnormal ΔΨm in the diseased cells manifests as a marked decrease in red fluorescence (middle and right panels) compared to control. Bar = 20 μm.
Altered mitochondrial bioenergetics in Pompe skeletal muscle
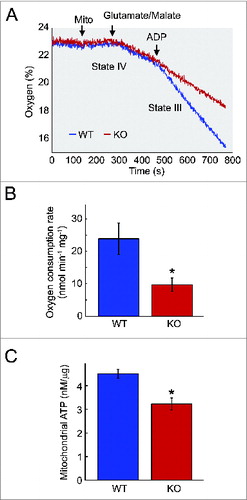
To analyze the changes in mitochondrial function in skeletal muscle, we measured the basal and stimulated respiration of mitochondria isolated from KO and control animals. Oxygen consumption in uncoupled mitochondria is a measure of electron transport capacity, whereas ADP-stimulated respiration is a measure of oxidative phosphorylation (state III). No obvious difference was found between the KO and WT mitochondria respiring under basal conditions (state IV) with complex 1-linked substrates (glutamate and malate) (). However, when the mitochondria were in state III (defined as ADP-stimulated respiration), there was a significant decrease in mitochondrial oxygen consumption in Pompe muscle compared to controls. As shown in , the mitochondrial defect in KO muscle becomes evident under the condition of ADP-stimulated mitochondrial respiration. Consistent with the decreased oxygen consumption rate, mitochondrial ATP level was also decreased in KO muscle (), indicating that mitochondria in the diseased muscle are bioenergetically compromised.
Figure 8. Impairment of bioenergetics in KO muscle. (A) Measurements of oxygen consumption rate of mitochondria from the skeletal muscle of 6- to 7-mo-old KO and WT mice. Measurements were made in the absence (state IV) and presence (state III) of ADP. Arrows indicate additions of mitochondria (mito) and 500 μM ADP. A significant reduction in respiration in the presence of ADP is observed in the KO mice. (B) Graph represents the mean oxygen consumption rate +/− SD from KO (n = 3) and WT (n = 3) mice. P < 0.05 (C) Measurements of ATP levels of mitochondria isolated from 7- to 10-mo-old KO (n = 3) and WT (n = 2) mice. Asterisk indicates P < 0.05.
Autophagy and mitophagy are detectably affected in Pompe muscle cells
Autophagy was first assessed by infecting the cells with baculovirus containing tandem sensor RFP-GFP-LC3B in the absence or presence of chloroquine. LC3 (microtubule-associated protein 1 light chain 3) is a highly specific autophagosomal marker; the cytosolic LC3-I form of the protein is converted to a lipidated LC3-II form, which remains attached to phagophore and autophagosomal membranes upon induction of autophagy and following autophagosome maturation.Citation35 RFP-GFP-tagged autophagosomes lose their green color when delivered to the lysosomes as the low pH quenches the GFP signal. When the myotubes were infected with the virus, a significant amount of red was seen in the WT cells, indicating the presence of autophagosomes in the acidic environment of the lysosomes (). As expected, addition of chloroquine, which blocks autophagosomal-lysosomal fusion, resulted in a significant loss of red fluorescence and the appearance of yellow color. The overall pattern appeared similar in KO myotubes suggesting that the autophagic flux was maintained in the diseased cells (). However, immunoblot analysis showed an increase in LC3-II level in untreated KO myotubes compared to controls (). The levels of LC3-II in the presence of chloroquine or bafilomycin A1 (another lysosomal inhibitor) increased in both WT and KO cells but the effect was less pronounced in the KO myotubes. Furthermore, an increase in the levels of ubiquitinated (Ub) proteins and SQSTM1, a receptor protein that binds both LC3 and Ub substrates, was detected in untreated KO myotubes compare to those in the WT, indicating that the autophagic flux is not complete in the diseased cells ().
Figure 9. Evaluation of autophagy in WT and KO myotubes. (A) Confocal images of WT and KO cells infected with virus containing LC3B (autophagosomal marker) linked to acid-sensitive GFP and acid-insensitive RFP tags. Both WT and KO cells show predominantly red fluorescence indicating that most autophagosomes reached lysosomes. Addition of chloroquine, a reagent that blocks autophagosomal-lysosomal fusion, leads to the extralysosomal location of autophagosomes (yellow) in both WT and KO cells. (B) Western blot of total lysates from WT and KO myotubes shows an increase in LC3-II levels in the KO (untreated [Non]; graph in C) and a diminished response to chloroquine (CQ) and bafilomycin A1 (BF) treatment in the KO cells (C; shown for chloroquine). The levels of SQSTM1 and Ub-proteins are increased in KO myotubes (B and D). Asterisks indicate P < 0.05. Note, that an autophagic defect was not detected in early passages of the KO cells.Citation27 This discrepancy is not surprising; the variations in cell morphology and functions in older cultures of muscle cells have been observed by others.Citation95,96
![Figure 9. Evaluation of autophagy in WT and KO myotubes. (A) Confocal images of WT and KO cells infected with virus containing LC3B (autophagosomal marker) linked to acid-sensitive GFP and acid-insensitive RFP tags. Both WT and KO cells show predominantly red fluorescence indicating that most autophagosomes reached lysosomes. Addition of chloroquine, a reagent that blocks autophagosomal-lysosomal fusion, leads to the extralysosomal location of autophagosomes (yellow) in both WT and KO cells. (B) Western blot of total lysates from WT and KO myotubes shows an increase in LC3-II levels in the KO (untreated [Non]; graph in C) and a diminished response to chloroquine (CQ) and bafilomycin A1 (BF) treatment in the KO cells (C; shown for chloroquine). The levels of SQSTM1 and Ub-proteins are increased in KO myotubes (B and D). Asterisks indicate P < 0.05. Note, that an autophagic defect was not detected in early passages of the KO cells.Citation27 This discrepancy is not surprising; the variations in cell morphology and functions in older cultures of muscle cells have been observed by others.Citation95,96](/cms/asset/3f88a2f3-4047-4e07-ad23-24344c6db2b5/kaup_a_1009779_f0009_oc.jpg)
Next, we monitored mitophagy—the selective autophagic degradation of damaged mitochondria—by infecting the cells with a virus expressing mCherry–GFP tag tandomly attached to the OMM localization signal of the FIS1 protein (residues 101 to 152). As in the RFP-GFP-LC3B assay described above, red fluorescence would indicate the presence of mitochondria in the lysosomes whereas yellow would indicate extralysosomal location.Citation36 As expected, when mitochondria in the WT cells are depolarized by CCCP, we observed mostly red fluorescence (see insets in ) indicating that damaged mitochondria have been successfully delivered to the lysosomes for degradation and recycling (). Untreated KO cells show more mitochondria, which fluoresce red only compared to untreated WT thus confirming the presence of damaged mitochondria and increased mitophagy in the diseased cells. However, we do see a significant number of mitochondria located extralysosomally (yellow) in untreated KO cells which suggests their inefficient clearance and/or the presence of mitochondria not sufficiently damaged for elimination by mitophagy (; Fig. S5). When additional damage is incurred by CCCP, we observed nearly exclusively red fluorescence ().
Figure 10. Evaluation of mitophagy in WT and KO myotubes. Confocal images (A) and the Pearson correlation values (B) of WT and KO cells infected with virus containing OMM protein FIS1 linked to acid-sensitive GFP and acid-insensitive mCherry tags. CCCP treatment of the WT cells results in increased mitophagy as shown by the predominance of red only fluorescence (WT+CCCP) along with a significantly decreased red-green colocalization (compare WT to WT+CCCP in B). The KO cells exhibit a subset of mitochondria localized in the lysosomes (red fluorescence; increased mitophagy) and a subset of damaged mitochondria (as evidenced in this paper) localized extralysosomally (yellow). Note, that the degree of red-green colocalization is significantly decreased in the KO compared to WT (B; asterisks indicate P < 0.05). CCCP treatment of the KO cells (KO+CCCP) leads to profound mitochondrial damage (more than in the WT; red fluorescence) and a greater increase in mitophagy compared to WT cells (compare KO+CCCP to WT+CCCP). Bar = 10 μm. (C) An increase in the level of PARK2 is much more pronounced in KO muscle (gastrocnemius; white part) compared to that in KO myotubes. An increase in the amount of ubiquitinated (Ub) proteins is seen in the KO muscle. (D) Western blot of the mitochondrial fraction isolated from WT and KO muscle with the indicated antibodies; the levels of PINK1, PARK2, and Ub-proteins are increased in KO. COX4I1 was used as a loading control.
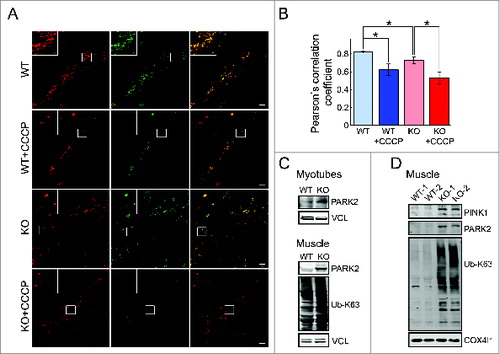
The level of PARK2, a protein that is recruited by PINK1 to damaged mitochondria to mark them for autophagic removal, was increased in KO myotubes and to a greater extent in KO muscle (). In addition, the increase in the levels of PINK1, PARK2, and Ub-proteins was detected in mitochondrial fraction from KO muscle (). These data indicate that the translocation of PARK2 to damaged mitochondria and subsequent ubiquitination of mitochondrial proteins are not compromised. The increase in the levels of Ub-proteins was also seen in the whole KO muscle ().
Altered calcium homeostasis can be reversed in Pompe muscle cells
To broaden our studies concerning mitochondrial changes in Pompe muscle, we performed mRNA sequencing (mRNA-Seq) using therapy-resistant type II muscle from 5-mo-old KO (n = 5) and WT (n = 4) mice (Fig. S6; GEO accession # GSE57980). We focused on sets of differentially expressed genes (upregulation of ≥ 2-fold relative to WT controls; P < 0.05; mean KO ≥ 0.05) coding for proteins involved in mitochondrial function, apoptosis, calcium homeostasis, and oxidative stress. The data are summarized in Tables S1 to S5. The gene expression studies also showed a modest but significant upregulation of Mcu (mitochondrial Ca2+ uniporter) and downregulation of Slc8a1, Slc8a2, and Slc8a3 (Na+/Ca2+ exchangers), which are responsible for the uptake and extrusion of Ca2+ by mitochondria, respectively.
A large number (40) of the genes upregulated in KO muscle codes for proteins that somehow govern the levels of cellular calcium (Fig. S6). There was a striking increase in the expression levels of the L-type Ca2+ channel isoforms—Cacnb1 (calcium channel, voltage-dependent, β 1 subunit) and Cacng1 (calcium channel, voltage-dependent, gamma subunit 1)—in the KO compared to those in controls (Table S2).
The increase in the CACNB1 was confirmed by western blot analysis of lysates from KO myotubes, human Pompe myotubes (; shown for mouse cells), and whole muscle (white part of gastrocnemius) of KO mice (). CACNB1 belongs to a group of voltage-dependent calcium channels (VDCC) found in membrane of excitable cells. The β subunit controls the expression levels of the α 1 subunit, which forms the Ca2+ selective pore at the cell membrane.Citation37 Activation of particular VDCCs allows for a rapid Ca2+ entry to the cell resulting in a cascade of signaling events depending on the cell type; in muscle cells this entry is linked to muscle contraction. Indeed, we have observed increased “twitching” of the KO myotubes compared to control cells.
Figure 11. Reversibility of the phenotype by a Ca2+ channel blocker. (A and B) Western blot of total lysates from WT and KO myotubes shows a dramatic increase in the levels of the CACNB1. (C, D, and E) KO myotubes (d 4 in differentiation medium) were incubated with verapamil (Ver; 10 μM) for 24 h. The abnormal phenotype (left panels) in KO myotubes—increased intracellular Ca2+ and ROS production, and a loss of ΔΨm—was reversed to the normal phenotype (right panels) following treatment with the drug (middle panels). Bar = 10 μm. Asterisks indicate P < 0.05.
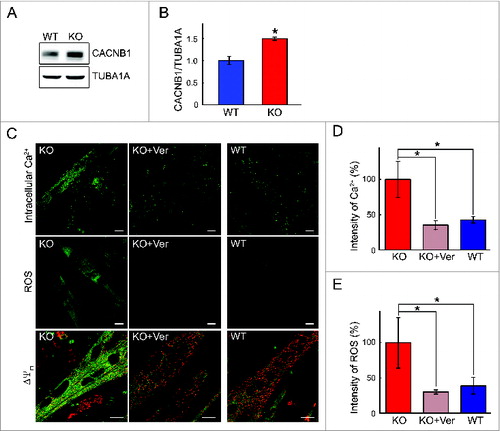
Figure 12. Reversibility of Ca2+ levels by verapamil in vivo. (A) Western blot of total lysates from WT and KO muscle shows a dramatic increase in the levels of the CACNB1. Top panel, short exposure (exp); middle panel, long exposure (exp). (B and C) Muscle fibers derived from verapamil-treated KO mice (KO + Ver; 25 mg/kg for 3 wk) show a significant decrease in Ca2+ levels in the areas free from autophagic buildup (arrows). Bar = 20 μm. Asterisk indicates P < 0.05.
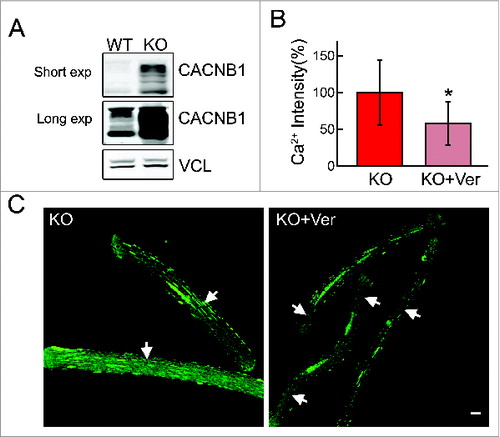
That the mitochondrial phenotype in Pompe muscle arises from the disturbance in calcium homeostasis is supported by the effects of calcium channel blockers in the system. We used 2 calcium- channel blocking drugs—the shorter-acting nifedipine (belongs to a group of dihydropyridines) and a longer-acting verapamil (belongs to a group of diphenylalkylamines). Culturing KO myotubes in the presence of either of the drugs resulted in a marked decrease in the level of intracellular Ca2+ and ROS production without affecting cell viability; similarly, the mitochondrial membrane potential was restored to near normal levels ( and Fig. S7). The effect of verapamil was more pronounced compared to that of nifedipine. Therefore, only verapamil was used for the in vivo experiments. A significant decrease in the level of Ca2+ was observed in regions of KO fibers free from autophagic buildup following daily intraperitoneal injection of 25 mg/kg verapamil for 3 wk (). Verapamil treatment in culture and in mice had no effect on autophagy as indicated by the levels of SQSTM1 (not shown) and LC3-II (Fig. S8).
Discussion
For years, the accumulation of glycogen in the lysosomes leading to an enlargement of lysosomal compartment and lysosomal rupture due to the mechanical pressure in skeletal muscle was considered an adequate explanation of the pathogenesis of muscle damage in Pompe disease.Citation38,39 This view has increased in complexity in recent years with the expansion of the role of the lysosomal system in a variety of cellular processes.Citation40-43
One of the important roles of lysosomes, relevant to LSDs, is their connection to the autophagic pathway. Autophagy is a conserved lysosomal pathway involved in the turnover of cellular macromolecules and worn-out organelles.Citation4,5 Lysosomes play a key role in the autophagic pathway by fusing with autophagosomes and digesting and recycling their content. Lysosomes are also major players in a selective clearance of damaged mitochondria by the autophagic pathway, a process known as mitophagy. These autophagy-related functions of lysosomes are particularly important in terminally differentiated cells such as neurons or myotubes; their post-mitotic nature precludes the dilution of mitochondrial dysfunction through cell division.
Many LSDs, a group of nearly 60 inherited disorders, share a common autophagic defect—inefficient lysosomal-autophagosomal fusion.Citation14 The autophagic defect leads to accumulation of autophagic substrates such as polyubiquitinated proteins, SQSTM1, and dysfunctional mitochondria. The defective autophagy in Pompe disease, which is blatantly evident in muscle fibers and to a certain extent in a cell model, may stem from reduced availability of energy source due to lysosomal glycogen sequestration.Citation44,45 A disturbed energy metabolism has recently been documented in Pompe patients with the adult form of the disease.Citation46 The autophagic defect contributes to the pathogenesis of muscle damage and alters trafficking of the replacement enzyme to the lysosome in Pompe disease.Citation27,45,47 In this study we have addressed mitochondrial abnormalities and mitophagy in Pompe skeletal muscle—the major site of pathology and a challenge for therapy.
Mitophagy is initiated by the accumulation of PINK1 on the OMM in response to a fall in ΔΨm, followed by the recruitment of PARK2; both proteins have been linked to Parkinson disease.Citation7,48 PARK2-mediated ubiquitination of OMM proteins sets off autophagic clearance of fragmented and damaged mitochondria.Citation9,10 Several additional proteins involved in PARK2 recruitment to mitochondria have been recently identified; some of these include MFN2,Citation49 mitochondrial HK1 (hexokinase 1),Citation50 TOMM7, HSPA1L, BAG4, and SIAH3.Citation51 The presence of abnormal mitochondria in LSDs was initially attributed to the general defect of the autophagic pathway—ineffective lysosomal-autophagosomal fusion.Citation13,52 However, recent studies have indicated that multiple mechanisms which occur prior to the entrapment of aberrant mitochondria into autophagosomes underlie their accumulation in these disorders.
Accumulation of morphologically aberrant mitochondria with reduced ΔΨm and apoptosis in multiple sulfatase deficiency (MSD) is attributed to a significant reduction in PARK2 levels. Interestingly, this mechanism operates in MSD liver, but not in MSD brain, suggesting that the process is tissue-specific.Citation21 In the most common LSD, Gaucher disease, the level of PARK2 is not changed, but its recruitment to mitochondria is.Citation20,53 Mitochondrial fragmentation and increased susceptibility to apoptosis in fibroblasts from patients with mucolipidosis type IV (ML IV) are linked to defective Ca2+ homeostasis and reduced mitochondrial Ca2+ buffering capacity. Similar changes were observed in fibroblasts from patients with mucolipidosis type II and III and neuronal ceroid lipofuscinosis 2 (CLN2).Citation54 In GM1-gangliosidosis, the storage material accumulates not only in lysosomes but also in the mitochondria-associated ER membranes, where it alters the activity of the phosphorylated Ca2+ releasing channel, IP3; this leads to mitochondrial Ca2+ overload, mitochondrial membrane permeabilization, and activation of apoptosis.Citation16
The mitochondrial abnormalities we observed in Pompe skeletal muscle do not exactly fit the patterns reported for LSDs. For one thing, there is an increase in PARK2 levels, which may reflect the cellular attempt (although not very successful in the whole muscle) to eliminate damaged mitochondria through the autophagic pathway. Alternatively, the increase in PARK2 may result from cellular utilization of a recently described vesicular pathway for ridding mitochondria of defective parts—a PINK1- and PARK2-dependent mechanism which is triggered by the oxidative damage within mitochondria.Citation55
A measure of congruency can be found between mitochondrial changes in Pompe disease and muscular dystrophies. Dysregulation of mitochondria-mediated Ca2+ homeostasis combined with oxidative stress triggers muscle cell death in a variety of muscular dystrophies.Citation56 Among these, collagen VI myopathies and Duchene muscular dystrophy (DMD) are the most studied.Citation57,58 Mitochondrial dysfunction in collagen VI dystrophies—Ulrich congenital muscular dystrophy and the less severe Bethlem myopathy—is characterized as a “latent” defect, which manifests as mitochondrial depolarization following oligomycin treatment.Citation57 The process of accumulation of abnormal mitochondria leading to apoptotic cell death is exacerbated by defective autophagy, and the reactivation of the autophagic flux rescues muscle degeneration.Citation59 A significant uncoupling of oxidative phosphorylation (oxygen consumption/ATP synthesis ratio) and a decrease in intramuscular ATP levels were reported in mdx mice, a model of DMD.Citation60 Once again it appears that mitochondrial abnormalities in Pompe muscle are distinctive to the disorder in that the defect is not latent and uncoupling is not observed.
There is a striking increase in the level of a component of L-type Ca2+ channels in Pompe muscle; to the best of our knowledge, this feature has only been reported in an X-linked myotubular (centronuclear) myopathy caused by a deficiency of MTM1 (myotubularin 1).Citation61 L-type calcium channels belong to a group of VDCCs found in membrane of excitable cells, such as muscle and neurons. Activation of particular VDCCs allows for a rapid Ca2+ entry to the cell resulting in a cascade of signaling events depending on the cell type. These channels are multisubunit membrane complexes that are composed of the α 1 subunit, which forms the Ca2+ selective pore, and several axillary subunits involved in regulatory functions. Skeletal muscle contraction requires the generation of a surface membrane action potential followed by Ca2+ release from the sarcoplasmic reticulum Ca2+ store, a process called the excitation-contraction coupling. In cardiac muscle the excitation-contraction coupling depends on Ca2+ entry from the extracellular space, whereas in skeletal muscle the process is thought to depend on the interaction between the dihydropyridine receptor L-type Ca2+ channel in the membranes of the t-tubules and RYR1 (ryanodine receptor 1 [skeletal]) Ca2+ release channel in the neighboring membranes of the sarcoplasmic reticulum.Citation62,63 Among the auxiliary subunits, the β1 subunit of the dihydropyridine receptor L-type Ca2+ channel (CACNB1)—overexpressed in Pompe muscle cells—is the strongest regulator of channel function and expression: it plays an important role in the transport of the α subunit to the t-tubule membrane and may contribute directly to the physical EC coupling process.Citation37 The Cacnb1 knockout mice die at birth from asphyxia.Citation64
The mechanism of CACNB1 upregulation in Pompe muscle remains unclear. It is likely that it is not the storage per se, but rather the changes in the signaling pathway linked to the lysosomes that are responsible for the finding. Recent data have positioned the lysosome at the center of the MTORC1 (mechanistic target of rapamycin complex I) pathway, which integrates signals from growth factors, nutrients, and energy.Citation41–43,65,66 In addition, our gene expression studies showed upregulation of 2 members of the early growth response gene (Egr) family, in particular Egr1 (4.25-fold) in the KO muscle; Egr1 is a physiological regulator of genes involved in calcium handling including L-type Ca2+ channel.Citation67
We reasoned that the increased CACNB1 in Pompe muscle cells triggers the observed surge in cytosolic Ca2+ levels and mitochondrial Ca2+ overload—a condition which is exacerbated with age of the animal and is not resolved by treatment with the therapeutic enzyme. An increase in Ca2+ levels in Pompe cells could lead to the increased autophagy, but this relationship is a subject of controversy. A number of studies suggested that a rise in cytosolic Ca2+ is a powerful inducer of autophagy,Citation68-71 although other reports do not support this finding.Citation72,73 In our study, the normalization of Ca2+ levels by verapamil did not have any appreciable effect on autophagy.
What is not a controversial issue is that increased Ca2+ levels cause mitochondrial abnormalities, which in turn contribute to muscle damage and wasting through mitochondria-mediated apoptosis. Indeed, in Pompe myotubes, we found a decrease of AIFM1 in the mitochondrial fraction and its increase in the nuclear fraction. When cleaved by Ca2+-activated protease CAPN/CalpainCitation74 AIFM1 is released and translocated to the nucleus where it, along with endonuclease G, induces chromatin condensation and DNA fragmentation independent of caspase activation (a caspase-independent apoptosis).Citation75 In the classical caspase-dependent apoptosis, which does not seem to be involved in Pompe muscle, CYCS release is followed by the assembly of an apoptosome, and activation of the caspase cascade. It has been suggested that the caspase-independent apoptosis is specific to skeletal muscle myonuclei, whereas other cells may undergo apoptosis through the more-classical caspase-dependent pathway.Citation76 While the contribution of caspase-dependent and independent pathways in aging human muscle has not been definitively established,Citation58 the expression levels of AIFM1 were elevated (by 10% to 25%) in muscle samples from older individuals, whereas the levels of CASP3 remained unchanged.Citation77 Activation of mitochondrial caspase-independent apoptotic signaling was also shown in aged rat gastrocnemius muscle.Citation78
Regardless of whether Pompe and aging muscle cells utilize the same apoptotic pathway, they do exhibit similar mitochondrial abnormalities. Dysfunctional mitochondria are recognized as a major factor contributing to the age-related loss of muscle mass, sarcopenia.Citation58,79,80 Both Pompe and aging muscle exhibit inadequate Ca2+ control and apoptosis of some of the nuclei in multinucleated muscle cells (syncytial apoptosis); the latter can cause myofiber atrophy without myofiber death.Citation81 Our current findings of decreased oxygen consumption, increased oxidative stress, and activation of apoptosis in Pompe muscle cells, as well as our previous data on autophagic block (a failure of autophagosomal-lysosomal fusion) and the buildup of lipofuscin in muscle tissue of both KO mice and Pompe patients,Citation29,30 all support the similarity between Pompe and aged muscle. According to the “mitochondrial-lysosomal axis theory of aging,” a vicious circle of mitochondrial oxidative damage and lysosomal deposition of lipofuscin, which impede efficient removal of damaged mitochondria by autophagy, would in turn generate ROS and perpetuate the production of lipofuscin.Citation12
This scenario appears true for muscle tissue in Pompe disease and to a much lesser degree for KO muscle cells in culture since they exhibit lysosomal expansion, but no autophagic buildup. These cells are therefore a valuable model for study of the early stages of the pathological cascade of Pompe disease and it was with this system that we detected an increase in intracellular Ca2+, mitochondrial Ca2+ overload, decreased mitochondrial membrane potential, ROS generation, and apoptosis—all of which precede the development of the autophagic buildup, lipofuscin accumulation, and a respiration compromised state of mitochondria so prominent in whole muscle fibers. Reversal of these early changes may halt the progression of the disorder. We have shown that 2 Ca2+ channel blockers—verapamil and nifedipine—both approved hypertension drugs, reversed the mitochondrial abnormalities in the KO cells. Therefore, these drugs in conjunction with ERT may have significant therapeutic potential for Pompe disease. Interestingly, diltiazem (another Ca2+ channel blocker) and verapamil are effective in restoring partial cellular folding, trafficking, and function to mutant lysosomal enzymes in fibroblasts from patients with Gaucher disease, Sanfilippo A or α‑mannosidosis.Citation82,83 Therefore, Ca2+ channel blockers might serve as chaperones to boost the activity of the mutant GAA in some Pompe patients as an added bonus to their ability to restore Ca2+ homeostasis.
Materials and Methods
Antibodies and plasmids
The following antibodies were used for western blots: VCL/Vinculin (Sigma, V9131), LC3B (Sigma, L8918), CACNB1 (S7–18; Abcam, ab85020), MFN2/mitofusin 2 (Abcam, ab50830), COX4I1/COXIV (Abcam, ab14744), FIS1/TTC11/ Fission 1 (Abcam, ab71498), PARK2/Parkin (Abcam, ab15954), TUBA1A/α-tubulin (Abcam, ab18251), PINK1 (Abcam, ab23707), ubiquitin (linkage-specific K63; Millipore, 05–1308), SQSTM1 (Santa Cruz Biotechnology, sc-25575), CASP3/caspase 3 (Cell Signaling Technology, 9662), AIFM1/AIF (Cell Signaling Technology, 5318), HIST1H3A/ Histone H3 (D1H2; Cell Signaling Technology, 4499), OPA1 (BD Biosciences, 612606), DNM1L/DRP1 (DNM1L; BD Biosciences, 611738), Alexa Fluor-conjugated secondary anti-mouse (Life Technologies, A-21057) or anti-rabbit (Life Technologies, A-21076). Plasmids: plasmid containing the gene encoding full-length rat LAMP1 (mCherry-LAMP1) was described previously;Citation27 a plasmid encoding mCherry, GFP and residues 101 to 152 of human FIS1 (mCherry-GFP-FIS 101 to 152)Citation36 was obtained from the University of Dundee (MRC-PPU reagents, DU40799); plasmid pCL–EcoCitation84 was obtained from Addgene (12371).
Culture systems and live-cell Ca2+ imaging
The generation and culturing of immortalized WT and KO (clone LE8 and clone 6) mouse muscle cells, isolation of single live myofibers from flexor digitorum brevis (FDB) muscles, and in vivo electroporation of FDB muscles with plasmid containing mCherry-LAMP1 have been described previously.Citation27 KO myotubes were treated with recombinant human GAA [5 μM; Myozyme® (alglucosidase alfa), Genzyme, a Sanofi Company) for 4 d; under these conditions the lysosomes were reduced to WT size.Citation32 Lysosomal glycogen was evaluated by the incorporation of 2-NBDG (Life Technologies, N13195), a D-glucose fluorescent derivative (2-deoxyglucose), into glycogen as described.Citation85
Human primary muscle cells were provided by Dr. Benedikt Schoser (Friedrich-Baur-Institute, Ludwig-Maximillian University, Munich, Germany). Three human samples were used: one was from a healthy individual (# 94/13) and 2 from patients with adult form of Pompe disease (# FBI-542–2004, mutations c.-13–32T>G/IVS7–15G>A and # FBI-484–2003, mutations c.-13–32T>G/c.925G>A). Muscle cells were cultured in proliferation medium (high glucose [4.5 g/L] DMEM containing 20% fetal bovine serum, 1 mM sodium pyruvate, 1x P/S/l-glutamine [Gibco, 10378–16], recombinant human insulin [10 μg/ml], recombinant human epidermal growth factor [0.20 μg/ml], recombinant human fibroblast growth factor-basic [0.25 μg/ml] [all 3 recombinant proteins from Life Technologies, catalog numbers 12585–014, PHG0311, and PHG0261 respectively]). When myoblasts were almost confluent, the medium was changed to differentiation medium (high glucose [4.5 g/L] DMEM, 5% horse serum [HyClone, SH30074.03], 1 mM sodium pyruvate, 1xP/S/l-glutamine, recombinant human insulin [10 μg/ml]). Myotubes began to form within 3 d in differentiation medium; they survived in culture for 8 to10 d.
In addition, we made a new in vitro model of Pompe disease—immortalized KO muscle cells, in which lysosomes are labeled with mCherry-LAMP1. The generation of this line is described below.
All systems were used for live-cell Ca2+ imaging. Myotubes were washed with HBSS buffer (Gibco/Invitrogen, 14025134), loaded with the calcium-sensitive dye, Fluo-4 AM (10 μM; Invitrogen, F14201) for 30 min, and incubated with HBSS for 30 min. Fluorescence intensities of the images were analyzed using Image J as described.Citation32
For the evaluation of calcium flux in myotubes, Ca2+/Mg2+-free HBSS buffer (Gibco/Invitrogen, 14175103) was used; the flux was monitored by time-lapse microscopy at 10 s intervals for up to 3 min after the addition of 2 mM Ca2+. Differentiation medium was used for the evaluation of Ca2+ levels in muscle fibers. Flueo-4 AM-loaded myotubes or myofibers were analyzed using a laser confocal microscope (Zeiss LSM780, Carl Zeiss, Inc..,Thornwood, New York). To monitor both cytosolic and mitochondrial Ca2+, WT and KO myotubes were dual loaded with the cytosolic green Ca2+ probe Fluo-4 AM (10 μM) and the red Ca2+-sensitive Rhod-2 AM (10 μM; Invitrogen, R1245MP) dye that predominantly accumulates in mitochondria.Citation34 The cells were incubated for 30 min at 37 ˚C with both dyes in differentiation medium, followed by washes and additional 30 min incubation in the medium alone; the cells were then washed with HBSS buffer and analyzed by confocal microscopy.
Generation of a new immortalized Pompe muscle cell line that stably expresses mCherry-LAMP1
Immortalized KO mouse myoblasts (clone 6)Citation27 were infected with lentivirus-mCherry-LAMP1 (1×10⁸ TU/ml; Welgen Inc, SL1100). Cells were seeded in 6-well plates at a density of 1.0 × 10⁵ cells/well and incubated in proliferation medium (20% fetal bovine serum, 10% horse serum, 1% chick embryo extract [Axenia BioLogix, S310], recombinant IFNG [100units/ml; Life Technologies, PMC4031], 1× P/S/l-glutamine in high glucose [4.5 g/L] DMEM) for 3 d at 33˚C followed by infection with the virus (at 10 multiplicity of infection in the presence of 8 μg/ml polybrene [Sigma, H9268]) and puromycin selection (5 μg/ml). Twelve clones were then isolated with cloning cylinders (Corning, CLS31668) based on the intensity of fluorescence and tested for their proliferation capacity and the ability to differentiate into myotubes. One of the 12 clones was used for further use. The clone was then sorted by FACS analysis to identify a population with the highest fluorescence; these cells, referred to as JL12KO, were used for the experiments. LAMP1-positive enlarged lysosomes can be seen in myotubes on d 7 to 9. For confocal microscopy the cells were cultured on BD Matrigel (BD Biosciences, 354234)-coated ibiTreat μ–Slide 8-well chambers (ibidi GmbH, 80826).
Evaluation of mitochondrial morphology, physiological parameters, and function
For electron microcopy muscle biopsy samples isolated from 5- to 6-mo-old KO and WT mice were fixed and treated as described.Citation86 Mitochondrial appearance was evaluated in MitoTracker-labeled myoblasts and myofibers (MitoTracker® Red CMXRos [Life Technologies, M7512], 100 nM). Mitochondrial length was quantified (in 3 independent experiments) using ImageJ (version 1.49 g; Wayne Rasband National Institutes of Health, Bethesda, MD; http://imagej.nih.gov/ij). Mitochondrial membrane potential (ΔΨm) was determined by using a mitochondria specific JC-1 dye (Life technologies, T3168). The myotubes and myofibers were incubated with 5 μg/ml JC-1 for 30 min at 37˚C in the media, PBS-washed, and analyzed by confocal microscopy. In addition, ΔΨm was evaluated by loading the cells with 10 nM of tetramethylrhodamine methyl ester (TMRM; Life Technologies, T-668) for 30 min at 37˚C as described.Citation87 MitoTracker Green (50 nM; Life Technologies, M7514) was used in combination with TMRM to distinguish depolarized from polarized mitochondria.
The levels of ROS were evaluated by incubating the cells with CellRox® Green (5 μM; Life Technologies, C10444) for 30 min at 37˚C in the media, followed by PBS-wash and confocal analysis. Cell viability was evaluated using Cell Proliferation Assay Kit (Millipore, 2210). Apoptotic nuclei were identified by TdT-mediated dUTP nick end labeling (TUNEL) according to the manufacturer's recommendations (Millipore, S7160). The experiments were performed at least in triplicate, and all statistical analyses were performed using the Student t test.
Isolation of mitochondria, mitochondrial respiration studies, and ATP measurements
Animal care and experiments were conducted in accordance with the National Institutes of Health Guide for the Care and Use of Laboratory Animals. Mitochondria were isolated from freshly harvested skeletal muscle of KO and WT mice (> 7 mo of age) as described.Citation88 Briefly, isolated muscles were washed and minced in ice-cold medium containing 225 mM mannitol (Sigma, M9546), 75 mM sucrose (Sigma, S7903), 5 mM MOPS (Sigma, M3183), 0.5 mM EGTA, 2 mM taurine (Sigma, T0625), pH 7.25. The tissues were digested (10 min on ice) with Nagarse (1 U/ml; Sigma, P8038) which was added to the medium; samples were then washed with the medium containing 0.3% BSA (Sigma, A6003), resuspended in the same medium, and homogenized with a glass-Teflon homogenizer. Mitochondrial fraction was isolated by differential centrifugation. Isolated mitochondria were washed twice and resuspended in the same medium prior to functional assessment. Oxygen consumption of isolated mitochondria was measured as described.Citation89 Glutamate (10 mM; Sigma, G1626), malate (2.0 mM; Sigma, 46940), and ADP (500 μM; Sigma, A2754) were used to assay mitochondrial respiration. ATP levels of isolated mitochondria were measured using EnzyLightTM ATP assay kit (Bioassay Systems, EATP-100) according to the manufacturer's instructions. Subcellular fractionation of gastrocnemius muscle (white part) of KO and WT mice for western analysis was performed as described.Citation90 Mitochondria from WT and KO myotubes were isolated using Mitochondria Isolation Kit for Cultured Cells (Thermo Scientific, 89874) according to the manufacturer's instructions.
Treatments to monitor mitochondrial function and autophagy in KO myotubes
Verapamil (10 μM; Sigma, V4629) and nifedipine (20 μM; Sigma, N7634) were added to myotubes for 24 and 2 h respectively on d 6 to 8 in differentiation medium. To monitor mitophagy we used the mCherry-GFP-FIS 101–152 construct. The construct was cotransfected in HEK293 cells with plasmid pCL–Eco (Addgene, 12371) for retrovirus production using Lipofectamine LTX (Life Technologies, 15338–100) according to the manufacturer's instructions. Medium was collected 3 d after transfection, passed through 0.4-μm filter, treated with PEG-ittm (System Biosciences, LV810A-1) overnight at 4˚C, and centrifuged at 1500 g for 30 min at 4˚C. The precipitate containing the virus was resuspended in DMEM, aliquotted and stored at −80˚C for further use. WT and KO myotubes were infected with the filtered viral supernatant containing 8 μg/ml polybrene on d 4 in differentiation medium. Three d after, the cells were analyzed by confocal microscopy.
To monitor autophagy, WT and KO myotubes were infected (d 7 or 8) using PremoTM Autophgy Tandem Sensor RFP-GFP-LC3B Kit (Molecular Probes, P36239) according to the manufacturer's instructions.
For drug treatment experiments, cells (on d 6 or 7) were incubated with chloroquine (20 h; 50 μM) and bafilomycin A1 (4 h, 400 nM; Sigma, B1793).
In vivo drug administration
Verapamil hydrochloride (Hospira, Inc..; the drug was obtained through the Division of Veterinary Resources pharmacy at the NIH) was administered intraperitonealy to 6 KO mice at a dose of 25 mg/kg body weight daily for 20 to 22 d as described.Citation91,92 The animals were weighed periodically to adjust the drug dose. Five KO mice were used as controls. The drug was injected into 3 one-mo-old KO and 3 2-mo-old KO mice. The difference between the 2 groups was not significant; therefore, the data for all 6 animals were combined. No adverse effects were observed during the trial period. Single live FDB myofibers were used for the evaluation of Ca2+ levels; freshly harvested skeletal muscle was used for western blotting.
Western blotting
Cells were washed with PBS and lysed in RIPA buffer (PBS containing 1% NP-40 [Sigma, NP40S], 0.5% sodium deoxycholate [Sigma, D6750], 0.1% SDS [Research Genetics, 750008], 30 mM Tris pH 7.4, 150 mM NaCl, 1 mM EDTA) supplemented with protease and phosphatase inhibitor cocktail (Cell Signaling Technology, 5872S), followed by sonication. Protein concentrations were measured using the Bio-Rad Protein Assay (Bio-Rad Laboratories, 500–0006). For nuclear and cytosolic fractionation, cells were lysed in 0.5% Triton X-100 buffer (50mM Tris–HCl, 0.5% Triton X-100 [Sigma, T9284], 137.5mM NaCl, 10% glycerol, 5 mM EDTA and protease and phosphatase inhibitors using syringes with 23G needles) and centrifuged at 1000 g at 4˚C for 10min. The supernatant fraction constituted the cytosolic fraction. The pellet was then washed with 0.5% Triton X-100 buffer, resuspended in Triton X-100 buffer with 0.5% SDS, sonicated, and centrifuged at 1000 g for 15 min at 4˚C. The supernatant fraction constituted the nuclear fraction.
Western blotting was performed according to standard procedures. The gels were blotted onto nitrocellulose membranes, and blocked in Odyssey solution (LI-COR Biosciences, 927–40000) for 1 h, incubated with primary antibodies overnight at 4˚C for, followed by incubation with secondary antibodies. Blots were scanned on an Odyssey Infrared Imager (LI-COR Biosciences). At least 3 independent experiments were performed for each condition.
mRNA Expression profiling and data analysis
The muscle transcriptomes were generated by RNA sequencing (RNA-Seq). Total RNA was extracted from gastrocnemius (white part) muscle of 5-mo-old KO (n=5) and WT (n=4) mice. This was followed by the generation and high-throughput sequencing of complimentary DNAs (cDNAs) using the Illumina sequencing platform (Illumina's HiSeq 2000 system, San-Diego, CA); a whole-genome transcriptome map is then constructed by aligning the sequence to a reference genome. The detailed protocol can be found in Nagalakshmi et al.Citation93 Raw sequencing data were processed with CASAVA 1.8.2 to generate FastQ files. Reads of 50 bases were mapped to the mouse transcriptome and genome mm9 using TopHat 1.3.3.Citation94 Gene expression values (RPKM: Reads Per Kilobase exon per million mapped reads) were calculated with Partek Genomics Suite 6.6, which was also used for the PCA and ANOVA analyses. The annotation of transcripts identified as differentially expressed in the KO vs WT has been deposited in the Gene Expression Ombibus database (accession number: GEO#:GSE57980). Of the 551 genes upregulated in the KO (P < 0.05; mean KO >0.05; FC > 2), molecular functions were attributed to 152 genes using GOTERM_MF_FAT from the DAVID database (Table S1).
Statistical Analysis
The Student t test was used for statistical analysis; error bars represent SD. *P ≤ 0.05 was considered statistically significant. A Pearson correlation coefficient was calculated to evaluate the extent of red and green colocalization in myotubes infected with virus containing the OMM protein FIS1 linked to GFP- mCherry tags. For each series of experiments we chose age and gender matched controls.
Disclosure of Potential Conflicts of Interest
No potential conflicts of interest were disclosed.
Supplemental Material
Supplemental data for this article can be accessed on the publisher's website.
Supplemental_Videos_S1-S4.zip
Download Zip (1.7 MB)Supplemental_Figures_S1-S8__Tables.zip
Download Zip (112.5 MB)Acknowledgments
We would like to thank Kristien Zaal and Evelyn Ralston (Light Imaging Section, Office of Science and Technology, NIAMS, NIH) for their help with the imaging. We are grateful to James Simone (Flow Cytometry Section, Office of Science and Technology, NIAMS, NIH) for help with FACS analysis. We would also like to thank Dr. Benedikt Schoser (Ludwig-Maximilians University, Munich, Germany) for providing primary muscle cells from Pompe patients. We are grateful to Gustavo Gutierrez-Cruz and Hong-Wei Sun for their help with mRNA-sequencing and to Dr. Xin Pan (Laboratory of Molecular Biology, NHLBI, NIH) for assistance with mitochondrial respiration studies.
Funding
This research was supported in part by the Intramural Research Program of the National Institute of Arthritis and Musculoskeletal and Skin diseases of the National Institutes of Health. Dr. Lim and Dr. Li are supported in part by a CRADA between NIH and Genzyme Corporation and from the Acid Maltase Deficiency Association.
References
- Nunnari J, Suomalainen A. Mitochondria: in sickness and in health. Cell 2012; 148:1145-59; PMID:22424226; http://dx.doi.org/10.1016/j.cell.2012.02.035
- Hoppins S, Nunnari J. Cell biology. mitochondrial dynamics and apoptosis–the ER connection. Science 2012; 337:1052-4; PMID:22936767; http://dx.doi.org/10.1126/science.1224709
- Youle RJ, van der Bliek AM. Mitochondrial fission, fusion, and stress. Science 2012; 337:1062-5; PMID:22936770; http://dx.doi.org/10.1126/science.1219855
- Klionsky DJ. The molecular machinery of autophagy: unanswered questions. J Cell Sci 2005; 118:7-18; PMID:15615779
- Klionsky DJ. Autophagy: from phenomenology to molecular understanding in less than a decade. Nat Rev Mol Cell Biol 2007; 8:931-7; PMID:17712358
- Lemasters JJ. Selective mitochondrial autophagy, or mitophagy, as a targeted defense against oxidative stress, mitochondrial dysfunction, and aging. Rejuvenation Res 2005; 8:3-5; PMID:15798367
- Narendra D, Tanaka A, Suen DF, Youle RJ. Parkin is recruited selectively to impaired mitochondria and promotes their autophagy. J Cell Biol 2008; 183:795-803; PMID:19029340; http://dx.doi.org/10.1083/jcb.200809125
- Twig G, Elorza A, Molina AJ, Mohamed H, Wikstrom JD, Walzer G, Stiles L, Haigh SE, Katz S, Las G, et al. Fission and selective fusion govern mitochondrial segregation and elimination by autophagy. Embo J 2008; 27:433-46; PMID:18200046; http://dx.doi.org/10.1038/sj.emboj.7601963
- Narendra DP, Jin SM, Tanaka A, Suen DF, Gautier CA, Shen J, Cookson MR, Youle RJ. PINK1 is selectively stabilized on impaired mitochondria to activate Parkin. PLoS Biol 2010; 8:e1000298; PMID:20126261; http://dx.doi.org/10.1371/journal.pbio.1000298
- Youle RJ, Narendra DP. Mechanisms of mitophagy. Nat Rev Mol Cell Biol 2011; 12:9-14; PMID:21179058; http://dx.doi.org/10.1038/nrm3028
- Osellame LD, Duchen MR. Quality control gone wrong: mitochondria, lysosomal storage disorders and neurodegeneration. British J Pharmacol 2013; 171:1958-72; PMID:24116849; http://dx.doi.org/10.1111/bph.12453
- Terman A, Kurz T, Navratil M, Arriaga EA, Brunk UT. Mitochondrial turnover and aging of long-lived postmitotic cells: the mitochondrial-lysosomal axis theory of aging. Antioxid Redox Signal 2010; 12:503-35; PMID:19650712; http://dx.doi.org/10.1089/ars.2009.2598
- Settembre C, Fraldi A, Rubinsztein DC, Ballabio A. Lysosomal storage diseases as disorders of autophagy. Autophagy 2008; 4:113-4; PMID:18000397
- Lieberman AP, Puertollano R, Raben N, Slaugenhaupt S, Walkley SU, Ballabio A. Autophagy in lysosomal storage disorders. Autophagy 2012; 8:719-30; PMID:22647656; http://dx.doi.org/10.4161/auto.19469
- Takamura A, Higaki K, Kajimaki K, Otsuka S, Ninomiya H, Matsuda J, Ohno K, Suzuki Y, Nanba E. Enhanced autophagy and mitochondrial aberrations in murine G(M1)-gangliosidosis. Biochem Biophys Res Commun 2008; 367:616-22; PMID:18190792; http://dx.doi.org/10.1016/j.bbrc.2007.12.187
- Sano R, Annunziata I, Patterson A, Moshiach S, Gomero E, Opferman J, Forte M, d'Azzo A. GM1-ganglioside accumulation at the mitochondria-associated ER membranes links ER stress to Ca(2+)-dependent mitochondrial apoptosis. Mol Cell 2009; 36:500-11; PMID:19917257; http://dx.doi.org/10.1016/j.molcel.2009.10.021
- Otomo T, Higaki K, Nanba E, Ozono K, Sakai N. Inhibition of autophagosome formation restores mitochondrial function in mucolipidosis II and III skin fibroblasts. Mol Genet Metab 2009; 98:393-9; PMID:19656701; http://dx.doi.org/10.1016/j.ymgme.2009.07.002
- Jennings JJ, Jr., Zhu JH, Rbaibi Y, Luo X, Chu CT, Kiselyov K. Mitochondrial aberrations in mucolipidosis type IV. J Biol Chem 2006; 281:39041-50; PMID:17056595
- Cao Y, Espinola JA, Fossale E, Massey AC, Cuervo AM, Macdonald ME, Cotman SL. Autophagy is disrupted in a knock-in mouse model of juvenile neuronal ceroid lipofuscinosis. J Biol Chem 2006; 281:20483-93; PMID:16714284
- Osellame LD, Rahim AA, Hargreaves IP, Gegg ME, Richard-Londt A, Brandner S, Waddington SN, Schapira AH, Duchen MR. Mitochondria and quality control defects in a mouse model of gaucher disease–links to parkinson's disease. Cell Metab 2013; 17:941-53; PMID:23707074; http://dx.doi.org/10.1016/j.cmet.2013.04.014
- de Pablo-Latorre R, Saide A, Polishhuck EV, Nusco E, Fraldi A, Ballabio A. Impaired parkin-mediated mitochondrial targeting to autophagosomes differentially contributes to tissue pathology in lysosomal storage diseases. Hum Mol Genet 2012; 21:1770-81; PMID:22215441; http://dx.doi.org/10.1093/hmg/ddr610
- Van der Ploeg AT, Reuser AJ. Pompe's disease. Lancet 2008; 372:1342-53; PMID:18929906; http://dx.doi.org/10.1016/S0140-6736(08)61555-X
- Kishnani PS, Corzo D, Leslie ND, Gruskin D, Van der PA, Clancy JP, Parini R, Morin G, Beck M, Bauer MS, et al. Early treatment with alglucosidase α prolongs long-term survival of infants with Pompe disease. Pediatr Res 2009; 66:329-35; PMID:19542901; http://dx.doi.org/10.1203/PDR.0b013e3181b24e94
- Prater SN, Banugaria SG, DeArmey SM, Botha EG, Stege EM, Case LE, Jones HN, Phornphutkul C, Wang RY, Young SP, et al. The emerging phenotype of long-term survivors with infantile Pompe disease. Genet Med 2012; 14:800-10; PMID:22538254; http://dx.doi.org/10.1038/gim.2012.44
- Strothotte S, Strigl-Pill N, Grunert B, Kornblum C, Eger K, Wessig C, Deschauer M, Breunig F, Glocker FX, Vielhaber S, et al. Enzyme replacement therapy with alglucosidase alfa in 44 patients with late-onset glycogen storage disease type 2: 12-month results of an observational clinical trial. JNeurol 2009; 257:91-7; PMID:19649685; http://dx.doi.org/10.1007/s00415-009-5275-3
- Raben N, Roberts A, Plotz PH. Role of autophagy in the pathogenesis of Pompe disease. Acta Myol 2007; 26:45-8; PMID:17915569
- Spampanato C, Feeney E, Li L, Cardone M, Lim JA, Annunziata F, Zare H, Polishchuk R, Puertollano R, Parenti G, et al. Transcription factor EB (TFEB) is a new therapeutic target for Pompe disease. EMBO Mol Med 2013; 5:691-706; PMID:23606558; http://dx.doi.org/10.1002/emmm.201202176
- Prater SN, Patel TT, Buckley AF, Mandel H, Vlodavski E, Banugaria SG, Feeney EJ, Raben N, Kishnani PS. Skeletal muscle pathology of infantile Pompe disease during long-term enzyme replacement therapy. Orphanet J Rare Diseases 2013; 8:90-101; PMID:23787031; http://dx.doi.org/10.1186/1750-1172-8-90
- Feeney EJ, Austin S, Chien YH, Mandel H, Schoser B, Prater S, Hwu WL, Ralston E, Kishnani PS, Raben N. The value of muscle biopsies in Pompe disease: identifying lipofuscin inclusions in juvenile- and adult-onset patients. Acta Neuropathol Commun 2014; 2:2-17; PMID:24383498; http://dx.doi.org/10.1186/2051-5960-2-2
- Raben N, Wong A, Ralston E, Myerowitz R. Autophagy and mitochondria in Pompe disease: nothing is so new as what has long been forgotten. Am J Med Genet C Semin Med Genet 2012; 160:13-21; PMID:22253254; http://dx.doi.org/10.1002/ajmg.c.31317
- Schoser BG, Muller-Hocker J, Horvath R, Gempel K, Pongratz D, Lochmuller H, Muller-Felber W. Adult-onset glycogen storage disease type 2: clinico-pathological phenotype revisited. Neuropathol Appl Neurobiol 2007; 33:544-59; PMID:17573812
- Takikita S, Myerowitz R, Zaal K, Raben N, Plotz PH. Murine muscle cell models for Pompe disease and their use in studying therapeutic approaches. Mol Genet Metab 2009; 96:208-17; PMID:19167256; http://dx.doi.org/10.1016/j.ymgme.2008.12.012
- Pozzan T, Rizzuto R. High tide of calcium in mitochondria. Nat Cell Biol 2000; 2:E25-7; PMID:10655598
- Boitier E, Rea R, Duchen MR. Mitochondria exert a negative feedback on the propagation of intracellular Ca2+ waves in rat cortical astrocytes. J Cell Biol 1999; 145:795-808; PMID:10330407
- Kabeya Y, Mizushima N, Ueno T, Yamamoto A, Kirisako T, Noda T, Kominami E, Ohsumi Y, Yoshimori T. LC3, a mammalian homologue of yeast Apg8p, is localized in autophagosome membranes after processing. EMBO J 2000; 19:5720-8; PMID:11060023
- Allen GF, Toth R, James J, Ganley IG. Loss of iron triggers PINK1/Parkin-independent mitophagy. EMBO reports 2013; 14:1127-35; PMID:24176932; http://dx.doi.org/10.1038/embor.2013.168
- Karunasekara Y, Dulhunty AF, Casarotto MG. The voltage-gated calcium-channel β subunit: more than just an accessory. Europ Biophys J 2009; 39:75-81; PMID:19455319; http://dx.doi.org/10.1007/s00249-009-0467-4
- Griffin JL. Infantile acid maltase deficiency. I. muscle fiber destruction after lysosomal rupture4. Virchows Arch Cell Pathol Mol Pathol 1984; 45:23-36; PMID:6199885
- Thurberg BL, Lynch MC, Vaccaro C, Afonso K, Tsai AC, Bossen E, Kishnani PS, O'Callaghan M. Characterization of pre- and post-treatment pathology after enzyme replacement therapy for Pompe disease. Lab Invest 2006; 86:1208-20; PMID:17075580
- Saftig P, Klumperman J. Lysosome biogenesis and lysosomal membrane proteins: trafficking meets function. Nat Rev Mol Cell Biol 2009; 10:623-35; PMID:19672277; http://dx.doi.org/10.1038/nrm2745
- Zoncu R, Bar-Peled L, Efeyan A, Wang S, Sancak Y, Sabatini DM. mTORC1 senses lysosomal amino acids through an inside-out mechanism that requires the vacuolar H(+)-ATPase. Science 2011; 334:678-83; PMID:22053050; http://dx.doi.org/10.1126/science.1207056
- Efeyan A, Zoncu R, Chang S, Gumper I, Snitkin H, Wolfson RL, Kirak O, Sabatini DD, Sabatini DM. Regulation of mTORC1 by the rag GTPases is necessary for neonatal autophagy and survival. Nature 2013; 493:679-83; PMID:23263183; http://dx.doi.org/10.1038/nature11745
- Bar-Peled L, Sabatini DM. Regulation of mTORC1 by amino acids. Trends Cell Biol 2014; PMID:24698685; http://dx.doi.org/10.1016/j.tcb.2014.03.003
- Fukuda T, Ewan L, Bauer M, Mattaliano RJ, Zaal K, Ralston E, Plotz PH, Raben N. Dysfunction of endocytic and autophagic pathways in a lysosomal storage disease. Ann Neurol 2006; 59:700-8; PMID:16532490
- Fukuda T, Ahearn M, Roberts A, Mattaliano RJ, Zaal K, Ralston E, Plotz PH, Raben N. Autophagy and mistargeting of therapeutic enzyme in skeletal muscle in Pompe disease. Mol Ther 2006; 14:831-9; PMID:17008131
- Pascual JM, Roe CR. Systemic metabolic abnormalities in adult-onset acid maltase deficiency: beyond muscle glycogen accumulation. JAMA Neurol 2013; 70:756-63; PMID:23609947; http://dx.doi.org/10.1001/jamaneurol.2013.1507
- Nascimbeni AC, Fanin M, Masiero E, Angelini C, Sandri M. Impaired autophagy contributes to muscle atrophy in glycogen storage disease type II patients. Autophagy 2012; 8:1697-700; PMID:22940840; http://dx.doi.org/10.4161/auto.21691
- Twig G, Hyde B, Shirihai OS. Mitochondrial fusion, fission and autophagy as a quality control axis: the bioenergetic view. Biochim Biophys Acta 2008; 1777:1092-7; PMID:18519024; http://dx.doi.org/10.1016/j.bbabio.2008.05.001
- Chen Y, Dorn GW, 2nd. PINK1-phosphorylated mitofusin 2 is a Parkin receptor for culling damaged mitochondria. Science 2013; 340:471-5; PMID:23620051; http://dx.doi.org/10.1126/science.1231031
- Okatsu K, Iemura S, Koyano F, Go E, Kimura M, Natsume T, Tanaka K, Matsuda N. Mitochondrial hexokinase HKI is a novel substrate of the parkin ubiquitin ligase. Biochem Biophys Res Commun 2012; 428:197-202; PMID:23068103; http://dx.doi.org/10.1016/j.bbrc.2012.10.041
- Hasson SA, Kane LA, Yamano K, Huang CH, Sliter DA, Buehler E, Wang C, Heman-Ackah SM, Hessa T, Guha R, et al. High-content genome-wide RNAi screens identify regulators of parkin upstream of mitophagy. Nature 2013; 504:291-5; PMID:24270810http://dx.doi.org/10.1038/nature12748
- Settembre C, Fraldi A, Jahreiss L, Spampanato C, Venturi C, Medina D, de Pablo R, Tacchetti C, Rubinsztein DC, Ballabio A. A block of autophagy in lysosomal storage disorders. Hum Mol Genet 2008; 17:119-29; PMID:17913701
- Osellame LD, Duchen MR. Defective quality control mechanisms and accumulation of damaged mitochondria link Gaucher and parkinson diseases. Autophagy 2013; 9:1633-5; PMID:23989665; http://dx.doi.org/10.4161/auto.25878
- Jennings JJ, Jr., Zhu JH, Rbaibi Y, Luo X, Chu CT, Kiselyov K. Mitochondrial aberrations in mucolipidosis Type IV. J Biol Chem 2006; 281:39041-50; PMID:17056595
- McLelland GL, Soubannier V, Chen CX, McBride HM, Fon EA. Parkin and PINK1 function in a vesicular trafficking pathway regulating mitochondrial quality control. Embo J 2014; 33:282-95; PMID:24446486; http://dx.doi.org/10.1002/embj.201385902
- Katsetos CD, Koutzaki S, Melvin JJ. Mitochondrial dysfunction in neuromuscular disorders. Seminars Pediatr Neurol 2013; 20:202-15; PMID:24331362; http://dx.doi.org/10.1016/j.spen.2013.10.010
- Bernardi P, Bonaldo P. Mitochondrial dysfunction and defective autophagy in the pathogenesis of collagen VI muscular dystrophies. Cold Spring Harbor perspectives in biology 2013; 5:a011387; PMID:23580791; http://dx.doi.org/10.1101/cshperspect.a011387
- Marzetti E, Calvani R, Cesari M, Buford TW, Lorenzi M, Behnke BJ, Leeuwenburgh C. Mitochondrial dysfunction and sarcopenia of aging: from signaling pathways to clinical trials. Int J Biochem Cell Biol 2013; 45:2288-301; PMID:23845738; http://dx.doi.org/10.1016/j.biocel.2013.06.024
- Grumati P, Coletto L, Sabatelli P, Cescon M, Angelin A, Bertaggia E, Blaauw B, Urciuolo A, Tiepolo T, Merlini L, et al. Autophagy is defective in collagen VI muscular dystrophies, and its reactivation rescues myofiber degeneration. Nat Med 2010; 16:1313-20; PMID:21037586; http://dx.doi.org/10.1038/nm.2247
- Percival JM, Siegel MP, Knowels G, Marcinek DJ. Defects in mitochondrial localization and ATP synthesis in the mdx mouse model of duchenne muscular dystrophy are not alleviated by PDE5 inhibition. Hum Mol Genet 2013; 22:153-67; PMID:23049075; http://dx.doi.org/10.1093/hmg/dds415
- Al-Qusairi L, Weiss N, Toussaint A, Berbey C, Messaddeq N, Kretz C, Sanoudou D, Beggs AH, Allard B, Mandel JL, et al. T-tubule disorganization and defective excitation-contraction coupling in muscle fibers lacking myotubularin lipid phosphatase. Proc Natl Acad Sci U S A 2009; 106:18763-8; PMID:19846786; http://dx.doi.org/10.1073/pnas.0900705106
- Rebbeck RT, Karunasekara Y, Board PG, Beard NA, Casarotto MG, Dulhunty AF. Skeletal muscle excitation-contraction coupling: who are the dancing partners? Int J Biochem Cell Biol 2013; 48C:28-38; PMID:24374102; http://dx.doi.org/10.1016/j.biocel.2013.12.001
- Hofmann F, Flockerzi V, Kahl S, Wegener JW. L-Type CaV1.2 calcium channels: from in vitro findings to in vivo function. Physiol Rev 2014; 94:303-26; PMID:24382889; http://dx.doi.org/10.1152/physrev.00016.2013
- Gregg RG, Messing A, Strube C, Beurg M, Moss R, Behan M, Sukhareva M, Haynes S, Powell JA, Coronado R, et al. Absence of the β subunit (cchb1) of the skeletal muscle dihydropyridine receptor alters expression of the α 1 subunit and eliminates excitation-contraction coupling. Proc Natl Acad Sci U S A 1996; 93:13961-6; PMID:8943043
- Pous C, Codogno P. Lysosome positioning coordinates mTORC1 activity and autophagy. Nat Cell Biol 2011; 13:342-4; PMID:21460804; http://dx.doi.org/10.1038/ncb0411-342
- Korolchuk VI, Saiki S, Lichtenberg M, Siddiqi FH, Roberts EA, Imarisio S, Jahreiss L, Sarkar S, Futter M, Menzies FM, et al. Lysosomal positioning coordinates cellular nutrient responses. Nat Cell Biol 2011; 13:453-60; PMID:21394080; http://dx.doi.org/10.1038/ncb2204
- Pacini L, Suffredini S, Ponti D, Coppini R, Frati G, Ragona G, Cerbai E, Calogero A. Altered calcium regulation in isolated cardiomyocytes from Egr-1 knock-out mice. Can J Physiol Pharmacol 2013; 91:1135-42; PMID:24289086; http://dx.doi.org/10.1139/cjpp-2012-0419
- Hoyer-Hansen M, Bastholm L, Szyniarowski P, Campanella M, Szabadkai G, Farkas T, Bianchi K, Fehrenbacher N, Elling F, Rizzuto R, et al. Control of macroautophagy by calcium, calmodulin-dependent kinase kinase-β, and Bcl-2. Mol Cell 2007; 25:193-205; PMID:17244528
- Brady NR, Hamacher-Brady A, Yuan H, Gottlieb RA. The autophagic response to nutrient deprivation in the hl-1 cardiac myocyte is modulated by Bcl-2 and sarco/endoplasmic reticulum calcium stores. Febs J 2007; 274:3184-97; PMID:17540004
- Grotemeier A, Alers S, Pfisterer SG, Paasch F, Daubrawa M, Dieterle A, Viollet B, Wesselborg S, Proikas-Cezanne T, Stork B. AMPK-independent induction of autophagy by cytosolic Ca2+ increase. Cellular Signal 2010; 22:914-25; PMID:20114074; http://dx.doi.org/10.1016/j.cellsig.2010.01.015
- Ghislat G, Patron M, Rizzuto R, Knecht E. Withdrawal of essential amino acids increases autophagy by a pathway involving Ca2+/calmodulin-dependent kinase kinase-β (CaMKK-β). J Biol Chem 2012; 287:38625-36; PMID:23027865; http://dx.doi.org/10.1074/jbc.M112.365767
- Ganley IG, Wong PM, Gammoh N, Jiang X. Distinct autophagosomal-lysosomal fusion mechanism revealed by thapsigargin-induced autophagy arrest. Mol Cell 2011; 42:731-43; PMID:21700220; http://dx.doi.org/10.1016/j.molcel.2011.04.024
- Engedal N, Torgersen ML, Guldvik IJ, Barfeld SJ, Bakula D, Saetre F, Hagen LK, Patterson JB, Proikas-Cezanne T, Seglen PO, et al. Modulation of intracellular calcium homeostasis blocks autophagosome formation. Autophagy 2013; 9:1475-90; PMID:23970164; http://dx.doi.org/10.4161/auto.25900
- Polster BM, Basanez G, Etxebarria A, Hardwick JM, Nicholls DG. Calpain I induces cleavage and release of apoptosis-inducing factor from isolated mitochondria. J Biol Chem 2005; 280:6447-54; PMID:15590628
- Susin SA, Lorenzo HK, Zamzami N, Marzo I, Snow BE, Brothers GM, Mangion J, Jacotot E, Costantini P, Loeffler M, et al. Molecular characterization of mitochondrial apoptosis-inducing factor. Nature 1999; 397:441-6; PMID:9989411
- Dupont-Versteegden EE, Strotman BA, Gurley CM, Gaddy D, Knox M, Fluckey JD, Peterson CA. Nuclear translocation of EndoG at the initiation of disuse muscle atrophy and apoptosis is specific to myonuclei. Am J Physiol Regul Integr Comp Physiol 2006; 291:R1730-40; PMID:16873557
- Park SY, Kim HY, Lee JH, Yoon KH, Chang MS, Park SK. The age-dependent induction of apoptosis-inducing factor (AIF) in the human semitendinosus skeletal muscle. Cell Mol Biol Lett 2010; 15:1-12; PMID:19685011; http://dx.doi.org/10.2478/s11658-009-0030-4
- Marzetti E, Wohlgemuth SE, Lees HA, Chung HY, Giovannini S, Leeuwenburgh C. Age-related activation of mitochondrial caspase-independent apoptotic signaling in rat gastrocnemius muscle. Mech Ageing Dev 2008; 129:542-9; PMID:18579179; http://dx.doi.org/10.1016/j.mad.2008.05.005
- Peterson CM, Johannsen DL, Ravussin E. Skeletal muscle mitochondria and aging: a review. Journal of aging research 2012; 2012:194821; PMID:22888430; http://dx.doi.org/10.1155/2012/194821
- Russell AP, Foletta VC, Snow RJ, Wadley GD. Skeletal muscle mitochondria: a major player in exercise, health and disease. Biochim Biophys Acta 2014; 1840:1276-84; PMID:24291686; http://dx.doi.org/10.1016/j.bbagen.2013.11.016
- Demontis F, Piccirillo R, Goldberg AL, Perrimon N. Mechanisms of skeletal muscle aging: insights from drosophila and mammalian models. Dis Model Mech 2013; 6:1339-52; PMID:24092876; http://dx.doi.org/10.1242/dmm.012559
- Mu TW, Fowler DM, Kelly JW. Partial restoration of mutant enzyme homeostasis in three distinct lysosomal storage disease cell lines by altering calcium homeostasis. PLoS Biol 2008; 6:e26; PMID:18254660; http://dx.doi.org/10.1371/journal.pbio.0060026
- Ong DS, Mu TW, Palmer AE, Kelly JW. Endoplasmic reticulum Ca2+ increases enhance mutant glucocerebrosidase proteostasis. Nat Chem Biol 2010; 6:424-32; PMID:20453863; http://dx.doi.org/10.1038/nchembio.368
- Naviaux RK, Costanzi E, Haas M, Verma IM. The pCL vector system: rapid production of helper-free, high-titer, recombinant retroviruses. J Virol 1996; 70:5701-5; PMID:8764092
- Louzao MC, Espina B, Vieytes MR, Vega FV, Rubiolo JA, Baba O, Terashima T, Botana LM. "Fluorescent glycogen" formation with sensibility for in vivo and in vitro detection. Glycoconj J 2008; 25:503-10; PMID:17973187
- Raben N, Hill V, Shea L, Takikita S, Baum R, Mizushima N, Ralston E, Plotz P. Suppression of autophagy in skeletal muscle uncovers the accumulation of ubiquitinated proteins and their potential role in muscle damage in Pompe disease. Hum Mol Genet 2008; 17:3897-908; PMID:18782848; http://dx.doi.org/10.1093/hmg/ddn292
- Kirkland RA, Franklin JL. Bax affects production of reactive oxygen by the mitochondria of non-apoptotic neurons. Exp Neurol 2007; 204:458-61; PMID:17097638
- Wu JJ, Quijano C, Chen E, Liu H, Cao L, Fergusson MM, Rovira II, Gutkind S, Daniels MP, Komatsu M, et al. Mitochondrial dysfunction and oxidative stress mediate the physiological impairment induced by the disruption of autophagy. Aging (AlbanyNY) 2009; 1:425-37; PMID:20157526
- Pan X, Liu J, Nguyen T, Liu C, Sun J, Teng Y, Fergusson MM, Rovira, II, Allen M, Springer DA, et al. The physiological role of mitochondrial calcium revealed by mice lacking the mitochondrial calcium uniporter. Nat Cell Biol 2013; 15:1464-72; PMID:24212091; http://dx.doi.org/10.1038/ncb2868
- Dimauro I, Pearson T, Caporossi D, Jackson MJ. A simple protocol for the subcellular fractionation of skeletal muscle cells and tissue. BMC Res Notes 2012; 5:513; PMID:22994964; http://dx.doi.org/10.1186/1756-0500-5-513
- Gros A, Puig C, Guedan S, Rojas JJ, Alemany R, Cascallo M. Verapamil enhances the antitumoral efficacy of oncolytic adenoviruses. Mol Ther 2010; 18:903-11; PMID:20179683; http://dx.doi.org/10.1038/mt.2010.22
- Matsumura CY, Pertille A, Albuquerque TC, Santo Neto H, Marques MJ. Diltiazem and verapamil protect dystrophin-deficient muscle fibers of MDX mice from degeneration: a potential role in calcium buffering and sarcolemmal stability. Muscle Nerve 2009; 39:167-76; PMID:19145649; http://dx.doi.org/10.1002/mus.21188
- Nagalakshmi U, Waern K, Snyder M. RNA-Seq: a method for comprehensive transcriptome analysis. Current protocols in molecular biology, edited by Frederick M Ausubel [et al.] 2010; Chapter 4:Unit 44 11 1-3.
- Trapnell C, Pachter L, Salzberg SL. TopHat: discovering splice junctions with RNA-Seq. Bioinformatics 2009; 25:1105-11; PMID:19289445; http://dx.doi.org/10.1093/bioinformatics/btp120
- Sabatelli P, Palma E, Angelin A, Squarzoni S, Urciuolo A, Pellegrini C, Tiepolo T, Bonaldo P, Gualandi F, Merlini L, et al. Critical evaluation of the use of cell cultures for inclusion in clinical trials of patients affected by collagen VI myopathies. J Cell Physiol 2012; 227:2927-35; PMID:21953374; http://dx.doi.org/10.1002/jcp.23039
- Pronsato L, La Colla A, Ronda AC, Milanesi L, Boland R, Vasconsuelo A. High passage numbers induce resistance to apoptosis in C2C12 muscle cells. Biocell 2013; 37:1-9; PMID:24396996