
Abstract
CD5L (CD5 molecule-like) is a secreted glycoprotein that participates in host response to bacterial infection. CD5L influences the monocyte inflammatory response to the bacterial surface molecules lipopolysaccharide (LPS) and lipoteichoic acid (LTA) by inhibiting TNF secretion. Here we studied the intracellular events that lead to macrophage TNF inhibition by human CD5L. To accomplish this goal, we performed functional analyses with human monocytic THP1 macrophages, as well as with peripheral blood monocytes. Inhibition of phosphatidylinositol 3-kinase (PtdIns3K) reversed the inhibitory effect of CD5L on TNF secretion. Among the various PtdIns3K isoforms, our results indicated that CD5L activates PtdIns3K (whose catalytic subunit is termed PIK3C3), a key modulator involved in autophagy. Further analysis revealed a concomitant enhancement of autophagy markers such as cellular LC3-II content, increased LC3 puncta, as well as LC3-LysoTracker Red colocalization. Moreover, electron microscopy showed an increased presence of cytosolic autophagosomes in THP1 macrophages overexpressing CD5L. Besides preventing TNF secretion, CD5L also inhibited IL1B and enhanced IL10 secretion. This macrophage anti-inflammatory pattern of CD5L was reverted upon silencing of autophagy protein ATG7 by siRNA transfection. Additional siRNA experiments in THP1 macrophages indicated that the induction of autophagy mechanisms by CD5L was achieved through cell-surface scavenger receptor CD36, a multiligand receptor expressed in a wide variety of cell types. Our data represent the first evidence that CD36 is involved in autophagy and point to a significant contribution of the CD5L-CD36 axis to the induction of macrophage autophagy.
Abbreviations:
- 3-MA, 3-methyladenine
- AKT, v-akt murine thymoma viral oncogene homolog
- ALB, albumin
- ATG7, autophagy-related 7
- CD, cluster of differentiation
- CD5L, CD5 molecule-like
- FCS, fetal calf serum
- FSL1, pam2CGDPKHPKSF
- GAPDH, glyceraldehyde 3-phosphate dehydrogenase
- IL, interleukin
- MAP1LC3A/B (LC3), microtubule-associated protein 1 light chain 3 α/β
- LPS, lipopolysaccharide
- LTA, lipoteichoic acid
- MФ, macrophages
- MAPK, mitogen-activated protein kinase
- moAb, monoclonal antibody
- Pam3CSK4 (N-palmitoyl-S-[2, 3-bis(palmitoyloxy)-(2RS)-propyl]-(R)-cysteinyl-(S)-seryl-(S)-lysyl-(S)-lysyl-(S)-lysyl-(S)-lysine (Pam3CysSer[Lys]4)
- NFKB, nuclear factor of kappa light polypeptide gene enhancer in B-cells
- oxLDL, oxidized low-density lipoprotein
- PB monocytes, peripheral blood monocytes
- PBS, phosphate-buffered saline
- PI3K, phosphoinositide 3-kinase
- PIK3C3, phosphatidylinositol 3-kinase, catalytic subunit type 3
- poAb, polyclonal antibody
- PMA, phorbol 12-myristate 13-acetate
- PtdIns3K, phosphatidylinositol 3-kinase
- PtdIns3P, phosphatidylinositol 3-phosphate
- r-HsCD5L, recombinant human (Homo sapiens) CD5L
- RELA, v-rel avian reticuloendotheliosis viral oncogene homolog A
- siRNA, short interference RNA
- SRCR, scavenger receptor cysteine-rich
- TBS, tris-buffered saline
- TLRs, toll-like receptors
- TNF, tumor necrosis factor
Introduction
Inflammation is a physiological response that protects organisms from damage caused by a pathogen infection and/or tissue damage. However, tissue damage can worsen when there is failure to remove sufficient numbers of inflammatory cells or to control the expression of proinflammatory molecules at sites of inflammation.Citation1,2 Therefore, unraveling the mechanisms that regulate inflammatory reactions is crucial if we are to understand and modulate pathogenic processes.
Among the key players in inflammatory cascades are toll-like receptors (TLRs), major sensors for pathogen or host-modified molecules. Therefore, the activation and signaling of these molecules is a tightly regulated process, in which autophagy has recently been described to actively participate.Citation3,4 In fact, it has been proposed that autophagy is an effector or a regulator of many aspects of innate immunity and inflammation.Citation3,4
Under inflammatory conditions, tissue macrophages (MФ) synthesize the protein CD5L/AIM/Spalpha/API6 (CD5 molecule-like). We previously found that this protein modulates TLR activation of monocytes, thereby participating in the control of inflammatory reactions.Citation5 CD5L is a secreted 40-kDa glycoprotein that contains 3 scavenger receptor cysteine-rich (SRCR) domainsCitation6,7 and belongs to a structural family of proteins called the SRCR-super family.Citation8 CD5L is also detected in relatively high amounts in serum,Citation9-13 where it circulates associated with IgMCitation9,14 and modulates its homeostasis by contributing to autoantibody production in obesity.Citation15 Moreover, given that CD5L modulates the activity of MФ, this protein has been implicated in a wider spectrum of biological functions, including the pathogenesis of several infectious and inflammatory processes, including cancer.Citation16-22 Early results from transgenic mice overexpressing CD5L indicate that this molecule supports the survival and phagocytic activity of MФ in liver inflammatory lesions in fulminant hepatitis.Citation20 In 2 additional animal models, CD5L overexpression in myeloid-specific or alveolar type II epithelial cells induces lung adenocarcinoma in mice.Citation21,23 More recently, CD5L function has been linked to metabolic disorders subsequent to obesity. In this regard, this protein is incorporated into adipocytes, thereby modifying adipocyte lipid metabolism and thus resulting in the induction of adipocyte inflammation.Citation24,25 Interestingly, CD5L incorporation into adipocytes is mediated through scavenger receptor CD36. In fact, CD5L may also be internalized into MФ through CD36, suggesting that this scavenger receptor may serve as its cellular receptor for endocytosis.Citation24 CD5L is also involved in atherosclerosis as it facilitates MФ survival within atherosclerotic lesions.Citation22 More recently, our group has demonstrated that CD5L increases MФ foam cell formation and CD36-mediated oxidized low-density lipoprotein (oxLDL) uptake.Citation26
CD36 is an 88-kDa transmembrane glycoprotein expressed in a wide variety of cell types, such as those of the microvascular endothelium, “professional” phagocytes (including MФ, dendritic cells, and microglia) and retinal pigment epithelium, erythroid precursors, hepatocytes, adipocytes, cardiac and skeletal myocytes, and specialized epithelia of the breast, kidney, and gut.Citation27 Accumulating evidence shows that CD36 recognizes many types of ligands, including thrombospondin,Citation28 Plasmodium falciparum,Citation29,30 bacterial cell wall components,Citation31 phosphatidylserine, and oxidized phosphatidylserine that are expressed on the surface of apoptotic cells,Citation32 and oxLDL,Citation33 among others. The multivariate ligand recognition of CD36 allows it to exert several functions, depending on the cell type. Importantly, the capacity of CD36 to internalize modified lipoproteins (e.g., oxLDL), which facilitates cholesterol accumulation in MФ, links this receptor to the initiation and perpetuation of atherosclerosis.Citation27 Also, CD36 is intimately involved in the regulation of fatty acid uptake across the plasma membrane and the subsequent metabolism of this substrate.Citation34,35 Thus, it has been proposed that CD36 expression or function influences susceptibility to certain metabolic diseases, such as obesity, insulin resistance, and fatty liver disease.Citation35-37 In phagocytes, CD36 is also involved in phagocytosis and inflammation in response to pathogen aggression.Citation31,38,39 By analogy with membrane protein CD14, it has been suggested that CD36 functions as an accessory protein to present bacterial and modified host proteins to some TLRs.Citation40-44
Here we studied the intracellular events that lead to human CD5L-mediated inhibition of TLR activation in monocytes.Citation5 More specifically, we focused our attention on TNF secretion by MФ stimulated with LPS from Gram-negative bacteria and with Pam3CSK4. The latter is a synthetic lipopeptide that mimics Gram-positive bacterial lipopeptides. Our findings revealed that CD5L activates PtdIns3K through interaction with cell surface CD36, thereby inducing autophagy mechanisms in MФ. As a result of increased autophagy, subsequent MФ stimulation with LPS and Pam3CSK4 resulted in downregulated inflammatory cytokine release (TNF and IL1B) and enhanced antiinflammatory IL10 secretion. In summary, our results provide the first evidence that scavenger receptor CD36 is involved in autophagy and support the notion that the CD5L-CD36 axis makes a significant contribution to cellular autophagy induction.
Results
CD5L inhibits TLR-induced TNF mRNA synthesis and secretion
To study human CD5L function, we used 2 cellular MΦ models, namely the THP1 cell line, frequently used as a model for monocytes, and peripheral blood monocytes (PB monocytes) obtained from healthy donors. As mouse CD5L expression disappears in cultured cellsCitation19,45 and neither THP1 MФ nor PB monocytes express detectable levels of human CD5L protein,Citation26 we generated a MФ cell line that stably expresses human CD5L (THP1-HsCD5L)Citation26 and produced a new recombinant form of this protein (r-HsCD5L) with improved yield to supplement PB monocyte cultures. We then analyzed whether THP1-HsCD5L MФ transfectants and the new r-HsCD5L produced and purified in our laboratory retained the potential to inhibit the TNF response to TLR stimuli in PB monocytes. Since TLR2 heterodimerizes distinctly in response to different ligands, we tested 2 of its agonists, Pam3CSK4 (TLR1/2 agonist) and Pam2CGDPKHPKSF (FSL1 [TLR2/6 agonist]), as well as LPS as a TLR4 agonist. THP1-HsCD5L MΦ secreted lower levels of TNF than control THP1-Vector MΦ in response to TLR2 and TLR4 agonists (, left). Similar results were obtained upon addition of r-HsCD5L to PB monocytes prior to TLR stimulation (, right). Quantitative PCR analysis suggested that inhibition of TNF responses occurred at the transcriptional level, because lower levels of TNF mRNA were observed in Pam3CSK4- or LPS -stimulated MΦ when CD5L was present (). It has been reported that TLR2 and TLR4 undergo internalization upon ligand binding,Citation41,46 which results in a transient decrease in surface expression. Therefore, we questioned whether CD5L-induced differences in the response to Pam3CSK4 and LPS were due to modulation of the cell surface availability of their receptors. Flow cytometric analysis indicated that the expression of CD5L in THP1 MΦ or its addition to PB monocyte cultures did not modify TLR2 or TLR4 surface expression levels (Fig. S1). We also observed a decrease in surface expression of receptors 2 h after Pam3CSK4 or LPS addition, both in THP1-Vector MФ (70.5% ± 10.4 and 13.6% ± 3.3 reduction for TLR2 and TLR4, respectively) and PB monocytes (11.4% ± 2.1 and 8.9% ± 3.6 reduction for TLR2 and TLR4, respectively). This decrease was not altered by CD5L. Overall, these data suggest that the inhibition of TNF secretion by CD5L is not caused by a change in TLR2 and TLR4 surface expression or in ligand-dependent internalization, but rather by modified intracellular signaling.
Figure 1. CD5L inhibition of TLR-induced TNF secretion is concomitant with a decrease in mRNA transcription. (Left) PMA-differentiated THP1-Vector (white boxes) and THP1-HsCD5L (black boxes) MФ and (Right) PB monocytes incubated for 24 h with 1 μg/ml albumin (ALB) as control protein (white-dotted boxes) or 1 μg/ml r-HsCD5L (black-dotted boxes) were (A) stimulated for 4 h with the indicated doses (ng/ml) of TLR agonists Pam3CSK4 (Pam3), Synthetic diacylated lipoprotein (FSL1), or lipopolysaccharide (LPS). Culture supernatant fractions were collected, and the amount of TNF was measured by ELISA. *P ≤ 0.05; **P ≤ 0.01; ***P ≤ 0.001 2-way ANOVA (B) incubated with 100 ng/ml LPS or Pam3CSK4 (Pam3) for 1 h, and the amount of mRNA encoding TNF was measured by qPCR (data show mean fold change relative to untreated THP1-Vector ± SEM). Data show the mean values ± SEM from 3 independent experiments (for THP1 MФ) or PB monocytes obtained from 3 healthy donors. M are untreated cells (left in culture medium).
CD5L inhibits RELA phoshorylation and nuclear translocation in MФ
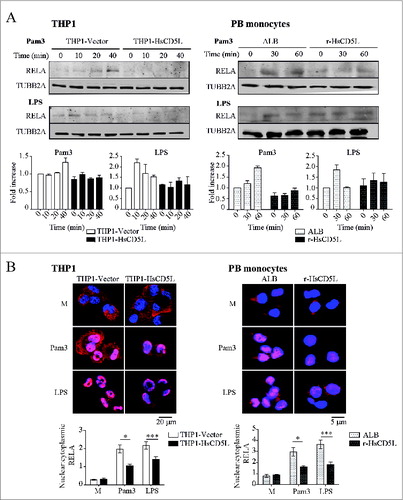
Given that TNF transcription is primarily controlled by the transcription factor NFKB, we next assessed phosphorylation of RELA/p65, a subunit of the NFKB complex, (). Western blot analysis of cell lysates showed lower levels of phosphorylated RELA (Ser536) in Pam3CSK4- or LPS-treated THP1-HsCD5L MΦ than in control THP1-Vector MΦ. Likewise, addition of r-HsCD5L to PB monocytes prior to TLR stimulation lowered phospho- RELA levels in these cells. In accordance, a series of immunofluorescence analyses showed that CD5L reduced the nuclear:cytoplasmic ratio of the RELA subunit of the NFKB complex (). Taken together, these data suggest that presence of CD5L lowers activation of this transcription factor in MФ.
Figure 2 (See previous page). CD5L inhibits RELA phosphorylation and subsequent nuclear translocation. (Left) PMA-differentiated THP1-Vector (white boxes) and THP1-HsCD5L (black boxes) MФ and (Right) PB monocytes incubated for 24 h with 1 μg/ml albumin (ALB) as control protein (white-dotted boxes) or 1 μg/ml r-HsCD5L (black-dotted boxes) were (A) stimulated for the indicated times with 1 μg/ml of Pam3CSK4 or LPS, lysed, and probed in western blot with an antibody specific to phosphorylated RELA (Ser536) and TUBB2A. Upper panel: Western blot images of a single experiment. Lower panel: mean of protein signal intensities ± SEM of 3 independent experiments (for THP1 MФ) or PB monocytes obtained from 3 healthy donors. Fold increase is relative to THP1-Vector MФ or ALB-PB monocytes at time 0 after normalization with the loading control protein TUBB2A. (B) Cells were stimulated with 1 μg/ml Pam3CSK4 (Pam3) or LPS for 1 h. Cells were fixed, and the RELA subunit of the NFKB complex was stained with a specific antibody (green) and nuclei with Hoechst dye (blue). Upper panel: representative confocal microscopy images of THP1 MФ (left) and PB monocytes (right). Lower panel: mean nuclear vs. cytoplasmic RELA fluorescence intensity ratio values ± SEM in more than 200 cells scored in random fields, from 3 independent experiments (for THP1 MФ) or PB monocytes obtained from 3 healthy donors *P ≤ 0.05; ***P ≤ 0.001, one-way ANOVA. M are untreated cells (left in culture medium).
Inhibition of TNF secretion by CD5L occurs via the PtdIns3K catalytic subunit PIK3C3
We next examined the intracellular signaling mechanisms involved in TLR regulation by CD5L. As an initial approach, we analyzed the mitogen-activated protein kinase (MAPK) signaling cascade, because it plays a key role in regulating TLR activation.Citation47 Our results showed that the addition of pharmacological MAPK blockers did not alter the inhibitory effect of CD5L on TNF secretion (Fig. S2A). Moreover, time-course determination of MAPK phosphorylation by western blot assays on total Pam3CSK4- or LPS-stimulated THP1 MФ lysates confirmed these data. The activation of Pam3CSK4- and LPS-induced MAPK11/12/13/14 (p38β/γ/δ/α), MAPK8/9 (JNK1/2), and MAPK1/3 (ERK2/1) in CD5L-expressing cells was similar to that in control cells (Fig. S2B).
We then tested whether CD5L modulates the activation of PtdIns3K -pathway, because this pathway is important in regulating the inflammatory response of MФ.Citation47 The PtdIns3K superfamily comprises a large family of structurally related heterodimeric enzymes. These molecules are formed by a catalytic subunit and a regulatory or accessory subunit,Citation48 with differing phosphatidylinositol substrate requirements and modes of regulation,Citation48,49 class I and class III being the best known PI3K/PtdIns3K isoforms involved in the control of inflammation.Citation50 To determine which of these isoforms is preferentially activated by CD5L, we stimulated THP1 MΦ with Pam3CSK4 or LPS for 4 h in the presence of the following inhibitors: Pi-104 which targets the subunits of class I phosphoinositide 3-kinase (PI3K) PIK3CA/p110α, PIK3CB/p110β, PIK3CD/p110δ and PIK3CG/p110γ; IC87114, targeting class IA PI3K PIK3CD/p110δ; and the pan-PI3K/PtdIns3K inhibitors 3-methyladenine (3-MA), wortmannin or LY294002. Subsequently, we analyzed TNF production by ELISA. Interestingly, when pan-PtdIns3K was inhibited, similar concentrations of TNF were detected in TLR-stimulated THP1-HsCD5L MΦ as in control cells (, Upper graphs). These data indicate that PtdIns3K repression reverted the inhibitory effect of CD5L over TNF secretion. Of note, of the 2 classes of PI3K/PtdIns3K molecules assayed, only by blocking PIK3C3, the catalytic subunit of the class III PtdIns3K, was TNF inhibition by CD5L abolished. Similar results were obtained in Pam3CSK4- and LPS-stimulated PB monocytes (, Lower graphs).
Figure 3. CD5L increases class III PtdIns3K. (A) THP1 MФ (top) and PB monocytes (bottom) preincubated with 1 μg/ml r-HsCD5L or ALB for 24 h were treated for 45 min with PtdIns3K inhibitors at the following concentrations: 1 μM Pi-103 (Pi-103, PI3K/p110α, β, γ, δ inhibitor), 1 μM IC87114 (IC, PI3K/p110δ inhibitor), 0.1 mM 3-MA (3-MA, PI3K/PtdIns3K inhibitor), 200 μM LY294002 (Ly, pan-PI3K/PtdIns3K inhibitor), 10 μM wortmannin (W, pan-PI3K/PtdIns3K inhibitor), or with DMSO as control. Cells were then incubated for 4 h with 100 ng/ml Pam3CSK4 or 100 ng/ml LPS, and culture supernatant fractions were collected and assayed for TNF production by ELISA. Mean values ± SEM from 4 independent experiments (for THP1 MФ) or PB monocytes obtained from 3 healthy donors performed in triplicate are shown. *P ≤ 0.05; **P ≤ 0.01; ***P ≤ 0.001 Student t test. (B) To assay PtdIns3P cellular content, THP1 MФ (left) and PB monocytes (right) preincubated with 1 μg/ml r-HsCD5L or ALB for 24 h were treated for 45 min with 0.1 mM 3-MA (3-MA) or DMSO as control, and then incubated with 1 μg/ml Pam3CSK4 for 30 min when indicated. PtdIns3P was stained with a specific antibody (green) and nuclei with Hoechst dye (blue). Upper panel: representative confocal microscopy images of THP1 MФ (left) and PB monocytes (right). Lower panel: mean PtdIns3P fluorescence intensity values ± SEM in more than 20 cells from independent experiments scored in random fields. *P ≤ 0.05; ***P ≤ 0.001, one-way ANOVA.
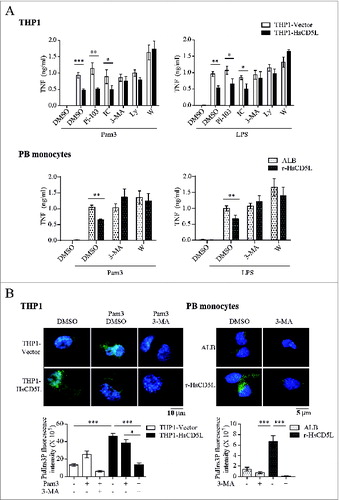
PIK3C3 phosphorylates phosphatidylinositol to generate phosphatidylinositol 3-phosphate (PtdIns3P), a key phospholipid for membrane trafficking.Citation51 Using fluorescence microscopy and a PtdIns3P-specific antibody, we found that the cellular content of PtdIns3P increased slightly in THP1-Vector MΦ after Pam3CSK4 stimulation (, left). Interestingly, already without TLR stimulation, THP1-HsCD5L-expressing MΦ triplicated their PtdIns3P levels as compared to control cells. Likewise, r-HsCD5L enhanced PtdIns3P levels in PB monocytes as compared to control ALB without the need for LPS or Pam3CSK4 addition (, right). The addition of the PI3K/PtdIns3K inhibitor 3-MA largely abolished PtdIns3P staining in both cell types, suggesting a possible contribution of PIK3C3 to CD5L-enhanced PtdIns3P levels.
CD5L increases the levels of markers of autophagy and autophagy flux in macrophages
PIK3C3, the catalytic subunit of the class III PtdIns3K, plays a key role in autophagy induction.Citation52 Moreover, our previous results indicate that CD5L promotes autophagy in THP1 MФ upon M. tuberculosis infection.Citation53 Here we further analyzed the effects of CD5L on the induction of MФ autophagy by bacterial Pam3CSK4 and LPS, given that these products have been described to induce autophagy.Citation54 THP1 MФ and PB monocytes were examined for the microtubule-associated protein 1 light chain 3 A/B (LC3)-II/LC3-I ratio as an autophagy marker in western blot of total cell lysates (). AKT1/2/3 (Ser473) phosphorylation status was also examined because it increases in response to TLR activation and acts as a negative regulator of autophagy.Citation48 Pam3CSK4 stimulation increased the LC3-II/LC3-I ratio and also AKT phosphorylation (Ser473) in THP1-Vector MΦ. Most importantly, THP1-HsCD5L MΦ showed an enhanced LC3-II/LC3-I ratio, even under no stimulation (, left). In contrast, AKT phosphorylation was markedly lower in these cells as compared to THP1-Vector MΦ. Noteworthy, total AKT protein was similar in both cell types, suggesting no differences in AKT content. Similar results were obtained in PB monocytes incubated with r-HsCD5L vs. control ALB (, right).
Figure 4 (See previous page). CD5L promotes macrophage autophagy. (A) THP1 MФ (left) and PB monocytes (right) preincubated with 1 μg/ml r-HsCD5L or ALB for 24 h were stimulated with 0.5 μg/ml Pam3CSK4 for the indicated times, lysed, and probed in western blots with specific antibodies. Upper panel: Western blot images of a single experiment. Lower panel: mean of protein signal intensities ± SEM of 3 independent experiments. Fold increase is relative to untreated THP1-Vector MФ (left) and untreated PB monocytes (right) after normalization to the control protein TUBB2A. LC3 protein signal intensities were plotted as LC3-II/LC3-I ratio. (B) To determine autophagy flux, THP1 MФ (left) and PB monocytes (right) preincubated with 1 μg/ml r-HsCD5L or ALB for 24 h were treated for 45 min with autophagy inhibitor 3-MA (3-MA, 0.1 mM), or with DMSO used as a control. LC3 was then stained with a specific antibody (green), acidic organelles with LysoTracker Red (red), and nuclei with Hoechst dye (blue). Upper panel: representative confocal microscopy images showing LC3 and LysoTracker Red staining and colocalization (Merged). Lower Panel: mean ± SEM quantitative data showing LC3 puncta per cell (LC3+ puncta per cell) and LC3-LysoTracker Red colocalized puncta per cell (LC3+ LT+ puncta per cell) in 3 independent experiments (for THP1 MФ) or 3 blood donors, including at least 50 cells scored in random fields. (C) (Left) Western blot analysis of ATG7 protein silencing in THP1-HsCD5L MФ after transfection of a siRNA targeting ATG7 (ATG7) or a nontargeting negative control (Ct). Detection of TUBB2A was used as a measure of equal loading. Silenced MФ were then stained for LC3, LysoTracker Red and nuclear detection as in B). (Right) Graphs depict mean ± SEM quantitative data showing LC3 puncta per cell (LC3+ puncta per cell) and LC3-LysoTracker Red colocalized puncta per cell (LC3+ LT+ puncta per cell) in 3 independent experiments, including at least 200 cells scored in random fields. *P ≤ 0.05; **P ≤ 0.01; ***P ≤ 0.001, one-way ANOVA.
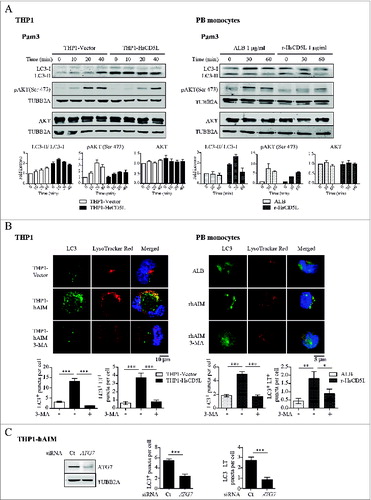
We next quantified autophagosome formation and autophagy flux by analyzing the amount of LC3 puncta per cell and the colocalization of LC3 puncta with acidic organelles, respectivelyCitation55 (). For this purpose, cells were stained with an antibody against LC3 and also with LysoTracker Red, an acidotropic fluorescent dye that accumulates in acidic organelles. Even in the absence of Pam3CSK4 or LPS, THP1-HsCD5L cells almost quadruplicated the number of LC3 puncta per cell vs. THP1-Vector MΦ (13.27 ± 1.33 vs. 3.10 ± 0.33, P < 0.0001 Student t test). Furthermore, a 6-fold increase in LC3-LysoTracker Red double-positive puncta as compared to THP1-Vector MΦ (3.77 ± 0.55 vs. 0.61 ± 0.19, P < 0.0001 Student t test) was observed ( left). Accordingly, incubation of PB monocytes with r-HsCD5L almost triplicated LC3 punta formation (4.90 ± 0.39 vs. 1.82 ± 0.18, P < 0.0001 Student t test) and quadruplicated LysoTracker Red colocalization (1.80 ± 0.41 vs. 0.44 ± 0.16; P 0.0007 Student t test) as compared to incubation with the control protein ALB ( right). Interestingly, addition of the PI3K/PtdIns3K inhibitor 3-MA, widely used as an autophagy blocker, inhibited all these effects. To reinforce these data, we performed experiments aimed at silencing the protein ATG7, an integral component of the cellular autophagy machinery.Citation56 SiRNA transfection targeting ATG7 lowered its expression in THP1-HsCD5L MΦ (, left), with a concomitant decrease in LC3 puncta formation and LC3-LysoTracker Red double-positive puncta in these cells, when compared to control, nontargeting siRNA ( right). Taken together, these data further support the notion that CD5L contributes to MΦ autophagy.
CD5L expression induces double-membrane vesicle formation in THP1 MФ
To further confirm that the process detected was indeed autophagy, we studied the formation of ribosome-free, smooth double membrane vesicles in THP1 MΦ.Citation55 The ultrastructural analysis of 25 sections/cell line using electron microscopy revealed the presence of one to 4 of these typical autophagosomal double-membrane vesicles in the cytoplasm of THP1-HsCD5L MΦ (). The vesicles were absent from the control THP1-Vector MΦ.
Figure 5. Assessment of autophagy induction by CD5L by ultrastructural imaging. Electron microscopy of THP1 MФ. A representative image of 25 sections/cell line is shown (30,000 × magnification). Arrows and enlarged areas (1.5 × magnification) indicate autophagic organelles.
CD5L inhibits IL1B and enhances IL10 secretion, but does not have the same effect on their mRNA transcription
To obtain a wider view of the immunomodulatory capacity of CD5L, we tested whether it modulated Pam3CSK4- or LPS-induced secretion of other cytokines, namely IL1B, IL6, and IL10. For this purpose, we analyzed the production of these cytokines, in supernatant fractions of PB monocytes 24 h after TLR stimulation (). In these experiments TNF was also analyzed as a positive control (data not shown). The addition of r-HsCD5L did not induce the release of any of these cytokines when compared to control ALB, thereby suggesting that CD5L is not involved in the secretion of these cytokines in the absence of other stimuli. Upon Pam3CSK4 or LPS stimulation, however, the presence of r-HsCD5L lowered IL1B secretion and enhanced IL10 levels, while no effect was observed on IL6 secretion, as compared to the control ALB. Given that autophagy is known to suppress IL1B maturation rather than its mRNA transcription,Citation57 we analyzed the mRNA content of this cytokine in TLR- activated PB monocytes by real-time PCR (). The addition of r-HsCD5L to PB monocytes did not apparently modify the mRNA levels of IL1B, thus reinforcing the notion that CD5L modulates the secretion of this cytokine post-transcriptionally. Similarly, addition of r-HsCD5L to PB monocytes did not affect IL6 or IL10 mRNA levels in response to TLR ligands (). Similar real-time PCR results were obtained when we compared mRNA levels in THP1-HsCD5L MΦ to those of THP1-Vector MΦ (data not shown).
Figure 6. CD5L inhibits IL1B and enhances IL10 protein secretion, both effects being reversed upon silencing of ATG7 expression. (A and B) PB monocytes incubated with 1 μg/ml ALB or r-HsCD5L for 24 h and 100 ng/ml Pam3CSK4 (Pam3) or LPS were added to the cultures. (A) TLR agonists were incubated for 24 h, and the amount of IL1B, IL6 and IL10 was analyzed by multiplex cytokine assay. (B) TLR agonists were incubated for 6 h and the levels of mRNA encoding IL1B, IL6 and IL10 were analyzed by real-time RT-PCR. Mean values ± SEM from 3 blood donors performed in duplicate are shown. *P ≤ 0.05; Student t test. (C) THP1-HsCD5L cells were transfected with siRNA targeting ATG7 or a nontargeting negative control (Ct), and stimulated with TLR agonists (100 ng/ml) for 4 h (for TNF detection) and 24 h (for IL1B and IL10 detection). Cytokine production in the supernatant fraction was quantified by ELISA. Mean values ± SEM of 4 experiments performed in triplicate are shown. *P ≤ 0.05; t test.
To reinforce the notion that CD5L-modulated cytokine release was due to enhanced autophagy, 2 sets of experiments were performed. First, we observed that r-HsCD5L-induced modulation of IL1B and IL10 protein secretion in PB monocytes did not occur when PtdIns3K phosphorylation was blocked by addition of wortmannin (data not shown). More relevantly, blockade of ATG7 expression in THP1-HsCD5L cells enhanced TNF and IL1B while lowering IL10 secretion in response to TLR induction, reverting thus the modulatory effect of CD5L (). These findings suggest that CD5L downregulates inflammatory responses to Pam3CSK4 and LPS and that this effect is mediated, at least in part, by enhancing autophagy.
CD36 silencing abolishes CD5L-induced autophagy and its modulation of inflammatory cytokine secretion
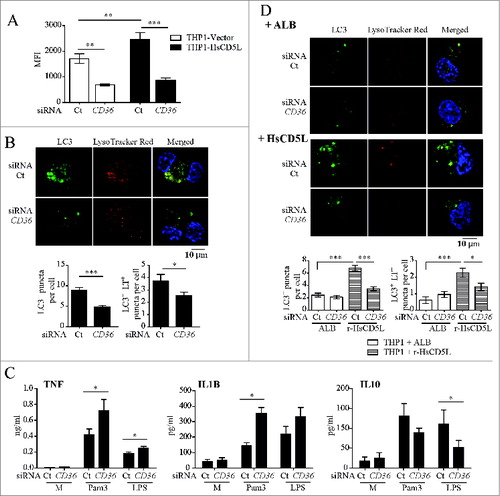
CD5L colocalizes with scavenger receptor CD36 on the cell surfaceCitation24 and mediates MФ uptake of oxLDL through CD36.Citation26 Consequently, we next tested whether CD36 is the receptor that mediates CD5L induction of MФ autophagy (). Flow cytometry analysis of THP1 cells revealed that transfection of a pool of 4 siRNAs targeting CD36 silenced its expression in THP1 MΦ by ∼60% as compared with transfection of the negative control, a pool of 4 nontargeting siRNAs (). Of note, microscopy analysis of CD36-silenced THP1-HsCD5L MФ compared with THP1-HsCD5L ones treated with nontargeting siRNA showed a reduction in LC3 puncta per cell and in LC3-LysoTracker Red double-positive puncta by 45% (8.95 ± 0.62 vs. 4.82 ± 0.34 P < 0.0001 Student t test) and 30% (3.71 ± 0.5 vs. 2.49 ± 0.3 P = 0.032 Student t test), respectively (). We then studied whether modulation of cytokine secretion by CD5L was mediated through CD36. CD36 was silenced in THP1-HsCD5L MФ prior to TLR stimulation, and the amount of TNF, IL1B, and IL10 in cell supernatants was measured by ELISA. CD36 silencing in THP1-HsCD5L MФ increased TNF and IL1B release and decreased IL10 production in response to TLR activation as compared to control siRNA-treated MФ (). We next addressed whether CD36-dependent CD5L-triggered autophagy was induced by exogenous addition of r-HsCD5L to THP1-Vector MΦ. With this goal, we incubated THP1-Vector MΦ with r-HsCD5L or ALB for 24 h and determined autophagosome formation and autophagy flux (). Low levels of LC3 puncta formation as well as LC3-LysoTracker Red colocalization were observed in ALB-incubated cells, which were not affected by CD36 silencing. In contrast, r-HsCD5L addition triplicated the number of LC3 puncta per cell (6.81 ± 0.46 r-HsCD5L vs. 2.41 ± 0.31 ALB, P < 0.0001 Student t test) and that of LC3-LysoTracker Red double-positive puncta (2.26 ± 0.26 vs. 0.61 ± 0.19, P < 0.0001 Student t test) in cells treated with nontargeting control siRNA. The effect of r-HsCD5L was reduced upon inhibition of CD36 expression by siRNA treatment in terms of LC3 puncta formation (6.81 ± 0.46 siRNA control vs. 3.46 ± 0.30 siRNA CD36; P < 0.0001) and LC3-LysoTracker Red colocalization (2.26 ± 0.26 siRNA control vs. 1.4 ± 0.22 siRNA CD36, P = 0.0164). These results suggest that MФ autophagy is induced by exogenous r-HsCD5L addition to CD36-positive cells not expressing CD5L. All together, our findings indicate that CD36 is the receptor that mediates CD5L-induced autophagy and subsequent CD5L-regulated TNF, IL1B, and IL10 secretion.
Figure 7. CD36 silencing reduces CD5L-induced autophagy and reverts CD5L-regulated cytokine secretion in THP1 MФ. Cells were transfected with siRNA targeting CD36 or a nontargeting negative control (Ct). (A) CD36 surface expression was analyzed by flow cytometry with a specific antibody. Graph showing the mean results of 4 independent experiments. MFI, mean fluorescence intensity. (B) Autophagy flux was assessed upon CD36 silencing in THP1-HsCD5L MФ. Upper panels: representative confocal microscopy images showing staining of LC3 with a specific antibody (green), acidic organelles with LysoTracker Red (red), nuclei with Hoechst dye (blue), and colocalization (Merged). Lower panels: mean ± SEM quantitative data show LC3 puncta per cell (LC3+ puncta per cell) and LC3-LysoTracker Red colocalized punta per cell (LC3+ LT+ puncta per cell) in 3 independent experiments including at least 50 cells scored in random fields. (C) SiRNA-treated THP1-HsCD5L MФ were stimulated for 24 h with 100 ng/ml Pam3CSK4 or LPS, culture supernatant fractions were collected, and the amount of TNF, IL1B, and IL10 was measured by ELISA. Mean values ± SEM from 3 independent assays performed in triplicate are shown. (D) Autophagy flux was assessed in CD36-silenced THP1-Vector MФ after incubation with 1 μg/ml r-HsCD5L or 1 μg/ml ALB for 24 h. The analysis was performed by confocal microscopy as in B). *P ≤ 0.05; **P ≤ 0.01; ***P ≤ 0.001, Student t test.
Discussion
Here we report on a novel role for CD5L in the regulation of MΦ homeostasis, showing that this protein activates autophagy in this cell type through the CD36 receptor. Consequently, CD5L prevents TLR-induced TNF and IL1B secretion, with a concomitant increase in IL10 levels, thereby downregulating the MΦ inflammatory reaction. Our findings are of relevance because inflammation can lead to excessive self-aggression and pathology when not finely regulated.
To study the regulation of MΦ TLR responses by CD5L, the amount TNF in the cell culture supernatant was taken as an indirect measure of CD5L activity. In this regard, a series of experiments were performed to modulate the intracellular pathways in such a way to revert the inhibitory effects of CD5L over TNF production. To induce MΦ TNF secretion, we chose the TLR agonists Pam3CSK4 and LPS as they are established TLR2/1 and TLR4 activators. In initial experiments, stable expression of CD5L in THP1 MΦ and our newly generated r-HsCD5L inhibited TLR-induced TNF, as we previously reported.Citation5 These results suggest that CD5L expression in the THP1 cell line and r-HsCD5L are adequate tools by which to study CD5L modulation of MФ inflammatory responses.
We next sought to determine whether the lowered TNF response promoted by CD5L is due to modulation of TLR surface expression and/or internalization. We focused on this issue because TLRs undergo internalization upon ligand binding and this permits signaling from endosomal compartments and the generation of distinct outcomes.Citation58 In our hands, cytometry-staining experiments showed that CD5L induced no change in TLR2 or 4 levels at the cell surface, thus discarding the participation of this protein in the regulation of the availability of these receptors at the cell surface.
To decipher the intracellular events modulated by CD5L, we analyzed 2 signaling pathways relevant for TLR signaling, namely the MAPK and PtdIns3K pathways.Citation47 The MAPK and PtdIns3K signaling inhibitors were expected to revert the inhibitory effects of CD5L over TNF production. Data on MAPK pharmacological inhibition, supported by western blot analysis of cell lysates, suggested that MAPK activity is crucial for TLR signaling.Citation47 Of relevance for our studies, the data showed that CD5L does not modulate TLR2- or TLR4-induced MAPK activation in MФ.
On the contrary, our results from PtdIns3K pharmacological inhibition experiments suggested that CD5L triggers PtdIns3K activation. This notion is supported by the observation that lower TNF levels induced in the presence of CD5L were restored by wortmannin and LY294002, 2 synthetic pan-PI3K/PtdIns3K inhibitors. Our results are in accordance with the anti-inflammatory role of PtdIns3K.Citation50
Analysis of the PtdIns3K isoform that participates in the CD5L modulation of TNF secretion indicated that this was preferentially the PIK3C3 pathway. These results are of relevance because PIK3C3 is linked to the activation of autophagy,Citation48 and, in fact, autophagosome formation is blocked in its absence.Citation52 In support of the pharmacological inhibitor data that suggest that CD5L activates PIK3C3, we found that CD5L increased the cellular content of its metabolic product, PtdIns3P, in both THP1 MΦ and PB monocytes. Interestingly, this enhancement occurred without the addition of LPS or Pam3CSK4. PtdIns3P may also be produced via PIK3C3-independent mechanisms, including dephosphorylation of PtdIns(3,4,5)P3 by PtdIns 5-phosphatases and 4-phosphataseCitation59 or through class II PI3K molecules that also contribute to PtdIns3P synthesis.Citation60 However, our data suggest that CD5L preferentially enhances PtdIns3P levels through PIK3C3, since the signal was abrogated in the presence of the PI3K/PIK3C3 inhibitor 3-MA.
Our previous results in an in vitro model of M. tuberculosis infection indicated that CD5L promotes MΦ mycobactericidal activity by enhancing autophagy mechanisms, such as autophagosome formation, as well as acidification of mycobacterial-containing phagosomes.Citation53 Together, these data point to the participation of CD5L in promoting autophagy. In accordance, CD5L enhanced the LC3-II/-I ratio and downmodulated AKT (Ser473) phosphorylation in both THP1 MΦ and PB monocytes. Our data support the notion that AKT is a negative regulator of autophagy.Citation48 Moreover, given that AKT is phosphorylated by class I PI3K, our western blot data are consistent with the results on pharmacological inhibition of class I PI3K, which did not affect CD5L-mediated inhibition of TNF.
Further examination of autophagy markers reinforced the notion that CD5L induces autophagy in MΦ. In this regard, in both THP1 MФ and PB monocytes, CD5L increased LC3 puncta and LC3-LysoTracker Red-positive puncta per cell, and these effects were inhibited by the addition of 3-MA, the specific autophagy blocker. Likewise, silencing of ATG7, a key component of the autophagy signaling network, lowered LC3 puncta and LC3-LysoTracker Red-positive puncta per cell in THP1-HsCD5L MΦ. Furthermore, the elevated number of autophagosomes observed in THP1-HsCD5L cells by electron microscopy reinforces the notion that CD5L activates autophagy mechanisms in MΦ.
Modulation of cytokine responses by CD5L was not restricted to TNF. Lowered IL1B and enhanced IL10 protein secretion suggest a broader anti-inflammatory role of CD5L in MΦ. However, CD5L may target a specific subset of cytokines since it did not modify IL6 protein levels. Accordingly, in a previous study we observed that the chemokine IL8 was enhanced by CD5L expression in THP1 MФ.Citation53 Further research is underway to analyze the modulation of MΦ chemokine/cytokine production by CD5L. Of relevance for the present study, CD5L modulation of TNF, IL1B, and IL10 were reverted by silencing of the ATG7 protein. Moreover, we found that CD5L inhibited TLR-induced IL1B secretion but did not apparently modify mRNA synthesis of this molecule, suggesting a post-translational effect in the processing of the IL1B protein. Because it is well known that autophagy inhibits the maturation of IL1B protein rather than its mRNA synthesis,Citation61 these data reinforce the concept that CD5L activates autophagy. Similarly, CD5L enhanced IL10 protein secretion but did not alter IL10 mRNA levels upon TLR activation, which may suggest that autophagy also participates in IL10 protein processing in MФ.
Given that CD5L is a secreted protein, we next sought to determine the cellular receptor that mediates CD5L induction of autophagy in MΦ. We analyzed the CD36 receptor because of previous evidence that links the activity of these 2 molecules.Citation24,26 Flow cytometry analysis showed that CD5L induced higher MΦ cell surface expression of CD36, as previously observed.Citation26 Interestingly, in THP1-Vector MΦ, silencing of CD36 alone did not alter autophagy markers, which were almost absent, suggesting that this receptor does not modulate autophagy in basal conditions. In contrast, the reduction in CD36 cell surface receptor availability in CD5L-expressing MΦ lowered CD5L-induced LC3 puncta formation and LC3-LysoTracker Red colocalization. Our data from the CD36 silencing experiments further indicate that this receptor is involved in the anti-inflammatory mechanisms mediated by CD5L (i.e., enhanced TNF and IL1B, and lowered IL10 secretion). Interestingly, the addition of r-HsCD5L to non-CD5L-expressing MФ yielded similar results. Therefore, taken together, our data suggest that CD5L modulation of TLR activation occurs by enhancement of autophagy through CD36. The lack of an evident decrease in LC3 puncta/LC3-LT+ in THP1-Vector MΦ with silenced CD36 expression points to a role for CD5L in increasing PIK3C3 signaling directly, rather than indirectly by increasing CD36 levels. However, given that the levels of the autophagy markers were very low in these cells, these data are not conclusive and further experiments are needed to solve this issue.
In contrast to our results, cd36 knockout mouse macrophages have not shown an elevated reactivity to TLR ligands in other studies.Citation31,44 These assays were performed under culture conditions where CD5L expression has been shown to disappear.Citation19 The lack of CD5L expression may therefore explain the observed differences on CD36 function.
In mouse models and in humans, elevated levels of CD5L occur in conditions with inflammatory components such as LPS-induced fulminant hepatitisCitation20, M. tuberculosis infection,Citation53 obesity,Citation25 liver cirrhosis,Citation12,13,62 and allergic asthma,Citation63 among others. Therefore, in these scenarios, high expression of CD5L may act in an autocrine fashion on MΦ to modulate inflammatory responses. Moreover, functional studies in the mouse have associated CD36 and CD5L with the pathogenesis of several infectious and inflammatory diseases in which MΦ play a central role. However, only in 2 settings have both proteins been found to act in concert. In the first, atherosclerosis, CD5L mediates oxLDL uptake by CD36 on MΦ,Citation26 and in the second, obesity, CD5L is internalized into adipocytes through CD36, where it interacts with cytosolic FASN (fatty acid synthase) thereby reducing its activity.Citation24 Given that autophagy regulates lipid metabolism and is implicated in adipose tissue biology,Citation64 we hypothesize that CD5L could also play a role in adipocyte biology, namely by enhancing autophagy in these cells.
Our data now suggest a third functional connection, the activation of autophagy in MΦ and subsequent inhibition of a subset of TLR agonists. Given that CD36 is a multiligand receptor that cooperates with TLR receptor signaling, our results raise the possibility that CD5L also interferes with TLR ligand recognition.
In summary, our results provide new findings on CD5L that are highly relevant for our knowledge of MΦ homeostasis. Furthermore, they reveal a new function for the CD36 receptor as an inducer of MΦ autophagy through CD5L. Our results open up a new perspective of the role of the CD5L-CD36 axis in cellular homeostasis that could be associated with the pathogenesis of those serious inflammatory conditions in which these proteins are involved.
Materials and Methods
Reagents
Phosphate-buffered saline (PBS) was composed of 150 mM NaCl (Sigma-Aldrich, S5886), 8 mM Na2HPO4 (MERK, 10039–32–4), 1.5 mM NaH2PO4 (MERK, 13472–35–0), pH 7.4; Tris-buffered saline (TBS) was composed of 140 mM NaCl, 50 mM Tris-HCl (VWR, 28811.295), pH 7.4. Blocking buffer for flow cytometry studies was PBS containing 10% human AB serum (Sigma-Aldrich, H4522), 2% fetal calf serum (FCS; Lonza, DE14–801F), and 0.02% NaN3 (Sigma-Aldrich, S2002). TBS lysis buffer was 20 mM Tris, pH 7.5, containing 150 mM NaCl, 1 mM EDTA (EDS), 1 mM EGTA (E3889), 1% Triton X-100 (X100), 1 mM Na3VO4 (S6508), 1 mM PMSF (P7627), and complete protease inhibitor cocktail (P8340), all from Sigma-Aldrich.
Cells and cell lines
The generation of stably transfected THP1-Vector and THP1-HsCD5L cell lines was described in Amézaga et al.Citation26 Cells were grown in culture medium (RPMI-1640 2 mM glutamine [Lonza, BE12–702F], 100 U/mL penicillin, and 100 μg/mL streptomycin [Sigma-Aldrich, P0781] supplemented with 10% heat-inactivated FCS [Lonza, DE14–840E] and 250 μg/mL geneticin [Gibco, 11811031]). Prior to the experiments, cells were differentiated to macrophages (MФ) by incubation with 10 ng/mL of phorbol 12-myristate 13-acetate (PMA; Sigma-Aldrich, P8139) in culture medium for 48 h. They were then washed with PBS and grown in culture medium for 24 h before experiments were performed. These cells are referred to as THP1 MФ.
Buffy coats, provided by the Blood and Tissue Bank (Barcelona, Spain), were obtained from healthy blood donors following the institutional standard operating procedures for blood donation and processing. Peripheral blood mononuclear cells were isolated by Ficoll-Paque (GE Healthcare, 17–1440) density gradient centrifugation at 400 × g for 25 min, and CD3+ cells were depleted by RosetteSep human CD3 depletion cocktail (StemCell Technologies, 15621). Recovered cells were washed twice in PBS and counted using Perfect-Count microspheres (Cytognos, CYT-PCM), following the manufacturer's instructions. Peripheral blood monocytes (PB monocytes) were obtained by positive selection using human CD14 MicroBeads and autoMACS columns (Miltenyi Biotec, 130–050–201/ 130–021–101).Citation26 To assess the effect of human (Homo sapiens CD5L) (hsCD5L) on PB monocytes, these cells were incubated for 24 h in culture medium with 1 μg/ml albumin purified from human plasma (ALB), used as control protein (Grifols, 670612.1), or 1 μg/ml endotoxin-free recombinant CD5L (r-HsCD5L) (<1.0 EU per 1 μg of the protein by the LAL method). In these experiments, r-HsCD5L was from 2 sources; an affinity purified His-tagged r-HsCD5L produced in the mouse myeloma cell line NS0 (R&D systems, 2797) and an in-house produced r-HsCD5L expressed in Chinese Hamster Ovary cells, as detailed below.
Production of recombinant human CD5L
The cDNA of human CD5L (hsCD5L) was obtained by gene synthesis (GenScript) following NCBI reference sequence NP_005885.1, with a modification in which the immunoglobulin g chain signal peptide replaced that of CD5L. The cDNA was cloned into the p.evi vector and transiently transfected into CHO K1 cells using the eviFect system (Evitria AG). Cells were grown in eviMake, a chemically defined, serum-free, animal component-free medium. The cell culture supernatant fraction was harvested at d 8 after transfection, dialyzed to 20 mM Na2HPO4, pH 7.4 and subjected to MonoQ chromatography. Recombinant human CD5L (r-HsCD5L) was eluted in a sodium chloride gradient, and purification was monitored by SDS-PAGE. Purified protein was dialyzed to PBS, concentrated by centrifugation on Amicon ultra (Millipore, UFC901024), and possible endotoxin contamination was removed by Endotrap columns (Hyglos GmbH, 321063), following the manufacturer´s protocol and as performed before.Citation5 As mentioned above, the purified r-HsCD5L was tested in preliminary experiments, where its activity in terms of MФ TNF secretion, as well as inhibition of apoptosis induced by cycloheximide treatment, was comparable to that of commercially available r-HsCD5L (R&D Systems) (data not shown).
Measurement of cytokine secretion
THP1 MФ (5 × 10⁴ cells/well) or PB monocytes (105 cells/well) were stimulated with TLR agonists, including LPS (from E. coli 0111:B4), Pam3CSK4 (Pam3), and FSL1 (InvivoGen, tlrl-eblps, tlrl-pms and tlrl-fsl, respectively), diluted in culture medium containing 5% FCS, at the indicated concentrations. After 4 h, culture supernatant fractions were collected and assayed for TNF production with the OptEIA ELISA, following the manufacturer's instructions (BD Biosciences, 555212). In experiments using THP1-HsCD5L MФ treated with siRNA targeting ATG7 or CD36 expression, cells were siRNA-transfected, allowed to differentiate (see below), and then TLR-stimulated (5 × 10⁴ cells/well) as above. Levels of TNF, IL1B, and IL10 in the culture supernatant fractions were analyzed with OptEIA ELISA, following the manufacturer's instructions (BD Biosciences, 555212, 557953, 555157). Color was developed by adding 3,3′,5,5′-tetramethylbenzidine liquid substrate (Sigma-Aldrich, T8665), and the optical density was read at 650 nm on a Varioskan Flash microplate reader (ThermoFisher Scientific Inc. Vantaa, Finland).
Supernatant fractions from Pam3CSK4- or LPS–stimulated PB monocytes were also collected at 24 h and analyzed for TNF, IL1B, IL6, and IL10 production using a Procarta Human Cytokine Profiling kit (Affymetrix), following the protocol described by the manufacturer. Bead fluorescence readings were done on a Luminex 100 analyzer (Luminex Corp. Austin, TX, USA).
In experiments performed in the presence of signaling inhibitors, these compounds were added 45 min prior to TLR stimulation at the following concentrations: 20 μM SB203580, 50 μM SP600125, 100 μM PD98059, 10 μM wortmannin, 200 μM LY294002 (InvivoGen, tlrl-sb20, tlrl-sp60, tlrl-pd98, tlrl-wtm and tlrl-ly29, respectively), 1 μM Pi-103, 1 μM IC87114 (from Echelon Bioscience Inc., b-0303/b-0305/b-0301), and 0.1 mM 3-methyladenine (Sigma-Aldrich, M9281). Dimethyl sulfoxide (DMSO; Sigma-Aldrich, 472301), used to dilute the inhibitors, was added to control wells.
Flow cytometric analysis of TLR4, TLR2, and CD36 cell surface expression
2 × 10⁵ THP1 MФ or PB monocytes in culture medium or incubated with 1 μg/ml of LPS or Pam3CSK4 for 2 h were detached with Accutase (Sigma-Aldrich, A6964), washed twice in ice-cold PBS, and incubated with 100 μl of blocking buffer for 30 min on ice. Cells were then incubated with 1 μg monoclonal antibody (moAb) anti-TLR2 (R&D Systems, MAB2616), moAb anti-TLR4 (Affymetrix, 14–9917), or moAb anti-CD36 (ImmunoTools GmbH, 21270363) for 90 min at 4°C in blocking buffer. Cells were washed once with 3 ml PBS containing 2% FCS and 0.02% NaN3 (washing buffer), and incubated, when needed, with fluorescein isothiocyanate-conjugated anti-mouse IgG/IgM antibody (BD Biosciences) in blocking buffer for 45 min at 4°C. After washing cells with 3 ml washing buffer, flow cytometric analysis was performed on a FACSCantoII instrument (BD, San Jose, CA 95131 USA) and using FACSDiva software (BD Biosciences).
Western blot analysis of cell lysates
For cell signaling analysis, THP1 MФ (1.5 × 10⁶ cells/well) or PB monocytes (2106 cells/well) were plated in 6-well plates and incubated at 37°C with 0.5 μg/ml of Pam3CSK4 or LPS for the indicated periods of time. To determine inhibition of ATG7 protein expression by siRNA treatment, 105 cells were transfected with the indicated siRNA (see below). Cells were then washed in cold TBS and lysed in TBS lysis buffer for 30 min at 4°C. Nuclei and cell debris were removed by centrifugation at 8000 × g for 15 min, and protein concentration was measured with the BCA protein assay reagent kit (Thermo Fisher, 23227), following the manufacturer's instructions. We resolved 40 to 50 μg of protein from cell lysates in 10% SDS-polyacrylamide gels (12% for LC3 analysis) under reducing conditions and electrophoretically transferred them to nitrocellulose membranes (Bio-Rad Laboratories, 162–0115). These were then blocked with Starting Block TBS buffer (Thermo Fisher Scientific Inc., PI37542) for 1 h at room temperature and incubated overnight at 4°C with the indicated antibodies (polyclonal antibody [poAb] anti-phosphorylated RELA [Ser536; Millipore, EP2294Y], MAPK11/12/13/14/ [p38β/γ/δ/α, Thr180/Tyr182], MAPK1/3 [ERK2/1, Thr202/Tyr204], MAPK8/9 [SAP/JNK1/2, Thr183/Tyr185], AKT [Ser473], anti-AKT [pan] [Cell Signaling Technology, 9211, 9101, 4668, 4060, and 4691, respectively), poAb anti-LC3 [Novus Biologicals, NB100–2220], or poAb anti-ATG7 [Cell Signaling Technology, 8558]) diluted in blocking buffer. Blots were also probed against TUBB2A [mAb anti-TUBB2A; Sigma-Aldrich, T9026] to determine equal loading. The membranes were subsequently incubated with the appropriate fluorescently coupled secondary antibodies (IRDye680Cw-conjugated goat anti-rabbit IgG or IRDye 800Cw-conjugated goat anti-mouse IgG, LI-COR Biosciences, 926–32221 and 926–32210, respectively) diluted in blocking buffer for 60 min at room temperature. Three 15-min washes between steps were performed with TBS-0.01% Tween 20 (MERK 8.22184.0500). Bound antibody was detected with an Odyssey Infrared Imager (LI-COR, Lincoln, NE, USA), and densitometric analysis was performed using the Odyssey V.3 software (LI-COR).
Fluorescence microscopy studies
THP1 MФ (5 × 10⁴ cells/well) or PB monocytes (105 cells/well) were plated on Millicell EZ slides (Merck Millipore, PEZGS0816) and incubated with 1 μg/ml LPS or Pam3CSK4. Alternatively, cells were incubated in the presence or absence of 1 mM of 3-MA (Sigma-Aldrich, M9281), which was added 45 min prior to analysis. To determine autophagy flux, culture medium was replaced with prewarmed RPMI containing 100 nM LysoTracker Red (Molecular Probes, L7528), and cells were incubated at 37°C for 1 h. They were then washed once with PBS and fixed with PBS containing 4% paraformaldehyde (Panreac, 141451) for 30 min at room temperature. Next, they were incubated with a moAb anti-PtdIns3P (Echelon Bioscience Inc.., Z-P003), a poAb anti-LC3 (Novus Biologicals, NB100–2220) or a poAb anti- RELA (Cell Signaling Technology, 8242) in PBS containing 0.3% Triton X-100 and 10% human AB serum (Sigma-Aldrich, X100/H4522) for 24 h at 4°C. Cells were subsequently incubated with fluorescein isothiocyanate-conjugated anti-mouse IgG/IgM antibody (BD Biosciences, 555988) or Alexa Fluor® 647 F(ab')2 fragment of goat anti-rabbit IgG (Molecular Probes, A-21246) for 1 h at room temperature in PBS containing 0.3% Triton X-100. Between steps, unbound antibodies were removed with 3 washes with PBS. Finally, nuclei were stained with PBS containing 800 nM Hoechst solution (Molecular Probes, H3570) for 10 min at room temperature. Cells were washed 3 times with PBS, and coverslips were mounted in Fluoromount media (Sigma-Aldrich, F4680) and left at 4°C overnight.
The slides were examined under an Axio Observer Z1 DUO LSM 710 confocal system (Carl Zeiss Microscopy GmbH, Jena, Germany) and analyzed with ZEN Black software (Carl Zeiss Microscopy GmbH). Fluorescence intensity as well as was the RELA nuclear:cytoplasm ratio were quantified using ImageJ software (National Institutes of Health). RELA translocation was quantified in 250 cells from 3 independent experiments as described.Citation65 LC3 and LC3-LysoTracker Red colocalized puncta per cell were determined using a green and red puncta colocalization macroCitation66 and ImageJ software in threshold images with sizes from 3 to 30 pixel2 and puncta circularity 0.8 to 1 in more than 50 cells from 3 independent experiments scored in random fields.
Electron microscopy
THP1 MФ (107) were fixed with 2.5% glutaraldehyde in phosphate buffer. They were kept in the fixative for 2 h at 4°C. They were then washed with the same buffer and postfixed with 1% osmium tetroxide in the same buffer containing 0.8% potassium ferricyanide at 4°C. Then the samples were dehydrated in acetone, infiltrated with Epon resin (Electron Microscopy Sciences, RT 14120) for 2 d, embedded in the same resin, and polymerized at 60°C for 48 h. Ultrathin sections were obtained using a Leica Ultracut UC6 ultramicrotome (Leica Microsystems, Vienna) and mounted on Formvar-coated copper grids. They were stained with 2% uranyl acetate in water and lead citrate. Next, 25 sections/cell line were observed in a JEM-1010 electron microscope (Jeol, Tokyo 196–8558, Japan).
Measurement of cytokine mRNA levels by real-time PCR
THP1 MФ (1.5 × 10⁶ cells/well) or PB monocytes (2.5 × 10⁶ cells/well) were incubated for 1 h or 6 h in RPMI medium containing 5% FCS and 100 ng/ml LPS or Pam3CSK4 (Pam3). Cells were washed with PBS and disrupted with QIAzol Lysis Reagent (Qiagen, 79306), and total RNA was extracted using the miRNeasy Mini Kit (Qiagen, 217004). Total RNA (1 μg) was reverse transcribed using the Transcriptor First Strand cDNA Synthesis Kit (Roche, 04379012001). Each RT reaction was then amplified in a LightCycler® 480 PCR system using the KAPA SYBR Fast Master Mix (KAPA Biosystems, 51230–100). Samples were incubated for an initial denaturation at 95°C for 5 min, then 40 PCR cycles were performed using the following conditions: 95°C for 10 s, 60°C for 20 s and 72°C for 10 s. The following primer pairs were used: 5´- GAGGAGGCGCTCCCCAAGAAG -3´ and 5´- GTGAGGAGCACATGGGTGGAG -3´ for TNF; 5´- ACGCTCCGGGACTCACAGCA -3´ and 5´- TGAGGCCCAAGGCCACAGGT-3´for IL1B; 5´-TCGAGCCCACCGGGAACGAA-3´ and 5´-GCAGGGAAGGCAGCAGGCAA -3´ for IL6; 5´-CGTGGAGCAGGTGAAGAATG-3´ and 5´-AGAGCCCCAGATCCGATTTT-3´ for IL10; and 5´-TCTTCTTTTGCGTCGCCAG-3´ and 5´-AGCCCCAGCCTTCTCCA-3´ for GAPDH (glyceraldehyde 3-phosphate dehydrogenase). Gene expression values were normalized to the expression levels of GAPDH. Fold induction levels were calculated using as a reference the levels of expression of each gene at time 0 for THP1-Vector cells or those of ALB-treated PB monocytes.
Silencing of ATG7 and CD36 expression
To silence ATG7 and CD36 expression, undifferentiated THP1 cells were transfected with 10 nM of a set of 4 siRNAs targeting either ATG7, CD36, or an equal concentration of a nontargeting negative control pool (ON-TARGET plus siRNA, Thermo Fisher Scientific Inc., L-020112–00, L-010206–00, and D-001810–10, respectively) using INTERFERin (Polyplus, 409), as previously performed,Citation26 following the manufacturer´s instructions. After 24 h, the medium was replaced, and cells were differentiated for 24 h with culture medium supplemented with 50 ng/ml PMA. Next, PMA-containing medium was replaced by culture medium, and cells were incubated for further 24 h before being tested for ATG7 or CD36 expression by western blot and flow cytometry analysis, respectively. Cells were then used in the functional assays described above.
Statistical analysis
Data are presented as mean ± SEM of at least 3 experiments. Two-way ANOVA, one-way ANOVA or Student t test statistical analyses were performed with Graphpad Prism V.5 software. Values of P ≤ 0.05 were considered significant.
Disclosure of Potential Conflicts of Interest
No potential conflicts of interest were disclosed.
Supplemental Material
Supplemental data for this article can be accessed on the pub-lisher's website.
2014AUTO0259R3_supplemental_files.pdf
Download PDF (239.2 KB)Acknowledgments
We thank Marco Fernández and Gerard Requena from the Flow Cytometry and Microscopy Unit, IGTP, and Dr. Carina Cardalda for help in the Luminex experiments. Electron microscopy analyses were performed by the EM facility at the Parc Científic de Barcelona, University of Barcelona, managed by Dr. Carmen Lopez-Iglesias.
Funding
This work was supported by grants from the Fundació la Marató de TV3 (MTV3 08/932 and 12–922), and also from the Spanish Ministry of Health, ISCIII, and FEDER funds (FIS IP10/1565 and FIS IP13/1906) to MRS. MRS is supported by a Miguel Servet Fellowship (FIS CP08/124 and CPII14/00021). CA is supported by Ramón y Cajal Program (RYC-2010-07249).
References
- Kundu JK, Surh YJ. Inflammation: gearing the journey to cancer. Mutat Res 2008; 659:15-30; PMID:18485806; http://dx.doi.org/10.1016/j.mrrev.2008.03.002
- Mantovani A, Pierotti MA. Cancer and inflammation: a complex relationship. Cancer Lett 2008; 267:180-1; PMID:18562089; http://dx.doi.org/10.1016/j.canlet.2008.05.003
- Deretic V. Autophagy as an innate immunity paradigm: expanding the scope and repertoire of pattern recognition receptors. Current Opinion in Immunology 2012; 24:21-31; PMID:22118953; http://dx.doi.org/10.1016/j.coi.2011.10.006
- Into T, Inomata M, Takayama E, Takigawa T. Autophagy in regulation of Toll-like receptor signaling. Cell Signal 2012; 24:1150-62; PMID:22333395; http://dx.doi.org/10.1016/j.cellsig.2012.01.020
- Sarrias MR, Rosello S, Sanchez-Barbero F, Sierra JM, Vila J, Yelamos J, Vives J, Casals C, Lozano F. A role for human Sp alpha as a pattern recognition receptor. J Biol Chem 2005; 280:35391-8; PMID:16030018; http://dx.doi.org/10.1074/jbc.M505042200
- Gebe JA, Llewellyn M, Hoggatt H, Aruffo A. Molecular cloning, genomic organization and cell-binding characteristics of mouse Spalpha. Immunology 2000; 99:78-86; PMID:10651944; http://dx.doi.org/10.1046/j.1365-2567.2000.00903.x
- Gebe JA, Kiener PA, Ring HZ, Li X, Francke U, Aruffo A. Molecular cloning, mapping to human chromosome 1 q21-q23, and cell binding characteristics of Spalpha, a new member of the scavenger receptor cysteine-rich (SRCR) family of proteins. J Biol Chem 1997; 272:6151-8; PMID:9045627; http://dx.doi.org/10.1074/jbc.272.10.6151
- Sarrias MR, Gronlund J, Padilla O, Madsen J, Holmskov U, Lozano F. The Scavenger Receptor Cysteine-Rich (SRCR) domain: an ancient and highly conserved protein module of the innate immune system. Crit Rev Immunol 2004; 24:1-37; PMID:14995912; http://dx.doi.org/10.1615/CritRevImmunol.v24.i1.10
- Sarrias MR, Padilla O, Monreal Y, Carrascal M, Abian J, Vives J, Yelamos J, Lozano F. Biochemical characterization of recombinant and circulating human Spalpha. Tissue Antigens 2004; 63:335-44; PMID:15009805; http://dx.doi.org/10.1111/j.0001-2815.2004.00193.x
- Kim WK, Hwang HR, Kim do H, Lee PY, In YJ, Ryu HY, Park SG, Bae KH, Lee SC. Glycoproteomic analysis of plasma from patients with atopic dermatitis: CD5L and ApoE as potential biomarkers. Exp Mol Med 2008; 40:677-85; PMID:19116453; http://dx.doi.org/10.3858/emm.2008.40.6.677
- Yu HR, Kuo HC, Sheen JM, Wang L, Lin IC, Wang CL, Yang KD. A unique plasma proteomic profiling with imbalanced fibrinogen cascade in patients with Kawasaki disease. Pediatr Allergy Immunol 2009; 20:699-707; PMID:19170925; http://dx.doi.org/10.1111/j.1399-3038.2008.00844.x
- Gray J, Chattopadhyay D, Beale GS, Patman GL, Miele L, King BP, Stewart S, Hudson M, Day CP, Manas DM, et al. A proteomic strategy to identify novel serum biomarkers for liver cirrhosis and hepatocellular cancer in individuals with fatty liver disease. BMC Cancer 2009; 9:271; PMID:19656391; http://dx.doi.org/10.1186/1471-2407-9-271
- Gangadharan B, Antrobus R, Dwek RA, Zitzmann N. Novel serum biomarker candidates for liver fibrosis in hepatitis C patients. Clin Chem 2007; 53:1792-9; PMID:17702858; http://dx.doi.org/10.1373/clinchem.2007.089144
- Tissot JD, Sanchez JC, Vuadens F, Scherl A, Schifferli JA, Hochstrasser DF, Schneider P, Duchosal MA. IgM are associated to Sp alpha (CD5 antigen-like). Electrophoresis 2002; 23:1203-6; PMID:11981870; http://dx.doi.org/10.1002/1522-2683(200204)23:7/8%3c1203::AID-ELPS1203%3e3.0.CO;2-1
- Arai S, Maehara N, Iwamura Y, Honda S, Nakashima K, Kai T, Ogishi M, Morita K, Kurokawa J, Mori M, et al. Obesity-associated autoantibody production requires AIM to retain the immunoglobulin M immune complex on follicular dendritic cells. Cell Rep 2013; 3:1187-98; PMID:23562157; http://dx.doi.org/10.1016/j.celrep.2013.03.006
- Kuwata K, Watanabe H, Jiang SY, Yamamoto T, Tomiyama-Miyaji C, Abo T, Miyazaki T, Naito M. AIM inhibits apoptosis of T cells and NKT cells in Corynebacterium-induced granuloma formation in mice. Am J Pathol 2003; 162:837–47; PMID:12598318; http://dx.doi.org/10.1016/S0002-9440(10)63880-1
- Valledor AF, Hsu LC, Ogawa S, Sawka-Verhelle D, Karin M, Glass CK. Activation of liver X receptors and retinoid X receptors prevents bacterial-induced macrophage apoptosis. Proc Natl Acad Sci U S A 2004; 101:17813-8; PMID:15601766; http://dx.doi.org/10.1073/pnas.0407749101
- Yusa S, Ohnishi S, Onodera T, Miyazaki T. AIM, a murine apoptosis inhibitory factor, induces strong and sustained growth inhibition of B lymphocytes in combination with TGF-beta1. Eur J Immunol 1999; 29:1086-93; PMID:10229074; http://dx.doi.org/10.1002/(SICI)1521-4141(199904)29:04%3c1086::AID-IMMU1086%3e3.0.CO;2-X
- Miyazaki T, Hirokami Y, Matsuhashi N, Takatsuka H, Naito M. Increased susceptibility of thymocytes to apoptosis in mice lacking AIM, a novel murine macrophage-derived soluble factor belonging to the scavenger receptor cysteine-rich domain superfamily. J Exp Med 1999; 189:413-22; PMID:9892623; http://dx.doi.org/10.1084/jem.189.2.413
- Haruta I, Kato Y, Hashimoto E, Minjares C, Kennedy S, Uto H, Yamauchi K, Kobayashi M, Yusa S, Muller U, et al. Association of AIM, a novel apoptosis inhibitory factor, with hepatitis via supporting macrophage survival and enhancing phagocytotic function of macrophages. J Biol Chem 2001; 276:22910-4; PMID:11294859; http://dx.doi.org/10.1074/jbc.M100324200
- Qu P, Du H, Li Y, Yan C. Myeloid-specific expression of Api6/AIM/Sp alpha induces systemic inflammation and adenocarcinoma in the lung. J Immunol 2009; 182:1648-59; PMID:19155514; http://dx.doi.org/10.4049/jimmunol.182.3.1648
- Arai S, Shelton JM, Chen M, Bradley MN, Castrillo A, Bookout AL, Mak PA, Edwards PA, Mangelsdorf DJ, Tontonoz P, et al. A role for the apoptosis inhibitory factor AIM/Spalpha/Api6 in atherosclerosis development. Cell Metab 2005; 1:201-13; PMID:16054063; http://dx.doi.org/10.1016/j.cmet.2005.02.002
- Li Y, Qu P, Wu L, Li B, Du H, Yan C. Api6/AIM/Spalpha/CD5L overexpression in alveolar type II epithelial cells induces spontaneous lung adenocarcinoma. Cancer Res 2011; 71:5488-99; PMID:21697282; http://dx.doi.org/10.1158/0008-5472.CAN-10-4225
- Kurokawa J, Arai S, Nakashima K, Nagano H, Nishijima A, Miyata K, Ose R, Mori M, Kubota N, Kadowaki T, et al. Macrophage-derived AIM is endocytosed into adipocytes and decreases lipid droplets via inhibition of fatty acid synthase activity. Cell Metab 2010; 11:479-92; PMID:20519120; http://dx.doi.org/10.1016/j.cmet.2010.04.013
- Kurokawa J, Nagano H, Ohara O, Kubota N, Kadowaki T, Arai S, Miyazaki T. Apoptosis inhibitor of macrophage (AIM) is required for obesity-associated recruitment of inflammatory macrophages into adipose tissue. Proc Natl Acad Sci U S A 2011; 108:12072-7; PMID:21730133
- Amezaga N, Sanjurjo L, Julve J, Aran G, Perez-Cabezas B, Bastos-Amador P, Armengol C, Vilella R, Escola-Gil JC, Blanco-Vaca F, et al. Human scavenger protein AIM increases foam cell formation and CD36-mediated oxLDL uptake. J Leukoc Biol 2013; 95:509-20; PMID:24295828; http://dx.doi.org/10.1189/jlb.1212660
- Silverstein RL, Febbraio M. CD36, a scavenger receptor involved in immunity, metabolism, angiogenesis, and behavior. Sci Signal 2009; 2:re3; PMID:19471024
- Asch AS, Barnwell J, Silverstein RL, Nachman RL. Isolation of the thrombospondin membrane receptor. J Clin Invest 1987; 79:1054-61; PMID:2435757; http://dx.doi.org/10.1172/JCI112918
- Ockenhouse CF, Tandon NN, Magowan C, Jamieson GA, Chulay JD. Identification of a platelet membrane glycoprotein as a falciparum malaria sequestration receptor. Science 1989; 243:1469-71; PMID:2467377; http://dx.doi.org/10.1126/science.2467377
- Barnwell JW, Asch AS, Nachman RL, Yamaya M, Aikawa M, Ingravallo P. A human 88-kD membrane glycoprotein (CD36) functions in vitro as a receptor for a cytoadherence ligand on Plasmodium falciparum-infected erythrocytes. J Clin Invest 1989; 84:765-72; PMID:2474574; http://dx.doi.org/10.1172/JCI114234
- Hoebe K, Georgel P, Rutschmann S, Du X, Mudd S, Crozat K, Sovath S, Shamel L, Hartung T, Zahringer U, et al. CD36 is a sensor of diacylglycerides. Nature 2005; 433:523-7; PMID:15690042; http://dx.doi.org/10.1038/nature03253
- Mikolajczyk TP, Skrzeczynska-Moncznik JE, Zarebski MA, Marewicz EA, Wisniewska AM, Dzieba M, Dobrucki JW, Pryjma JR. Interaction of human peripheral blood monocytes with apoptotic polymorphonuclear cells. Immunology 2009; 128:103-13; PMID:19689740; http://dx.doi.org/10.1111/j.1365-2567.2009.03087.x
- Endemann G, Stanton LW, Madden KS, Bryant CM, White RT, Protter AA. CD36 is a receptor for oxidized low density lipoprotein. J Biol Chem 1993; 268:11811-6; PMID:7685021
- Ibrahimi A, Abumrad NA. Role of CD36 in membrane transport of long-chain fatty acids. Curr Opin Clin Nutr Metab Care 2002; 5:139-45; PMID:11844979; http://dx.doi.org/10.1097/00075197-200203000-00004
- Coburn CT, Hajri T, Ibrahimi A, Abumrad NA. Role of CD36 in membrane transport and utilization of long-chain fatty acids by different tissues. J Mol Neurosci 2001; 16:117-21; discussion 51-7; PMID:11478366; http://dx.doi.org/10.1385/JMN:16:2-3:117
- He J, Lee JH, Febbraio M, Xie W. The emerging roles of fatty acid translocase/CD36 and the aryl hydrocarbon receptor in fatty liver disease. Exp Biol Med 2011; 236:1116-21; PMID:21885479; http://dx.doi.org/10.1258/ebm.2011.011128
- Kennedy DJ, Kashyap SR. Pathogenic role of scavenger receptor CD36 in the metabolic syndrome and diabetes. Metab Syndr Relat Disord 2011; 9:239-45; PMID:21428745; http://dx.doi.org/10.1089/met.2011.0003
- Means TK, Mylonakis E, Tampakakis E, Colvin RA, Seung E, Puckett L, Tai MF, Stewart CR, Pukkila-Worley R, Hickman SE, et al. Evolutionarily conserved recognition and innate immunity to fungal pathogens by the scavenger receptors SCARF1 and CD36. J Exp Med 2009; 206:637-53; PMID:19237602; http://dx.doi.org/10.1084/jem.20082109
- Stuart LM, Deng J, Silver JM, Takahashi K, Tseng AA, Hennessy EJ, Ezekowitz RA, Moore KJ. Response to Staphylococcus aureus requires CD36-mediated phagocytosis triggered by the COOH-terminal cytoplasmic domain. J Cell Biol 2005; 170:477-85; PMID:16061696; http://dx.doi.org/10.1083/jcb.200501113
- Jimenez-Dalmaroni MJ, Xiao N, Corper AL, Verdino P, Ainge GD, Larsen DS, Painter GF, Rudd PM, Dwek RA, Hoebe K, et al. Soluble CD36 ectodomain binds negatively charged diacylglycerol ligands and acts as a co-receptor for TLR2. PLoS One 2009; 4:e7411; PMID:19847289; http://dx.doi.org/10.1371/journal.pone.0007411
- Triantafilou M, Gamper FG, Haston RM, Mouratis MA, Morath S, Hartung T, Triantafilou K. Membrane sorting of toll-like receptor (TLR)-2/6 and TLR2/1 heterodimers at the cell surface determines heterotypic associations with CD36 and intracellular targeting. J Biol Chem 2006; 281:31002-11; PMID:16880211; http://dx.doi.org/10.1074/jbc.M602794200
- Abe T, Shimamura M, Jackman K, Kurinami H, Anrather J, Zhou P, Iadecola C. Key role of CD36 in Toll-like receptor 2 signaling in cerebral ischemia. Stroke 2010; 41:898-904; PMID:20360550; http://dx.doi.org/10.1161/STROKEAHA.109.572552
- Seimon TA, Nadolski MJ, Liao X, Magallon J, Nguyen M, Feric NT, Koschinsky ML, Harkewicz R, Witztum JL, Tsimikas S, et al. Atherogenic lipids and lipoproteins trigger CD36-TLR2-dependent apoptosis in macrophages undergoing endoplasmic reticulum stress. Cell Metab 2010; 12:467-82; PMID:21035758; http://dx.doi.org/10.1016/j.cmet.2010.09.010
- Stewart CR, Stuart LM, Wilkinson K, van Gils JM, Deng J, Halle A, Rayner KJ, Boyer L, Zhong R, Frazier WA, et al. CD36 ligands promote sterile inflammation through assembly of a Toll-like receptor 4 and 6 heterodimer. Nat Immunol 2009; 11:155-61; PMID:20037584; http://dx.doi.org/10.1038/ni.1836
- Joseph SB, Bradley MN, Castrillo A, Bruhn KW, Mak PA, Pei L, Hogenesch J, O'Connell R M, Cheng G, Saez E, et al. LXR-dependent gene expression is important for macrophage survival and the innate immune response. Cell 2004; 119:299-309; PMID:15479645; http://dx.doi.org/10.1016/j.cell.2004.09.032
- Husebye H, Halaas O, Stenmark H, Tunheim G, Sandanger O, Bogen B, Brech A, Latz E, Espevik T. Endocytic pathways regulate Toll-like receptor 4 signaling and link innate and adaptive immunity. EMBO J 2006; 25:683-92; PMID:16467847; http://dx.doi.org/10.1038/sj.emboj.7600991
- Brown J, Wang H, Hajishengallis GN, Martin M. TLR-signaling networks: an integration of adaptor molecules, kinases, and cross-talk. J Dental Res 2011; 90:417-27; PMID:20940366; http://dx.doi.org/10.1177/0022034510381264
- O′Farrell F, Rusten TE, Stenmark H. Phosphoinositide 3-kinases as accelerators and brakes of autophagy. FEBS Journal 2013; 280:6322-37; PMID:23953235; http://dx.doi.org/10.1111/febs.12486
- Foster FM, Traer CJ, Abraham SM, Fry MJ. The phosphoinositide (PI) 3-kinase family. J Cell Sci 2003; 116:3037-40; PMID:12829733; http://dx.doi.org/10.1242/jcs.00609
- Ghigo. PI3K inhibition in inflammation: Toward tailored therapies for specific diseases. Bioessays 2010; 32:185-96; PMID:20162662; http://dx.doi.org/10.1002/bies.200900150
- Vanhaesebroeck B, Leevers SJ, Ahmadi K, Timms J, Katso R, Driscoll PC, Woscholski R, Parker PJ, Waterfield MD. Synthesis and function of 3-phosphorylated inositol lipids. Annu Rev Biochem 2001; 70:535-602; PMID:11395417; http://dx.doi.org/10.1146/annurev.biochem.70.1.535
- Jaber N, Dou Z, Chen JS, Catanzaro J, Jiang YP, Ballou LM, Selinger E, Ouyang X, Lin RZ, Zhang J, et al. Class III PI3K Vps34 plays an essential role in autophagy and in heart and liver function. Proc Natl Acad Sci U S A 2012; 109:2003-8; PMID:22308354; http://dx.doi.org/10.1073/pnas.1112848109
- Sanjurjo L, Amezaga N, Vilaplana C, Caceres N, Marzo E, Valeri M, Cardona PJ, Sarrias MR. The scavenger protein apoptosis inhibitor of macrophages (AIM) potentiates the antimicrobial response against mycobacterium tuberculosis by enhancing autophagy. PLoS One 2013; 8:e79670; PMID:24223991; http://dx.doi.org/10.1371/journal.pone.0079670
- Delgado MA, Elmaoued RA, Davis AS, Kyei G, Deretic V. Toll-like receptors control autophagy. EMBO J 2008; 27:1110-21; PMID:18337753; http://dx.doi.org/10.1038/emboj.2008.31
- Klionsky DJ, Abdalla FC, Abeliovich H, Abraham RT, Acevedo-Arozena A, Adeli K, Agholme L, Agnello M, Agostinis P, Aguirre-Ghiso JA, et al. Guidelines for the use and interpretation of assays for monitoring autophagy. Autophagy 2012; 8:445-544; PMID:22966490; http://dx.doi.org/10.4161/auto.19496
- Geng J, Klionsky DJ. The Atg8 and Atg12 ubiquitin-like conjugation systems in macroautophagy. 'Protein modifications: beyond the usual suspects' review series. EMBO Rep 2008; 9(9):859-64; PMID:18704115; http://dx.doi.org/10.1038/embor.2008.163
- Shi CS, Shenderov K, Huang NN, Kabat J, Abu-Asab M, Fitzgerald KA, Sher A, Kehrl JH. Activation of autophagy by inflammatory signals limits IL-1beta production by targeting ubiquitinated inflammasomes for destruction. Nat Immunol 2012; 13:255-63; PMID:22286270; http://dx.doi.org/10.1038/ni.2215
- Barton GM, Kagan JC. A cell biological view of Toll-like receptor function: regulation through compartmentalization. Nat Rev Immunol 2009; 9:535-42; PMID:19556980; http://dx.doi.org/10.1038/nri2587
- Shin HW, Hayashi M, Christoforidis S, Lacas-Gervais S, Hoepfner S, Wenk MR, Modregger J, Uttenweiler-Joseph S, Wilm M, Nystuen A, et al. An enzymatic cascade of Rab5 effectors regulates phosphoinositide turnover in the endocytic pathway. J Cell Biol 2005; 170:607-18; PMID:16103228; http://dx.doi.org/10.1083/jcb.200505128
- Devereaux K, Dall'Armi C, Alcazar-Roman A, Ogasawara Y, Zhou X, Wang F, Yamamoto A, De Camilli P, Di Paolo G. Regulation of mammalian autophagy by class II and III PI 3-kinases through PI3P synthesis. PLoS One 2013; 8:e76405; PMID:24098492; http://dx.doi.org/10.1371/journal.pone.0076405
- Harris J, Hartman M, Roche C, Zeng SG, O'Shea A, Sharp FA, Lambe EM, Creagh EM, Golenbock DT, Tschopp J, et al. Autophagy controls IL-1beta secretion by targeting pro-IL-1beta for degradation. Journal of Biological Chemistry 2011; 286:9587-97; PMID:21228274; http://dx.doi.org/10.1074/jbc.M110.202911
- Sarvari J, Mojtahedi Z, Taghavi SA, Kuramitsu Y, Shamsi Shahrabadi M, Ghaderi A, Nakamura K. Differentially expressed proteins in chronic active hepatitis, cirrhosis, and HCC related to HCV infection in comparison with HBV infection: a proteomics study. Hepat Mon 2013; 13:e8351; PMID:24066001; http://dx.doi.org/10.5812/hepatmon.8351
- Wu J, Kobayashi M, Sousa EA, Liu W, Cai J, Goldman SJ, Dorner AJ, Projan SJ, Kavuru MS, Qiu Y, et al. Differential proteomic analysis of bronchoalveolar lavage fluid in asthmatics following segmental antigen challenge. Mol Cell Proteomics 2005; 4:1251-64; PMID:15951573; http://dx.doi.org/10.1074/mcp.M500041-MCP200
- Zhang Y, Zeng X, Jin S. Autophagy in adipose tissue biology. Pharmacol Res 2012; 66(6):505-12; PMID:23017672; http://dx.doi.org/10.1016/j.phrs.2012.09.004
- Noursadeghi M, Tsang J, Haustein T, Miller RF, Chain BM, Katz DR. Quantitative imaging assay for NF-kappaB nuclear translocation in primary human macrophages. J Immunol Methods 2008; 329:194-200; PMID:18036607; http://dx.doi.org/10.1016/j.jim.2007.10.015
- Pampliega O, Orhon I, Patel B, Sridhar S, Diaz-Carretero A, Beau I, Codogno P, Satir BH, Satir P, Cuervo AM. Functional interaction between autophagy and ciliogenesis. Nature 2013; 502:194-200; PMID:24089209; http://dx.doi.org/10.1038/nature12639