
Abstract
The Atg1 complex, which contains 5 major subunits: Atg1, Atg13, Atg17, Atg29, and Atg31, regulates the induction of autophagy and autophagosome formation. To gain a better understanding of the overall architecture and assembly mechanism of this essential autophagy regulatory complex, we have reconstituted a core assembly of the Saccharomyces cerevisiae Atg1 complex composed of full-length Atg17, Atg29, and Atg31, along with the C-terminal domains of Atg1 (Atg1[CTD]) and Atg13 (Atg13[CTD]). Using chemical-crosslinking coupled with mass spectrometry (CXMS) analysis we systematically mapped the intersubunit interaction interfaces within this complex. Our data revealed that the intrinsically unstructured C-terminal domain of Atg29 interacts directly with Atg17, whereas Atg17 interacts with Atg13 in 2 distinct intrinsically unstructured regions, including a previously unknown motif that encompasses several putative phosphorylation sites. The Atg1[CTD] crosslinks exclusively to the Atg13[CTD] and does not appear to make direct contact with the Atg17-Atg31-Atg29 scaffold. Finally, single-particle electron microscopy analysis revealed that both the Atg13[CTD] and Atg1[CTD] localize to the tip regions of Atg17-Atg31-Atg29 and do not alter the distinct curvature of this scaffolding subcomplex. This work provides a comprehensive understanding of the subunit interactions in the fully assembled Atg1 core complex, and uncovers the potential role of intrinsically disordered regions in regulating complex integrity.
Introduction
The ability of cells to maintain homeostasis through synthesizing and degrading intracellular components is a fundamental process required for life. In eukaryotes, macroautophagy (hereafter autophagy) represents one such degradative pathway used to break down cytoplasmic components to provide the building blocks for biosynthetic pathways during periods of nutrient starvation or cellular stress.Citation1-3 Autophagy also plays critical roles in cellular growth and development,Citation4 and its deficiency has been implicated in human diseases including neurodegeneration and different types of cancers.Citation5,6
Autophagy begins with formation of the initial sequestering compartment, the phagophore, at the phagophore assembly site (PAS).Citation1-3 Expansion of the phagophore leads to engulfment of cytoplasmic material and formation of a double-membrane vesicle termed the autophagosome. Subsequent fusion of autophagosomes with the vacuole (in yeast and plant cells) or the lysosome (in mammalian cells) leads to the degradation of autophagosomes and their contents by hydrolytic enzymes and recycling of macromolecular components into the cytoplasm by permeases. In yeast, the cytoplasm-to-vacuole targeting (Cvt) pathway delivers at least 3 resident vacuolar enzymes, aminopeptidase I (Ape1), α-mannosidase (Ams1), and aspartyl aminopeptidase (Ape4), to the vacuole via Cvt vesicles.Citation7-9 Notably, formation of double-membrane Cvt vesicles initiates at the PAS and proceeds through a similar mechanism as that involved in autophagosome formation.
Genetic screens performed in Saccharomyces cerevisiae and other fungal species led to the identification of 38 mostly conserved Atg (autophagy related) proteins functionally important for autophagy.Citation2,10-13 Of these, 20 core proteins are essential for autophagosome formation. These proteins can be classified into 5 functional groups: (i) the Atg1 complex, (ii) the autophagy-specific phosphatidylinositol 3-kinase (PtdIns3K) complex, (iii) Atg9 and the Atg2-Atg18 cycling system, (iv) the Atg12 conjugation system, and (v) the Atg8 conjugation system. The different Atg proteins are recruited to the PAS in a hierarchical manner.Citation14,15 The most upstream acting components belong to the Atg1 complex consisting of the Atg1 protein kinase, the regulatory subunit Atg13, and a ternary complex composed of Atg17, Atg31, and Atg29. The Atg1 complex mediates autophagosome formation by initiating phagophore assembly and the localization of the downstream PtdIns3K complex, Atg9, and the ubiquitin-like conjugation systems to this membrane compartment.Citation14,15 Recent biochemical and structural studies have revealed multiple roles of the Atg1 complex in autophagosome formation and autophagy induction.
A serine/threonine protein kinase, Atg1 represents the only enzymatic subunit of the Atg1 complex. Although Atg1 kinase activity is dispensable for the assembly of the Atg1 complex, it is required for the expansion of the phagophore.Citation14 Furthermore, Atg1 activity is essential to the turnover and recycling of other Atg proteins after autophagosomes are formed.Citation16 The kinase domain of Atg1 is located at the N-terminal region (residues 1 to 589), and requires an autophosphorylation event at threonine residue 226 for full activity.Citation17 The integral membrane protein Atg9 and mammalian BECN1 (the ortholog of yeast Vps30/Atg6) are direct substrates of Atg1 (or the mammalian ortholog ULK1).Citation18,19 Atg1-mediated phosphorylation events are essential for autophagy and, in the case of Atg9, for the Cvt pathway.Citation18-20 The C-terminal domain of Atg1 (residues 589 to 897) interacts with Atg13 and Atg17.Citation21,22 This Atg1 domain, dubbed the EAT (early autophagy targeting) domain, appears to possess a membrane binding function with specificity for high-curvature membranes.Citation21,22 However, recent crystallographic analysis of the Kluyveromyces marxianus Atg1 C-terminal domain showed that its structure does not resemble canonical membrane-curvature sensors.Citation23
Atg13 functions as a major positive regulator for the Atg1 protein kinase. Atg13 is highly phosphorylated during nutrient-rich conditions by protein kinase A and the target of rapamycin (TOR) complex 1 (TORC1).Citation24,25 Nutrient starvation leads to rapid Atg13 dephosphorylation, an event that has been proposed to increase the binding affinity of Atg13 to Atg1 and thereby promote the formation of the full Atg1 complex.Citation23,24 A separate study, however, suggests that the Atg1 complex is preformed with its structural integrity unaffected by the phosphorylation state of Atg13.Citation26 The majority of Atg13's phosphorylation sites map to the C-terminal domain (residues 260 to 738), a region that is predicted to be intrinsically unstructured. In contrast, the N-terminal domain of Atg13 (residues 1 to 268) forms a globular domain that, based on X-ray crystallography, adopts a novel HORMA fold.Citation27 The Atg13 HORMA domain is required for localization of the Atg14-containing PtdIns3K complex,Citation27 and is thought to mediate this localization through associating with acidic lipids.Citation27,28
The remaining 3 components of the Atg1 complex (Atg17, Atg29, Atg31) constitutively form a stable ternary assembly that is localized to the PAS irrespective of the nutrient status in the cell.Citation29 During nonstarvation conditions, this assembly utilizes the Atg11 protein to promote its localization to the PAS.Citation30,31 As one of the first set of Atg proteins to be targeted to the PAS upon autophagy induction, the Atg17-Atg31-Atg29 subcomplex (hereafter Atg17-Atg31-Atg29), along with Atg11, are thought to serve as molecular scaffolds to organize the PAS.Citation22,30,31 Support for this proposed function has arisen from recent structural studies of Atg17-Atg31-Atg29, which revealed that this subcomplex adopts a highly extended “S-shaped” dimeric architecture.Citation22,32 Each Atg17 protomer associates with a heterodimer of Atg31-Atg29, and dimerization of Atg17 results in an assembly with a 2:2:2 stoichiometry of the 3 components. Although Atg17 is the major component that establishes the S-shaped scaffold, both Atg31 and Atg29 are required for autophagy. Atg31 and Atg29 likely serve regulatory functions as both proteins are phosphorylated upon autophagy activation.Citation29,31 Indeed, the C terminus of Atg29 constitutes a regulatory phosphopeptide that modulates Atg29 association with Atg11 in a phosphorylation-dependent manner.Citation31
Despite recent progress in understanding the function of the Atg1 complex, the assembly mechanism of this complex has not been fully defined. The structure of the Lachancea thermotolerans Atg17-Atg31-Atg29 subcomplex has provided a first glimpse into a core portion of the Atg1 complex.Citation22 More recently, the C-terminal domain of K. marxianus Atg1 (residues 587 to 897) was co-crystallized in complex with a central fragment of Atg13 (residues 460 to 521).Citation23 Although these studies have provided new insights into the protein-protein interactions mediating complex formation, many questions regarding complex assembly still remain. Notably, the roles of the intrinsically unstructured domains of Atg29, Atg31, and Atg13 in complex formation and regulation have not been investigated as these domains are highly challenging to be studied by X-ray crystallography. Furthermore, although stable interactions between fragments of different components within the complex have been studied, the relevance of these interactions in the context of the fully assembled complex remains unclear. To obtain a more complete picture of the intermolecular interactions underlying Atg1 complex formation and the overall architecture of this complex, we applied an integrated approach that combines chemical-crosslinking coupled with mass spectrometry (CXMS), single-particle electron microscopy (EM), and biochemical coprecipitation to analyze a reconstituted minimal pentameric assembly of the Saccharomyces cerevisiae Atg1 complex. This assembly is composed of full-length Atg17, Atg31, Atg29, and the full C-terminal domains of Atg1 and Atg13 (Atg1[CTD]: residues 589 to 897, Atg13[CTD]: residues 384 to 738). Our CXMS data revealed that the Atg1[CTD] crosslinks exclusively to Atg13[CTD], whereas the Atg13[CTD] crosslinks to Atg17 at 2 specific regions that contain putative phosphorylation sites. Our data also showed that the C-terminal regulatory region of Atg29 crosslinks directly to Atg17, and coprecipitation experiments confirmed this previously unknown association. Using single-particle EM, we further determined that the C-terminal domains of Atg1 and Atg13 localize to the “tips” of the S-shaped scaffolding protein Atg17. This work provides a broader understanding of the molecular mechanisms contributing to Atg1 complex formation.
Results
Reconstitution of a minimal pentameric Atg1 complex from S. cerevisiae
To gain further insight into the subunit organization and assembly mechanism of the S. cerevisiae Atg1 kinase complex, we sought to isolate the fully assembled complex containing 5 core components: Atg1, Atg13, Atg17, Atg29, and Atg31. Initial purifications using a yeast strain encoding a FLAG-tagged Atg1 and anti-FLAG resin resulted in predominantly Atg1 alone (data not shown). We next investigated reconstituting the full complex by coexpressing the 5 proteins recombinantly in E. coli, an approach that others and we have successfully used to reconstitute the Atg17-Atg31-Atg29 subassembly from S. cerevisiae and other yeast species for structural studies.Citation22,32 However, attempts to co-overexpress Atg17-Atg31-Atg29 with full-length Atg1 and/or Atg13 were unsuccessful, presumably due to their relatively large protein sizes or the presence of intrinsically unstructured regions in some of the subunits.
Recently, Ragusa et al. reported the reconstitution of a minimal Atg1 complex from K. lactis.Citation22 This “mini pentamer” assembly consists of full-length Atg17-Atg31-Atg29, the full Atg1 C-terminal domain (562 to 831), and a minimal central domain (350 to 550) of Atg13. Secondary structure predictions and multiple sequence alignment analyses show that the C-terminal domain (589 to 897) of Atg1 (Atg1[CTD]) and the C-terminal domain (384-738) of Atg13 (Atg13[CTD]) are highly conserved (; Fig. S1). Furthermore, previous studies have shown that the C-terminal domains of Atg1 and Atg13 are involved in intermolecular interactions within the full complex.Citation16,21 We therefore examined the possibility of reconstituting a larger pentameric Atg1 complex from S. cerevisiae. Using the pQLINK vector system for expressing multiple genes from a single vector we co-expressed C-terminal 6xHis-tagged Atg31 and untagged Atg17, Atg29, Atg1[CTD] and Atg13[CTD]. The complex was purified using 2 chromatography steps (nickel chelating affinity chromatography followed by gel filtration chromatography) with the purified fraction containing full-length Atg17, Atg29, and Atg31, as well as the full C-terminal domains of Atg1 and Atg13 ().
Figure 1. Purification of the pentameric assembly of the Atg1 kinase complex and crosslinking analysis. (A) Schematic of the Atg1[CTD] and Atg13[CTD] constructs used for purification. (B) Purification of Atg1 kinase pentamer assembly. Purified samples were analyzed by SDS-PAGE and visualized by silver staining. Labeled bands on the right are predicted sizes, and molecular weight markers are shown on the left. (C) Schematic summary of crosslinked regions identified by CXMS.
![Figure 1. Purification of the pentameric assembly of the Atg1 kinase complex and crosslinking analysis. (A) Schematic of the Atg1[CTD] and Atg13[CTD] constructs used for purification. (B) Purification of Atg1 kinase pentamer assembly. Purified samples were analyzed by SDS-PAGE and visualized by silver staining. Labeled bands on the right are predicted sizes, and molecular weight markers are shown on the left. (C) Schematic summary of crosslinked regions identified by CXMS.](/cms/asset/79114bb6-052b-451e-956e-859674e960b1/kaup_a_1040972_f0001_c.jpg)
Crosslinking coupled to mass spectrometry analysis of a minimal Atg1 pentamer assembly
To gain further insights into the intersubunit interaction interfaces within the Atg1 complex, we subjected the purified pentameric assembly to crosslinking coupled to mass spectrometry (CXMS) analysis. This approach enables us to map subunit regions that are in close proximity in the context of the core Atg1 pentameric complex.Citation33 We first incubated the purified complex with increasing concentrations of either the DSS or BSCitation3 chemical crosslinker, which covalently conjugates 2 free amine groups over a Cα-Cα distance of approximately 24 to 30 Å.34 Addition of crosslinker led to the appearance of a high molecular mass band above the 250-kDa molecular mass marker, a size that corresponded well to the calculated total mass of the mini pentameric assembly (∼350 kDa) (Fig. S2). The band corresponding to the crosslinked complex was excised and digested in gel for LC-MS/MS analysis. Alternatively, all the proteins were precipitated after crosslinking, digested in solution, and analyzed by LC-MS/MS. The mass spectrometry data were subsequently analyzed using the pLink program.Citation33 A total of 163 unique crosslinked peptides were identified, and of these, 74 were “interlinks” or crosslinks between subunits of the Atg1 complex (Table S1). There is a great overlap between the in-gel digestion result and the in-solution digestion result. The CXMS data enabled us to generate a “proximity map” that yielded new insights into the molecular interactions that stabilize the Atg1 complex (). We summarize the findings from CXMS in the following sections.
Atg17-Atg31-Atg29 interactions
The Atg17-Atg31-Atg29 complex functions as a molecular scaffold for Atg1 complex assembly.Citation22,32 Recently, the crystal structure of L. thermotolerans Atg17 in complex with Atg31 and a proteolytic fragment of Atg29 revealed the molecular details of how Atg17-Atg31-Atg29 is assembled.Citation22 Atg17 is composed of a right-handed antiparallel 3-helix bundle, and forms an S-shaped dimer that extends over a distance of ∼350 Å. Atg31 binds Atg17 via a C-terminal helix and Atg29 through an N-terminal β-sheet. We generated a homology model of the S. cerevisiae Atg17-Atg31-Atg29 complex based on the crystallographic structure of L. thermotolerans Atg17-Atg31-Atg29 (Fig. S3). Comparison of the crosslinked peptides identified from CXMS to the interaction interfaces of the homology model suggested that the S. cerevisiae Atg17-Atg31-Atg29 subcomplex in the context of the pentameric assembly adopts a very similar configuration as the crystallized core subcomplex, with the only regions having poor modeling found in flexible loops in the crystal structure (Fig. S3D).
Previous yeast 2-hybrid analysis showed that Atg17 directly interacts with Atg31, but not Atg29.Citation35 Our CXMS data showed that a peptide encompassing residues 68 to 92 of Atg17 crosslink to residues 22 to 39 at the N-terminal region of Atg31 (). Although no other crosslinks were detected between Atg17 and Atg31, this observation could be attributed to the relatively low abundance of lysine residues and the poor accessibility of crosslinkers to the tight interaction interface, as has been observed in the crystal structure and our homology model. This region of Atg31 is predicted to occur in an unstructured loop that may have had greater accessibility to crosslinker.
Figure 2. Atg17-31-29 interactions. (A) Schematic summary of crosslinked peptides mediating Atg17 interactions with Atg31 and Atg29; Atg17 (orange), Atg31 (magenta), Atg29 (pink). Crosslinked lysine residues are red while the primary sequence of the crosslinked peptide is marked by a black box. Solid lines indicate regions of primary sequence while dotted lines join intersubunit crosslinks. (B) Homology model of Atg17-Atg31-Atg29 (PDB: 4HPQ). Crosslinked lysine residues are shown as red spheres while red lines indicate interprotein crosslinks. Only the major class of crosslinked peptides are depicted (as shown in Table S1); Atg17 (orange), Atg31 (magenta), Atg29 (pink). (C) In vitro coprecipitation between GST-Atg29 and His-tagged Atg17. Constructs were expressed in the E. coli T7 express strain. Glutathione agarose was used for precipitation. The western blot was probed using anti-His tag antibody.
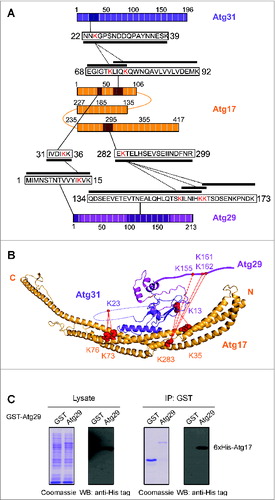
CXMS further revealed that a region of Atg17 (residues 282 to 299) crosslinks to the unstructured C-terminal region of Atg29 (residues 134 to 173). These crosslinked peptides represent one of most abundant peptide groups from our CXMS analysis (Table S1). To validate the potential interaction between Atg29 and Atg17, we performed coprecipitation experiments by coexpressing various GST-tagged Atg29 constructs and His-tagged Atg17 in the same E. coli host (). Our results showed that full-length Atg29 (residues 1 to 213) could effectively and consistently pull down His-tagged Atg17, confirming that Atg29 has the capability to bind Atg17 without the bridging Atg31 component. We also tested the ability of the N-terminal (residues 1 to 100) and C-terminal (residues 101 to 213) domains of Atg29 in binding Atg17. However, we could not accurately assess the ability of these domains to interact with Atg17 due to the poor expression level of these constructs, and this has prevented us from further defining the Atg17 binding motif in Atg29.
According to the location of the crosslink and our homology model, the Atg29-Atg17 interaction would occur at the convex side of the arc-shaped Atg17 monomer. This uncharacterized association might have been observed from our previous EM analysis of a ternary complex containing GFP fused to the C terminus of Atg29.Citation32 In this analysis, the GFP moiety was found to localize to the convex side of the S-shaped Atg17-Atg31-Atg29 ternary complex (Fig. S4). Interestingly, the region of Atg17 that crosslinked to Atg29 is directly adjacent to the Atg13[CTD] crosslinked region (see below).
Atg31 and Atg29 form a stable heterodimeric complex independent of Atg17.Citation22 In agreement with the homology model, our CXMS data revealed that the N-terminal region of Atg31 (residues 14 to 54) crosslinked to the N-terminal region of Atg29 (residues 1 to 13) (Fig. S5A) and represented a very abundant peptide group in our samples (Table S1). Atg29 is predicted to be largely unstructured, and the crystallized complex contains only a minimal N-terminal fragment (residues 1 to 86) of Atg29.Citation22 Our CXMS analysis showed that additional regions of Atg29 may further stabilize the Atg29-Atg31 interface (Fig. S5A). Notably, the C terminus of Atg29 (residues 60 to 95) showed crosslinking to regions near the N terminus of Atg31 (residues 14 to 54) as well as the C terminus of Atg31 (residues 126 to 150). According to the homology model, the novel Atg29-interacting regions of Atg31 represent either flexible loops or are intrinsically unstructured (Fig. S5B).
Interaction between Atg17 and the Atg13[CTD]
Atg13 has been proposed to serve as a bridging component that mediates the interaction between Atg17 and Atg1 within the Atg1 complex. Atg13 is hyperphosphorylated by TORC1, and other kinases, in nutrient-rich conditions but rapidly dephosphorylated upon starvation and induction of autophagy. It is thought that these dephosphorylation events promote the formation of the Atg1 complex by further enhancing the interactions between Atg13 (and hence Atg17) and Atg1. Because the recombinant pentameric assembly we have purified contains unphosphorylated Atg13[CTD], it likely represents the hypopho-sphorylated or “autophagy-active” state of the complex. Our CXMS analysis reaffirmed the central role Atg13 plays in mediating critical interactions within the pentameric Atg1 complex ().
Figure 3. Atg17-Atg13CTD-Atg1CTD interactions. (A) Schematic summary of peptides identified by CXMS mediating Atg17-Atg13[CTD]-Atg1[CTD] interactions; Atg17 (orange), Atg13[CTD] (green) and Atg1[CTD] (blue). Crosslinked lysine residues are colored red. Domains discovered from the crystal structure (PDB: 41PN) are depicted as white boxes. Crosslinked lysine residues are red while the primary sequence of the crosslinked peptide is marked by a black box. Solid lines indicate regions of primary sequence while dotted lines join intersubunit crosslinks. (B) Proposed model of Atg13[CTD] binding to Atg17. A homology model of Atg17 (PDB: 4HPQ) and Atg1[CTD] (PDB:41PN) were constructed using SWISS homology modeler. Crosslinked lysine residues are shown as red spheres while red lines indicate interprotein crosslinks. Only the major class of crosslinked peptides are depicted (as shown in Table S1); Atg17 (orange), Atg13[CTD] (green) and Atg1[CTD] (MIT1, purple; MIT2, blue).
![Figure 3. Atg17-Atg13CTD-Atg1CTD interactions. (A) Schematic summary of peptides identified by CXMS mediating Atg17-Atg13[CTD]-Atg1[CTD] interactions; Atg17 (orange), Atg13[CTD] (green) and Atg1[CTD] (blue). Crosslinked lysine residues are colored red. Domains discovered from the crystal structure (PDB: 41PN) are depicted as white boxes. Crosslinked lysine residues are red while the primary sequence of the crosslinked peptide is marked by a black box. Solid lines indicate regions of primary sequence while dotted lines join intersubunit crosslinks. (B) Proposed model of Atg13[CTD] binding to Atg17. A homology model of Atg17 (PDB: 4HPQ) and Atg1[CTD] (PDB:41PN) were constructed using SWISS homology modeler. Crosslinked lysine residues are shown as red spheres while red lines indicate interprotein crosslinks. Only the major class of crosslinked peptides are depicted (as shown in Table S1); Atg17 (orange), Atg13[CTD] (green) and Atg1[CTD] (MIT1, purple; MIT2, blue).](/cms/asset/00adef7d-52bf-4bfa-91b0-6ddedfc1716a/kaup_a_1040972_f0003_c.jpg)
Previous yeast 2-hybrid analyses have shown that the central domain of Atg13 (residues 432 to 520) is sufficient for interaction with the N-terminal (residues 1 to 98) and central regions (residues 186 to 236) of Atg17.Citation16,36 More recently, an Atg17 binding region (17BR) of Atg13 was further mapped to residues 424 to 436 through a combination of crystallographic and biochemical methods.Citation23 Our CXMS data showed that the Atg13[CTD] directly crosslinks to Atg17 in the context of the pentameric assembly. The Atg17-Atg13[CTD] interactions represented the most abundant intersubunit peptide group from our dataset (Table S1). Atg13 (residues 388 to 470), which encompasses the 17BR motif, is located in close proximity to, and likely binds, Atg17 (residues 224 to 267) (). This observation is in perfect agreement with the recent data from Fujioka et al. Interestingly, we also observed a large number of crosslinks between Atg17 and regions of the Atg13[CTD] distal to the 17BR, suggesting that other parts of the Atg13[CTD] may play key roles in mediating interaction with Atg17 (). Notably, Atg13 (residues 641 to 661) was found to crosslink to Atg17 with high abundance (Table S1). Based on our homology model, this region of Atg17 that interacts with Atg13 occurs on the convex side of the arc between the distal C terminus and adjacent to the Atg31-Atg29 binding region (). Coprecipitation experiment confirmed that a fragment encompassing this region of Atg13 (residues 630 to 694) interacts very strongly with full-length Atg17 (). We therefore designated this region of Atg13 as 17BR2 (hereafter Atg1317BR2) and renamed 17BR as 17BR1 (Atg1317BR1). Based on our homology model, the part of Atg17 that interacts with Atg1317BR2 is located close to the dimerization region and along the convex side of the arc. Given its unstructured nature, we reasoned that the Atg13[CTD] likely extends itself along the Atg17 scaffold in an N terminus-to-C terminus orientation ().
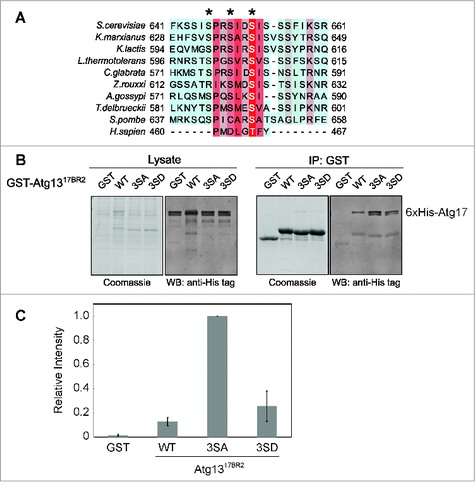
Figure 4. Effects of dephosphorylation on Atg1317BR2 interaction with Atg17. (A) Sequence alignment of the Atg1317BR2 region. (B) In vitro coprecipitation of GST-Atg1317BR2 mutants coexpressed with 6xHis-tagged Atg17. Constructs were expressed in the E. coli T7 express strain. Glutathione agarose was used for precipitation. The western blot was probed using anti-His tag antibody. (C) Quantitative infrared western to compare Atg17 binding affinities of wild-type Atg1317BR2 and mutants. Error bars correspond to standard deviation and were obtained from 3 independent experiments.
Mutating Atg1317BR2 has an effect on Atg17 binding and autophagy
Sequence alignment showed that the serine residues at positions S646, S649 and S652 of Atg1317BR2 are highly conserved among yeast species (). Furthermore, recent phosphoproteomics analysis of S. cerevisiae Atg13 showed that these 3 serine residues are phosphorylated under nonstarvation conditions.Citation23 To determine the effects of phosphorylation on the interaction between Atg1317BR2 and Atg17, we generated nonphosphorylatable ([3SA]) and phosphomimetic ([3SD]) mutations on Atg13 (residues 630 to 694) and analyzed these constructs by coprecipitation experiments. We found that while phosphomimetic mutation (3SD) did not affect the ability of Atg1317BR2 to bind Atg17, the nonphosphorylatable mutation (3SA) significantly enhanced this interaction (). In fact, quantification of the coprecipitation experiments by densitometry revealed a nearly 5-fold increase in association of Atg1317BR2[3SA] with Atg17 over wild-type and phosphomimetic Atg1317BR2[3SD] ().
To assess the effects of mutating Atg1317BR2 on autophagy in vivo, we transformed an atg13Δ yeast strain with a plasmid encoding wild-type Atg13, Atg1317BR2[3SA] or Atg1317BR2[3SD] and monitored the autophagy response using the Pho8Δ60 assay.Citation37 Pho8Δ60 is a truncated form of a vacuolar alkaline phosphatase that is missing an N-terminal transmembrane domain that acts as an uncleaved signal sequence for translocation into the endoplasmic reticulum, and thus remains in the cytosol where it is a substrate for nonselective autophagy. Either form of the enzyme is inactive until the removal of a C-terminal propeptide; therefore, Pho8Δ60 requires delivery to the vacuole for activation. Activation of Pho8Δ60, in cells lacking endogenous Pho8, is therefore a readout for autophagy levels in the cell. The atg13Δ strain exhibited a severe defect in autophagy upon nitrogen starvation, while cells expressing wild-type Atg13 showed an ∼80% restoration of autophagy when compared to wild-type cells transformed with an empty plasmid (). Cells transformed with Atg1317BR2[3SA] exhibited an ∼20% increase in autophagy, whereas those expressing the phosphomimetic Atg1317BR2[3SD] exhibited a 10% reduction in autophagy. These results indicated that the introduction of phosphomimetic mutations in Atg1317BR2 had a negative effect on autophagy.
Figure 5. Phosphorylation of Atg1317BR2 regulates autophagy. (A) Pho8Δ60 wild-type (WLY176) cells were transformed with the pRS315 empty vector; Pho8Δ60 atg13Δ (XLY095) cells were transformed either with empty vector, GFP-Atg13[WT], GFP-Atg1317BR2[3SA] or GFP-Atg1317BR2[3SD] plasmids. Cells were cultured in SMD-leu medium to midlog phase, and then shifted to SD-N medium for 4 h. A Pho8Δ60 assay was performed as described in Materials and Methods. The activity of atg13Δ cells with the GFP-Atg13[WT] plasmid was set to 100% and other values were normalized. Error bars correspond to standard deviation and were obtained from 3 independent experiments. (B) atg13Δ cells were transformed with either GFP-Atg13[WT], GFP-Atg1317BR2[3SA] or GFP-Atg1317BR2[3SD] plasmids. Cells were cultured in SMD-leu medium to midlog phase (growing), and then shifted to SD-N medium for 1 h (starvation). Cell samples were observed by fluorescence microcopy. The images are representative pictures from single Z-sections. Quantification of percentage of cells with puncta is shown as indicated. Scale bar: 2 μm. (C) atg13Δ (XLY095) cells were transformed with either HA-Atg13[WT], HA-Atg1317BR2[3SA] or HA-Atg1317BR2[3SD] plasmids. Cells were cultured in SMD-ura medium to midlog phase and then shifted to SD-N medium for 30 min. Cell lysates were separated by SDS-PAGE and analyzed by western blot with anti-HA antiserum. Pgk1 served as the loading control.
![Figure 5. Phosphorylation of Atg1317BR2 regulates autophagy. (A) Pho8Δ60 wild-type (WLY176) cells were transformed with the pRS315 empty vector; Pho8Δ60 atg13Δ (XLY095) cells were transformed either with empty vector, GFP-Atg13[WT], GFP-Atg1317BR2[3SA] or GFP-Atg1317BR2[3SD] plasmids. Cells were cultured in SMD-leu medium to midlog phase, and then shifted to SD-N medium for 4 h. A Pho8Δ60 assay was performed as described in Materials and Methods. The activity of atg13Δ cells with the GFP-Atg13[WT] plasmid was set to 100% and other values were normalized. Error bars correspond to standard deviation and were obtained from 3 independent experiments. (B) atg13Δ cells were transformed with either GFP-Atg13[WT], GFP-Atg1317BR2[3SA] or GFP-Atg1317BR2[3SD] plasmids. Cells were cultured in SMD-leu medium to midlog phase (growing), and then shifted to SD-N medium for 1 h (starvation). Cell samples were observed by fluorescence microcopy. The images are representative pictures from single Z-sections. Quantification of percentage of cells with puncta is shown as indicated. Scale bar: 2 μm. (C) atg13Δ (XLY095) cells were transformed with either HA-Atg13[WT], HA-Atg1317BR2[3SA] or HA-Atg1317BR2[3SD] plasmids. Cells were cultured in SMD-ura medium to midlog phase and then shifted to SD-N medium for 30 min. Cell lysates were separated by SDS-PAGE and analyzed by western blot with anti-HA antiserum. Pgk1 served as the loading control.](/cms/asset/c6461f09-70db-4c43-adb2-6d0d648b89ee/kaup_a_1040972_f0005_b.gif)
To extend this analysis, we determined if PAS localization of Atg13 was affected by phosphorylation of Atg1317BR2. We expressed GFP-Atg1317BR2[3SA] and [3SD] in the atg13Δ background strain and observed their localization by fluorescence microscopy under starvation conditions. Both mutants were observed as a punctate dot under starvation conditions, and the percentage of cells showing puncta was similar to that seen with wild-type GFP-Atg13, indicating that phosphorylation of Atg1317BR2 does not affect the trafficking of this protein to the PAS (). Finally, to determine the effect of Atg1317BR2 phosphorylation on overall phosphorylation of Atg13, we expressed HA-tagged Atg13 variants in an atg13Δ background strain, grew them under starvation conditions, and analyzed Atg13 by western blotting (). Atg1317BR2[3SA] and Atg1317BR2[3SD] showed similar shifts in molecular weight compared to wild-type Atg13, indicating that these mutations have minimal effect on global phosphorylation of Atg13, and suggesting that the access of Atg13 to inhibitory kinases such as TOR, and activating phosphatases remains unaffected.
Interactions between the Atg13[CTD] and the Atg1[CTD]
For Atg1, CXMS analysis showed that the Atg1[CTD] exclusively crosslinks to the Atg13[CTD] (). This result matches with previous observations that Atg13 acts as a bridge to link Atg1 and Atg17.Citation24 In particular, a peptide spanning residues 454 to 499 of Atg13 was found to crosslink with a C-terminal portion of the Atg1[CTD] domain (residues 861 to 885). This region of Atg13 is distal to 17BR1, one of the 2 binding regions to Atg17 (). Importantly, our observations match almost perfectly with the recent crystallographic and biochemical analyses of the Atg1[CTD] (residues 587 to 897) in complex with a central region of Atg13 (residues 460 to 521).Citation23 In this study, the Atg1[CTD] was found to fold into a pair of canonical microtubule interacting and transport (MIT) domains, each consisting of 3 α-helices, designated MIT1 (α helix 1-3: residues 589 to 766) and MIT2 (α helix 4-6: residues 784 to 897). The crystal lattice showed that Atg1[CTD] formed a dimeric interface through the MIT1 domain. MIT domains interact with MIT interacting motifs (MIMs).Citation38 The Atg13 fragment forms a tandem MIM structure (MIM[N] 460 to 491 and MIM[C] 492 to 521) that associated with the Atg1 MIT domains in an antiparallel fashion, with Atg13 MIM(N) binding to Atg1 MIT2, and Atg13 MIM(C) binding to Atg1 MIT1, respectively. Our CXMS analysis showed that the Atg13 MIM(N) domain crosslinks exclusively with the Atg1 MIT2 domain. Intriguingly, isothermal titration calorimetry and coprecipitation assays have already shown that this interaction is the stronger of the 2 pairs.Citation23 An additional recent study looked into the dynamics of the Atg1[CTD] domain by hydrogen/deuterium exchange coupled with mass spectrometry and showed that the MIT2 domain was more dynamic in solution when compared to the MIT1 domain.Citation39 This observation likely explains the absence of crosslinked peptides between regions of the MIT1 domain and the Atg13[CTD] due to decreased solvent accessibility. Additionally, they also found that the association of the Atg1[CTD] with the Atg13[CTD] greatly limits the flexibility of the Atg1[CTD] domain presumably locking the domain in a single conformation. Only the last α helix (helix 6) in the MIT2 domain was found to be relatively mobile, which matches our observation that the Atg1[CTD] K862 and K877 were the only lysine residues to crosslink with the Atg13[CTD] (; Table S1).
Intramolecular interactions mediating Atg1 complex formation
We further analyzed the intramolecular interactions that occur within each component of the Atg1 complex (Table S2, Fig. S6). A total of 7,328 intramolecular crosslinked peptides were identified from the CXMS analysis. Of these identified peptides, the most abundant group belonged to those found in Atg17 (4,429 peptides). The intramolecular interactions from Atg17 matched well with the previously reported crystal structure,Citation22 suggesting that the unique S-shape architecture of Atg17 is likely preserved in the context of the pentameric assembly. Atg17 is composed of a 3-helix bundle that folds in an antiparallel orientation with a dimerization domain found in the C terminus. Our results showed that intramolecular interactions occurred directly between residues adjacent to each other within the helix bundle. A large abundance of interactions could be classified to occur within distinct regions: between helix 1 and helix 2, in helix 1, and in helix 3, as well as those within the dimerization interface.
The second most represented group belongs to peptides from the Atg13[CTD] (Table S2). A total of 1,296 peptides were identified. These peptides could be grouped into 2 very distinct domains, region 1 (residue 440 to 482) and region 2 (584 to 690). Region 1 encompasses the binding region for Atg1 and Atg17 proposed by Fujioka et al. 2013. Additionally, region 2 encompasses the novel second Atg17 binding region uncovered by our CXMS analysis. These results suggest that extensive intramolecular interactions in these defined regions may promote formation of a binding site for Atg17 and Atg1.
Intramolecular interactions within Atg29 represented another large group of peptides (1,020 peptides). These interactions were found to occur within a defined region in the unstructured C terminus of Atg29 (residues 155 to 181). This region directly crosslinks to, and likely mediates interaction with, Atg17. Fewer intramolecular peptides were observed for Atg31 (23 peptides). Crosslinked peptides from Atg31 were localized primarily in an unstructured loop region (residues 13 to 29) (Fig. S5B). Similarly, few peptides were observed for the Atg1[CTD] (22 peptides). Most intramolecular interactions in the Atg1[CTD] were limited to regions from the MIT1 (589 to 766) domain and the linker region (residues 767 to 784). Based on our homology model of the Atg1[CTD] these crosslinks were observed to occur between α helix 1 and helix 3 of the MIT1 domain.
Visualizing the minimal Atg1 complex by electron microscopy
To confirm the findings from our CXMS analysis and to visualize the overall architecture of the minimal pentameric Atg1 complex, we subjected the purified complex to negative-stain single-particle EM analysis. We have successfully applied this approach to determine the structure of the S. cerevisiae Atg17-Atg31-Atg29 subcomplex.Citation32 We prepared negative-stained specimens by adsorbing purified mini pentamer complex to glow discharged carbon-coated EM grids followed by staining with uranyl formate and visualization by transmission electron microscopy. The class averages revealed elongated architectures reminiscent of the ternary Atg17-Atg31-Atg29 subcomplex confirming that the S-shaped scaffold is maintained in the context of the pentameric assembly (). With the inclusion of the Atg1[CTD] and the Atg13[CTD], we were expecting to observe additional densities along the curved central scaffold. However, virtually no additional features compared to the Atg17-Atg31-Atg29 subcomplex were present ().
Figure 6. Mapping of Atg1[CTD] and Atg13[CTD] in the Atg1 kinase complex pentamer by electron microscopy. (A) EM analysis of the Atg1 kinase complex pentamer. Representative class average of Atg17-Atg31-Atg29 and Atg17-Atg31-Atg29-Atg1[CTD]-Atg13[CTD] complexes with and without gradient fixation (Pentamer, 3,700 particles; GraFix pentamer, 2,787 particles; Atg17-Atg31-Atg29, 1,968 particles). Side length of each panel is 55 nm. (B) Purification of the MBP-Atg1[CTD]-containing pentamer by nickel-affinity and amylose-affinity chromatography. Predicted sizes of protein subunit are labeled on the right. (C) Purification of the MBP-Atg13[CTD]-containing pentamer by nickel-affinity and amylose-affinity chromatography. Predicted sizes of protein subunit are labeled on the right. Missing band for Atg1[CTD] is marked with an asterisk. (D) MBP-Atg1[CTD]-containing pentamer. Representative class averages from 1,471 negatively stained MBP-Atg1[CTD] particles ordered into 100 classes. MBP-Atg13[CTD]-containing pentamer. Representative class averages from 1,702 negatively stained MBP-Atg13[CTD] particles ordered into 100 classes. Side length of each panel is 55 nm. Red arrow in the difference map highlights additional density from MBP.
![Figure 6. Mapping of Atg1[CTD] and Atg13[CTD] in the Atg1 kinase complex pentamer by electron microscopy. (A) EM analysis of the Atg1 kinase complex pentamer. Representative class average of Atg17-Atg31-Atg29 and Atg17-Atg31-Atg29-Atg1[CTD]-Atg13[CTD] complexes with and without gradient fixation (Pentamer, 3,700 particles; GraFix pentamer, 2,787 particles; Atg17-Atg31-Atg29, 1,968 particles). Side length of each panel is 55 nm. (B) Purification of the MBP-Atg1[CTD]-containing pentamer by nickel-affinity and amylose-affinity chromatography. Predicted sizes of protein subunit are labeled on the right. (C) Purification of the MBP-Atg13[CTD]-containing pentamer by nickel-affinity and amylose-affinity chromatography. Predicted sizes of protein subunit are labeled on the right. Missing band for Atg1[CTD] is marked with an asterisk. (D) MBP-Atg1[CTD]-containing pentamer. Representative class averages from 1,471 negatively stained MBP-Atg1[CTD] particles ordered into 100 classes. MBP-Atg13[CTD]-containing pentamer. Representative class averages from 1,702 negatively stained MBP-Atg13[CTD] particles ordered into 100 classes. Side length of each panel is 55 nm. Red arrow in the difference map highlights additional density from MBP.](/cms/asset/abe6a3fa-340b-4a92-ad2d-fd5f118e2935/kaup_a_1040972_f0006_c.jpg)
To circumvent this problem, we applied gradient fixation (GraFix), a technique that combines glycerol gradient centrifugation and limited glutaraldehyde crosslinking and that is often used to improve the stability of globular protein complexes for single-particle EM analysis.Citation40 As a proof of concept, we subjected purified Atg17-Atg31-Atg29 to GraFix treatment and then analyzed the treated complex by negative-stain EM. We found that GraFix treatment did not result in aggregation of the highly extended Atg17-Atg31-Atg29 subcomplex, and 2-dimensional (2D) image analysis further showed that the limited glutaraldehyde crosslinking did not alter the overall structure of this subcomplex (). Results from this experiment clearly demonstrated that GraFix can be successfully applied to other more extended assemblies. We proceeded to negative-stain 2D EM analysis on GraFix-treated pentameric assembly. A direct comparison of the resulting class average with that of Atg17-Atg31-Atg29 revealed that the terminal regions of the central scaffold were slightly enlarged, although we were not able to further define the positions of the Atg1[CTD] and Atg13[CTD] despite each subunit being >30 kDa in size (). We attribute this observation to the inherent flexibility of the components leading to an “averaging” out of density and to the presence of intrinsically unstructured domains that would preclude visualization of these regions.
Subunit organization of the pentameric assembly
To localize the Atg1[CTD] and Atg13[CTD] in the larger pentameric assembly, we used an established EM-based labeling approach that we have previously applied in delineating the subunit arrangement of Atg17-Atg31-Atg29.Citation32 In particular, we fused a His-maltose binding protein (His-MBP) tag to the N terminus of the Atg1[CTD] or Atg13[CTD], generated the coexpression constructs using the pQLINK system, and isolated the His-MBP-labeled pentameric complex by nickel-sepharose and gel filtration chromatography followed by GraFix treatment. The addition of a His-MBP tag should increase the observed molecular mass of tagged components by approximately 42.5 kDa and facilitate visualization by EM. Analysis of the purified complex showed that indeed the addition of the His-MBP tag shifted the molecular mass of both the Atg1[CTD] and Atg13[CTD] to exhibit a band between the 72-kDa and 100-kDa molecular mass markers (). For the His-MBP-Atg1[CTD]-containing complex, bands corresponding to Atg17, Atg31, Atg29, and Atg13[CTD] were clearly observed, while the His-MBP-Atg13[CTD]-containing complex only had bands corresponding to the Atg17-Atg31-Atg29 subcomplex (). These results indicate that the presence of the bulky His-MBP tag at the N terminus of Atg13 might interfere with the interaction with the Atg1[CTD].
The purified complexes were next analyzed by negative-stain EM. For the His-MBP-Atg1[CTD] purified complex, a total of 1,471 particles were analyzed. These results showed that the complex formed an S-shape structure with additional densities appended to the terminal ends of the S-shape, similar to what was observed with the His-MBP-Atg17 labeled complex (). This analysis indicated that His-MBP-Atg1[CTD] is localized close to the terminal regions of the central scaffold. For the His-MBP-Atg13[CTD]-containing complex, the class averages were much better defined and clear densities were again observed appended to the tip regions of the S-shape indicating that MBP-Atg13[CTD] is also localized to this region (). Results from our EM-based subunit mapping correlate well with the proposed regions through which the Atg1[CTD] and Atg13[CTD] interact with Atg17. The N terminus of the Atg13[CTD] domain crosslinks in close proximity to regions at the N terminus of Atg17 along its convex interface. As the Atg1[CTD] directly crosslinks to the Atg13[CTD] and folds into a globular domain, as evidenced by the recently published crystal structure,Citation23 this domain likely localizes in close proximity to the Atg13[CTD] and the N terminus of Atg17.
Discussion
Autophagy is a critical process required for cellular homeostasis. Central to autophagy initiation is the assembly of the Atg1 complex consisting of Atg1, Atg13, Atg17, Atg29, and Atg31. Recent yeast 2-hybrid, biochemical binding, and structural studies have identified several interaction interfaces essential to Atg1 complex assembly and the induction of autophagy. CXMS has emerged as an important structural technique to identify potential subunit interaction interfaces in the context of the intact, fully assembled macromolecular assembly.Citation41-43 Using this novel approach, we were able to comprehensively map the subunit interaction interfaces of a reconstituted minimal Atg1 pentameric complex from the model organism S. cerevisiae (). To our knowledge, this is the first time CXMS has been applied to studying a complex involved in the autophagy pathway. Results from our analysis not only generated further insights into how the different components interact with one another in the context of the fully assembled complex, but they also, in conjunction with single-particle EM analysis, advanced our knowledge on the structural characteristics of the full Atg1 complex.
Figure 7. Proposed model of Atg1 complex formation. (A) Model of the dimeric Atg1 complex. Atg13[CTD] (green) bridges the interaction of Atg1[CTD] (PDB:4P1N, blue) to the Atg17-Atg31-Atg29 subcomplex (PDB: 4HPQ, Atg17 in orange, Atg31 in magenta, Atg29 in pink). Atg13[CTD] lies on the convex region of the Atg17 arc in a N terminus-to-C terminus orientation. This places the Atg13 HORMA domain (gray, PDB: 4J2G) pointing outward from the N terminus of Atg17. (B) Summary of interacting regions in the Atg1 complex. The Atg17-binding regions of Atg13 occur in 2 distinct locations that encompass the Atg13 MIM(N)/MIM(C) regions that associate with Atg1[CTD]. The Atg1317BR1 domain (gray) lies at the N-terminal tip of Atg17 while the Atg1317BR2 domain (green) lies closer to the C-terminal region of Atg17. The unstructured C-terminal domain of Atg29 is proposed to point toward Atg17 and likely wraps around to impinge on the convex portion of the Atg17 arc.
![Figure 7. Proposed model of Atg1 complex formation. (A) Model of the dimeric Atg1 complex. Atg13[CTD] (green) bridges the interaction of Atg1[CTD] (PDB:4P1N, blue) to the Atg17-Atg31-Atg29 subcomplex (PDB: 4HPQ, Atg17 in orange, Atg31 in magenta, Atg29 in pink). Atg13[CTD] lies on the convex region of the Atg17 arc in a N terminus-to-C terminus orientation. This places the Atg13 HORMA domain (gray, PDB: 4J2G) pointing outward from the N terminus of Atg17. (B) Summary of interacting regions in the Atg1 complex. The Atg17-binding regions of Atg13 occur in 2 distinct locations that encompass the Atg13 MIM(N)/MIM(C) regions that associate with Atg1[CTD]. The Atg1317BR1 domain (gray) lies at the N-terminal tip of Atg17 while the Atg1317BR2 domain (green) lies closer to the C-terminal region of Atg17. The unstructured C-terminal domain of Atg29 is proposed to point toward Atg17 and likely wraps around to impinge on the convex portion of the Atg17 arc.](/cms/asset/2aaeaa65-4243-4372-8491-7303a27865b3/kaup_a_1040972_f0007_c.jpg)
Our results show that Atg17 plays a central role in complex assembly. Previous studies have shown that Atg17 forms a stable ternary complex with Atg29 and Atg31,Citation22,29,32 and that complex formation is mediated through a direct interaction of Atg17 with Atg31, which bridges Atg29 to the complex.Citation22,35 Our CXMS data showed that Atg17 not only directly crosslinks to Atg31, it also binds Atg29. The novel Atg17-Atg29 interaction has been further validated through our coprecipitation experiments. This interaction was missed in previous yeast 2-hybrid studies probably because it is relatively weak and it might require Atg29 to adopt a specific conformation that would only be possible in the context of the full Atg1 complex. Our data suggested that Atg17 interacts with the C-terminal region of Atg29. Predicted to be intrinsically unstructured (Fig. S6B), this region of Atg29 had to be excluded to enable previous crystallographic analysis of L. thermotolerans Atg17-Atg31-Atg29. Although largely unstructured, the Atg29 C-terminal domain plays an important role as a key regulatory component of autophagy. Notably, we have shown that this Atg29 domain serves as a phospho-regulatory domain that is highly phosphorylated during autophagy induction and further associates with the PAS organizer Atg11.Citation31 Atg11 is another scaffold protein consisting of primarily coiled-coil domains similar to Atg17. Future work will focus on further defining how phosphorylation affects the strength and specificity of the Atg17-Atg29 interaction.
Atg17 also crosslinks extensively with regions of the Atg13[CTD]. Indeed, the Atg17-Atg13 crosslinked peptides represented the most abundant ones from our CXMS analysis. These peptides defined 2 major Atg17 binding motifs of Atg13: one region spanning residues 388 and 470 and a second region from residue 641 to residue 661. The first region overlaps with the Atg17-binding region (Atg1317BR1: residues 424 to 436), recently identified through a combination of biochemical and cocrystallization approaches.Citation23 We further validated the second Atg17-binding region (residues 641 to 661) and showed this region, which we designated as Atg1317BR2, binds strongly and directly to Atg17. The discovery of a second Atg17-binding region was not completely unexpected as Atg1317BR1 engages in a limited hydrophobic interaction interface that involved only 5 residues of Atg13.Citation23 Stable anchoring of Atg13 to Atg17 will likely require further enhancement in binding affinity and specificity through other regions such as Atg1317BR2.
Both Atg1317BR1 and Atg1317BR2 contain a large number of potential phosphorylation sites that are highly phosphorylated during autophagy-inhibiting conditions. Fujioka et al. show that phosphomimetic mutations introduced to Atg1317BR1 dramatically reduce the binding affinity of Atg13 for Atg17 in vitro. In the case of Atg1317BR2, while we observed no significant effect of phophomimetic mutations targeting 3 conserved phosphorylation sites (S646, S649, and S652) on Atg17 binding in vitro, nonphosphorylatable mutations targeting these same sites resulted in enhanced Atg1317BR2 binding to Atg17. This result was surprising as the Atg1317BR2[3SA] mutant would in theory behave similar to wild-type Atg1317BR2. One possible explanation is that the nonpolar residues introduced by this mutation contribute favorable enthalpic forces to stabilize interaction between Atg1317BR2 and Atg17. Alternatively, the triple alanine mutation might alter folding of the 17BR2 domain in a manner that further enhances binding to Atg17. Analysis of the 17BR2 domain for predicted disordered binding regions (Fig. S7A, ANCHOR) showed that residues encompassing the 17BR2 domain (residue 634 to 684) are predicted to become highly ordered upon associating with a binding partner, a prediction that was substantiated by our intra-crosslink data (Fig. S6).
In spite of these perplexing findings from our in vitro binding studies, the nonphosphorylatable mutations did result in a moderate increase in starvation-induced autophagy in vivo with no effect on Atg13 localization to the PAS and global phosphorylation. Comparatively, wild-type Atg13 exhibited higher autophagy activity than phosphimimetic Atg1317BR2[3SD] despite their similar interaction with Atg17 in vitro. Although our data cannot clearly define a role for Atg1317BR2 phosphorylation, which is likely more complicated than Atg1317BR1, we speculate that this region of Atg13 might work synergistically with other phosphoregulatory regions to regulate complex assembly and autophagy initiation.
Atg31, Atg29, and the Atg13[CTD] contain extensive segments that are predicted to be intrinsically unstructured or disordered regions (IDRs) (Fig. S7). Atg31 contains 2 IDRs while the entire C-terminal half of Atg29 (residue 101 to 213) and the full Atg13[CTD] are predicted to be IDRs. Apart from the 17BR1 of Atg13 and the phosphoregulatory domain near the C terminus of Atg29, the functions of these IDRs in Atg1 complex assembly are not well understood, due in part to technical challenges in characterizing them biochemically and structurally. Our CXMS analysis showed that these IDRs were well represented in our data set. The Atg31 IDR (residue 14 to 54) crosslinked to both Atg17 and Atg29, whereas the C-terminal Atg29 IDR and large portions of Atg13[CTD] crosslinked directly to Atg17. Recent work has highlighted the important role IDRs have in autophagy regulation.Citation44,45 Common to the IDRs of Atg29 and the Atg13[CTD] is the presence of a large number of putative phosphorylation sites. As Atg13 dephosphorylation and Atg29 phosphorylation are required for the initiation of autophagy, these IDRs might mediate transient and selective interactions required for complex formation and/or recruitment of other Atg proteins essential to the execution of autophagy initiation. The system we have established in this work will enable us to determine how subunit phosphorylation affects the structural integrity of the Atg1 complex and if these posttranslational modifications alter the conformations of the proteins within the complex to facilitate recruitment of other Atg proteins.
Materials and Methods
Media and growth conditions
For growing conditions, yeast cells were grown in synthetic minimal medium (SMD; 0.67% yeast nitrogen base, 2% [wt/vol] glucose, and auxotrophic amino acids and vitamins as needed). To induce autophagy, cells were shifted to nitrogen starvation medium (SD-N; 0.17% yeast nitrogen base without ammonium sulfate or amino acids, containing 2% [wt/vol] glucose).
Molecular cloning
The coding regions of S. cerevisiae Atg17, Atg31, Atg29, Atg1[CTD] (589 to 897) and Atg13[CTD] (384-738) were amplified by PCR from yeast genomic DNA. For co-expression of the complex, we used the pQLINK system,Citation46 which allows for co-expression of multiple genes from a single plasmid. The Atg17, Atg1[CTD] and hexa-histidine tagged Atg31 (Atg31-6xHis) were each cloned into a pQLink-N vector by restriction enzyme cloning using the BamHI and NotI sites. Due to the presence of internal BamHI sites, Atg29 and the Atg13[CTD] were cloned using the restriction-free (RF) cloning method,Citation47 or site-directed mutagenesis followed by conventional restriction digestion cloning.
These cloned genes were then linked together in a single vector using the ligase independent cloning (LIC) approach. In brief, acceptor pQLINK plasmid was digested with 10 units of SwaI (NEB, R0604S) at 20°C, resulting in linearization of the vector. Donor pQLINK plasmid was digested with 10 units of PacI (NEB, R0547S) at 37°C to excise the insert gene sequence to be linked. The linearized fragments were then treated with 1.5 units of T4 DNA polymerase (Novagen, 70099) in reaction buffer supplemented with 100 mM DTT and either 25 mM dCTP (for PacI-treated inserts) or 25 mM dGTP (for SwaI-treated vector). The 2 components were annealed at room temperature followed by transformation into E. coli DH5α. Additional components were sequentially added, generating a pQLINK-N vector that contained full-length Atg17, Atg29, Atg31-6xHis, Atg1[CTD], and Atg13[CTD].
The plasmids pATG13(315) and pCuATG13(426) were provided by Dr. Yoshinori Ohsumi (Tokyo Institute of Technology).Citation24 An AvrII site was introduced by site-directed mutagenesis after the start codon of the ATG13 gene in both plasmids. DNA fragments encoding either the green fluorescent protein (GFP) or 3 tandem copies of the hemagglutinin (HA) coding sequences were amplified to contain an XbaI site and ligated into the AvrII site in pATG13(315) and pCuATG13(426), respectively, to create the pGFP-ATG13(315) and pCuHA-ATG13(426) plasmids. The pGFP-ATG13[3SA](315), pGFP-ATG13[3SD](315), pCuHA-ATG13[3SA](426), and pCuHA-ATG13[3SD](426) plasmids were subsequently made by site-directed mutagenesis.
Reconstitution and purification of the S. cerevisiae minimal Atg1 complex
The minimal pentameric Atg1 kinase complex was expressed using a single plasmid constructed with the pQLINK system. Atg31 was C-terminally 6xHis tagged to facilitate the purification procedure. This construct was transformed into the BL21(Rosetta) strain (EMD Millipore, 71401) and induced with 0.25 mM IPTG (Gold Biotechnology, I2481C) at an OD600 of approximately 0.6. Induction was carried out at 37°C for 3 to 4 h. 15 to 20 grams of cells were resuspended in lysis buffer (150 mM NaCl, 50 mM HEPES, pH 8.0, 1 mM PMSF, 0.25 μg/mL DNase (Thermo Scientific, EN0523), 0.25 μg/mL lysozyme (BioShop, LYS702) and lysed by sonication. The lysate was precleared by centrifugation at ∼30,000 x g for 30 min, and the supernatant fraction was incubated with HisPur nickel-NTA resin (Pierce, 88221) at 4°C followed by washes in buffer (150 mM NaCl, 50 mM HEPES, pH 8.0, 20 mM imidazole) and elution with imidazole (150 mM NaCl, 50 mM HEPES, pH 8.0, 100 mM imidazole). The nickel-NTA eluate was concentrated using an Amicon 10K cutoff concentrator (Millipore, UFC801024), and further purified by gel filtration chromatography on a Superose 6 column connected to an ÄKTAprime plus (GE Healthcare). The peak fractions were then analyzed by SDS-PAGE and subsequently used for downstream applications. For the His-MBP tagged minimal pentameric complex, an additional affinity chromatography step was carried out using Amylose resin (NEB, E8021S), and the bound complex was eluted with lysis buffer containing 10 mM maltose (BioShop, MAL212).
Gradient fixation
Gradient fixation of the minimal Atg1 pentameric complex was performed using a procedure adapted from the published method.Citation40 The purified complex was first concentrated using an Amicon 10K cutoff concentrator. The concentrated sample was then overlaid on top of a tube containing a linear 12–24% glycerol (BioShop, GLY004) gradient and a glutaraldehyde gradient (0 to 0.05%; Sigma-Aldrich, G7651) in buffer (150 mM NaCl, 50 mM HEPES, pH 8.0). The tube containing the gradients were centrifuged at 194,085 x g using a SW55 rotor (Beckman Coulter) for 16 h at 4°C followed by fractionation using the Gradient Station (Biocomp Instruments). Peak fractions were determined from SDS-PAGE analysis of fractions from an identical gradient excluding the crosslinker.
Electron microscopy
Negative-stain specimens were prepared as previously described.Citation48 In brief, purified protein samples were adsorbed to glow discharged carbon-coated copper grids (Ted Pella Inc.., G400), stained with 0.75% (w/v) uranyl formate, and air dried. Raw images were recorded at a nominal magnification of 49,000x on a 4K x 4K Eagle charge-coupled device (CCD) camera (FEI, Hillsboro, USA) with a Tecnai Spirit transmission electron microscope (FEI, Hillsboro, USA) operated at an accelerating voltage of 120 kV. Images for 2D analysis were collected at a defocus value of −1.2 μm. For image processing, 2 x 2 pixels were averaged to yield a pixel size of approximately 4.6 Å at the specimen level.
Image processing
For 2D analysis, particles for each data set were interactively selected using Boxer and windowed into a specified box pixel image.Citation49 The selected particles were then translationally aligned, and subjected to 10 cycles of multireference alignment using SPIDER.Citation50 Each round of alignment was followed by K-means classification specifying either 50 or 100 classes. This procedure was carried out for each data set with the following number of particles selected for each: Atg17-Atg31-Atg29 (10,251 particles, 112 pixels), Atg17-Atg31-Atg29-Atg1[CTD]-Atg13[CTD] (3,700 particles, 120 pixels), GraFix-treated Atg17-Atg31-Atg29 (1,968 particles, 112 pixels), GraFix-treated Atg17-Atg31-Atg29-Atg1[CTD]-Atg13[CTD] (2,787 particles, 120 pixels), GraFix-treated MBP-Atg1[CTD]-containing pentamer (1,471 particles, 132 pixels), GraFix-treated MBP-Atg13[CTD]-containing pentamer (1,702 particles, 132 pixels).
Chemical crosslinking and mass spectrometry
The purified complex was subjected to chemical crosslinking using BSCitation3 (Thermo Scientific, 21585) or DSS (Thermo Scientific, 21658) dissolved in water and 100% DMSO, respectively. Twenty μg of protein was used in each crosslinking reaction with either 50-, 100-, or 150-times molar excess of crosslinker. The crosslinking reaction was conducted at room temperature for 1 h before it was quenched with 50 mM Tris-HCl, pH 8.0 for 20 min at room temperature. The samples were precipitated using 25% TCA and left on ice overnight. Precipitated proteins were washed with ice-cold acetone and air-dried. One set of TCA precipitates was digested with Lys-C (Promega, V1071) and trypsin (Sigma, T6567) as described before.Citation33 Another set of TCA precipitates was separated on 5-20% gradient gels (Bio-Rad, 161-1393) followed by Coomassie brilliant blue G-250 staining. The higher molecular weight band corresponding to the crosslinked complex was excised and digested in gel with 5 ng/μL Lys-C and 10 ng/μL trypsin following an established protocol.Citation51
Digestion products were analyzed on a Q-Exactive mass spectrometer (ThermoFisher Scientific, Waltham, USA) interfaced with an Easy nano-LC 1000 liquid chromatography system (ThermoFisher Scientific, Waltham, USA). Digested peptides (∼0.5 μg) were loaded onto a 75 mm x 6 cm trap column that was packed with 10 mm, 120 Å ODS-AQ C18 resin (YMC Co.) and connected through a microTee to a 75 mm x 10 cm analytical column packed with 1.8 mm, 120 Å UHPLC-XB-C18 resin (Welch Materials Inc.). After desalting, peptides were separated over an 80-min linear gradient from 100% buffer A (0.1% formic acid) to 30% buffer B (100% acetonitrile, 0.1% formic acid), followed by a 10-min gradient from 30% to 80% buffer B, then reaching 100% buffer B in the next 1 min, maintaining at 100% buffer B for 2 min before returning to 100% buffer A in 3 min and ending with a 4-min 100% buffer A wash. The flow rate was 250 nL/min. The MS parameters: top 10 most intense ions were selected for HCD dissociation; R = 140,000 in full scan, R = 17,500 in HCD scan; AGC targets were 1e6 for FTMS full scan, 5e4 for MS2; minimal signal threshold for MS2 = 4e4; precursors having a charge state of +1, +2, > +8 or unassigned were excluded; normalized collision energy, 27; peptide match, preferred.
CXMS data analysis using pLink
Using the pLink search engine,Citation33 crosslinked peptides were identified by searching the mass spec data against a database containing the protein sequences of Atg1, Atg13, Atg17, Atg31, Atg29, Lys-C and trypsin. The pLink search parameters were: maximum number of missed cleavages (excluding the crosslinking site) = 3; min peptide length = 4 amino acids; fixed modification = cysteine carbamidomethylation. The search results were filtered by requiring ≤ 10-ppm mass deviation between an observed precursor mass and the monoisotopic, or the first, second, third, or fourth isotopic mass of the matched candidate, E-value < 0.0001, false-discovery rate (FDR) < 0.05 and spectra count ≥ 2.
Homology modeling
SWISS-MODEL was used to construct a homology model of S. cerevisiae Atg17 based on the crystal structure of the orthologous complex from L. thermotolerans (PDB: 4HPQ),Citation52 while a homology model of the Atg1[CTD] was constructed from the crystal structure from K. marxianus (PDB: 4P1N).
Coprecipitation experiment
Protein-protein interactions were detected by co-expressing a bait (6xHis tagged Atg17) and prey (glutathione S-transferase [GST]-tagged proteins) from a single pQLINK vector system. The bait protein, Atg17, was cloned into pQLINK-H using the BamHI and NotI sites to N-terminally 6xHis tag Atg17. Atg29, and Atg1317BR2 (wild type and mutants) were cloned into the pQLINK-G2 vector using the BamHI and NotI sites. Atg29 contains internal BamHI sites, which were removed by site-directed mutagenesis prior to restriction digestion cloning into the pQLINK-G2 vector. GST-tagged proteins were then linked to the pQLINK-H-Atg17 vector using the method described above.
Binary interactions were examined by transforming the 2-gene constructs into the T7 express strain (NEB, C2566I) and induced with 0.5 mM IPTG at an OD600 of approximately 0.6. Induction was carried out at 16°C for 18 h. Approximately 0.5 g of cells were resuspended in lysis buffer (150 mM NaCl, 50 mM Tris-HCl, pH 8.0, 2 mM PMSF, 250 μg/mL lysozyme, 0.1% Triton X-100 (BioShop, TRX777), 5% glycerol, 0.5 mM DTT) and lysed by sonication. The lysate was precleared by centrifugation at ∼30,000 x g for 30 min, and the supernatant fraction was incubated with 100 μl of 25% slurry Glutathione resin (Genscript, L00206) at 4°C followed by washes in buffer (150 mM NaCl, 50 mM Tris-HCl, pH 8.0, 0.1% Triton X-100, 5% glycerol, 0.5 mM DTT). 60 μl of 2x SDS-loading buffer was added to the glutathione resin and samples were boiled at 95°C for 10 min. Samples were analyzed by western blotting using 1:2,000 anti-His antibody (ABM, G020).
Quantitative western blot
Quantifications on western blots were performed using secondary antibody labeled with near-infrared (IR) dye. Membranes were blocked for 1 h with Odyssey blocker (LI-COR Biosciences, LIC-927-40100), incubated with anti-His antibody for 1 h, washed 4 x 5 min in phosphate-buffered saline (PBS; BioShop, PBS404) + 0.1% Tween 20 (BioShop, TWN510) (PBST) before incubating with 1:15,000 donkey anti-mouse IgG conjugated with an IR dye 680LT (LI-COR Biosciences, 926-68022). Membranes were washed 4 x 5 min in PBST and scanned together using the Odyssey Infrared Imaging System (CLx) in the 700 nm channel at 169 μm resolution. Quantification analysis was performed using the software provided (Odyssey V 3.0).
Fluorescence microscopy
For fluorescence microscopy, yeast cells were grown to mid-log phase in SMD-leu medium and shifted to SD-N to induce autophagy. Samples were then examined as previously described.Citation31
Autophagy assay
The Pho8Δ60 assay was conducted as described previously.Citation37
Disclosure of Potential Conflicts of Interest
No potential conflicts of interest were disclosed.
1040972_Supplemental_Figs.pdf
Download PDF (575.5 KB)Acknowledgments
This work was supported by an operating grant from the Canadian Institutes of Health Research (MOP-126126), a Michael Smith Foundation for Health Research (MSFHR) Career Investigator Award, a Canadian Institutes of Health Research New Investigator Award, an infrastructure grant from the Canadian Foundation for Innovation (CFI), startup funds from the University of British Columbia to CKY, NIH grant GM053396 to DJK, and a postgraduate scholarship award from the Natural Sciences and Engineering Research Council of Canada to LHC.
References
- Lamb CA, Yoshimori T, Tooze SA. The autophagosome: origins unknown, biogenesis complex. Nat Rev Mol Cell Biol 2013; 14:759-74; PMID:24201109; http://dx.doi.org/10.1038/nrm3696
- Mizushima N, Yoshimori T, Ohsumi Y. The role of Atg proteins in autophagosome formation. Annu Rev Cell Dev Biol 2011; 27:107-32; PMID:21801009; http://dx.doi.org/10.1146/annurev-cellbio-092910-154005
- Reggiori F, Klionsky DJ. Autophagic processes in yeast: mechanism, machinery and regulation. Genetics 2013; 194:341-61; PMID:23733851; http://dx.doi.org/10.1534/genetics.112.149013
- Mizushima N, Levine B. Autophagy in mammalian development and differentiation. Nat Cell Biol 2010; 12:823-30; PMID:20811354; http://dx.doi.org/10.1038/ncb0910-823
- Choi AM, Ryter SW, Levine B. Autophagy in human health and disease. N Engl J Med 2013; 368:1845-6; PMID:23656658; http://dx.doi.org/10.1056/NEJMra1205406
- Mizushima N, Levine B, Cuervo AM, Klionsky DJ. Autophagy fights disease through cellular self-digestion. Nature 2008; 451:1069-75; PMID:18305538; http://dx.doi.org/10.1038/nature06639
- Hutchins MU, Klionsky DJ. Vacuolar localization of oligomeric alpha-mannosidase requires the cytoplasm to vacuole targeting and autophagy pathway components in Saccharomyces cerevisiae. J Biol Chem 2001; 276:20491-8; PMID:11264288; http://dx.doi.org/10.1074/jbc.M101150200
- Klionsky DJ, Cueva R, Yaver DS. Aminopeptidase I of Saccharomyces cerevisiae is localized to the vacuole independent of the secretory pathway. J Cell Biol 1992; 119:287-99; PMID:1400574; http://dx.doi.org/10.1083/jcb.119.2.287
- Yuga M, Gomi K, Klionsky DJ, Shintani T. Aspartyl aminopeptidase is imported from the cytoplasm to the vacuole by selective autophagy in Saccharomyces cerevisiae. J Biol Chem 2011; 286:13704-13; PMID:21343297; http://dx.doi.org/10.1074/jbc.M110.173906
- Klionsky DJ, Cregg JM, Dunn WA, Jr., Emr SD, Sakai Y, Sandoval IV, Sibirny A, Subramani S, Thumm M, Veenhuis M, et al. A unified nomenclature for yeast autophagy-related genes. Dev Cell 2003; 5:539-45; PMID:14536056; http://dx.doi.org/10.1016/S1534-5807(03)00296-X
- Sun LL, Li M, Suo F, Liu XM, Shen EZ, Yang B, Dong MQ, He WZ, Du LL. Global analysis of fission yeast mating genes reveals new autophagy factors. PLoS Genet 2013; 9:e1003715; PMID:23950735; http://dx.doi.org/10.1371/journal.pgen.1003715
- Takeshige K, Baba M, Tsuboi S, Noda T, Ohsumi Y. Autophagy in yeast demonstrated with proteinase-deficient mutants and conditions for its induction. J Cell Biol 1992; 119:301-11; PMID:1400575; http://dx.doi.org/10.1083/jcb.119.2.301
- Tsukada M, Ohsumi Y. Isolation and characterization of autophagy-defective mutants of Saccharomyces cerevisiae. FEBS Lett 1993; 333:169-74; PMID:8224160; http://dx.doi.org/10.1016/0014-5793(93)80398-E
- Suzuki K, Akioka M, Kondo-Kakuta C, Yamamoto H, Ohsumi Y. Fine mapping of autophagy-related proteins during autophagosome formation in Saccharomyces cerevisiae. J Cell Sci 2013; 126:2534-44; PMID:23549786; http://dx.doi.org/10.1242/jcs.122960
- Suzuki K, Kubota Y, Sekito T, Ohsumi Y. Hierarchy of Atg proteins in pre-autophagosomal structure organization. Genes Cells 2007; 12:209-18; PMID:17295840; http://dx.doi.org/10.1111/j.1365-2443.2007.01050.x
- Cheong H, Nair U, Geng J, Klionsky DJ. The Atg1 kinase complex is involved in the regulation of protein recruitment to initiate sequestering vesicle formation for nonspecific autophagy in Saccharomyces cerevisiae. Mol Biol Cell 2008; 19:668-81; PMID:18077553; http://dx.doi.org/10.1091/mbc.E07-08-0826
- Yeh YY, Shah KH, Chou CC, Hsiao HH, Wrasman KM, Stephan JS, Stamatakos D, Khoo KH, Herman PK. The identification and analysis of phosphorylation sites on the Atg1 protein kinase. Autophagy 2011; 7:716-26; PMID:21460632; http://dx.doi.org/10.4161/auto.7.7.15155
- Papinski D, Schuschnig M, Reiter W, Wilhelm L, Barnes CA, Maiolica A, Hansmann I, Pfaffenwimmer T, Kijanska M, Stoffel I, et al. Early steps in autophagy depend on direct phosphorylation of Atg9 by the Atg1 kinase. Mol Cell 2014; 53:471-83; PMID:24440502; http://dx.doi.org/10.1016/j.molcel.2013.12.011
- Russell RC, Tian Y, Yuan H, Park HW, Chang YY, Kim J, Kim H, Neufeld TP, Dillin A, Guan KL. ULK1 induces autophagy by phosphorylating Beclin-1 and activating VPS34 lipid kinase. Nat Cell Biol 2013; 15:741-50; PMID:23685627; http://dx.doi.org/10.1038/ncb2757
- Yeh YY, Wrasman K, Herman PK. Autophosphorylation within the Atg1 activation loop is required for both kinase activity and the induction of autophagy in Saccharomyces cerevisiae. Genetics 2010; 185:871-82; PMID:20439775; http://dx.doi.org/10.1534/genetics.110.116566
- Chan EY, Longatti A, McKnight NC, Tooze SA. Kinase-inactivated ULK proteins inhibit autophagy via their conserved C-terminal domains using an Atg13-independent mechanism. Mol Cell Biol 2009; 29:157-71; PMID:18936157; http://dx.doi.org/10.1128/MCB.01082-08
- Ragusa MJ, Stanley RE, Hurley JH. Architecture of the Atg17 complex as a scaffold for autophagosome biogenesis. Cell 2012; 151:1501-12; PMID:23219485; http://dx.doi.org/10.1016/j.cell.2012.11.028
- Fujioka Y, Suzuki SW, Yamamoto H, Kondo-Kakuta C, Kimura Y, Hirano H, Akada R, Inagaki F, Ohsumi Y, Noda NN. Structural basis of starvation-induced assembly of the autophagy initiation complex. Nat Struct Mol Biol 2014; 21:513-21; PMID:24793651; http://dx.doi.org/10.1038/nsmb.2822
- Kamada Y, Funakoshi T, Shintani T, Nagano K, Ohsumi M, Ohsumi Y. Tor-mediated induction of autophagy via an Apg1 protein kinase complex. J Cell Biol 2000; 150:1507-13; PMID:10995454; http://dx.doi.org/10.1083/jcb.150.6.1507
- Stephan JS, Yeh YY, Ramachandran V, Deminoff SJ, Herman PK. The Tor and PKA signaling pathways independently target the Atg1/Atg13 protein kinase complex to control autophagy. Proc Natl Acad Sci U S A 2009; 106:17049-54; PMID:19805182; http://dx.doi.org/10.1073/pnas.0903316106
- Kraft C, Kijanska M, Kalie E, Siergiejuk E, Lee SS, Semplicio G, Stoffel I, Brezovich A, Verma M, Hansmann I, et al. Binding of the Atg1/ULK1 kinase to the ubiquitin-like protein Atg8 regulates autophagy. EMBO J 2012; 31:3691-703; PMID:22885598; http://dx.doi.org/10.1038/emboj.2012.225
- Jao CC, Ragusa MJ, Stanley RE, Hurley JH. A HORMA domain in Atg13 mediates PI 3-kinase recruitment in autophagy. Proc Natl Acad Sci U S A 2013; 110:5486-91; PMID:23509291; http://dx.doi.org/10.1073/pnas.1220306110
- Karanasios E, Stapleton E, Manifava M, Kaizuka T, Mizushima N, Walker SA, Ktistakis NT. Dynamic association of the ULK1 complex with omegasomes during autophagy induction. J Cell Sci 2013; 126:5224-38; PMID:24013547; http://dx.doi.org/10.1242/jcs.132415
- Kabeya Y, Noda NN, Fujioka Y, Suzuki K, Inagaki F, Ohsumi Y. Characterization of the Atg17-Atg29-Atg31 complex specifically required for starvation-induced autophagy in Saccharomyces cerevisiae. Biochem Biophys Res Commun 2009; 389:612-5; PMID:19755117; http://dx.doi.org/10.1016/j.bbrc.2009.09.034
- Kawamata T, Kamada Y, Kabeya Y, Sekito T, Ohsumi Y. Organization of the pre-autophagosomal structure responsible for autophagosome formation. Mol Biol Cell 2008; 19:2039-50; PMID:18287526; http://dx.doi.org/10.1091/mbc.E07-10-1048
- Mao K, Chew LH, Inoue-Aono Y, Cheong H, Nair U, Popelka H, Yip CK, Klionsky DJ. Atg29 phosphorylation regulates coordination of the Atg17-Atg31-Atg29 complex with the Atg11 scaffold during autophagy initiation. Proc Natl Acad Sci U S A 2013; 110:E2875-84; PMID:23858448; http://dx.doi.org/10.1073/pnas.1300064110
- Chew LH, Setiaputra D, Klionsky DJ, Yip CK. Structural characterization of the Saccharomyces cerevisiae autophagy regulatory complex Atg17-Atg31-Atg29. Autophagy 2013; 9:1467-74; PMID:23939028; http://dx.doi.org/10.4161/auto.25687
- Yang B, Wu YJ, Zhu M, Fan SB, Lin J, Zhang K, Li S, Chi H, Li YX, Chen HF, et al. Identification of cross-linked peptides from complex samples. Nat Methods 2012; 9:904-6; PMID:22772728; http://dx.doi.org/10.1038/nmeth.2099
- Merkley ED, Rysavy S, Kahraman A, Hafen RP, Daggett V, Adkins JN. Distance restraints from crosslinking mass spectrometry: mining a molecular dynamics simulation database to evaluate lysine-lysine distances. Protein Sci 2014; 23:747-59; PMID:24639379; http://dx.doi.org/10.1002/pro.2458
- Cao Y, Nair U, Yasumura-Yorimitsu K, Klionsky DJ. A multiple ATG gene knockout strain for yeast two-hybrid analysis. Autophagy 2009; 5:699-705; PMID:19337029; http://dx.doi.org/10.4161/auto.5.5.8382
- Kabeya Y, Kamada Y, Baba M, Takikawa H, Sasaki M, Ohsumi Y. Atg17 functions in cooperation with Atg1 and Atg13 in yeast autophagy. Mol Biol Cell 2005; 16:2544-53; PMID:15743910; http://dx.doi.org/10.1091/mbc.E04-08-0669
- Noda T, Klionsky DJ. The quantitative Pho8Delta60 assay of nonspecific autophagy. Methods Enzymol 2008; 451:33-42; PMID:19185711; http://dx.doi.org/10.1016/S0076-6879(08)03203-5
- Hurley JH, Yang D. MIT domainia. Dev Cell 2008; 14:6-8; PMID:18194647; http://dx.doi.org/10.1016/j.devcel.2007.12.013
- Stjepanovic G, Davies CW, Stanley RE, Ragusa MJ, Kim do J, Hurley JH. Assembly and dynamics of the autophagy-initiating Atg1 complex. Proc Natl Acad Sci U S A 2014; 111:12793-8; PMID:25139988; http://dx.doi.org/10.1073/pnas.1407214111
- Kastner B, Fischer N, Golas MM, Sander B, Dube P, Boehringer D, Hartmuth K, Deckert J, Hauer F, Wolf E, et al. GraFix: sample preparation for single-particle electron cryomicroscopy. Nat Methods 2008; 5:53-5; PMID:18157137; http://dx.doi.org/10.1038/nmeth1139
- Bui KH, von Appen A, DiGuilio AL, Ori A, Sparks L, Mackmull MT, Bock T, Hagen W, Andrés-Pons A, Glavy JS, et al. Integrated structural analysis of the human nuclear pore complex scaffold. Cell 2013; 155:1233-43; PMID:24315095; http://dx.doi.org/10.1016/j.cell.2013.10.055
- Nguyen VQ, Ranjan A, Stengel F, Wei D, Aebersold R, Wu C, Leschziner AE. Molecular architecture of the ATP-dependent chromatin-remodeling complex SWR1. Cell 2013; 154:1220-31; PMID:24034246; http://dx.doi.org/10.1016/j.cell.2013.08.018
- Tosi A, Haas C, Herzog F, Gilmozzi A, Berninghausen O, Ungewickell C, Gerhold CB, Lakomek K, Aebersold R, Beckmann R, et al. Structure and subunit topology of the INO80 chromatin remodeler and its nucleosome complex. Cell 2013; 154:1207-19; PMID:24034245; http://dx.doi.org/10.1016/j.cell.2013.08.016
- Mei Y, Su M, Soni G, Salem S, Colbert CL, Sinha SC. Intrinsically disordered regions in autophagy proteins. Proteins 2014; 82:565-78; PMID:24115198; http://dx.doi.org/10.1002/prot.24424
- Popelka H, Uversky VN, Klionsky DJ. Identification of Atg3 as an intrinsically disordered polypeptide yields insights into the molecular dynamics of autophagy-related proteins in yeast. Autophagy 2014; 10:1093-104; PMID:24879155; http://dx.doi.org/10.4161/auto.28616
- Scheich C, Kummel D, Soumailakakis D, Heinemann U, Bussow K. Vectors for co-expression of an unrestricted number of proteins. Nucleic Acids Res 2007; 35:e43; PMID:17311810; http://dx.doi.org/10.1093/nar/gkm067
- van den Ent F, Lowe J. RF cloning: a restriction-free method for inserting target genes into plasmids. J Biochem Biophys Methods 2006; 67:67-74; PMID:16480772; http://dx.doi.org/10.1016/j.jbbm.2005.12.008
- Ohi M, Li Y, Cheng Y, Walz T. Negative Staining and Image Classification - Powerful Tools in Modern Electron Microscopy. Biol Proced Online 2004; 6:23-34; PMID:15103397; http://dx.doi.org/10.1251/bpo70
- Ludtke SJ, Baldwin PR, Chiu W. EMAN: semiautomated software for high-resolution single-particle reconstructions. J Struct Biol 1999; 128:82-97; PMID:10600563; http://dx.doi.org/10.1006/jsbi.1999.4174
- Frank J, Radermacher M, Penczek P, Zhu J, Li Y, Ladjadj M, Leith A. SPIDER and WEB: processing and visualization of images in 3D electron microscopy and related fields. J Struct Biol 1996; 116:190-9; PMID:8742743; http://dx.doi.org/10.1006/jsbi.1996.0030
- Coffman K, Yang B, Lu J, Tetlow AL, Pelliccio E, Lu S, Guo DC, Tang C, Dong MQ, Tamanoi F. Characterization of the Raptor/4E-BP1 interaction by chemical cross-linking coupled with mass spectrometry analysis. J Biol Chem 2014; 289:4723-34; PMID:24403073; http://dx.doi.org/10.1074/jbc.M113.482067
- Biasini M, Bienert S, Waterhouse A, Arnold K, Studer G, Schmidt T, Kiefer F, Cassarino TG, Bertoni M, Bordoli L, et al. SWISS-MODEL: modelling protein tertiary and quaternary structure using evolutionary information. Nucleic Acids Res 2014; 42:W252-8; PMID:24782522; http://dx.doi.org/10.1093/nar/gku340