
Abstract
Autophagy involves massive degradation of intracellular components and functions as a conserved system that helps cells to adapt to adverse conditions. In mammals, hypoxia rapidly stimulates autophagy as a cell survival response. Here, we examine the function of autophagy in the regulation of the plant response to submergence, an abiotic stress that leads to hypoxia and anaerobic respiration in plant cells. In Arabidopsis thaliana, submergence induces the transcription of autophagy-related (ATG) genes and the formation of autophagosomes. Consistent with this, the autophagy-defective (atg) mutants are hypersensitive to submergence stress and treatment with ethanol, the end product of anaerobic respiration. Upon submergence, the atg mutants have increased levels of transcripts of anaerobic respiration genes (alcohol dehydrogenase 1, ADH1 and pyruvate decarboxylase 1, PDC1), but reduced levels of transcripts of other hypoxia- and ethylene-responsive genes. Both submergence and ethanol treatments induce the accumulation of reactive oxygen species (ROS) in the rosettes of atg mutants more than in the wild type. Moreover, the production of ROS by the nicotinamide adenine dinucleotide phosphate (NADPH) oxidases is necessary for plant tolerance to submergence and ethanol, submergence-induced expression of ADH1 and PDC1, and activation of autophagy. The submergence- and ethanol-sensitive phenotypes in the atg mutants depend on a complete salicylic acid (SA) signaling pathway. Together, our findings demonstrate that submergence-induced autophagy functions in the hypoxia response in Arabidopsis by modulating SA-mediated cellular homeostasis.
Abbreviations
| 3-MA | = | 3-methyladenine |
| ACBP | = | acyl-CoA-binding protein |
| ADH1 | = | alcohol dehydrogenase 1 |
| AMPK | = | AMP-activated protein kinase |
| CAT1 | = | catalase 1 |
| ConA | = | concanamycin A |
| DAB | = | diaminobenzidine |
| DS | = | dark submergence |
| EDS1 | = | enhanced disease susceptibility 1 |
| EIN2 | = | ethylene insensitive 2 |
| ERFs | = | ethylene response factors |
| ETO1 | = | ethylene overproducer 1 |
| GFP | = | green fluorescent protein |
| GPX1 | = | glutathione peroxidase 1 |
| GR1 | = | glutathione-disulfide reductase 1 |
| GUS | = | β-glucuronidase |
| HB1 | = | hemoglobin 1 |
| HIF1A | = | hypoxia-inducible factor 1, alpha subunit |
| HRA1 | = | hypoxia response attenuator 1 |
| HRE | = | hypoxia responsive ERF |
| HUP43 | = | hypoxia-responsive unknown protein 43 |
| ICS1 | = | isochorismate synthase 1 |
| LDB41 | = | LOB domain-containing protein 41 |
| LS | = | light submergence |
| MDC | = | monodansylcadaverine |
| MV | = | methyl viologen |
| NPR1 | = | non-expressor of PR genes 1 |
| PAD4 | = | phytoalexin deficient 4 |
| PDC1 | = | pyruvate decarboxylase 1 |
| PE | = | phosphatidylethanolamine |
| RAP2 | = | related to AP2 |
| RBOH | = | respiratory burst oxidase homolog |
| ROP | = | Rho-like small G protein |
| RopGAP4 | = | Rop GTPase activating protein 4 |
| ROS | = | reactive oxygen species |
| SA | = | salicylic acid |
| sid2 | = | salicylic acid induction deficient 2 (mutant) |
| SK1 | = | snorkel 1 |
| SnRK1 | = | Snf1-related protein kinase 1 |
| SUB1A | = | submergence 1A |
| SUS1 | = | sucrose synthase 1 |
| TOR | = | target of rapamycin |
| ULK1 | = | unc-51 like autophagy activating kinase 1 |
Introduction
Flooding events, including waterlogging and complete submergence, restrict the diffusion of gases into and out of plant cells, leading to significant reductions of crop productivity and changes in natural ecosystems. In waterlogged nonphotosynthetic roots, continued respiration and constrained gas influx can rapidly induce hypoxia. In submerged shoots, the reduction of light intensity and carbon dioxide diffusion may also decrease the production of photosynthates and oxygen.Citation1-3 To cope with energy shortages during partial or complete submergence and improve their chances of survival, plants have developed various adaptive strategies, including elicitation of ethanolic fermentation for glycolytic ATP production, formation of specific structures that facilitate gas exchange (e.g. aerenchyma and adventitious roots), elongation of shoot organs for oxygen access, and induction of quiescence to reduce energy consumption until reoxygenation.Citation2-6
The phytohormone ethylene functions in early hypoxia sensing, downstream gene regulation, and establishment of adaptive traits.Citation3,7,Citation8 Hypoxic stress upregulates the activities of ethylene biosynthetic enzymes and many ethylene response factors (ERFs), and causes a transient increase in ethylene contents.Citation9-13 Due to the slow diffusion of ethylene in the surrounding water layer, the entrapped ethylene in submerged tissues serves as an effective signal to induce adaptive responses.Citation3,14
Previous studies of Oryza sativa have identified the hypoxia-responsive genes SUB1A (submergence 1A), from indica cultivars and SK1 (snorkel 1) and SK2 from deepwater rice cultivars.Citation11,12,Citation15 Constitutive overexpression of SUB1A in a submergence-sensitive japonica cultivar enhances rice tolerance to submergence by stimulating the expression of ADH1 (alcohol dehydrogenase 1), which encodes the ethanol dehydrogenase enzyme necessary for anaerobic respiration.Citation11,12 Overexpression of SUB1A also suppresses the expression of genes involved in starch breakdown and cell wall loosening,Citation11,12 suggesting that SUB1A promotes a quiescence strategy to conserve energy until floodwaters recede. The SUB1A, SK1, and SK2 transcription factors belong to the same group in the ERF family,Citation16 but SK1 and SK2 regulate hypoxic tolerance of deepwater rice by promoting gibberellin-mediated underwater shoot elongation, an opposite strategy to the quiescence induced by SUB1A.Citation15 Arabidopsis has 5 group VII ERFs, HRE1 (hypoxia responsive erf 1), HRE2, RAP2.2 (related to AP2 2), RAP2.3, and RAP2.12.Citation16 Recent reports reveal that overexpression of HRE1, HRE2, RAP2.2, and RAP2.12 significantly increases the enzyme activity of ADH1 and improves tolerance to hypoxic stress,Citation12,13,Citation17 demonstrating that this group of ERFs has evolutionarily conserved functions that regulate plant survival under hypoxia. More recently, investigations identify ERF-VII transcription factors (TFs), such as RAP2.12, as key components of the oxygen-sensing machinery, functioning through N-end rule-mediated protein degradation.Citation1,18-20 In the proposed model, under normoxic conditions, RAP2.12 is localized at the plasma membrane by its interaction with 2 membrane-associated acyl-CoA-binding proteins, ACBP1 and ACBP2.Citation19 Upon hypoxia, the membrane-anchored RAP2.12 is released and translocated into the nucleus to activate the expression of hypoxia-responsive genes. Under normoxia and reoxygenation, the released RAP2.12 protein is ubiquitinated and proteolytically degraded via the N-end rule pathway.Citation19 The transcription activity of RAP2.12 is further balanced by its own target gene HRA1 (hypoxia response attenuator 1), encoding a trihelix DNA binding protein, via negative feedback regulation.Citation21
Another important signaling pathway regulating plant hypoxia response involves reactive oxygen species (ROS), particularly hydrogen peroxide (H2O2). In mammals, hypoxia activates H2O2 production by a Rho-GTP-dependent mechanism, which subsequently upregulates the expression of HIF1A (hypoxia-inducible factor 1, alpha subunit).Citation22 In plants, ROP (Rho-like small G protein of plant) also regulates the anoxia-inducible accumulation of H2O2 via NADPH oxidase.Citation23 The ROP-triggered elevation of H2O2 levels under anoxia correlates with the increased activity of ADH1.Citation23,24 It has been suggested that both activation and inactivation of ROP signaling in Arabidopsis are required for plant anoxic tolerance via a negative feedback mechanism involving the GTPase activating protein RopGAP4.Citation23,24 Thus, activation of RopGAP4 seems to require a finely controlled balance between ROS-promoted energy supply from ethanolic fermentation and ROS-induced oxidative damage. However, it is still unknown whether the clearance of the ROS-damaged cellular components under hypoxia or anoxia involves other plant stress response pathways.
Autophagy is a highly conserved recycling system in eukaryotic cells, and targets cellular components to the lysosome in animals or to the vacuole in plants and yeast; there, the resident hydrolytic enzymes quickly degrade the targeted components.Citation25,26 Three distinct autophagic types, macroautophagy, microautophagy, and chaperone-mediated autophagy, have been identified.Citation25,26 Recent evidence suggests that only macroautophagy and microautophagy, but not chaperone-mediated autophagy, occur in plant cells.Citation26,27 Among them, the predominant form, macroautophagy (autophagy hereafter), is stimulated at certain developmental stages or by various environmental stresses. During autophagy, cells form double-membrane structures called phagophores to engulf cellular contents and deliver them to the vacuole or lysosome. The phagophores expand and mature into autophagosomes; the outer membrane of the autophagosome fuses with the vacuolar or lysosomal membrane and exposes the inner-membrane contents to the vacuole or lysosome lumen (in plants and yeast the inner vesicle is released into the vacuole lumen and is termed an autophagic body).Citation25,26 In mammals, hypoxia or anoxia and ROS are essential stimuli for induction of autophagy.Citation28 In animal cells, hypoxia-induced autophagy mainly depends on the expression level of HIF1, which activates the expression of the genes encoding 2 BH3-only proteins (BNIP3 and BNIP3L) and interrupts the binding of the negative regulator BCL2 to BECN1/Beclin 1, the core mediator of autophagosome initiation.Citation29 During chronic and acute hypoxia, the transcription of ULK1 (a mammalian ortholog of yeast ATG1) is induced and knockdown of ULK1 sensitizes cells to hypoxic stress, suggesting that ULK1 mediates hypoxia-associated autophagy in mammals.Citation30 In contrast to their vital roles in signaling at low levels, excessive ROS can cause irreversible oxidative damage and cellular dysfunction. This is particularly severe in cells exposed to potentially lethal stresses such as prolonged hypoxia.Citation28 Autophagy (e.g., mitophagy) also removes damaged organelles (e.g., mitochondria) to prevent accumulation of ROS.
Recently, reverse genetic approaches have identified several Arabidopsis autophagy-related (ATG) genes that are essential for autophagosome formation or regulation of autophagy.Citation26,31 In addition to its critical role in plant survival under nutrient starvation, autophagy is required for leaf senescence, plant innate immunity, and the responses to multiple environmental stresses, such as drought, high salt, and oxidative stress.Citation26,32,Citation33 Here, we report that autophagy is required for regulation of the plant response to hypoxia during submergence in Arabidopsis.
Results
Submergence causes an increase in transcript levels of ATGs and induces formation of autophagosomes
To investigate the potential involvement of autophagy in the submergence response, we examined the abundance of ATG transcripts in Arabidopsis rosettes subjected to submergence treatment under constant darkness (DS), with plants subjected to constant darkness (Dark) and the normal light/dark cycle (Light) as controls. Reverse transcription quantitative PCR (qRT-PCR) analyses showed that ATG transcript levels were unchanged under light conditions, and increased under dark conditions (), consistent with previous observations.Citation34 After DS treatment, the transcript levels of all 6 ATG genes increased significantly more than in the dark controls (). We also confirmed the induction of ATG expression by examining transgenic Arabidopsis expressing ATG promoter fusions with the β-glucuronidase (GUS) reporter: ATG7pro-GUS, ATG8epro-GUS, ATG8hpro-GUS, and ATG8ipro-GUS. GUS staining revealed that the expression of all 4 fusions increased after DS or LS (submergence under light conditions) from 6 to 24 h after treatment (Fig. S1A), suggesting that submergence activated autophagy under both DS and LS treatments, 2 submergence conditions leading to hypoxia around the underwater leaves at various times after treatment (Fig. S1B).
Figure 1. Induction of autophagy by submergence. (A) qRT-PCR analyses showing the relative expression of autophagy-related genes (ATG2, ATG5, ATG7, ATG8a, ATG10, and ATG18a) upon submergence. Total RNA was isolated from rosettes of 4-wk-old soil-grown plants upon dark submergence (DS), and from control plants under constant darkness (Dark) and normal light/dark cycle (Light). The samples were harvested at 0, 3, 6, 12, and 24 h after treatment. Transcript levels relative to 0 h for each time point were normalized to the levels of ACT2 (Actin2). The experiments have been repeated 3 times (biological replicates) with similar results and the representative data from one replicate are shown. Data are average values ± SD (n = 3) of 3 technical replicates. Asterisks indicate significant differences from the untreated control (**, P < 0.01 by the Student t test). (B) GFP fluorescence in the root cells of GFP-ATG8e transformants under Light and light submergence (LS) conditions. One-wk-old Arabidopsis seedlings expressing GFP-ATG8e were not treated or LS-treated for 6 h with (+ConA) or without concanamycin A (−ConA) and visualized by confocal microscopy. Scale bar: 50 μm. (C) Immunoblot analysis showing the processing of GFP-ATG8e under Light, and upon LS, DS, and Dark treatments. Leaves from 4-wk-old plants were collected at 0, 6, 12, 24, and 48 h after treatment (hpt) and anti-GFP antibodies were used for immunoblotting. The GFP-ATG8e fusion and free GFP form are indicated on the right. Coomassie blue–stained total proteins are shown below the blots to indicate the amount of protein loaded per lane.
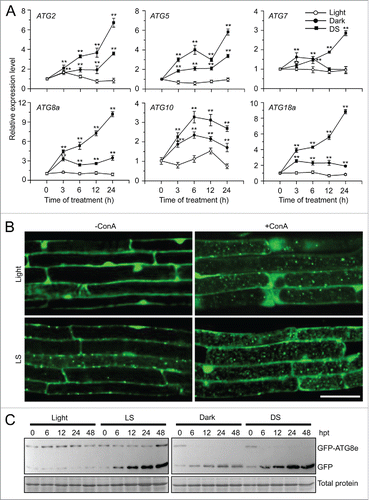
To elucidate the response of autophagy to submergence, we examined autophagosome formation under submergence (LS); to this end, we used green fluorescent protein (GFP)-tagged ATG8e as a marker.Citation35 Seven-d-old seedlings expressing GFP-ATG8e were submergence-treated for 6 h with or without concanamycin A (ConA), which inhibits degradation of autophagic bodies in the vacuoles,Citation36 and the GFP fluorescence was then observed by confocal microscopy. The green fluorescence from GFP-ATG8e labeled punctate structures, autophagosome structures or their intermediates, which appeared in the root cells after submergence treatment; by contrast, the root cells of air-grown seedlings had few such punctate structures (). Autophagic bodies were detected in the vacuoles in the root cells of air-grown seedlings treated with ConA and these bodies accumulated in the root cells of submerged seedlings (). Under carbon or nitrogen starvation, ATG8 proteins are lipidated with phosphatidylethanolamine (PE) to form the autophagosome and subsequently fuse with the vacuolar membrane to transport the autophagic bodies into the vacuole. During this process, degradation of GFP-ATG8e releases free, relatively stable GFP, which accumulates to high levels depending on the rate of autophagy.Citation37,38 As shown in , submergence (LS and DS) treatments enhanced the degradation of GFP-ATG8e, as measured by the accumulation of free GFP, in comparison to the light and dark controls.
Autophagy-deficient mutants are hypersensitive to submergence
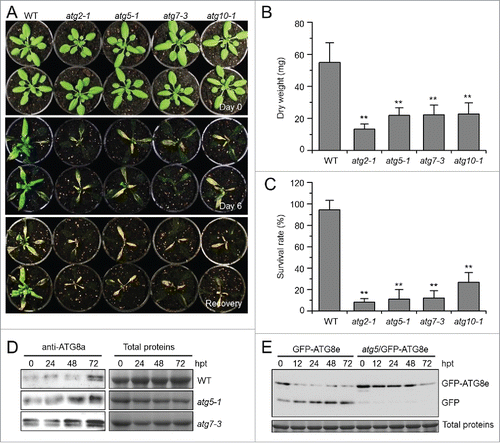
To assess the cellular function of autophagy in the submergence response, we characterized 4 autophagy-deficient mutants, atg2-1, atg5-1, atg7-3, and atg10-1, from the SALK and SAIL T-DNA insertion pools (Figs. S2 and S3) and tested their responses to submergence. The 4-wk-old atg mutants showed few phenotypic differences to the wild type under normal growth conditions. When the plants were LS-treated for 6 d or DS-treated for 2 d, all atg mutants displayed enhanced sensitivity to both treatments (; Fig. S4A), while 2-d dark treatment alone did not cause obvious phenotypic differences between the wild type and atg mutants (Fig. S4A). Following recovery for 6 d, the atg mutants showed significant hypersensitivity to submergence under LS and DS conditions, in comparison to the wild-type control, as shown by calculating the dry weights and survival rates of the plants (; Fig. S4A and S4B). Moreover, when the plants were treated with LS for various times, we clearly observed damage in the atg mutant leaves at 3 d after treatment in comparison to the wild type, which showed little damage (Fig. S5).
Figure 2. Autophagy-defective mutants show enhanced sensitivity to submergence. (A) Images of the wild type (WT) and atg mutants (atg2-1, atg5-1, atg7-3, and atg10-1) before treatment (Day 0) and at 6 d after light submergence (LS) treatment (Day 6), followed by a 6-d recovery (Recovery). (B) Dry weights and (C) survival rates of WT and atg mutants (atg2-1, atg5-1, atg7-3, and atg10-1) after 6-d LS treatment following recovery. Data of dry weights and survival rates are average values ± SD (n = 3) calculated from 3 independent experiments. For each experiment, 10 plants were used for each genotype. Asterisks indicate significant differences from WT (**, P < 0.01 by the Student t test). (D) Immunoblot analyses of ATG8 protein in WT and atg mutants (atg5-1 and atg7-3) upon LS treatment. Four-wk-old plants were not treated (0 h) and LS-treated for 24, 48, and 72 h, and leaves were collected. The anti-ATG8a antibodies were used for immunoblotting. (E) Detection of free GFP generated from transgenic lines expressing GFP-ATG8e in WT, atg5-1 backgrounds before and after LS treatment. Four-wk-old plant samples were collected at 0, 12, 24, and 48 h after treatment. The anti-GFP antibodies were used for protein blotting analysis. The GFP-ATG8e fusion and free GFP form were indicated on the right. Coomassie blue–stained total proteins are shown on the right (D) or below the blots (E) to indicate the amount of protein loaded per lane.
To address the response of atg mutants to low-oxygen treatment, the 1-wk-old wild type, atg2-1, atg5-1, atg7-3, and atg10-1 seedlings were placed into a chamber with 0.5% oxygen atmosphere in the dark for 6 h. After 5 d of recovery, the wild-type seedlings, the untreated and dark-treated controls showed little difference, but most of the atg mutants displayed severe injuries, including whitening of their cotyledons (Fig. S4C).
To test whether submergence affected ATG8 protein accumulation and lipidation in atg mutants, antibodies against ATG8a and GFP were used to detect ATG8 and GFP-ATG8e by immunoblotting. The protein levels of ATG8 increased in the wild type upon submergence, and accumulated to higher levels in the atg mutants (), probably due to blockage of ATG8 protein turnover when autophagy is impaired.Citation34,39,Citation40 When the GFP-ATG8e fusion was expressed in the wild type and atg mutants, free GFP was generated in wild-type plants under submergence, but not in the atg5 mutants with similar treatment ().
Differential expression of the hypoxia- and ethylene-responsive genes in the atg mutants upon submergence
To further examine the role of autophagy in submergence response, qRT-PCR was used to measure the expression of the hypoxia marker genes ADH1, pyruvate decarboxylase 1 (PDC1), and sucrose synthase 1 (SUS1) Citation41 in the wild type, atg5-1, and atg7-3 mutants at 0, 3, 6, and 24 h after submergence treatment. We also measured the expression of hemoglobin 1 (HB1), hypoxia-responsive unknown protein 43 (HUP43), and lob domain-containing protein 41 (LDB41), which have been suggested to be hypoxia-responsive genes.Citation19 As shown in , the transcripts of ADH1, PDC1, LBD41, and HUP43 were upregulated in atg5-1 and atg7-3 mutants under normal conditions, while those of SUS1 and HB1 were unchanged in comparison to the wild type. Whereas all of these genes were induced by submergence in the wild type, they showed differential expression in the mutants (). Specifically, the transcript levels of ADH1 and PDC1 in atg5-1 and atg7-3 mutants were significantly higher at the early stages (3 h and 6 h) after submergence treatment. In contrast, the transcript levels of SUS1, HB1, HUP43, and LBD41 were significantly lower in atg5-1 and atg7-3 mutants under submergence ().
Figure 3. Relative transcript levels of hypoxia-responsive genes (A) and ethylene-responsive genes (B) in the wild type (WT) and atg mutants (atg5-1 and atg7-3) upon submergence. Total RNA was isolated from 4-wk-old WT and atg mutants at 0, 3, 6, and 24 h after light submergence treatment. Transcript levels relative to WT at 0 h were normalized to that of ACT2. The experiments have been repeated 3 times with biological replicates and similar results were obtained. Data are average values ± SD (n = 3) of 3 technical replicates. Asterisks indicate significant differences from WT (*, P < 0.05; **, P < 0.01 by the Student t test).
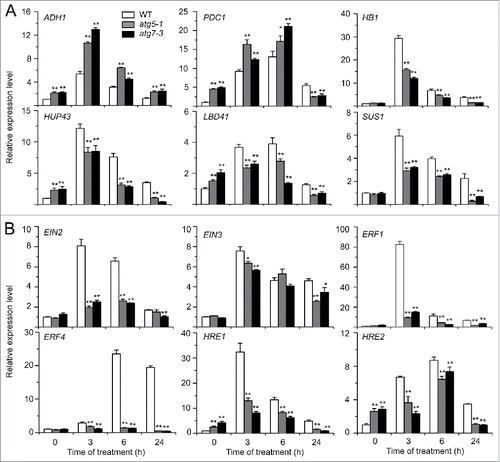
Ethylene is an essential hormone for regulation of hypoxia signaling in plants.Citation3 To investigate the potential link between the autophagy and ethylene pathways, we analyzed the relative expression of ethylene biosynthesis and signaling genes in the wild-type and atg mutants exposed to submergence (LS). qRT-PCR analysis showed that the transcript levels of ethylene insensitive 2 (EIN2), EIN3, ERF1, and HRE1 in the wild type peaked at 3 h of submergence treatment, and then gradually decreased to the basal level from 6 to 24 h of treatment, but the transcript levels of ERF4 and HRE2 peaked at 6 h after treatment (). By contrast, the transcripts of all these genes showed significant downregulation in the atg mutants at most time points upon submergence treatment in comparison to the wild type (). The reduced expression of the hypoxia-responsive genes HB1, HUP43, LBD41, and SUS1 as well as the ethylene-responsive genes EIN2, EIN3, ERF1, ERF4, HRE1, and HRE2 in the atg mutants seemed to correlate with their submergence hypersensitive phenotype.
Autophagy-deficient mutants showed enhanced sensitivity to ethanol
Anaerobic respiration is the major cellular activity sustaining the plant's energy supply under submergence.Citation2 However, anaerobic respiration produces toxic products such as ethanol, acetaldehyde, and lactate, which likely affect plant growth and survival. Our observations that the atg mutants exhibited hypersensitivity to submergence and accumulated high levels of ADH1 and PDC1 mRNAs, prompted us to consider the possible relationship of autophagy to fermentation-induced toxicity. To examine this, we first evaluated the response of wild-type Arabidopsis to fermentation products by treating plants with 100 mM ethanol, 220 mM (1%) acetaldehyde, or 11 mM (0.1%) lactate; we found that all 3 chemicals significantly induced cell death, as indicated by lesions on the leaves (; Fig. S6). Among the treatments, 100 mM ethanol triggered yellowing and chlorosis, which could be easily visualized; therefore, we used ethanol treatments for further study. Before treatment or treated with water for 6 d, we observed no difference between the wild-type and atg mutants (). However, all atg mutants showed severe yellowing in the whole leaves treated with 100 mM ethanol (). By contrast, only the bottom leaves displayed chlorosis in the wild-type plants (). Measurement of chlorophyll contents in the wild-type and atg mutants upon 0- and 6-day ethanol treatments suggested a significant decline of chlorophyll upon spraying with 100 mM ethanol in the atg mutants in comparison to the wild type (). Consistent with this, upon ethanol treatment, atg mutants showed significantly higher ion leakage rates than the wild type (). However, the wild-type and atg mutant plants treated with acetaldehyde or lactate showed no significant differences (Fig. S6).
Figure 4. Deficiency of autophagy attenuates plant tolerance to ethanol stress. (A) Image of the wild-type (WT) and atg mutants (atg2-1, atg5-1, atg7-3, and atg10-1) before treatment (CK) and after 6-d treatment with ethanol (EtOH) or water as a control (Water). Four-wk-old WT and atg mutants were sprayed with 100 mM ethanol or water for 6 d and photographs were taken at the end of treatment. (B) Relative chlorophyll contents and electrolyte leakage of WT and atg mutants (atg2-1, atg5-1, atg7-3, and atg10-1) at 6 d after spraying with water or 100 mM ethanol. The chlorophyll contents of wild-type samples treated with water were set to 100%, and the relative chlorophyll contents in the other samples were calculated accordingly. The ionic leakages (percentages) were calculated by comparison of leaked ionic strength to the corresponding total ionic strength. Data are average values ± SD (n = 3) of 3 biological replicates. For each replicate, >10 leaves were used for each genotype. Asterisks indicate significant differences from WT (**, P < 0.01 by the Student t test). (C) Phenotype of detached leaves from 4-wk-old WT and atg mutants (atg2-1, atg5-1, atg7-3, and atg10-1) upon water or 100 mM ethanol immersion. Photos were taken at 0 and 6 d after detachment. (D) Images of WT and atg mutants (atg2-1, atg5-1, atg7-3, and atg10-1) germinated on MS medium containing without and with 50 mM ethanol for 2 wk.
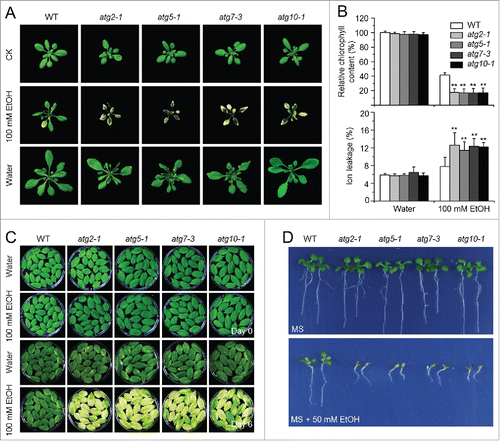
We also used assays with detached leaves and seed germination to examine the effects of ethanol on the autophagy-deficient mutants. As shown in , when detached leaves of the wild type and atg mutants were immersed in 100 mM ethanol or water, leaves from the atg mutants turned yellow and showed enhanced chlorosis at 6 d after ethanol treatment, while the wild-type leaves remained green. After wild-type or atg mutant seeds were germinated on MS or MS solid medium containing 50 mM ethanol for 2 wk, the atg mutants showed more sensitivity to ethanol than did the wild type ().
Accumulation of reactive oxygen species in atg mutants following submergence
Given that anoxia induces NADPH oxidase-dependent accumulation of H2O2 in Arabidopsis,Citation23 we hypothesized that autophagy plays a role in controlling ROS levels under submergence. To examine this, we used qRT-PCR to measure the transcript levels of genes encoding RBOHD (respiratory burst oxidase homolog D) and RBOHF, 2 major ROS-generating enzymes.Citation42 As shown in , the expression of RBOHD and RBOHF was significantly upregulated in the atg mutants in comparison to the wild type at 0, 3, and 24 h of submergence (LS). However, the transcript levels of CAT1 (catalase 1), APX1 (ascorbate peroxidase 1), GPX1 (glutathione peroxidase 1), and GR1 (glutathione-disulfide reductase 1), which encode enzymes that detoxify H2O2 in plants,Citation43 were downregulated in the atg mutants at 0, 3, 6, and 24 h of submergence in comparison to the wild type, except the transcript levels of GPX1 and APX1 were similar at 0 and 6 h, respectively, to those of the wild type ().
Figure 5. Role of ROS in the autophagy-mediated plant response to submergence and ethanol stresses. (A) Relative expression levels of genes encoding enzymes involved in production or reduction of ROS after light submergence (LS) treatment. Four-wk-old wild type (WT) and atg mutants (atg5-1 and atg7-3) upon LS treatment at 0, 3, 6, and 24 h were collected for total RNA extraction. The relative mRNA abundance was normalized to that of ACT2. The experiments have been repeated 3 times (biological replicates) with similar results and the representative data from one replicate are shown. Data are average values ± SD (n = 3) of 3 technical replicates. Asterisks indicate significant differences from WT (*, P < 0.05; **, P < 0.01 by the Student t test). (B, C) DAB staining showing the accumulation of ROS in the leaves of 4-wk-old atg mutants (atg2-1, atg5-1, atg7-3, and atg10-1) under normal growth conditions (Light), 3-d treatment with LS (B) and 100 mM ethanol (C). In contrast to weak signals in the WT leaves, strong ROS accumulation was detected in the atg mutants after LS and ethanol treatments. Scale bar: 500 μm.
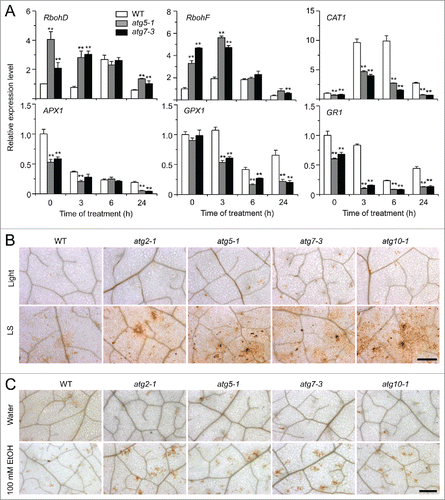
To further confirm the qRT-PCR data, we used diaminobenzidine (DAB) staining to detect H2O2 accumulation in situ following submergence and ethanol treatments in leaves. Submergence and ethanol treatments triggered the generation of ROS, as indicated by yellow-brown color, in wild-type leaves (). In contrast, much higher levels of ROS were detected in the leaves of submergence- and ethanol-treated atg mutants in comparison to the wild type and untreated controls ().
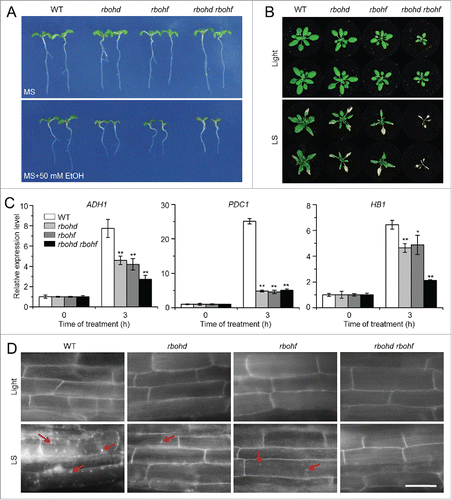
Previous work showed that the RBOHD transcript was significantly upregulated by anoxia and the rbohd mutants displayed reduced survival of anoxic stress.Citation44 To gain genetic evidence on the involvement of ROS in the autophagy-mediated submergence response, we obtained the rbohd and rbohf transposon insertion mutants and the rbohd rbohf double mutant,Citation42 and characterized their responses to ethanol and submergence stresses. When their seeds were germinated on MS medium, or MS containing 50 mM ethanol, the rbohd, rbohf, and rbohd rbohf mutants showed less resistance to ethanol stress in comparison with the wild type (). Moreover, upon submergence exposure for 6 d followed by a 9-d recovery, all of the wild-type plants survived submergence, but most of the rbohd and rbohf mutants displayed enhanced damages in their rosette leaves and all of rbohd rbohf double mutants died (). Upon a 3-h submergence exposure, the transcripts of the hypoxia-responsive genes ADH1, PDC1, and HB1 were downregulated in the rbohd, rbohf, and rbohd rbohf mutants compared to the wild type (). Further, MDC staining showed that the submergence-induced accumulation of autophagic structures was reduced in the rbohd, rbohf, and rbohd rbohf mutants compared to the wild type (). Moreover, DAB staining results showed that the ROS accumulation in the leaves of rbohd, rbohf, and rbohd rbohf mutants were much lower than that of the wild type after submergence (Fig. S7A). Consistently, the submerged rbohd, rbohf, and rbohd rbohf mutants displayed more severe cell death staining by trypan blue than that of wild-type leaves (Fig. S7B).
Figure 6. The rboh mutants show enhanced sensitivity to ethanol and submergence stresses. (A) Images of the wild type (WT) and rboh mutants (rbohd, rbohf, and rbohd rbohf) germinated on MS medium containing no ethanol or 50 mM ethanol, for 2 wk. (B) Images of WT and rboh mutants (rbohd, rbohf, and rbohd rbohf) before treatment (Light) and at 6 d after light submergence (LS) treatment followed by a 9-d recovery. (C) Relative expression levels of hypoxia-responsive marker genes in WT and rboh (rbohd, rbohf, and rbohd rbohf) mutants upon LS treatment. Four-wk-old plants were LS-treated for 0 and 3 h, and leaves were collected for RNA extraction. Transcript levels relative to WT at 0 h were normalized to that of ACT2. The experiments have been repeated 3 times, with biological replicates, and similar results were obtained. Data are average values ± SD (n = 3) of 3 technical replicates. Asterisks indicate significant differences from WT (*, P < 0.05; **, P < 0.01 by the Student t test). (D) MDC staining of root cells from WT, rbohd, rbohf, and rbohd rbohf seedlings. One-wk-old seedlings were untreated and LS-treated for 24 h followed by staining with MDC. The labeled autophagosomes (arrows) were visualized by epifluorescence microscopy. Scale bar: 50 μm.
Submergence sensitivity in the atg mutants requires SA signaling
The senescence- and immunity-related programmed cell death phenotypes in the autophagy-defective mutants require the salicylic acid (SA) signal transducer NPR1 (NON-EXPRESSOR OF PR 1).Citation45,46 To determine whether the enhanced submergence sensitivity in the atg mutants relies on an complete SA pathway, we first measured the endogenous SA levels in the wild type and atg mutants at various time points (0, 1, 3, 6, and 12 h) upon submergence treatment. In wild-type plants, SA contents decreased at 1 and 3 h upon submergence, followed by a slight increase at 6 and 12 h after treatment (). In the atg mutants, however, the SA contents remained higher at all time points, compared with the wild type (). These results were confirmed by analyzing mRNA abundance of the SA biosynthesis genes ICS1 (isochorismate synthase 1), EDS1 (enhanced disease susceptibility 1), and PAD4 (phytoalexin deficient 4); these were all upregulated at 0, 3, and 24 h upon submergence treatment in the atg mutants in comparison to the wild type ().
Figure 7. The enhanced submergence and ethanol sensitivity in autophagy-defective mutants requires salicylic acid signaling. (A) Measurement of endogenous SA contents in the wild type (WT) and atg mutants (atg5-1 and atg7-3). WT, atg5-1, and atg7-3 mutants were treated with submergence (LS) and leaves were collected at 0, 1, 3, 6, and 12 h after treatment for SA extraction and then analyzed by LC/MS. D6-SA was added as an internal quantitative standard. The experiments were repeated (biological replicates) twice, with similar results, and the representative data from one replicate are shown. Data are means ± SD calculated from 8 technical replicates (200 mg leaves harvested from 3 independent plants were pooled for each technical replicate). Asterisks with “a” indicate significant differences from that of the wild type at each time point and with “b” indicate significant differences from untreated wild-type control (*, P < 0.05; **, P < 0.01 by the Student t test). (B) Relative expression levels of SA biosynthesis genes in WT and atg mutants (atg5–1 and atg7–3) upon LS treatment. Total RNA was isolated from 4-wk-old WT and atg mutants under LS treatment for 0, 3, 6, and 24 h. The relative transcript levels were normalized to that of ACT2. *, P < 0.05; **, P < 0.01 by Student t test. (C) Images of WT, atg5–1, atg5 sid2, sid2, atg5 npr1, and npr1-5 seeds germinated on MS medium containing no ethanol or 50 mM ethanol, for 2 wk. (D) Images of WT, atg5-1, atg5 sid2, sid2, atg5 npr1, and npr1-5 plants before treatment (Day 0) and after a 6-d recovery after a 5-d LS treatment (Day 5). (E) DAB staining showing ROS levels in the leaves of 4-wk-old WT, atg5-1, atg5 sid2, sid2, atg5 npr1, and npr1-5 mutants under normal growth conditions (Light) and after 3-d LS treatment. Scale bar: 500 μm. (F) MDC staining showing autophagosome formation in the root cells of WT, atg5-1, atg5 sid2, sid2, atg5 npr1, and npr1-5 seedlings under normal light/dark (Light) and LS conditions. One-wk-old seedlings were not treated or LS-treated for 24 h following by staining with MDC. The labeled autophagosomes (arrows) were visualized by epifluorescence microscopy. Scale bar: 50 μm.
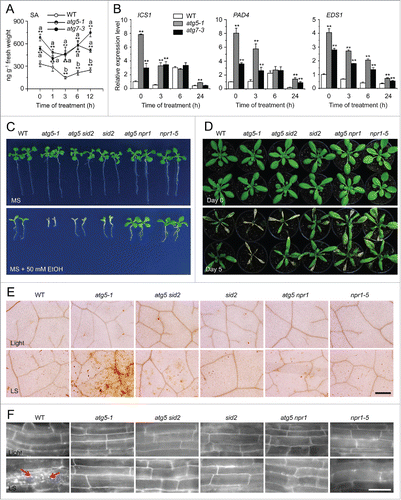
To further explore the possible negative regulation of SA in the atg mutants under submergence, we crossed atg5–1 with the SA biosynthesis and signaling mutants sid2 (salicylic acid induction deficient 2)Citation47 and npr1-5Citation48 to generate atg5 sid2 and atg5 npr1 double mutants. The npr1-5 mutant displayed much more resistance to ethanol and submergence, while the sid2 mutant and wild-type plants showed similar sensitivities (). By contrast, the hypersensitive phenotypes of atg5-1 to both ethanol and submergence treatments were partly suppressed in the atg5 sid2 double mutant, and completely suppressed in the atg5 npr1 double mutant (). Results from DAB staining confirmed that the high ROS levels in the leaves of atg5-1 mutants under submergence were recovered in the double mutants with sid2 or npr1-5 (). Further, submergence-induced autophagosome formation was blocked in the root cells of sid2 or npr1-5 mutants, as well as in the atg5 sid2 and atg5 npr1 double mutants (). Given that the sid2 mutation only partially alleviated the increased sensitivities of atg5 to submergence and ethanol treatments, we further crossed the atg5 to the eds1-22 (enhanced disease susceptibility 1) mutant to generate atg5 eds1 double mutant. Phenotypic analyses showed that the eds1 single mutant displayed enhanced tolerance to both treatments of ethanol and light submergence (Fig. S8A and S8B). Interestingly, in the atg5 eds1 double mutant, the hypersensitivities of the atg5 mutant to ethanol and submergence, as well as the submergence-induced accumulation of ROS in atg5 mutant were completely rescued by the eds1 mutation (Fig. S8).
To assess the potential link of autophagy-mediated hypoxia response to that of ethylene, we further crossed the atg5 and atg7 mutants to the ethylene overproducer mutant eto1 to generate atg5 eto1 and atg7 eto1 double mutants. Phenotypic analyses suggested that the eto1 single mutant showed more tolerance to ethanol treatment, but not to submergence (Fig. S9). In contrast, in the atg5 eto1 and atg7 eto1 double mutants, the increased sensitivities of both atg mutants could be partially recovered by the eto1 mutation, suggesting that the hypersensitive phenotypes to ethanol and submergence seen in the atg mutant are, at least in part, due to the suppressed ethylene responses, which is likely an effect of the antagonistic interaction of the ethylene and SA pathways.
Discussion
In plants, autophagy is a highly regulated vacuolar degradation pathway for recycling cytosolic components and has essential functions in metabolic adaptation and damage repair during exposure to various biotic and abiotic stresses.Citation26,31 Thus, autophagy likely functions as a protective mechanism that helps plants survive adverse conditions. In this report, we demonstrate that autophagy is required for regulation of the response to submergence in Arabidopsis. First, the transcripts of Arabidopsis ATG genes and the formation of autophagosomes were induced by submergence (; Fig. S1). Second, autophagy-defective mutants displayed enhanced sensitivity to submergence and ethanol stresses, and these phenotypes required the SA transducer NPR1 and the defense regulator EDS1 (; Figs. S4 and S8). Third, autophagy-defective mutants showed downregulation of hypoxia-responsive and ethylene-responsive gene expression (). Fourth, SA contents increased and ROS accumulated in the autophagy-defective mutants upon submergence (). Finally, the deficiencies of ROS production in the rbohd rbohf double mutants, impaired plant tolerance to submergence and decreased submergence-induced autophagosome formation (). Together, these observations provide strong evidence to support the idea that autophagy protects plants during submergence by modulating SA-mediated cellular homeostasis. It is most likely that the SA-induced defense and ROS signaling pathways are involved in the regulation of autophagy-associated hypoxia response in Arabidopsis.
In higher plants, ROS are produced as byproducts of cellular activities such as respiration and photosynthesis in the chloroplasts, mitochondria, and peroxisomes.Citation49,50 The most stable ROS, H2O2, acts as an essential second messenger at low levels to transmit an initial signal in the plant response to environmental changes.Citation51 However, excessive accumulation of ROS may cause irreversible oxidative damage to macromolecules and eventually lead to cell death.Citation51 Increasing evidence suggests that several biotic and abiotic stresses accompanied by increased ROS generation contribute to induction of autophagy, indicating the involvement of autophagy in the plant response to oxidative stress.Citation51 In agreement with this hypothesis, the autophagy-defective mutants show hypersensitivity to H2O2 treatment and accumulate high levels of H2O2 in leaves.Citation45,52 In addition, exogenous application of H2O2 or the ROS-inducing reagent MV can significantly induce autophagy.Citation52 These findings indicate a direct link between ROS and autophagy in plants. Similarly, anoxia triggers the accumulation of ROS in plant cells.Citation24 Our phenotypic, genetic, and biochemical analyses revealed that autophagy is required for the anoxia response, acting by controlling SA-induced oxidative damages in Arabidopsis, which further linked autophagy to ROS. Consistent with this, the submergence-hypersensitive phenotypes in the atg mutants were completely suppressed in double mutants with npr1 and partly suppressed in double mutants with sid2 (). This suggests that the feedback inhibition of autophagy on SA signaling also occurs in the submergence stress response, similar to the negative feedback regulation of senescence and immunity-associated cell death.Citation45 Nevertheless, our current understanding of how redox signals are transmitted to the autophagic machinery remains incomplete. The existence of upstream positive and negative regulators of autophagy, AMP-activated protein kinase (AMPK) and target of rapamycin (TOR), in ArabidopsisCitation53,54 indicates the presence of a conserved mechanism in plants.Citation55 It is therefore possible that in coordination with TOR kinase,Citation56 Arabidopsis KIN10/11 (orthologs of mammalian AMPK) may regulate autophagy by direct phosphorylation of ATG1 to initiate autophagosome formation. In agreement with this proposal, recent studies reveal that hypoxia induces the transcripts of KIN10 and KIN11 and ectopic expression of an inactive form of KIN10 and KIN11 or rice SnRK1 abolishes plant tolerance to submergence.Citation54,57 These findings support the idea that, at least in Arabidopsis, the hypoxia response is likely to be positively regulated by the upstream energy sensor KIN10/11. Our findings from qRT-PCR analyses showed that the transcripts of ADH1 and PDC1, which encode enzymes essential for anaerobic respiration to regenerate NAD+ and produce acetaldehyde and ethanol,Citation24 were significantly upregulated in the atg mutants upon submergence (). By contrast, the other hypoxia-responsive and ethylene-responsive genes were significant downregulated in the submerged atg mutants (). This difference in our observations resembles that observed in a previous study demonstrating the requirement for a ROP protein in the hypoxia response, where it acts to promote ROS generation and subsequently regulate ADH1 expression to activate anaerobic respiration.Citation23,24 The ROP signaling-mediated plant hypoxia response is finely controlled by the GTPase activating protein RopGAP4, which operates a feedback regulatory loop to balance nutrient consumption and ROS-induced oxidative damage.Citation23,24 Thus, autophagy likely either functions by a mechanism parallel to that of RopGAP4, or as a downstream event of the Rop pathway to modulate ROS-induced damages and thereby control the balance between expenditure of carbohydrate and avoidance of cell death during oxygen deprivation.
Ethanol is the end product of hypoxia-induced anaerobic respiration.Citation24 During the past decades, whether the accumulation of ethanol harms plant cells and whether ethanol can be used to mimic the toxic effects of hypoxia have been subjects of debate.Citation58 Since ethanol can pass through the plasma membrane, it may quickly diffuse out of plant cells once produced.Citation44 However, addition of small amounts of exogenous ethanol to the growth medium significantly interferes with carrot cell growth.Citation58 In this study, we found that Arabidopsis autophagy-defective mutants displayed enhanced sensitivity to exogenous ethanol (), suggesting that ethanol mimics the autophagy-associated submergence response in Arabidopsis. Phenotypic analyses showed that ethanol stress enhanced chlorophyll loss and membrane electrolyte leakage in Arabidopsis leaves (), while the plants exposed to acetaldehyde showed leaf vitrification (Fig. S6). The phenotypic difference between ethanol and acetaldehyde treatments indicates that the effects of ethanol on Arabidopsis cells are due to ethanol per se rather than its oxidation to acetaldehyde. Further examination of mutants in the SA and ROS pathways, as well as their double-mutant combinations with atg mutants, confirmed this possibility (). Moreover, we observed that elevated ethanol levels induced the accumulation of ROS in Arabidopsis leaves (), resembling the results of submergence treatment. Thus, we propose that anaerobic fermentation-generated ethanol is likely to be physiologically functional in promoting ROS accumulation in Arabidopsis. Consistent with this, recent findings from mammals revealed that autophagy can be stimulated by ethanol, which may inhibit the proteasome pathway and MTOR activities and contribute to alleviation of sarcopenia, as well as ethanol neurotoxicity.Citation59-61 Future work to identify ethanol-responsive genes and target proteins will further our understanding of the physiological effects of ethanol in Arabidopsis.
In conclusion, our findings demonstrate that in the root and shoot cells of Arabidopsis, submergence can rapidly induce the expression of ADH1 and PDC1, which initiate ethanolic fermentation, regenerating NAD+ to sustain glycolysis and energy supply. Under prolonged submergence conditions, however, autophagy is activated by the accumulation of ROS as byproducts of respiration and other cellular activities. Given that ROS, more specifically H2O2, is a crucial signal for hypoxia-inducible expression of ADH1,Citation62 the activated autophagy likely plays a central role in balancing the consumption of cellular reserves and alleviation of oxidative damage in submergence environments. In contrast, SID2-produced SA regulates the homeostasis of ROS. In plant cells, modest ROS levels are beneficial for activation of the hypoxia response; however, excessive ROS (e.g., in the atg mutants) can damage cell components and induce cell death,Citation52,63,Citation64 which thereby increases the plant's sensitivity to submergence.
Materials and Methods
Plant materials, growth conditions and treatments
The Arabidopsis T-DNA insertion mutants of autophagy-related genes were identified from the SALK collections (http://signal.salk.edu) and named atg2-1 (SALK_076727),Citation45 atg5-1 (SAIL_129_B07),Citation34 atg7-3 (SAIL_11_H07),Citation65 and atg10-1 (SALK_084434C).Citation39 The methods for identification of atg mutants and confirmation of their senescence phenotypes are described in the Supplemental Methods. The sid2 (SALK_133146C),Citation47 npr1-5 (CS3724),Citation48 rboh (rbohd, CS9555; rbohf, CS9557 and rbohd rbohf, CS9558),Citation42 eds1-22 (SALK_071051),Citation66 and eto1Citation67 mutants were obtained from the Arabidopsis Information Resource (TAIR; http://www.arabidopsis.org; the information of genes was summarized in Table S1). Transgenic plants expressing the GFP-ATG8e fusion have been described previously.Citation35 All seeds were surface-sterilized with 20% bleach containing 0.1% Tween 20 for 20 min, and washed at least 5 times with sterile water. Seeds were sown on MS medium, followed by cold treatment for at least 2 d. Seven-d-old seedlings were transferred to soil and grown under a 16-h-light (125 μmol m−2 s−1)/8-h-dark cycle at 22°C.
Submergence treatment was carried out according to Licausi et al. with minor modifications.Citation19 Briefly, whole Arabidopsis plants (4-wk-old) with soil were gently submerged in plastic boxes (55 × 40 × 35 cm) placed in a plant growth room under light (60 μmol m−2 s−1; LS) or continuous darkness (DS). Plant leaves were 5 to 10 cm under the surface of the water. The levels of dissolved oxygen around the underwater leaves were detected at various days (for LS) or hours (for DS) after treatment. After the treatment at the indicated times, the water was removed from the box and plants were recovered under normal growth conditions. Plant samples were collected or photographed at the indicated times. After recovery for 6 d, the aboveground Arabidopsis tissues were harvested, heated overnight at 105°C and were weighted to obtain “dry weight.” To calculate survival rates (percentages) after submergence, 10 plants per genotype were LS or DS treated for the indicated duration followed by a 6-d recovery under normal growth conditions, and the average of 3 independent experiments were recorded. The survival rates were determined based on the numbers of plants with capability to produce new leaves and continue to grow after recovery from submergence.
For ethanol treatment, 4-wk-old plants were sprayed with 100 mM ethanol or with water as a control, and covered to maintain high humidity for 4 d. Detached leaves were immersed in 100 mM ethanol or water for 6 d. For germination assays, sterilized seeds were sown on MS solid medium (Sigma, M5519) with or without 50 mM ethanol, followed by cold treatment for 2 d, and then grown under a 16-h-light/8-h-dark cycle at 22°C for 2 wk.
Identification and phenotypic analysis of atg2-1, atg5-1, atg7-3, and atg10-1 mutants
The atg2-1, atg5-1, atg7-3, and atg10-1 T-DNA insertion mutants were identified by PCR analysis. Genomic DNA of the wild type and atg mutants was isolated from 4-wk-old rosettes of soil-grown plants. PCR was performed for 30 cycles using primers XS001/XS002 (atg2-1), XS003/XS004 (atg5-1), XS361/XS362 (atg7-3), and XS363/XS364 (atg10-1) in combination with a T-DNA-specific primer (Lba1 for atg2-1 and atg10-1, LB1 for atg5-1 and atg7-3; Table S2).
The PCR-identified homozygous mutants were further confirmed by RT-PCR to verify the depleted expression of the corresponding gene. Specifically, total RNA was isolated from the wild-type and homozygous atg mutants using Trizol reagent (Invitrogen), and reverse transcribed to cDNA by a PrimeScript RT-PCR Kit (TaKaRa). RT-PCR was performed for 30 cycles with the gene-specific primers ATG2 (XS001/XS002), ATG5 (XS423/XS424), ATG7 (XS425/XS426), and ATG10 (XS469/XS470). The expression of ACT2 (Actin F/Actin R) gene was used as a control (Table S2).
For age-dependent leaf senescence analyses, 1-wk-old wild type and atg mutants germinated on MS medium were transferred to soil and grown under normal 16-h light/8-h dark conditions. The plants were observed and photographed at 3, 4, 5, 6, and 7 wk after germination.
RNA extraction and qRT-PCR analysis
Total RNA extraction and qRT-PCR analysis were performed as described previously.Citation46 The isolated RNA was reverse transcribed using PrimeScript RT reagent Kit with gDNA Eraser (Takara, RR047A) following the manufacturer's instructions. qRT-PCR was analyzed using SYBR Green master mix (Takara, RR420A) on a StepOne Plus real-time PCR system (Applied Biosystems, USA). The conditions for qRT-PCR were: initial denaturation at 95°C for 5 min followed by 40 cycles of PCR (denaturing, 95°C for 10 s; annealing, 55°C for 15 s; extension, 72°C for 30 s). Three experimental replicates were used for each reaction. ACTIN2 was used as the reference gene. Gene-specific primers used for qRT-PCR analysis are listed in Table S2.
Microscopy analysis
The stable transgenic lines expressing a GFP-ATG8e fusion and MDC staining were used to monitor autophagosome formation.Citation35 Seven-d-old GFP-ATG8e seedlings grown in culture vessels (7 × 10 cm) were submerged with sterilized water with or without 0.5 µM Concanamycin A (Sigma, C9705). Primary root cells were observed using an LSM 780 NLO laser scanning confocal microscope (Carl Zeiss, Germany) with a 40× oil immersion objective lens. GFP fluorescence were excited by a wavelength of 488 nm and detected at 493 to 558 nm.
For MDC staining, 7-d-old seedlings were not treated or submergence-treated for 24 h and subsequently immersed in phosphate-buffered saline (135 mM NaCl, 4.7 mM KCl, 10 mM Na2HPO4, 2 mM NaH2PO4 pH 7.4) plus 0.05 mM monodansylcadaverine (MDC; Sigma, D4008) for 10 min. After 2 washes with phosphate-buffered saline, the root cells were observed using an Axio Observer Z1 Inverted microscope (Carl Zeiss, Germany) with a 4',6-diamino-phenylindole–specific filter.
Protein blotting analysis
For total protein extraction, Arabidopsis samples were ground in liquid nitrogen and homogenized in ice-cold extraction buffer (50 mM sodium phosphate, pH 7.0, 200 mM NaCl, 10 mM MgCl2, 0.2% β-mercaptoethanol, 10% glycerol) supplemented with protease inhibitor cocktail (Roche, 04693132001). Samples were placed on ice for 30 min, and then centrifuged for 30 min at 11,000 g. The supernatant fraction was transferred to a new microcentrifuge tube for electrophoresis.
For immunoblot analysis, total proteins were subjected to SDS-PAGE and electrophoretically transferred to Hybond-C membrane (Amersham, 10600016). Anti-ATG8a (Abcam, ab77003) and anti-GFP (Cell Signaling Technology, 2955) antibodies were used in the immunoblotting analysis.
Measurement of SA, electrolyte leakage and chlorophyll content
SA was extracted and measured as described previously.Citation68 For SA extraction, powdered tissue was weighed into a 2-ml centrifuge tube and extracted with 1 ml of extraction buffer [2-propanol/H2O/concentrated HCl (2:1:0.002, vol/vol/vol) with internal standards (10 ng D6-SA)]. The mixtures were agitated at 100 rpm for 30 min at 4°C, followed by addition of 1 ml dichloromethane and agitation for another 30 min at 4°C. The samples were then centrifuged at 13,000 g for 10 min. The 900 µl of solvent from the lower phase was collected and concentrated using a nitrogen evaporator with nitrogen flow. The samples are dissolved in 100 μl of solution (60 μl methanol and 40 μl distilled water).
Chromatographic analysis was performed on a SHIMADZU UFLCXR System (Shimadzu Corporation, Japan) equipped with a LC-20AD-XR binary pump, a SIL-20AD-XR autosampler and a CTO-20A column oven. The Agilent Eclipse Plus C18 (2.1 mm × 100 mm, 1.8 m, Agilent Technologies) column was maintained at 40°C. The mobile phases were composed of methanol with 0.1% formic acid (A) and water with 0.1% formic acid (B) using a multi-step linear gradient elution: 20–20% A at 0 to 6 min, 20 to 35% A at 6 to 13 min, 35 to 50% A at 13 to 18 min, 50 to 65% A at 18 to 24 min, 65 to 90% A at 24 to 30 min and 90% A at 30 to 40 min, with the flow rate was kept at 0.3 ml/min. Five μl of each sample was injected. Mass spectrometry was performed on the Triple TOFTM5600 (AB SCIEX) and mass range was set at m/z 100 to 1000. The conditions of MS/MS detector were as follows: ion spray voltage 1500 V; ion source gas 150 psi; ion source gas 260 psi; temperature 500°C; curtain gas 15 psi; collision gas pressure 8 psi; entrance potential 10 V. Nitrogen was used as nebulizer and auxiliary gas. All of the acquisition and analysis of data were controlled by the Peak View Software TMV.1.1 (AB SCIEX).
Electrolyte leakage and chlorophyll contents were measured following Xiao et al.Citation35 Briefly, conductivity was measured on the excised whole leaves in deionized water following gentle agitation at 23°C for 1 h. Subsequently, the solution was heated in a 100°C water bath for 10 min and cooled to 23°C to determine total ionic strength. The ionic leakages (percentages) were calculated by comparison of leaked ionic strength to the corresponding total ionic strength. Chlorophyll was extracted from Arabidopsis leaves by immersion in 1 mL of N,N-dimethylformamide (Sigma, D4551) for 48 h in the dark at 4°C. Absorbance was recorded at 664 and 647 nm, and total chlorophyll concentration was calculated as previously described.Citation34 The chlorophyll contents of wild-type samples treated with water were set to 100%, and the relative chlorophyll contents in the other samples were calculated accordingly.
DAB and trypan blue staining
DAB and trypan blue staining was performed according to Xiao et al.Citation46 Leaves of 4-wk-old wild type and atg mutants were collected and placed in 1 mg ml−1 DAB (Sigma, D8001) solution (pH 3.8) for 2 h at room temperature and subsequently cleared in 96% boiling ethanol for 10 min. For trypan blue staining, leaves were boiled for 1 min in trypan blue staining buffer (12.5% phenol, 12.5% glycerol, 12.5% lactic acid, 48% ethanol, and 0.025% trypan blue) and incubated for 10 min at room temperature, followed by destaining in 70% chloral hydrate 5 times.
Generation of double mutants
To generate the atg5 sid2, atg5 npr1, atg5 eds1, atg5 eto1 and atg7 eto1 double mutants, the sid2,Citation47 npr1-5,Citation48 eds1-22,Citation66 and eto1Citation67 mutants were crossed to the atg5-1 and atg7-3 mutants. The T-DNA insertions in atg5-1 and atg7-3 mutants were identified by screening all of the F2 population by PCR using ATG5 or ATG7 gene-specific primers paired with the T-DNA-specific primer LB1 (Table S2). The sid2 allele was identified by PCR using SID2 gene-specific primers (XS691/XS692) in combination with a T-DNA-specific primer LBa1 (Table S2). The npr1-5 mutation was identified by a cleaved-amplified polymorphic sequence marker to digest the PCR products (primer pairs XS731/XS732; Table S2) by NlaIV enzyme (New England Biolabs, R0126S).Citation48 The eds1–22 mutant was identified by PCR using the primer pairs XS177/XS178 (Table S2) in combination with LBa1.Citation66 The atg5 eto1 and atg7 eto1 F2 seeds were grown on MS medium for 3 d under constant darkness, and the seedlings that displayed a constitutive triple-response phenotype were deemed to be homozygous for eto1-1.Citation67 The eto1-1 mutation was further confirmed by sequencing.
Statistical analysis
Data are reported as means ± SD of 3 independent experiments unless otherwise indicated. The significance of the differences between groups was determined by a 2-tailed Student t test. P values < 0.05 or <0.01 were considered significant.
Disclosure of Potential Conflicts of Interest
The authors declare that they have no conflicts of interest.
Supplemental_Files.zip
Download Zip (3.3 MB)Acknowledgments
We thank the ABRC for provision of all atg T-DNA seed pools and rbohd, rbohf, npr1, sid2, eds1, and eto1 mutant seeds, H.B. Wang for rbohd rbohf double-mutant seeds, and M.L. Chye (University of Hong Kong) for the GFP-ATG8e line. We thank L.Y. Dai (Hunan Agricultural University) for the pCXGUS-P vector and comments on the manuscript.
Supplemental Material
Supplemental data for this article can be accessed on the publisher's website.
Funding
This work was supported by the National Natural Science Foundation of China (Projects 31370298 and 31461143001), Program for New Century Excellent Talents in University (Project NCET-13-0614), the Key Project of Department of Education of Guangdong Province (Project 2012CXZD0003), and Sun Yat-sen University (Start-up fund to S.X.).
Related Research Data
References
- Bailey-Serres J, Fukao T, Gibbs DJ, Holdsworth MJ, Lee SC, Licausi F, Perata P, Voesenek LACJ, van Dongen JT. Making sense of low oxygen sensing. Trends Plant Sci 2012; 17:129-38; PMID:22280796; http://dx.doi.org/10.1016/j.tplants.2011.12.004
- Bailey-Serres J, Voesenek LACJ. Flooding stress: acclimations and genetic diversity. Annu Rev Plant Biol 2008; 59:313-39; PMID:18444902; http://dx.doi.org/10.1146/annurev.arplant.59.032607.092752
- Voesenek LACJ, Sasidharan R. Ethylene– and oxygen signaling– drive plant survival during flooding. Plant Biol 2013; 15:426-35; PMID:23574304; http://dx.doi.org/10.1111/plb.12014
- Geigenberger P. Response of plant metabolism to too little oxygen. Curr. Opin. Plant Biol 2003; 6:247-56; PMID:12753974; http://dx.doi.org/10.1016/S1369-5266(03)00038-4
- Perata P, Voesenek LACJ. Submergence tolerance in rice requires Sub1A, an ethylene-response-factor-like gene. Trends Plant Sci 2007; 12:43-6; PMID:17208508; http://dx.doi.org/10.1016/j.tplants.2006.12.005
- Sauter M. Root responses to flooding. Curr Opin Plant Biol 2013; 16:282-6; PMID:23608517; http://dx.doi.org/10.1016/j.pbi.2013.03.013
- Bailey-Serres J, Voesenek LACJ. Life in the balance: a signaling network controlling survival of flooding. Curr Opin Plant Biol 2010; 13:489-94; PMID:20813578; http://dx.doi.org/10.1016/j.pbi.2010.08.002
- Licausi F, Pucciariello C, Perata P. New role for an old rule: N-end rule-mediated degradation of ethylene responsive factor proteins governs low oxygen response in plants. J Integr Plant Biol 2013; 55:31-9; PMID:23164408; http://dx.doi.org/10.1111/jipb.12011
- Métraux JP, Kende H. The role of ethylene in the growth response of submerged deep water rice. Plant Physiol 1983; 72:441-6; PMID:16663022
- Peng HP, Lin TY, Wang NN, Shih MC. Differential expression of genes encoding 1-aminocyclopropane-1-carboxylate synthase in Arabidopsis during hypoxia. Plant Mol Biol 2005; 58:15-25; PMID:16028113; http://dx.doi.org/10.1007/s11103-005-3573-4
- Fukao T, Xu K, Ronald PC, Bailey-Serres J. A variable cluster of ethylene response factor-like genes regulates metabolic and developmental acclimation responses to submergence in rice. Plant Cell 2006; 18:2021-34; PMID:16816135
- Xu K, Xu X, Fukao T, Canlas P, Maghirang-Rodriguez R, Heuer S, Ismail AM, Bailey-Serres J, Ronald PC, Mackill DJ. Sub1A is an ethylene-response-factor-like gene that confers submergence tolerance to rice. Nature 2006; 442:705-8; PMID:6900200; http://dx.doi.org/10.1038/nature04920
- Licausi F, van Dongen JT, Giuntoli B, Novi G, Santaniello A, Geigenberger P, Perata P. HRE1 and HRE2, two hypoxia-inducible ethylene response factors, affect anaerobic responses in Arabidopsis thaliana. Plant J 2010; 62:302-15; PMID:20113439; http://dx.doi.org/10.1111/j.1365-313X.2010.04149.x
- Voesenek LACJ, Rijnders JHGM, Peeters AJM, van de Steeg HM, de Kroon H. Plant hormones regulate fast shoot elongation under water: from genes to communities. Ecology 2004; 85:16-27; http://dx.doi.org/10.1890/02-740
- Hattori Y, Nagai K, Furukawa S, Song XJ, Kawano R, Sakakibara H, Wu J, Matsumoto T, Yoshimura A, Kitano H, et al. The ethylene response factors SNORKEL1 and SNORKEL2 allow rice to adapt to deep water. Nature 2009; 460:1026-30; PMID:19693083; http://dx.doi.org/10.1038/nature08258
- Nakano T, Suzuki K, Fujimura T, Shinshi H. Genome-wide analysis of the ERF gene family in Arabidopsis and rice. Plant Physiol 2006; 140:411-32; PMID:16407444
- Hinz M, Wilson IW, Yang J, Buerstenbinder K, Llewellyn D, Dennis ES, Sauter M, Dolferus R. Arabidopsis RAP2.2: an ethylene response transcription factor that is important for hypoxia survival. Plant Physiol 2010; 153:757-72; PMID:20357136; http://dx.doi.org/10.1104/pp.110.155077
- Gibbs DJ, Lee SC, Isa NM, Gramuglia S, Fukao T, Bassel GW, Correia CS, Corbineau F, Theodoulou FL, Bailey-Serres J, et al. Homeostatic response to hypoxia is regulated by the N-end rule pathway in plants. Nature 2011; 479:415-8; PMID:22020279; http://dx.doi.org/10.1038/nature10534
- Licausi F, Kosmacz M, Weits DA, Giuntoli B, Giorgi FM, Voesenek LACJ, Perata P, van Dongen JT. Oxygen sensing in plants is mediated by an N-end rule pathway for protein destabilization. Nature 2011; 479:419-22; PMID:22020282; http://dx.doi.org/10.1038/nature10536
- Voesenek LACJ, Bailey-Serres J. Flooding tolerance: O2 sensing and survival strategies. Curr Opin Plant Biol 2013; 16:647-53; PMID:23830867; http://dx.doi.org/10.1016/j.pbi.2013.06.008
- Giuntoli B, Lee SC, Licausi F, Kosmacz M, Oosumi T, van Dongen JT, Bailey-Serres J, Perata P. A trihelix DNA binding protein counterbalances hypoxia-responsive transcriptional activation in Arabidopsis. PLoS Biol 2014; 12:e1001950. PMID:25226037; http://dx.doi.org/10.1371/journal.pbio.1001950
- Turcotte S, Desrosiers RR, Béliveau R. HIF-1alpha mRNA and protein upregulation involves Rho GTPase expression during hypoxia in renal cell carcinoma. J Cell Sci 2003; 116:2247-60; PMID:12697836
- Baxter-Burrell A, Yang Z, Springer PS, Bailey-Serres J. RopGAP4-dependent Rop GTPase rheostat control of Arabidopsis oxygen deprivation tolerance. Science 2002; 296:2026-8; PMID:12065837; http://dx.doi.org/10.1126/science.1071505
- Fukao T, Bailey-Serres J. Plant responses to hypoxia–is survival a balancing act? Trends Plant Sci 2004; 9:449-56; PMID:15337495; http://dx.doi.org/10.1016/j.tplants.2004.07.005
- He C, Klionsky DJ. Regulation mechanisms and signaling pathways of autophagy. Annu Rev Genet 2009; 43:67-93; PMID:19653858; http://dx.doi.org/10.1146/annurev-genet-102808-114910
- Liu Y, Bassham DC. Autophagy: pathways for self-eating in plant cells. Annu Rev Plant Biol 2012; 63:215-37; PMID:22242963; http://dx.doi.org/10.1146/annurev-arplant-042811-105441
- Bassham DC, Laporte M, Marty F, Moriyasu Y, Ohsumi Y, Olsen LJ, Yoshimoto K. Autophagy in development and stress responses of plants. Autophagy 2006; 2:2-11; PMID: 16874030; http://dx.doi.org/10.4161/auto.2092
- Kroemer G, Mariño G, Levine B. Autophagy and the integrated stress response. Mol Cell 2010; 40:280-93; PMID:20965422; http://dx.doi.org/10.1016/j.molcel.2010.09.023
- Bellot G, Garcia-Medina R, Gounon P, Chiche J, Roux D, Pouysségur J, Mazure NM. Hypoxia-induced autophagy is mediated through hypoxia-inducible factor induction of BNIP3 and BNIP3L via their BH3 domains. Mol Cell Biol 2009; 29:2570-81; PMID:19273585; http://dx.doi.org/10.1128/MCB.00166-09
- Schaaf MBE, Cojocari D, Keulers TG, Jutten B, Starmans MH, de Jong MC, Begg AC, Savelkouls KGM, Bussink J, Vooijs M, et al. The autophagy associated gene, ULK1, promotes tolerance to chronic and acute hypoxia. Radiother Oncol 2013; 108:529-34; PMID:23849170; http://dx.doi.org/10.1016/j.radonc.2013.06.015
- Li F, Vierstra RD. Autophagy: a multifaceted intracellular system for bulk and selective recycling. Trends Plant Sci 2012; 17:526-37; PMID:22694835; http://dx.doi.org/10.1016/j.tplants.2012.05.006
- Bassham DC. Plant autophagy–more than a starvation response. Curr Opin Plant Biol 2007; 10:587-93; PMID:17702643; http://dx.doi.org/10.1016/j.pbi.2007.06.006
- Han S, Yu B, Wang Y, Liu Y. Role of plant autophagy in stress response. Protein Cell 2011; 2:784-91; PMID:22058033; http://dx.doi.org/10.1007/s13238-011-1104-4
- Thompson AR, Doelling JH, Suttangkakul A, Vierstra RD. Autophagic nutrient recycling in Arabidopsis directed by the ATG8 and ATG12 conjugation pathways. Plant Physiol 2005; 138:2097-110; PMID:16040659
- Xiao S, Gao W, Chen QF, Chan SW, Zheng SX, Ma J, Wang M, Welti R, Chye ML. Overexpression of Arabidopsis acyl-CoA binding protein ACBP3 promotes starvation-induced and age-dependent leaf senescence. Plant Cell 2010; 22:1463-82; PMID:20442372; http://dx.doi.org/10.1105/tpc.110.075333
- Zhuang X, Wang H, Lam SK, Gao C, Wang X, Cai Y, Jiang L. A BAR-domain protein SH3P2, which binds to phosphatidylinositol 3-phosphate and ATG8, regulates autophagosome formation in Arabidopsis. Plant Cell 2013; 25:4596-615; PMID:24249832; http://dx.doi.org/10.1105/tpc.113.118307
- Sláviková S, Shy G, Yao Y, Glozman R, Levanony H, Pietrokovski S, Elazar Z, Galili G. The autophagy-associated Atg8 gene family operates both under favourable growth conditions and under starvation stresses in Arabidopsis plants. J Exp Bot 2005; 56:2839-49; PMID:16157655; http://dx.doi.org/10.1093/jxb/eri276
- Li F, Chung T, Vierstra RD. AUTOPHAGY-RELATED11 plays a critical role in general autophagy- and senescence-induced mitophagy in Arabidopsis. Plant Cell 2014; 26:788-807; PMID:24563201; http://dx.doi.org/10.1105/tpc.113.120014
- Phillips AR, Suttangkakul A, Vierstra RD. The ATG12-conjugating enzyme ATG10 is essential for autophagic vesicle formation in Arabidopsis thaliana. Genetics 2008; 178:1339-53; PMID:18245858; http://dx.doi.org/10.1534/genetics.107.086199
- Chung T, Phillips AR, Vierstra RD. ATG8 lipidation and ATG8-mediated autophagy in Arabidopsis require ATG12 expressed from the differentially controlled ATG12A and ATG12B loci. Plant J 2010; 62:483-93; PMID:20136727; http://dx.doi.org/10.1111/j.1365-313X.2010.04166.x
- Klok EJ, Wilson IW, Wilson D, Chapman SC, Ewing RM, Somerville SC, Peacock WJ, Dolferus R, Dennis ES. Expression profile analysis of the low-oxygen response in Arabidopsis root cultures. Plant Cell 2002; 14:2481-94; PMID:12368499
- Torres MA, Dangl JL, Jones JDG. Arabidopsis gp91phox homologues AtrbohD and AtrbohF are required for accumulation of reactive oxygen intermediates in the plant defense response. Proc Natl Acad Sci USA 2002; 99:517-22; PMID:11756663; http://dx.doi.org/10.1073/pnas.012452499
- Blokhina O, Virolainen E, Fagerstedt KV. Antioxidants, oxidative damage and oxygen deprivation stress: a review. Ann Bot 2003; 91:179-94; PMID:12509339; http://dx.doi.org/10.1093/aob/mcf118
- Pucciariello C, Perata P. Flooding tolerance in plants. In: Shabala S (ed) Plant stress physiology. CAB International, Oxford, 2012; pp 148-171.
- Yoshimoto K, Jikumaru Y, Kamiya Y, Kusano M, Consonni C, Panstruga R, Ohsumi Y, Shirasu K. Autophagy negatively regulates cell death by controlling NPR1-dependent salicylic acid signaling during senescence and the innate immune response in Arabidopsis. Plant Cell 2009; 21:2914-27; PMID:19773385; http://dx.doi.org/10.1105/tpc.109.068635
- Xiao S, Chye ML. Overexpression of Arabidopsis ACBP3 enhances NPR1-dependent plant resistance to Pseudomonas syringe pv tomato DC3000. Plant Physiol 2011; 156:2069-81; PMID:21670223; http://dx.doi.org/10.1104/pp.111.176933
- Wildermuth MC, Dewdney J, Wu G, Ausubel FM. Isochorismate synthase is required to synthesize salicylic acid for plant defence. Nature 2001; 414:562-5; PMID:11734859; http://dx.doi.org/10.1038/35107108
- Shah J, Kachroo P, Klessig DF. The Arabidopsis ssi1 mutation restores pathogenesis-related gene expression in npr1 plants and renders defensin gene expression salicylic acid dependent. Plant Cell 1999; 11:191-206; PMID:9927638
- Apel K, Hirt H. Reactive oxygen species: metabolism, oxidative stress, and signal transduction. Annu Rev Plant Biol 2004; 55:373-99; PMID:15377225; http://dx.doi.org/10.1146/annurev.arplant.55.031903.141701
- Laloi C, Apel K, Danon A. Reactive oxygen signalling: the latest news. Curr Opin Plant Biol 2004; 7:323-8; PMID:15134754; http://dx.doi.org/10.1016/j.pbi.2004.03.005
- Pérez-Pérez ME, Lemaire SD, Crespo JL. Reactive oxygen species and autophagy in plants and algae. Plant Physiol 2012; 160:156-64; PMID:22744983; http://dx.doi.org/10.1104/pp.112.199992
- Xiong Y, Contento AL, Nguyen PQ, Bassham DC. Degradation of oxidized proteins by autophagy during oxidative stress in Arabidopsis. Plant Physiol 2007; 143:291-9; PMID:17098847
- Menand B, Desnos T, Nussaume L, Berger F, Bouchez D, Meyer C, Robaglia C. Expression and disruption of the Arabidopsis TOR (target of rapamycin) gene. Proc Natl Acad Sci USA 2002; 99:6422-7; PMID:11983923; http://dx.doi.org/10.1073/pnas.092141899
- Baena-González E, Rolland F, Thevelein JM, Sheen J. A central integrator of transcription networks in plant stress and energy signalling. Nature 2007; 448:938-42; PMID:17671505; http://dx.doi.org/10.1038/nature06069
- Kim J, Kundu M, Viollet B, Guan KL. AMPK and mTOR regulate autophagy through direct phosphorylation of Ulk1. Nat Cell Biol 2011; 13:132-41; PMID:21258367; http://dx.doi.org/10.1038/ncb2152
- Liu Y, Bassham DC. TOR is a negative regulator of autophagy in Arabidopsis thaliana. PLoS One 2010; 5:e11883; PMID:20686696; http://dx.doi.org/10.1371/journal.pone.0011883
- Cho YH, Hong JW, Kim EC, Yoo SD. Regulatory functions of SnRK1 in stress-responsive gene expression and in plant growth and development. Plant Physiol 2012; 158:1955-64; PMID:22232383; http://dx.doi.org/10.1104/pp.111.189829
- Perata P, Alpi A. Ethanol-induced injuries to carrot cells: the role of acetaldehyde. Plant Physiol 1991; 95:748-52; PMID:16668049
- Hong-Brown LQ, Brown CR, Kazi AA, Huber DS, Pruznak AM, Lang CH. Alcohol and PRAS40 knockdown decrease mTOR activity and protein synthesis via AMPK signaling and changes in mTORC1 interaction. J Cell Biochem 2010; 109:1172-84; PMID:20127721; http://dx.doi.org/10.1002/jcb.22496
- Chen G, Ke Z, Xu M, Liao M, Wang X, Qi Y, Zhang T, Frank JA, Bower KA, Shi X, et al. Autophagy is a protective response to ethanol neurotoxicity. Autophagy 2012; 8:1577-89; PMID:22874567; http://dx.doi.org/10.4161/auto.21376
- Thapaliya S, Runkana A, McMullen MR, Nagy LE, McDonald C, Prasad SVN, Dasarathy S. Alcohol-induced autophagy contributes to loss in skeletal muscle mass. Autophagy 2014; 10:677-90; PMID:24492484; http://dx.doi.org/10.4161/auto.27918
- Yang CY. Hydrogen peroxide controls transcriptional responses of ERF73/HRE1 and ADH1 via modulation of ethylene signaling during hypoxic stress. Planta 2014; 239:877-85; PMID:24395201; http://dx.doi.org/10.1007/s00425-013-2020-z
- Prasad TK, Anderson MD, Martin BA, Stewart CR. Evidence for chilling-induced oxidative stress in maize seedlings and a regulatory role for hydrogen peroxide. Plant Cell 1994; 6:65-74; PMID:12244221
- Tsugane K, Kobayashi K, Niwa Y, Ohba Y, Wada K, Kobayashi H. A recessive Arabidopsis mutant that grows photoautotrophically under salt stress shows enhanced active oxygen detoxification. Plant Cell 1999; 11:1195-206; PMID:10402422
- Lai Z, Wang F, Zheng Z, Fan B, Chen Z. A critical role of autophagy in plant resistance to necrotrophic fungal pathogens. Plant J 2011; 66:953-68; PMID:21395886; http://dx.doi.org/10.1111/j.1365-313X.2011.04553.x
- Yang S, Hua J. A haplotype-specific resistance gene regulated by BONZAI1 mediates temperature-dependent growth control in Arabidopsis. Plant Cell 2004; 16: 1060-71; PMID: 15031411; http://dx.doi.org/10.1105/tpc.020479
- Chae HS, Faure F, Kieber JJ. The eto1, eto2, and eto3 mutations and cytokinin treatment increase ethylene biosynthesis in Arabidopsis by increasing the stability of ACS protein. Plant Cell 2003; 15:545-59; PMID:12566591; http://dx.doi.org/10.1105/tpc.006882
- Pan X, Welti R, Wang X. Quantitative analysis of major plant hormones in crude plant extracts by high-performance liquid chromatography-mass spectrometry. Nat Protoc 2010; 5:986-92; PMID:20448544; http://dx.doi.org/10.1038/nprot.2010.37