
ABSTRACT
Lysosomes are thought to be the major intracellular compartment for the degradation of macromolecules. We recently identified a novel type of autophagy, RNautophagy, where RNA is directly taken up by lysosomes in an ATP-dependent manner and degraded. However, the mechanism of RNA translocation across the lysosomal membrane and the physiological role of RNautophagy remain unclear. In the present study, we performed gain- and loss-of-function studies with isolated lysosomes, and found that SIDT2 (SID1 transmembrane family, member 2), an ortholog of the Caenorhabditis elegans putative RNA transporter SID-1 (systemic RNA interference deficient-1), mediates RNA translocation during RNautophagy. We also observed that SIDT2 is a transmembrane protein, which predominantly localizes to lysosomes. Strikingly, knockdown of Sidt2 inhibited up to ˜50% of total RNA degradation at the cellular level, independently of macroautophagy. Moreover, we showed that this impairment is mainly due to inhibition of lysosomal RNA degradation, strongly suggesting that RNautophagy plays a significant role in constitutive cellular RNA degradation. Our results provide a novel insight into the mechanisms of RNA metabolism, intracellular RNA transport, and atypical types of autophagy.
Introduction
The degradation and recycling of intracellular components is crucial for the maintenance of cellular or tissue homeostasis. The lysosome, a membrane-bound acidic organelle, plays a pivotal role in the degradation of biological macromolecules such as proteins, lipids, carbohydrates and nucleic acids, and organelles. The transport of intracellular components into lysosomes occurs via autophagy, which has been described as a self-eating catabolic process.Citation1 At least 3 different types of autophagy have been identified to date: macroautophagy; microautophagy; and chaperone-mediated autophagy (CMA).Citation1
CMA is a pathway in which cytosolic substrate proteins are directly transported into lysosomes, in an ATP- and HSPA8 (heat shock protein family A [Hsp70] member 8) chaperone-dependent manner, and degraded.Citation2 In this pathway, LAMP2A (lysosomal-associated membrane protein 2A), the product of one of 3 splice variants of the LAMP2 gene (LAMP2A, LAMP2B and LAMP2C) acts as a receptor for cytoplasmic substrate proteins. In addition to these pathways, we discovered a novel and selective type(s) of autophagy that targets RNA and DNA, which we designated RNautophagy and DNautophagy, respectively.Citation3,4 In these pathways, nucleic acids are directly taken up by lysosomes in an ATP-dependent manner and degraded. We found that LAMP2C can act as a receptor for nucleic acids.Citation3-5 Additionally, we have recently reported that RNautophagy and DNautophagy possesses selectivity for RNA and DNA substrates, respectively.Citation6 However, the mechanism by which substrate nucleic acids are translocated across the lysosomal membrane and the physiological role of RNautophagy and DNautophagy remain unclear.
In the present study, we sought to identify any proteins that mediate translocation of nucleic acids into lysosomes. We found that SIDT2 (SID1 transmembrane family, member 2), an ortholog of the Caenorhabditis elegans putative RNA transporter SID-1 (systemic RNA interference deficient-1), mediates translocation of RNA into lysosomes during RNautophagy. We confirmed that SIDT2 predominantly localizes to lysosomes. We also showed that knockdown of Sidt2 inhibits ˜50% of total RNA degradation in wild-type (WT) mouse embryonic fibroblasts (MEFs), strongly suggesting that RNautophagy plays a significant role in constitutive cellular RNA degradation.
Results
SIDT2 is a transmembrane protein that predominantly localizes to lysosomes
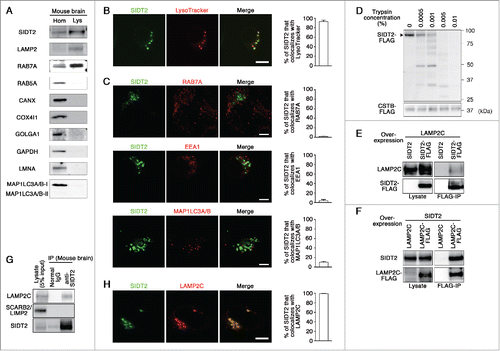
Candidate lysosomal proteins that might translocate RNA or DNA were identified using the AmiGO gene ontology database,Citation7 which was designed for the standardization of gene product attributes across species. According to AmiGO, the SID-1 family proteins (SID-1, SIDT1 [SID1 transmembrane family, member 1] and SIDT2) are the only group of putative RNA-specific transporters. Caenorhabditis elegans SID-1 protein has been reported to transport extracellular double-stranded RNA (dsRNA) into cells.Citation8 SID-1 is a multipass transmembrane protein and partly localizes to the plasma membrane.Citation8 An electrophysiological study suggested that SID-1 functions as a bidirectional channel for dsRNA.Citation9 Mammals have 2 SID-1 orthologs, SIDT1 and SIDT2. SIDT1 has been reported to localize to the plasma membrane of human cells and to mediate bidirectional transport of RNA.Citation10,11 Human SIDT1 is predominantly expressed in dendritic cells and lymphocytes,Citation12 whereas SIDT2 is almost ubiquitously expressed.Citation12,13 Although multiple studies have reported that SIDT2 is a membrane protein which mainly localizes to lysosomes,Citation13-15 its role on the lysosomal membrane remains unclear. To confirm the lysosomal localization of SIDT2, we isolated lysosomes from the mouse brain using a method described previously.Citation3 Analysis of lysosome content showed that SIDT2 is enriched in the lysosomal fraction that is positive for LAMP2, a lysosomal marker (), indicating that endogenous SIDT2 localizes to lysosomes. We confirmed that other organelle markers are not enriched in the lysosomal fraction (). In addition, electron microscopy revealed that the lysosomal fraction is rich in electron-dense lysosomes (primary lysosomes), and we could not find any other intact organelles, such as late endosomes, in the lysosomal fraction (Fig. S1). For further confirmation of the lysosomal localization of SIDT2, we examined its localization using a C-terminal GFP-tag in Neuro2a murine cells, where lysosomal compartments are clearly observable with LysoTracker Red. Fluorescent signals for SIDT2 were detected in lysosomes, which were stained with LysoTracker Red (). In contrast, colocalization rates of SIDT2 with RAB7A (RAB7A, member RAS oncogene family; a late endosomal and lysosomal marker), EEA1 (early endosome antigen 1; an early endosomal marker) or MAP1LC3A/B (microtubule associated protein 1 light chain 3 α/β an autophagosomal marker) were very low (), indicating that SIDT2 is not primarily localized to early and late endosomes, or autophagosomes. Considering that there are RAB7A-positive and -negative lysosomes,Citation16-18 our results also indicate that SIDT2 does not mainly localize to RAB7-positive lysosomes. By using a transmembrane protein topology prediction method based on a hidden Markov model (TMHMM 2.0), SIDT2 was predicted to possess 9 transmembrane domains (Fig. S2). To test for the localization of SIDT2 on the lysosomal membrane, we performed a trypsin digestion of membrane proteins of lysosomes isolated from cells expressing FLAG-tagged SIDT2. As shown in , SIDT2-FLAG was digested by trypsin in a dose-dependent manner. We confirmed that FLAG-tagged CTSB (cathepsin B), which is a known lysosomal lumenal protein, was not affected by trypsin treatment (). Our results, taken together with the previous reports,Citation13-15 indicate that SIDT2 is a lysosomal membrane protein.
Figure 1. Characterization of SIDT2. (A) Lysosomes (Lys) were isolated from mouse brain homogenates (Hom), and analyzed by immunoblotting using polyclonal goat anti-SIDT2 antibody and antibodies against LAMP2 (lysosomal marker), RAB7A (late endosome and lysosome), RAB5A (early endosome), CANX (endoplasmic reticulum), COX4I1 (mitochondria), GOLGA1 (Golgi apparatus), GAPDH (cytosol), LMNA/lamin A (nuclei), and MAP1LC3A/B (autophagosome). (B) Neuro2a cells expressing GFP-tagged SIDT2 were incubated with LysoTracker Red. Fluorescence images were visualized using a confocal laser-scanning microscope. Scale bar: 10 μm. Colocalization rate was quantified using ImageJ software (right panel, n = 3). (C) Neuro2a cells expressing GFP-tagged SIDT2 were fixed, and immunostained using anti-RAB7A, anti-EEA1 (early endosomal marker) or anti-MAP1LC3A/B antibodies. Fluorescent images were obtained using confocal microscopy. Scale bars: 5 μm. Colocalization rate was quantified (right panels, n = 3). (D) Lysosomes were isolated from HeLa cells expressing SIDT2-FLAG or CTSB-FLAG. Isolated lysosomes (4 μg protein) were incubated with the indicated concentrations of trypsin at 37°C for 5 min. Proteins in the samples were analyzed by immunoblotting using an anti-FLAG antibody. (E) LAMP2C and SIDT2 or SIDT2-FLAG were overexpressed in HeLa cells. Cell lysates were prepared and immunoprecipitated with an anti-FLAG antibody. Cell lysates and the resulting immunoprecipitant were analyzed by immunoblotting. (F) Lysates were prepared from HeLa cells overexpressing SIDT2 and LAMP2C or LAMP2C-FLAG and coimmunoprecipitation assays performed. (G) Endogenous interaction of SIDT2 with LAMP2C. Coimmunoprecipitation assays were performed using mouse brain lysates. (H) Neuro2a cells coexpressing FLAG-tagged LAMP2C and GFP-tagged SIDT2 were fixed, and immunostained using anti-FLAG antibody. Scale bars: 10 μm. Colocalization rate was quantified (right panel, n = 3).
SIDT2 interacts with LAMP2C
We have previously shown that LAMP2C can function as a lysosomal membrane receptor for nucleic acids during RNautophagy and DNautophagy.Citation3,4 We examined the interaction of SIDT2 with LAMP2C by cotransfecting HeLa cells with vectors that expressed FLAG-tagged SIDT2 and untagged LAMP2C, and analyzed cell lysates by coimmunoprecipitation with an anti-FLAG antibody. Coimmunoprecipitation of LAMP2C with SIDT2 indicated an interaction between these proteins (). Similar experiments using untagged SIDT2 and FLAG-tagged LAMP2C confirmed the interaction between these proteins (). To assess endogenous interaction in vivo, a coimmunoprecipitation assay was performed using mouse whole brain lysates, showing the interaction between endogenous SIDT2 and endogenous LAMP2C (). We observed that SCARB2/LIMP2 (scavenger receptor class B, member 2), another lysosomal membrane protein, was not precipitated with SIDT2 (), confirming that the interaction between SIDT2 and LAMP2C is not a nonspecific interaction. Whether this interaction is direct or indirect is unclear. Colocalization of SIDT2 and LAMP2C was also observed (). These results taken together with the lysosomal localization of SIDT2, and the known function of SID-1 or SIDT1 as mediators of bidirectional RNA transport, led to the hypothesis that SIDT2 is involved in the translocation of RNA during RNautophagy.
Overexpression of SIDT2 enhances RNA uptake and degradation in isolated lysosomes
To investigate whether SIDT2 mediates translocation of RNA in the process of RNautophagy, we performed gain- and loss-of-function studies combined with RNA uptake and degradation assays. Uptake and degradation of RNA was assessed in isolated lysosomes using a method reported previously.Citation3 Isolated lysosomes and RNA were incubated with ATP, lysosomes were precipitated by centrifugation, and RNA levels remaining in the solution outside of lysosomes were analyzed as an indicator of RNA uptake activityCitation3 (). RNA uptake activity was also assessed by incubating lysosomes with RNA and ATP, degrading RNA outside of lysosomes with exogenous ribonuclease A (RNase A), and then analyzing the levels of RNase A-resistant RNA, which corresponds to RNA inside lysosomes (). Furthermore, RNA uptake activity was confirmed using postembedding immunoelectron microscopy.
Figure 2. Effects of SIDT2 overexpression on RNA uptake and degradation by lysosomes. (A and B) Outlines of RNA uptake assays (A) and RNA degradation assays (B) using isolated lysosomes. (C) SIDT2 was overexpressed in Neuro2a cells. Protein levels were analyzed by immunoblotting using a goat anti-SIDT2 antibody. (D) The RNA uptake assay I indicated in (A) was performed using 5 μg of total RNA derived from mouse brains and isolated lysosomes derived from cells overexpressing SIDT2, or from control cells transfected with empty vector. Relative RNA levels in the solution outside lysosomes were quantified, and levels of RNA uptake were measured by subtracting RNA levels remaining in solution outside lysosomes from RNA input levels. Mean values are shown with SEM (n = 3). ***, P < 0.001. (E) RNA uptake assay II was performed as indicated in (A). Relative levels of RNA resistant to exogenous RNase A were analyzed. Mean ± SEM (n = 3). *, P < 0.05. (F) Isolated lysosomes were incubated with RNA and ATP as indicated in (A). Post-embedding immunoelectron microscopy was performed using an anti-rRNA antibody followed by anti-mouse IgG coupled with 10-nm gold particles. Gold particles were observed in the lysosomes. The numbers of gold particles per lysosome were counted. Mean ± SD (n = 25). ***, P < 0.001. Scale bars: 200 nm. (G) RNA degradation assays were performed as indicated in (B). Total RNA levels in samples were quantified, and levels of RNA degradation were measured by subtracting the RNA levels remaining in samples from the levels of input RNA. Mean ± SEM (n = 3). ***, P < 0.001. (H) Degradation of various RNAs by isolated lysosomes. RNA degradation assays were performed as described in . Relative levels of RNAs in samples were measured by qPCR analyses. Mean values are shown with SEM (n = 3). Actb, β-actin. *, P < 0.05; **, P < 0.01; ***, P < 0.001, n.s., not significant (Tukey test or Fisher LSD test). (I) Degradation of 28S and 18S rRNAs by isolated lysosomes. RNA degradation assays were performed using total RNA that does not contain small RNAs (under 200 bases). Undegraded and partially degraded RNAs were visualized using ethidium bromide staining (left). Relative levels of rRNAs (28S and 18S) were quantified, and levels of RNA degradation were measured by subtracting the RNA remaining in samples from the levels of input RNA (middle). Relative levels of partially degraded RNAs were quantified (right). Mean values are shown with SEM (n = 3). **, P < 0.01. (J) RNAs were not degraded in the solution outside of lysosomes. Isolated lysosomes were incubated with ATP for 5 min at 37°C. The lysosomes were removed by centrifugation, and the solution outside lysosomes was incubated with 5 μg of total RNA for 5 min at 37°C. Mean values are shown with SEM (n = 3). n.s., not significant. RNAs were visualized by ethidium bromide staining. (K) RNA degradation by lysed lysosomes. Isolated lysosomes were lysed in citrate-phosphate buffer (pH 5.0) containing 1% Triton X-100, mixed with 5 μg of total RNA, and incubated for 5 min at 37°C. Mean values are shown with SEM (n = 3). n.s., not significant. (L) Absence of RNA in isolated lysosomes incubated without exogenous RNA. Isolated lysosomes were incubated without exogenous RNA in the presence of ATP for 5 min at 37°C. (M) ATP requirement of RNautophagy. RNA degradation assays were performed in the absence of ATP. Total RNA levels in samples were quantified. Mean values are shown with SEM (n = 3). n.s., not significant.
We incubated isolated lysosomes and RNA in the presence of ATP and analyzed the total RNA level in samples as an indicator of whether RNA is degraded in lysosomesCitation3 (). RNA degradation also indicates the uptake of RNA, because RNA is not degraded in the solution outside of lysosomes.Citation3
To investigate the effects of SIDT2 overexpression on RNA uptake ability, Neuro2a cells were transfected with an expression vector that produced untagged full-length SIDT2 (). Lysosomes were isolated, and RNA uptake and degradation assays were performed. Lysosomes isolated from SIDT2-overexpressing cells had a significantly higher RNA uptake activity than those transfected with the control empty vector (). The higher RNA uptake activity of lysosomes derived from SIDT2-overexpressing cells was confirmed using post-embedding immunoelectron microscopy (, Fig. S3).
Additionally, a significant enhancement of RNA degradation was observed in lysosomes isolated from SIDT2-overexpressing cells (). Although 28S and 18S rRNAs were clearly degraded, levels of smear bands also appeared to be decreased in the degradation assay (), suggesting that RNAs besides 28S and 18S rRNAs are also degraded by isolated lysosomes. To test this possibility, we selected 3 mRNAs [Actb (actin, β)/β-actin, Gapdh (glyceraldehyde-3-phosphate dehydrogenase) and Uchl1 (ubiquitin carboxyl-terminal hydrolase L1)], which are expressed in mouse brains, and analyzed their relative levels by quantitative PCR. Levels of 5S and 5.8S rRNAs were also analyzed. As a result, mRNAs, 5S and 5.8S rRNAs were all degraded by lysosomes, and overexpression of SIDT2 enhanced the degradation (). We also tested the degradation of purified total RNA that does not contain small RNAs. The degradation of 28S and 18S RNAs was enhanced by SIDT2 overexpression, and the levels of partially degraded RNA were increased by SIDT2 overexpression (). This indicates that the small size RNA within the lysosomes shown in contains partially degraded RNA. We confirmed that RNA was not degraded in the solution outside of lysosomes derived from either SIDT2-overexpressing or control cells (). RNA was degraded in the solution containing disrupted lysosomes derived from either SIDT2-overexpressing or control cells (), confirming that RNA degradation occurred inside lysosomes. Overexpression of SIDT2 did not affect lysosomal nuclease activities because it did not alter the levels of RNA degradation in the disrupted lysosomes (), nor lysosomal pH (Fig. S4). We also observed that no RNA was detected in the isolated lysosomes incubated without exogenous RNA (), confirming that the RNA detected in uptake and degradation assays is derived from exogenous RNA. These results indicate that overexpression of SIDT2 enhances lysosomal uptake of RNA, leading to elevated levels of RNA degradation by lysosomes.
When ATP was not added to isolated lysosomes, evidence of RNA uptake activity was absent in lysosomes derived from SIDT2 overexpressing and control cells (). Therefore, SIDT2-mediated uptake of RNA appears to be ATP-dependent, consistent with observations that RNautophagy is ATP-dependent. Overexpression of SIDT2 increased RNA uptake activity in another cell line, NIH/3T3, in which transfection yielded a 2-fold increase in SIDT2 expression levels compared with endogenous levels (Fig. S5A and B).
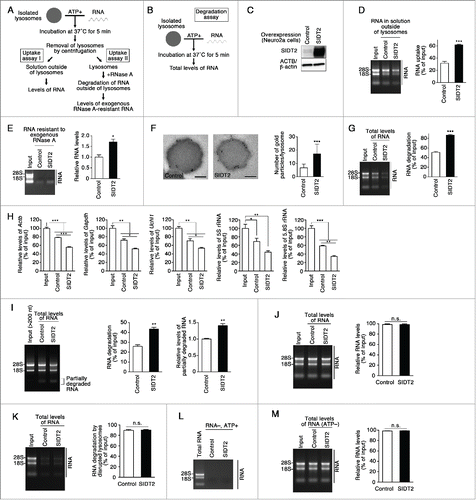
We investigated the relationship between SIDT2 and LAMP2C during RNautophagy. We tested the effect of SIDT2 overexpression on RNA transport activity in lysosomes derived from LAMP2-deficient cells. Overexpression of SIDT2 increased RNautophagy even in LAMP2-deficient lysosomes (), indicating that SIDT2 is able to function independently of LAMP2C. This result is consistent with our previous report showing that LAMP2 is not indispensable for RNautophagy.Citation3
Figure 3. Effect of SIDT2 overexpression on RNautophagy in the absence of LAMP2. (A) LAMP2 levels in LAMP2-deficient HeLa cells and parental HeLa cells (control HeLa) were analyzed by immunoblotting. (B and C) RNA uptake assays were performed using isolated lysosomes derived from LAMP2-deficient HeLa cells (B) or parental HeLa cells (C). Relative levels of RNA uptake were quantified. Results are expressed as mean ± SEM (n = 3). **, P < 0.01. In the absence of LAMP2, SIDT2 increased RNautophagy at similar levels to in the presence of LAMP2.
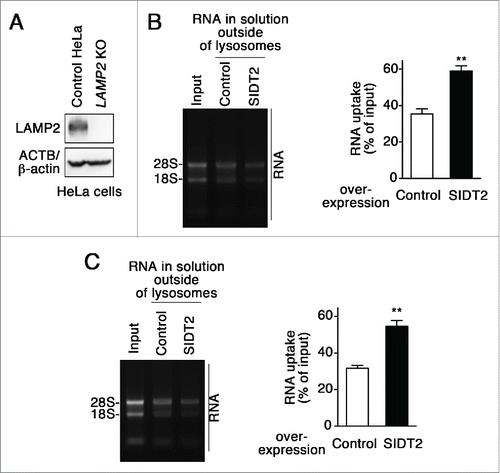
Shih and Hunter report that the S536I mutant SID-1, which is found in a systemic RNA interference-deficient mutant in Caenorhabditis elegans,Citation19 lacks RNA translocation function,Citation8,9 and the Ser536 of SID-1 corresponds to Ser564 of mouse SIDT2 (Fig. S6). Therefore, we speculated that a mutation at Ser564 inhibits lysosomal RNA uptake by SIDT2. We constructed a S564A mutant SIDT2, and tested the effects of this mutation on RNA uptake by lysosomes. We observed that SIDT2S564A localizes to lysosomes as readily as WT SIDT2 (), and that the mutation does not affect the interaction with LAMP2C (). In contrast to WT SIDT2, however, overexpression of SIDT2S564A did not increase RNautophagy (), indicating that functional SIDT2 protein is required to import RNAs into lysosomes. Taken together, our results support the notion that SIDT2 mediates RNA translocation during RNautophagy.
Figure 4. Effect of SIDT2 mutation on RNautophagy. (A) Neuro2a cells expressing GFP-tagged SIDT2S564A were incubated with LysoTracker Red. Fluorescence images were visualized using a confocal laser-scanning microscope. Scale bar: 10 μm. Colocalization rate was quantified (right panel, n=3). (B and D) Lysosomes were isolated from Neuro2a cells overexpressing WT or mutant SIDT2S564A or control transfectants. SIDT2 levels in lysosomes were analyzed by immunoblotting (B). The RNA uptake assay I indicated in was performed (D). Relative levels of RNA uptake were quantified. Mean ± SEM (n = 3). ***, P < 0.001. (C) LAMP2C or LAMP2C-FLAG and WT or mutant SIDT2S564A were overexpressed in Neuro2a cells. Cell lysates were prepared and immunoprecipitated with an anti-FLAG antibody. Cell lysates and the resulting immunoprecipitant were analyzed by immunoblotting.
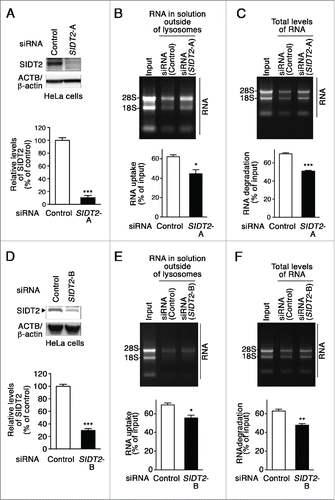
Knockdown of SIDT2 impairs RNA uptake and degradation in isolated lysosomes
To investigate the effects of SIDT2 knockdown on RNautophagy activity, HeLa cells were transfected with siRNAs targeting SIDT2. Lysosomes were isolated and RNA uptake assays were performed. Lysosomes isolated from SIDT2 knockdown cells showed significantly lower RNA uptake than lysosomes from control siRNA-transfected cells (). A significant reduction of RNA degradation was observed in lysosomes isolated from SIDT2 knockdown cells (). Similar results were obtained when we used another siRNA against SIDT2 (). We confirmed that knockdown of SIDT2 did not affect lysosomal pH (Fig. S4). The impairment of RNA uptake and degradation by SIDT2 knockdown was also confirmed in the 293FT cell line (Fig. S7). Collectively, these results demonstrate that SIDT2 is a critical determinant of RNautophagy activity.
Figure 5. Effects of SIDT2 knockdown on RNA uptake and degradation by lysosomes. (A and D) Decreased levels of SIDT2 proteins in HeLa cells transfected with SIDT2-siRNA were confirmed by immunoblotting. Relative levels of SIDT2 were quantified. Results are expressed as mean ± SEM (n = 3). (B and E) RNA uptake assay I () was performed using isolated lysosomes derived from SIDT2 knockdown or control siRNA-transfected cells. Relative levels of RNA uptake were quantified. Mean ± SEM (n = 3). ***, P < 0.001. (C and F) RNA degradation assay using lysosomes isolated from SIDT2-knockdown cells or from control cells. Relative levels of RNA degradation were quantified. Mean ± SEM (n = 3). ***, P < 0.001; **, P < 0.01.
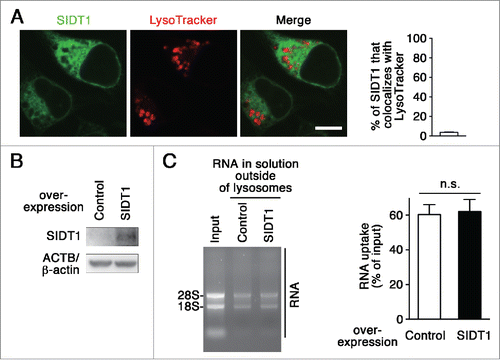
SIDT1 is not involved in RNautophagy
We investigated whether or not SIDT1 is involved in RNautophagy. We examined intracellular localization of SIDT1 using a C-terminal GFP-tag. Fluorescent signals for SIDT1 scarcely colocalized with LysoTracker Red (). In addition, overexpression of SIDT1 did not affect RNautophagy in RNA uptake assays (). Thus, in contrast to SIDT2, SIDT1 does not function in RNautophagy.
Figure 6. Effect of SIDT1 overexpression on RNautophagy. (A) Neuro2a cells expressing GFP-tagged SIDT1 were incubated with LysoTracker Red. Fluorescence images were visualized using a confocal laser-scanning microscope. Scale bar: 10 μm. Colocalization rate was quantified (right panel, n=3). (B) SIDT1 was overexpressed in Neuro2a cells. Protein levels were analyzed by immunoblotting using an anti-SIDT1 antibody. (C) Lysosomes were isolated from Neuro2a cells overexpressing SIDT1 or control transfectants. The RNA uptake assay I indicated in was performed. Relative levels of RNA uptake were quantified. Mean ± SEM (n = 3). n.s., not significant.
Sidt2 knockdown impairs cellular RNA degradation
A constitutive degradation of cellular components or proteins is one of the most important physiological roles of both macroautophagy and CMA.Citation1,2 To determine whether endogenous SIDT2 plays a role in RNA degradation at the cellular level, endogenous RNA was labeled with [3H]-uridine in Sidt2 knockdown cells or control siRNA-transfected cells. The levels of labeled RNA in cells were measured at 0, 6 and 24 h (), with labeled RNA levels normalized to total protein levels. To exclude the involvement of macroautophagy, we performed pulse-chase experiments using the macroautophagy deficient atg5 (autophagy-related 5)-knockout (KO) MEFs. Our results show that RNA degradation was impaired in Sidt2 knockdown cells compared with that in control cells (). We confirmed that the conversion of MAP1LC3A/B-I to MAP1LC3A/B-II was not observed in atg5 KO MEFs (). To confirm that the effects of Sidt2-knockdown on radioactive uridine are due to impaired lysosomal degradation of RNA, we used chloroquine (CQ), which is an established inhibitor of lysosomal enzymes,Citation20 in pulse-chase experiments (). If knockdown of Sidt2 impairs lysosomal degradation of RNA, effect of CQ on RNA degradation should be decreased in Sidt2-knockdown cells. CQ treatment inhibited RNA degradation in control knockdown cells, whereas it did not inhibit it in Sidt2-knockdown cells (). This result supports the notion that Sidt2 knockdown impairs the lysosomal degradation of RNA in cells. In WT MEFs, knockdown of Sidt2 inhibited ˜50% of total RNA degradation (), and pulse-chase experiments using CQ confirmed that knockdown of Sidt2 inhibits lysosomal degradation of RNA in these cells (), suggesting that SIDT2-mediated RNA degradation, presumably RNautophagy, is a main pathway for constitutive lysosomal degradation of RNA in MEFs. Similar results were obtained when another siRNA against Sidt2 (Sidt2 siRNA-B) was used for knockdown (). We confirmed that the macroautophagic flux, an indicator of activity of macroautophagy,Citation20 is not significantly changed by knockdown of Sidt2 in WT MEFs (). Thus, the effect of Sidt2 knockdown is independent of macroautophagy, and Sidt2 knockdown does not affect lysosomal enzymatic activity. Taken together, our findings indicate that SIDT2 is essential for normal levels of RNA degradation in cells, and strongly suggest that one of the physiological roles of RNautophagy is a constitutive degradation of cellular RNA.
Figure 7. Effects of Sidt2 knockdown on cellular RNA degradation. (A) Experimental paradigm for monitoring the degradation of cellular RNA. CQ, chloroquine. (B, F, H and K) Decreased levels of SIDT2 proteins in atg5 KO MEFs and in WT MEFs transfected with Sidt2-siRNA were confirmed by immunoblotting. Mean ± SEM (n = 4). ***, P < 0.001. * indicates nonspecific bands which are not decreased by Sidt2 knockdown. (C) RNA turnover in atg5 KO MEFs cells, transfected as indicated, was measured as described in (A, upper panel) and Materials and Methods. Results are expressed as mean ± SEM (n = 4). ***, P < 0.001, n.s., not significant, compared with 0 h. §§§P < 0.001, compared with time-matched control. In control and Sidt2-knockdown cells, 37.3 ± 0.6 and 21.1 ± 0.6 (mean ± SEM) % of RNA was calculated to be degraded during 24 h, respectively, and 20.9 ± 3.1 and 5.5 ± 1.3 (mean ± SEM) % during 6 h, respectively. (D) No conversion of MAP1LC3A/B-I to MAP1LC3A/B-II in atg5 KO MEFs was confirmed by immunoblotting. (E) RNA turnover in atg5 KO MEFs cells, transfected as indicated, with or without CQ was measured as described in (A, lower panel) and Materials and Methods. Mean ± SEM (n = 4). ***, P < 0.001, n.s., not significant. In control and Sidt2-knockdown cells without CQ treatment, 40.1 ± 2.0 and 26.2 ± 0.6 (mean ± SEM) % of RNA was calculated to be degraded during 24 h, respectively. In control and Sidt2-knockdown cells with CQ treatment, 24.7 ± 2.0 and 20.9 ± 0.9 (mean ± SEM) % of RNA was calculated to be degraded during 24 h, respectively. (G) RNA turnover in WT MEFs, transfected as indicated, with or without CQ were measured as described in (E). Mean ± SEM (n = 4). ***, P < 0.001, n.s., not significant. In control and Sidt2-knockdown cells without CQ treatment, 43.8 ± 2.6 and 21.8 ± 1.9 (mean ± SEM) % of RNA was calculated to be degraded during 24 h, respectively. Contribution of SIDT2 for total cellular RNA degradation was calculated to be 50.2%. In control and Sidt2-knockdown cells with CQ treatment, 23.7 ± 2.1 and 16.6 ± 1.8 (mean ± SEM) % of RNA was calculated to be degraded during 24 h, respectively. (I) RNA turnover in atg5 KO MEFs cells, transfected as indicated, was measured as described in (C). Results are expressed as mean ± SEM (n = 4). ***, P < 0.001; n.s., not significant, compared with 0 h. §§§, P < 0.001, compared with time-matched control. (J) RNA turnover in atg5 KO MEFs cells, transfected as indicated, with or without CQ was measured as described in (E). Mean ± SEM (n = 4). ***, P < 0.001, n.s., not significant. (L) RNA turnover in WT MEFs, transfected as indicated, with or without CQ were measured as described in (E). Mean ± SEM (n = 4). ***, P < 0.001; n.s., not significant. (M and N) Macroautophagic flux assay was performed as described in Materials and Methods. Mean ± SEM (n = 3). n.s., not significant. (O) WT MEFs were transfected with siRNAs as indicated, and labeled with [3H]-uridine for 24 h. Then, acid-soluble radioactivity of cells was measured as described in Materials and Methods. Mean ± SEM (n = 4). ***, P < 0.001.
![Figure 7. Effects of Sidt2 knockdown on cellular RNA degradation. (A) Experimental paradigm for monitoring the degradation of cellular RNA. CQ, chloroquine. (B, F, H and K) Decreased levels of SIDT2 proteins in atg5 KO MEFs and in WT MEFs transfected with Sidt2-siRNA were confirmed by immunoblotting. Mean ± SEM (n = 4). ***, P < 0.001. * indicates nonspecific bands which are not decreased by Sidt2 knockdown. (C) RNA turnover in atg5 KO MEFs cells, transfected as indicated, was measured as described in (A, upper panel) and Materials and Methods. Results are expressed as mean ± SEM (n = 4). ***, P < 0.001, n.s., not significant, compared with 0 h. §§§P < 0.001, compared with time-matched control. In control and Sidt2-knockdown cells, 37.3 ± 0.6 and 21.1 ± 0.6 (mean ± SEM) % of RNA was calculated to be degraded during 24 h, respectively, and 20.9 ± 3.1 and 5.5 ± 1.3 (mean ± SEM) % during 6 h, respectively. (D) No conversion of MAP1LC3A/B-I to MAP1LC3A/B-II in atg5 KO MEFs was confirmed by immunoblotting. (E) RNA turnover in atg5 KO MEFs cells, transfected as indicated, with or without CQ was measured as described in (A, lower panel) and Materials and Methods. Mean ± SEM (n = 4). ***, P < 0.001, n.s., not significant. In control and Sidt2-knockdown cells without CQ treatment, 40.1 ± 2.0 and 26.2 ± 0.6 (mean ± SEM) % of RNA was calculated to be degraded during 24 h, respectively. In control and Sidt2-knockdown cells with CQ treatment, 24.7 ± 2.0 and 20.9 ± 0.9 (mean ± SEM) % of RNA was calculated to be degraded during 24 h, respectively. (G) RNA turnover in WT MEFs, transfected as indicated, with or without CQ were measured as described in (E). Mean ± SEM (n = 4). ***, P < 0.001, n.s., not significant. In control and Sidt2-knockdown cells without CQ treatment, 43.8 ± 2.6 and 21.8 ± 1.9 (mean ± SEM) % of RNA was calculated to be degraded during 24 h, respectively. Contribution of SIDT2 for total cellular RNA degradation was calculated to be 50.2%. In control and Sidt2-knockdown cells with CQ treatment, 23.7 ± 2.1 and 16.6 ± 1.8 (mean ± SEM) % of RNA was calculated to be degraded during 24 h, respectively. (I) RNA turnover in atg5 KO MEFs cells, transfected as indicated, was measured as described in (C). Results are expressed as mean ± SEM (n = 4). ***, P < 0.001; n.s., not significant, compared with 0 h. §§§, P < 0.001, compared with time-matched control. (J) RNA turnover in atg5 KO MEFs cells, transfected as indicated, with or without CQ was measured as described in (E). Mean ± SEM (n = 4). ***, P < 0.001, n.s., not significant. (L) RNA turnover in WT MEFs, transfected as indicated, with or without CQ were measured as described in (E). Mean ± SEM (n = 4). ***, P < 0.001; n.s., not significant. (M and N) Macroautophagic flux assay was performed as described in Materials and Methods. Mean ± SEM (n = 3). n.s., not significant. (O) WT MEFs were transfected with siRNAs as indicated, and labeled with [3H]-uridine for 24 h. Then, acid-soluble radioactivity of cells was measured as described in Materials and Methods. Mean ± SEM (n = 4). ***, P < 0.001.](/cms/asset/dbe3b1f7-8c8c-458d-8186-3e106c73c013/kaup_a_1145325_f0007_b.gif)
Impaired RNA degradation may affect metabolic turnover of RNA, and thus alter cellular nucleotide or nuleoside levels. To assess whether knockdown of Sidt2 affects the RNA-related nucleotide or nucleoside levels, we measured cellular uridine nucleotide or nucleoside levels using radioactive uridine. As shown in , knockdown of Sidt2 decreased the cellular uridine nucleotide or nucleoside levels, suggesting that SIDT2 and RNautophagy are important for normal cellular metabolism of RNA.
Discussion
In the present study, we have found that SIDT2 mediates translocation of RNA into lysosomes during RNautophagy. The lysosomal membrane localization of SIDT2 may indicate that its main function is the translocation of RNA across the lysosomal membrane. At present, the precise mechanisms underlying the translocation of RNA across the lysosomal membrane have remained unclear. There are 2 possibilities that account for the translocation of RNA via SIDT2. The first possibility is that SIDT2 functions as an RNA transporter or channel. The second is that SIDT2 mediates deformations of the lysosomal membrane, such as a microautophagy-like process.
SID-1 contains 11 predicted transmembrane domains.Citation8 The N terminus of SID-1 protrudes into the extracellular space, while the C terminus is located in the cytosol.Citation8 SIDT2 was predicted to possess 9 transmembrane domains (Fig. S2). Consistent with the topology of SID-1, the N- and C-terminal domains of SIDT2 were predicted to be located in the lysosome and cytoplasm, respectively (Fig. S2). Results from a structural study showed that the extracellular domain of SIDT1 forms a stable tetrameric structure, which is characterized as “a compact, puck-shaped globular particle.”Citation21 However, the mechanism of translocation for nucleic acids through SIDT proteins remains unclear. Structural studies of full-length SIDT1 and/or SIDT2 are required to clarify this issue.
We demonstrated that the mutant SIDT2S564A is inactive in translocating RNA (). SIDT2 has been reported to be a putative hydrolase, and Ser564 appears to be important for this activity, because the corresponding serine residues are conserved among the transmembrane hydrolase superfamily, including known hydrolases.Citation22 Therefore, the putative hydrolase activity of SIDT2 is probably involved in mechanism of RNA transport and required for RNA transport during RNautophagy. Identification of the hydrolase activity of SIDT2 and its substrate should contribute to further understanding of the mechanisms underlying RNautophagy.
SID-1 has been reported to transport dsRNA and hairpin RNA containing both double- and single-stranded regions, but not short single-stranded RNA.Citation9 In the present study, we showed that SIDT2 translocates multiple mRNAs and rRNAs into lysosomes in vitro (), indicating that SIDT2 is able to translocate single-stranded RNA. Whether or not SIDT2 translocates dsRNA into lysosomes is currently unclear.
Because SID-1 is a putative bidirectional channel for RNA,Citation9 it is possible that SIDT2 also mediates bidirectional transport of RNA. However, we assume that SIDT2 is not involved in the export of RNA from lysosomes because imported RNA would likely be degraded into nucleosides or nucleotides, and there are multiple transporters for nucleosides or nucleotides on the lysosomal membrane.Citation14,15 Degraded RNA might be exported from lysosomes by nucleoside or nucleotide transporters. In yeast, RNAs imported to vacuoles by macroautophagy are degraded into nucleosides, and then exported from vacuoles.Citation23
A recent study showed that plasmid DNA can be imported into cultured silkworm cells by SID-1.Citation24 Considering that plasmid DNA is a substrate of DNautophagy in vitro,Citation4 it is possible that SIDT2 also mediates translocation of DNA during DNautophagy. Whether SIDT2 is involved in the transport of DNA is currently the subject of ongoing research.
We previously reported that the cytosolic region of LAMP2C directly binds to RNA, and that overexpression of LAMP2C enhances RNautophagy, indicating that LAMP2C can function as an RNA receptor during RNautophagy.Citation3 In the present study, we found that SIDT2 interacts with LAMP2C (). Using LAMP2-deficient cells, however, we showed that SIDT2 is able to function independently of LAMP2C (). This is consistent with our previous report showing that RNautophagy activity is not completely abolished in lysosomes from lamp2 KO mice.Citation3 Taken together, these results indicate that LAMP2 is not required for RNautophagy. We speculate that SIDT2 is more important than LAMP2C in the process of RNautophagy. At present, whether or not SIDT2 functions cooperatively with LAMP2C in the presence of LAMP2C is unclear.
In our current study, RNautophagy activities were detected in 5 different cell lines (Human HeLa, human 293FT, murine Neuro2a, murine NIH/3T3 and MEF), suggesting that RNautophagy occurs in wide variety of cells. These observations are consistent with the almost ubiquitous expression of SIDT2.Citation12,13
In the present study, Sidt2 knockdown inhibited ˜50% of total cellular RNA degradation in WT MEFs (). Although RNAs can be degraded by exonucleases in the cytoplasm or nucleus,Citation25 we showed that the inhibition of RNA degradation in Sidt2 knockdown cells is mainly due to impaired lysosomal degradation of RNA (). Our results strongly suggest that RNautophagy is involved in cellular RNA degradation in mammalian cells, and one of the physiological roles of RNautophagy is the constitutive degradation of cellular RNA. Although late endosomal microautophagyCitation26 and macroautophagy could also mediate cellular RNA degradation, we showed that the effect of Sidt2 knockdown on RNA degradation is independent of macroautophagy (). Considering that SIDT2 does not localize to late endosomes (), the possibility that SIDT2 functions in late endosomal microautophagy is low. However, the possibility that Sidt2 knockdown partly and indirectly affects late endosomal microautophagy at the cellular level cannot be completely excluded.
A recent study reports that targeted deletion of exon 2 of the Sidt2 gene results in growth defects and glucose intolerance in mice.Citation27 These findings, together with the predominant localization of SIDT2 to lysosomes, strongly suggest that RNautophagy is essential for normal cell homeostasis. However, SIDT2 protein is not completely eliminated in the mice with deletion of exon 2 of the Sidt2 gene,Citation27 suggesting that some splice variants of Sidt2 are not deficient in these mice. Generation and investigation of complete Sidt2-deficient mice would contribute to further understanding of biological significance of SIDT2-mediated RNautophagy and SIDT2-mediated constitutive degradation of RNA.
Materials and methods
Plasmid generation
The cDNAs encoding mouse SIDT2 and mouse SIDT1 were purchased from Open Biosystems-Thermo Scientific Inc.. (MMM1013-202769049 and MMM1013-202797985, respectively). DNA encoding human LAMP2C (NCBI reference sequence: NM_001122606) was synthesized by IDT, Inc. The cDNA encoding human CTSB was cloned from HeLa cells using reverse transcriptase PCR. For generation of pCI-neo-hLAMP2C, pCI-neo-mSIDT2 and pCI-neo-mSIDT1 vectors, each cDNA or synthetic DNA was amplified by PCR, and amplicons were subcloned into a pCI-neo mammalian expression vector (Promega, E1841) using XhoI and NotI recognition sites. We used specific primers to amplify mouse Sidt2 (5′-AAA ACT CGA GCC GCC ACC ATG ATC GCC TGG CGT CTG CC-3′ and 5′-AAA AGC GGC CGC CTA GAA GAC ATA GAT CTT GTC CC-3′), mouse Sidt1 (5′-AAA ACT CGA GCC GCC ACC ATG CTG GAC TGC CTG CGC CTG GCG-3′ and 5′-AAA AGC GGC CGC TCA GAA GAC AGG GAT CTG GTC TCT CCG-3′) and human LAMP2C (5′-AAA ACT CGA GCC GCC ACC ATG GTG TGC TTC CGC CTC TTC CC-3′ and 5′-AAA AGC GGC CGC TTA CAC AGA CTG ATA ACC AGT ACG AC-3′). To generate pCI-neo-mSIDT2-FLAG for the expression of SIDT2 with a FLAG tag at the C terminus, and pCI-neo-hLAMP2C-FLAG for the expression of LAMP2C with a FLAG tag at the hinge region (between Leu-350 and Arg-351), a DNA sequence encoding FLAG was inserted using the Quik-Change Mutagenesis Kit according to the manufacturer's instructions (Stratagene Inc.., 200518). A FLAG tag was fused to the C terminus of SIDT2, because SIDT2 possesses a signal peptide at the N terminus. We used specific primers to amplify Sidt2-FLAG (5′-AAA ACT CGA GCC GCC ACC ATG ATC GCC TGG CGT CTG CC-3′ and 5′-AAA AGC GGC CGC CTA CTT GTC ATC GTC GTC CTT GTA GTC GAA GAC ATA GAT CTT GTC CC-3′) and LAMP2C-FLAG (5′-GAC TAC AAG GAC GAC GAT GAC AAG AGG GTT CAG CCT TTC AAT GTG ACA C-3′ and 5′-CTT GTC ATC GTC GTC CTT GTA GTC TAG ATC AAA GGT ATT TAT CTG AAA-3′). For generation of pCI-neo-CTSB-FLAG for the expression of human CTSB with a FLAG tag at the C terminus, cDNA was amplified by PCR, and amplicons were subcloned into a pCI-neo using XhoI and NotI recognition sites. We used specific primers to amplify CTSB (5′-AAA ACT CGA GCC GCC ACC ATG TGG CAG CTC TGG GCC TCC C-3′ and 5′-AAA AGC GGC CGC TAC TTG TCA TCG TCG TCC TTG TAG TCG ATC TTT TCC CAG TAC TGA TCG GTG-3′). To generate pEGFP-mSIDT2 and pEGFP-mSIDT1 for expression of SIDT2 and SIDT1 with an EGFP tag at the C terminus, cDNA was amplified by PCR, and the amplicon was subcloned into pEGFP-N1 (Clontech, product number is unavailable) using XhoI and EcoRI or XhoI and BamHI recognition sites. We used Sidt2-specific primers (5′-AAA ACT CGA GCC GCC ACC ATG ATC GCC TGG CGT CTG CC-3′ and 5′-AAA AGA ATT CTG AAG ACA TAG ATC TTG TCC C-3′) and Sidt1-specific primers (5′-AAA ACT CGA GCC GCC ACC ATG CTG GAC TGC CTG CGC CTG GCG-3′ and 5′-AAA AGG ATC CCA GAA GAC AGG GAT CTG GTC TCT CCG-3′) for PCR amplification. Plasmids for the expression of the mutant SIDT2S564A were constructed using the Quik-Change Mutagenesis Kit. All resulting constructs were confirmed by sequencing.
Cell culture and transfection
The human adenocarcinoma cell line HeLa, the mouse neuroblastoma cell line Neuro2a, the mouse fibroblast cell line NIH/3T3 and the human embryonic kidney cell line 293FT were maintained in Dulbecco's modified Eagle's medium (Gibco-Life Technologies, C11995500) supplemented with 10% fetal bovine serum (Sigma-Aldrich, 172012) at 37°C, 5% CO2. In this study, we used these 4 cell lines because they can be transfected easily, and to show that the experimental findings are not cell specific. We mainly used HeLa cells, because we previously showed that RNautophagy is active in this cell line.Citation3 Most of overexpression experiments () were performed with Neuro2a cells because mouse Sidt2 and Sidt1 cDNAs were used for overexpression. The Atg5-deficient (atg5−/−) mouse embryonic fibroblasts (MEFs), and WT MEFs (Atg5+/+) were kind gifts from Dr. Noboru Mizushima (The University of Tokyo, Tokyo, Japan), and maintained as described elsewhere.Citation28 The LAMP2-deficient HeLa cells were generated using the CRISPR/Cas9 system (PrecisionX Cas9 SmartNuclease Vector System, System Biosciences, CAS900A-1) according to the manufacturer's protocols. The target DNA sequence was 5'-TCCGGGCTCAGGGCTCGTTC-3' in exon 1 of the LAMP2 gene. Transient transfection of cells with each vector was performed using Lipofectamine LTX with PLUS reagent (Life Technologies, 15338100) according to the manufacturer's instructions.
Immunofluorescence staining
Cells grown on chamber slides were washed with phosphate-buffered saline (PBS; Life Technologies, C14190500BT) and fixed using 3.7% formaldehyde in PBS for 20 min at room temperature. Fixed cells were permeabilized with 0.1% (v/v) Tween 20 (Sigma-Aldrich, P1379) in PBS for 5 min, blocked with 3% bovine serum albumin (BSA; Iwai Chemicals, A001) in PBS for 1 h, and incubated with primary antibodies overnight at 4°C. After washing, cells were incubated with Alexa Fluor 594-conjugated secondary antibodies (Abcam, ab150108) for 1 h at room temperature, and slides were mounted with ProLong Gold antifade reagent (Life Technologies, P36934). Images were acquired using a confocal laser microscope (FV1000D IX81, Olympus, Tokyo, Japan) using a 60× oil immersion objective lens, and captured with Fluoview software (Olympus). The antibodies used were anti-EEA1 antibody (1G11; Abcam, ab70521), anti-RAB7A antibody (Rab7-117; Abcam, ab50533) and anti-MAP1LC3A/B antibody (4E12; MBL, M152-3). For labeling of lysosomes, cells were incubated with 100 nM LysoTracker Red DND 99 (Life Technologies, L-7528) in growth medium for 1 h, and fluorescence image acquisition was performed with a FLUOVIEW FV10i confocal microscope (Olympus, Tokyo, Japan). Quantification and calculation of colocalization rates were performed using ImageJ software version 1.46r (National Institutes of Health) via the JACoP Plugin as described in the literature.Citation29
Immunoprecipitation and immunoblotting
Immunoprecipitation was performed as described previously,Citation30 with slight modifications. Briefly, cells or whole mouse brains were lysed or homogenized in lysis buffer containing 50 mM Tris-HCl, pH 7.5, 150 mM NaCl, 5 mM EDTA, 1% Triton X-100 (Sigma-Aldrich, T8787) and protease inhibitors (Complete, EDTA-free; Roche Diagnostics, 11873580001) at 4°C. Lysates were centrifuged at 20,000 × g for 10 min at 4°C, and the supernatant fractions were immunoprecipitated using Anti-FLAG M2 Affinity Gel (Sigma-Aldrich, A2220) or primary antibodies as listed below. The primary antibodies used for immunoprecipitation or immunoblotting were: polyclonal goat anti-SIDT2 (N-20; Santa Cruz Biotechnology, sc-54151), polyclonal goat anti-SIDT1 (GeneTex, GTX88799), monoclonal rat anti-LAMP2 (M3/84; Santa Cruz Biotechnology, sc-19991), monoclonal mouse anti-DYKDDDDK (FLAG; Wako Pure Chemical Industries, 018-22783), monoclonal rabbit anti-SCARB2/LIMP2 (EPR12080; Abcam, ab176317), monoclonal mouse anti-RAB7A (Rab7-117; Abcam, ab50533), monoclonal mouse anti-RAB5A (RAB5A, member RAS oncogene family) (D-11; Santa Cruz Biotechnology, sc-46692), monoclonal mouse anti-MAP1LC3A/B (4E12; MBL, M152-3), polyclonal rabbit anti-LMNA (lamin A) (H-102; Santa Cruz Biotechnology, sc-20680), monoclonal mouse anti-COX4I1 (cytochrome c oxidase subunit IV isoform 1) (20E8C12; Life Technologies, A21348), monoclonal mouse anti-GOLGA1/Golgin-97 (CDF4; Life Technologies, A-21270), polyclonal rabbit anti-CANX (calnexin) (Abcam, ab22595), monoclonal mouse anti-GAPDH (6C5; Merck Millipore, CB1001), polyclonal rabbit anti-TUBB (tubulin, β)/β-tubulin (Cell Signaling Technology, 2146), and monoclonal mouse anti-ACTB/β-actin (AC-15; Sigma-Aldrich, A5441). The rabbit polyclonal anti-LAMP2C antibody was prepared as described previously.Citation3 The rabbit polyclonal anti-SIDT2 antibody was raised in a rabbit against synthetic peptides (C+STWQKTPAESREHNR) containing an amino acid sequence corresponding to the C-terminal region of SIDT2. The specificity of the rabbit anti-SIDT2 antibody was confirmed as shown in Fig. S7D. The polyclonal goat anti-SIDT2 antibody was used for detection of murine SIDT2, while the polyclonal rabbit anti-SIDT2 antibody was used to detect human SIDT2. Following overnight incubation with primary antibodies at 4°C, each blot was probed with horseradish peroxidase (HRP)-conjugated anti-rabbit IgG (Thermo Scientific, 31460), anti-mouse IgG (Thermo Scientific, 31430) anti-goat IgG (Jackson ImmunoResearch, 305-036-003), or anti-rat IgG antibodies (Jackson ImmunoResearch, 112-035-003). In some experiments, the Can Get Signal Immunoreaction Enhancer Solution (Toyobo, NKB101) was used. Immunoreactive signals were visualized using the SuperSignal West Dura extended duration substrate (Thermo Scientific, 34075) and detected with a chemiluminescence imaging system (ImageQuant LAS 4000; Fujifilm). Signal intensity was quantified using ImageJ software.
RNA interference
For siRNA-mediated knockdown of SIDT2 or Sidt2, cells were transfected with 10 nM of SIDT2- or Sidt2-targeting, or control siRNAs using Lipofectamine RNAiMAX (Life Technologies, 13778075) for 72 h. The interference efficiency was evaluated by immunoblotting. The target sequences are 5′-GAG GAU GAC UAC GAC ACA U-3′ (human SIDT2 siRNA-A), 5′-CUA UGG UUG CAU UUC CGU U-3′ (human SIDT2 siRNA-B), 5′-CAG CAC GAC UUC UUC AAG U-3′ (EGFP siRNA for human cellsCitation31), 5′-GUU CUG UGU UAG UCA CGU A-3′ (mouse Sidt2 siRNA-A), 5′-GAG UUU CCG UCC AGU AUU U-3′ (mouse Sidt2 siRNA-B), and 5′-GCC ACA ACG UCU AUA UCA U-3′ (EGFP siRNA for mouse cellsCitation32). EGFP siRNAs were used as a control.
Total RNA isolation
Total RNA from cultured cells or mouse brains was isolated using TRIzol Reagent (Life Technologies, 15596-018) and quantified with a NanoDrop1000 analyzer (Thermo Scientific, Waltham, MA, USA). Total RNA that does not contain small RNAs was isolated using ISOGEN II (Nippon Gene, 311-07361). All animal experiments were approved by the animal experimentation committee of the National Center of Neurology and Psychiatry.
Uptake and degradation of RNA by isolated lysosomes
RNA uptake and degradation was assessed using a cell-free system of intact lysosomes as described previously.Citation3 Briefly, lysosomes were isolated from mouse brains or from cultured cells by density gradient centrifugation. Isolated lysosomes (25 to 50 µg of protein) were incubated with 5 µg of total RNA derived from mouse brains at 37°C for 5 min in 30 µl of 0.3 M sucrose (Sigma-Aldrich, 28-0010-5) containing 10 mM MOPS buffer (pH 7.0) with an energy regeneration system (10 mM ATP, 10 mM MgCl2, 2 mM phosphocreatine, and 5 µg/ml creatine phosphokinase). For uptake assays, lysosomes were precipitated by centrifugation after the reaction, and RNA levels remaining in the supernatant were analyzed by agarose gel electrophoresis with ethidium bromide staining and UV illumination. In parallel, to directly assess the levels of RNA taken up by lysosomes, RNA outside of lysosomes was degraded by adding 30 µl of 0.3 M sucrose containing 10 μg of RNase A (Qiagen, 19101) to the precipitated lysosomes. RNase A treatment was carried out for 30 min at 4°C, and then RNA was extracted using TRIzol. The levels of RNase A-resistant RNA were analyzed by agarose gel electrophoresis. For degradation assays, RNA was extracted using TRIzol after the reaction, and the total levels of RNA in the samples were analyzed.
Measurement of RNA degradation
RNA degradation in WT MEFs and atg5 KO MEFs was measured as described previously,Citation33 with slight modifications. Cells grown in 24-well culture plates were transfected with Sidt2 or control siRNAs for 48 h, and then 0.3 µCi/ml (˜0.012 pM) [3H]-uridine (PerkinElmer, NET367001MC) was added to the culture medium to label RNA in cells (pulse). After 24 h of labeling (72 h post-transfection), cells were washed with 500 µl of growth medium containing 5 mM unlabeled uridine (excess amount of uridine compared with [3H]-uridine), and incubated in another 500 µl of the same medium (chase). After 0, 6 and 24 h of incubation, cells were trypsinized and acid-insoluble radioactivity was measured using a liquid scintillation counter (Tri-Carb 3100TR; PerkinElmer, Waltham, MA, USA). In some experiments, cells were treated with chloroquine (CQ; 50 µM) in the chase medium for 0 or 24 h (). Radioactivity was normalized to levels of total proteins, and expressed as percentage of radioactivity at 0 h in control- or Sidt2-siRNA transfected cells. From radioactivity at 0 h, the weight of [3H]-uridine that was incorporated into RNA was calculated to be under 0.02% (w/w) of the weight of total RNA. Therefore, reincorporation of [3H]-uridine into RNA during the chase is negligible. RNA degradation rate (%) was calculated by subtracting the relative acid-insoluble radioactivity (% of 0 h) from 100% (relative acid-insoluble radioactivity at 0 h). Contribution of SIDT2 for total cellular RNA degradation (%) was calculated by the formula SIDT2 contribution (%) = (RNA degradation rate in control cells (%) - RNA degradation rate in Sidt2-knockdown cells (%)) / RNA degradation rate in control cells (%) × 100. Measurement of cellular nucleotide or nucleoside levels was performed as described in the literatureCitation34,35 with some modifications. Cells were transfected with siRNAs, labeled with [3H]-uridine for 24 h and washed as described above. Then, acid-soluble radioactivity of cells was measured, and normalized to levels of total proteins.
Electron microscopy
Electron microscopy was performed as previously described.Citation3 To observe their morphology, isolated lysosomes were fixed with 2.5% glutaraldehyde in phosphate buffer (pH 7.2) overnight at 4°C, and postfixed with 1% osmium for 1 h at room temperature. Samples were then dehydrated using a series of water/ethanol mixtures up to 100% ethanol, and embedded in Epon (Nisshin EM Co., Ltd., 3402). The embedded samples were sectioned at 70 nm, collected on 400-mesh copper grids (Nisshin EM Co., Ltd., 2507), and observed under a Tecnai Spirit transmission electron microscope (FEI Company, Eindhoven, The Netherlands) at 120 kV.
For immunogold electron microscopy, isolated lysosomes were fixed in 0.1% glutaraldehyde and 4% paraformaldehyde in PBS overnight at 4°C. Samples were then dehydrated in a series of water/ethanol mixtures up to 100% ethanol, and embedded in LR White (Nisshin EM Co., Ltd., 3962). The embedded samples were sectioned at 100 nm, and collected on 400-mesh nickel grids coated with collodion (Nisshin EM Co., Ltd., custom-made). Immunogold labeling was performed using an anti-rRNA antibody (Y10b; Abcam, ab37144) followed by anti-mouse IgG coupled with 10-nm gold particles (GE Healthcare, RPN431V), and viewed using a Tecnai Spirit transmission electron microscope at 80 kV. The Y10b antibody specifically recognizes several different rRNAs from diverse species, including 28S, 18S and 5.8S rRNAs.Citation36
Quantitative PCR (qPCR)
We reverse transcribed 1 μg of total RNA using a QuantiTect Reverse Transcription Kit (Qiagen, 205311) in a final volume of 20 µl, according to the manufacturer's instructions. For qPCR assays, an Mx3000P qPCR System (Stratagene) and SYBR Premix ExTaq II (Takara Bio Inc.., RR820) were used. We used primers specific for mouse Actb/β-actin (5′-CGT GCG TGA CAT CAA AGA GAA-3′ and 5′-CAA TAG TGA TGA CCT GGC CGT-3′), mouse Gapdh (5′-TGT CAA GCT CT TTC CTG GTA TG-3′ and 5′-TTA TGG GGG TCT GGG ATG GA-3′), mouse Uchl1 (5′-TTT TTC GGC TCC TCG GGT TT-3′ and 5′-TGG CCA ACA CTT TGT TCA GC-3′), mouse 5S rRNA (5′-GTC TAC GGC CAT ACC ACC C-3′ and 5′-AAG CCT ACA GCA CCC GGT ATT-3′), and mouse 5.8S rRNA (5′-GGT GGA TCA CTC GGC TCG T-3′ and 5′-GCA AGT GCG TTC GAA GTG TC-3′). Test samples were assayed in 20-µl reactions comprising 10 µl of Premix, 0.5 µM primers, 2 µl of cDNA and 6 µl of nuclease-free H2O. Nontemplate controls were also included. The thermal cycling profile consisted of an initial denaturation step (30 s at 95°C), followed by 40 cycles of amplification (95°C for 5 s 60°C for 30 s). Following amplification, melting curve analysis was performed to verify the authenticity of the amplified product and determine its specific melting temperature.
Macroautophagic flux assay
Macroautophagic flux assay was performed as described in the literature.Citation20 Briefly, WT MEFs were transfected with siRNA. Forty-eight h after the transfection, cells were incubated with or without 50 µM CQ for 4 or 24 h. Then, cell lysates were prepared and subjected to immunoblotting, and relative levels of MAP1LC3A/B-II and TUBB/β-tubulin were quantified. MAP1LC3A/B-II levels were normalized by TUBB levels. Macroautophagic flux was calculated by subtracting the normalized MAP1LC3A/B-II levels in CQ- samples from the levels in CQ+ samples.
Statistical analysis
We used the Student t test for the comparison of 2 sets of data. For comparison of more than 2 groups, analysis of variance (ANOVA) with the Tukey multiple comparison test was used, unless otherwise mentioned.
Abbreviations
| ACTB | = | actin, β |
| Atg5 | = | autophagy-related 5 |
| BSA | = | bovine serum albumin |
| CANX | = | calnexin |
| CMA | = | chaperone-mediated autophagy |
| COX4I1 | = | cytochrome c oxidase subunit IV isoform 1 |
| CTSB | = | cathepsin B |
| CQ | = | chloroquine |
| dsRNA | = | double-stranded RNA |
| EEA1 | = | early endosome antigen 1 |
| GAPDH | = | glyceraldehyde-3-phosphatedehydrogenase |
| GOLGA1 | = | golgi autoantigen, golgin subfamily a, 1 |
| HSPA8 | = | heat shock protein family A (Hsp70) member 8 |
| KO | = | knockout |
| LAMP2 | = | lysosomal-associated membrane protein 2 |
| LMNA | = | lamin A |
| MAP1LC3A | = | microtubule-associated protein 1 light chain 3 α |
| MAP1LC3B | = | microtubule-associated protein 1 light chain 3 β |
| MEF | = | mouse embryonic fibroblast |
| PBS | = | phosphate-buffered saline |
| RAB5A | = | RAB5A, member RAS oncogene family |
| RAB7A | = | RAB7A, member RAS oncogene family |
| RNase A | = | ribonuclease A |
| SCARB2/LIMP2 | = | scavenger receptor class B, member 2 |
| SID-1 | = | systemic RNA interference deficient-1 |
| SIDT1 | = | SID1 transmembrane family, member 1 |
| SIDT2 | = | SID1 transmembrane family, member 2 |
| TUBB | = | tubulin, β |
| Uchl1 | = | ubiquitin carboxyl-terminal hydrolase L1 |
| WT | = | wild type |
Disclosure of potential conflicts of interest
No potential conflicts of interest were disclosed.
2015AUTO0456R2-s02.pdf
Download PDF (9.4 MB)Acknowledgments
We are grateful to Dr Noboru Mizushima for helpful discussions and for the Atg5-deficient and WT MEFs; and to Dr Yoshinori Ohsumi for his helpful discussions and suggestions.
Additional information
Funding
References
- Mizushima N, Komatsu M. Autophagy: renovation of cells and tissues. Cell 2011; 147:728-41; PMID:22078875; http://dx.doi.org/10.1016/j.cell.2011.10.026
- Kaushik S, Cuervo AM. Methods to monitor chaperone-mediated autophagy. Methods Enzymol 2009; 452:297-324; PMID:19200890; http://dx.doi.org/10.1016/S0076-6879(08)03619-7
- Fujiwara Y, Furuta A, Kikuchi H, Aizawa S, Hatanaka Y, Konya C, Uchida K, Yoshimura A, Tamai Y, Wada K, et al. Discovery of a novel type of autophagy targeting RNA. Autophagy 2013; 9:403-9; PMID:23291500; http://dx.doi.org/10.4161/auto.23002
- Fujiwara Y, Kikuchi H, Aizawa S, Furuta A, Hatanaka Y, Konya C, Uchida K, Wada K, Kabuta T. Direct uptake and degradation of DNA by lysosomes. Autophagy 2013; 9:1167-71; http://dx.doi.org/10.4161/auto.24880
- Fujiwara Y, Hase K, Wada K, Kabuta T. An RNautophagy/DNautophagy receptor, LAMP2C, possesses an arginine-rich motif that mediates RNA/DNA-binding. Biochem Biophys Res Commun 2015; 460:281-6; PMID:25772617; http://dx.doi.org/10.1016/j.bbrc.2015.03.025
- Hase K, Fujiwara Y, Kikuchi H, Aizawa S, Hakuno F, Takahashi S, Wada K, Kabuta T. RNautophagy/DNautophagy possesses selectivity for RNA/DNA substrates. Nucleic Acids Res 2015; 43:6439-49; PMID:26038313; http://dx.doi.org/10.1093/nar/gkv579
- Carbon S, Ireland A, Mungall CJ, Shu S, Marshall B, Lewis S. AmiGO: online access to ontology and annotation data. Bioinformatics 2009; 25:288-9; PMID:19033274; http://dx.doi.org/10.1093/bioinformatics/btn615
- Feinberg EH, Hunter CP. Transport of dsRNA into cells by the transmembrane protein SID-1. Science 2003; 301:1545-7; PMID:12970568; http://dx.doi.org/10.1126/science.1087117
- Shih JD, Hunter CP. SID-1 is a dsRNA-selective dsRNA-gated channel. RNA 2011; 17:1057-65; PMID:21474576; http://dx.doi.org/10.1261/rna.2596511
- Duxbury MS, Ashley SW, Whang EE. RNA interference: a mammalian SID-1 homologue enhances siRNA uptake and gene silencing efficacy in human cells. Biochem Biophys Res Commun 2005; 331:459-63; PMID:15850781; http://dx.doi.org/10.1016/j.bbrc.2005.03.199
- Elhassan MO, Christie J, Duxbury MS. Homo sapiens systemic RNA interference-defective-1 transmembrane family member 1 (SIDT1) protein mediates contact-dependent small RNA transfer and microRNA-21-driven chemoresistance. J Biol Chem 2012; 287:5267-77; PMID:22174421; http://dx.doi.org/10.1074/jbc.M111.318865
- Wu C, Orozco C, Boyer J, Leglise M, Goodale J, Batalov S, Hodge CL, Haase J, Janes J, Huss JW, 3rd, et al. BioGPS: an extensible and customizable portal for querying and organizing gene annotation resources. Genome Biol 2009; 10:R130; PMID:19919682; http://dx.doi.org/10.1186/gb-2009-10-11-r130
- Jialin G, Xuefan G, Huiwen Z. SID1 transmembrane family, member 2 (Sidt2): a novel lysosomal membrane protein. Biochem Biophys Res Commun 2010; 402:588-94; PMID:20965152; http://dx.doi.org/10.1016/j.bbrc.2010.09.133
- Chapel A, Kieffer-Jaquinod S, Sagne C, Verdon Q, Ivaldi C, Mellal M, Thirion J, Jadot M, Bruley C, Garin J, et al. An extended proteome map of the lysosomal membrane reveals novel potential transporters. Mol Cell Proteomics 2013; 12:1572-88; PMID:23436907; http://dx.doi.org/10.1074/mcp.M112.021980
- Schroder B, Wrocklage C, Pan C, Jager R, Kosters B, Schafer H, Elsässer HP, Mann M, Hasilik A. Integral and associated lysosomal membrane proteins. Traffic 2007; 8:1676-86; http://dx.doi.org/10.1111/j.1600-0854.2007.00643.x
- Humphries WHT, Szymanski CJ, Payne CK. Endo-lysosomal vesicles positive for Rab7 and LAMP1 are terminal vesicles for the transport of dextran. PLoS One 2011; 6:e26626; http://dx.doi.org/10.1371/journal.pone.0026626
- Bucci C, Thomsen P, Nicoziani P, McCarthy J, van Deurs B. Rab7: a key to lysosome biogenesis. Mol Biol Cell 2000; 11:467-80; PMID:10679007; http://dx.doi.org/10.1091/mbc.11.2.467
- Zhang M, Dwyer NK, Neufeld EB, Love DC, Cooney A, Comly M, Patel S, Watari H, Strauss JF, 3rd, Pentchev PG, et al. Sterol-modulated glycolipid sorting occurs in niemann-pick C1 late endosomes. J Biol Chem 2001; 276:3417-25; PMID:11032830; http://dx.doi.org/10.1074/jbc.M005393200
- Winston WM, Molodowitch C, Hunter CP. Systemic RNAi in C. elegans requires the putative transmembrane protein SID-1. Science 2002; 295:2456-9; PMID:11834782; http://dx.doi.org/10.1126/science.1068836
- Klionsky DJ, Abdalla FC, Abeliovich H, Abraham RT, Acevedo-Arozena A, Adeli K, Agholme L, Agnello M, Agostinis P, Aguirre-Ghiso JA, et al. Guidelines for the use and interpretation of assays for monitoring autophagy. Autophagy 2012; 8:445-544; PMID:22966490; http://dx.doi.org/10.4161/auto.19496
- Pratt AJ, Rambo RP, Lau PW, MacRae IJ. Preparation and characterization of the extracellular domain of human Sid-1. PLoS One 2012; 7:e33607; PMID:22509261; http://dx.doi.org/10.1371/journal.pone.0033607
- Pei J, Millay DP, Olson EN, Grishin NV. CREST-a large and diverse superfamily of putative transmembrane hydrolases. Biol Direct 2011; 6:37; http://dx.doi.org/10.1186/1745-6150-6-37
- Huang H, Kawamata T, Horie T, Tsugawa H, Nakayama Y, Ohsumi Y, Fukusaki E. Bulk RNA degradation by nitrogen starvation-induced autophagy in yeast. EMBO J 2015; 34:154-68; PMID:25468960; http://dx.doi.org/10.15252/embj.201489083
- Xu J, Yoshimura K, Mon H, Li Z, Zhu L, Iiyama K, Kusakabe T, Lee JM. Establishment of Caenorhabditis elegans SID-1-dependent DNA delivery system in cultured silkworm cells. Mol Biotechnol 2014; 56:193-8; PMID:23979877; http://dx.doi.org/10.1007/s12033-013-9694-0
- Houseley J, Tollervey D. The many pathways of RNA degradation. Cell 2009; 136:763-76; http://dx.doi.org/10.1016/j.cell.2009.01.019
- Sahu R, Kaushik S, Clement CC, Cannizzo ES, Scharf B, Follenzi A, Potolicchio I, Nieves E, Cuervo AM, Santambrogio L. Microautophagy of cytosolic proteins by late endosomes. Developmental Cell 2011; 20:131-9; PMID:21238931; http://dx.doi.org/10.1016/j.devcel.2010.12.003
- Gao J, Gu X, Mahuran DJ, Wang Z, Zhang H. Impaired glucose tolerance in a mouse model of sidt2 deficiency. PLoS One 2013; 8:e66139; PMID:23776622; http://dx.doi.org/10.1371/journal.pone.0066139
- Kuma A, Hatano M, Matsui M, Yamamoto A, Nakaya H, Yoshimori T, Ohsumi Y, Tokuhisa T, Mizushima N. The role of autophagy during the early neonatal starvation period. Nature 2004; 432:1032-6; http://dx.doi.org/10.1038/nature03029
- Cordelieres FP, Bolte S. JACoP v2.0: improving the user experience with co-localization studies. Proceedings of the 2nd ImageJ User and Developer Conference 2008:174-81.
- Kabuta T, Setsuie R, Mitsui T, Kinugawa A, Sakurai M, Aoki S, Uchida K, Wada K. Aberrant molecular properties shared by familial Parkinson's disease-associated mutant UCH-L1 and carbonyl-modified UCH-L1. Hum Mol Genet 2008; 17:1482-96; http://dx.doi.org/10.1093/hmg/ddn037
- Kabuta T, Mitsui T, Takahashi M, Fujiwara Y, Kabuta C, Konya C, Tsuchiya Y, Hatanaka Y, Uchida K, Hohjoh H, et al. Ubiquitin C-terminal Hydrolase L1 (UCH-L1) Acts as a Novel potentiator of cyclin-dependent kinases to enhance cell proliferation independently of its hydrolase activity. J Biol Chem 2013; 288:12615-26; PMID:23543736; http://dx.doi.org/10.1074/jbc.M112.435701
- Kabuta T, Suzuki Y, Wada K. Degradation of amyotrophic lateral sclerosis-linked mutant Cu,Zn-superoxide dismutase proteins by macroautophagy and the proteasome. J Biol Chem 2006; 281:30524-33; PMID:16920710; http://dx.doi.org/10.1074/jbc.M603337200
- Sameshima M, Liebhaber SA, Schlessinger D. Dual pathways for ribonucleic acid turnover in WI-38 but not in I-cell human diploid fibroblasts. Mol Cell Biol 1981; 1:75-81; PMID:6086007; http://dx.doi.org/10.1128/MCB.1.1.75
- Hiraoka N, Kikuchi J, Yamauchi T, Koyama D, Wada T, Uesawa M, Akutsu M, Mori S, Nakamura Y, Ueda T, et al. Purine analog-like properties of bendamustine underlie rapid activation of DNA damage response and synergistic effects with pyrimidine analogues in lymphoid malignancies. PLoS One 2014; 9:e90675; PMID:24626203; http://dx.doi.org/10.1371/journal.pone.0090675
- Daniel JL, Molish IR, Holmsen H. Radioactive labeling of the adenine nucleotide pool of cells as a method to distinguish among intracellular compartments. Studies on human platelets. Biochimica Et Biophysica Acta 1980; 632:444-53; PMID:7417532; http://dx.doi.org/10.1016/0304-4165(80)90240-8
- Garden GA, Hartlage-Rubsamen M, Rubel EW, Bothwell MA. Protein masking of a ribosomal RNA epitope is an early event in afferent deprivation-induced neuronal death. Mol Cell Neurosci 1995; 6:293-310; PMID:7496633; http://dx.doi.org/10.1006/mcne.1995.1023