
ABSTRACT
Macroautophagy/autophagy is the main intracellular catabolic pathway in neurons that eliminates misfolded proteins, aggregates and damaged organelles associated with ageing and neurodegeneration. Autophagy is regulated by both MTOR-dependent and -independent pathways. There is increasing evidence that autophagy is compromised in neurodegenerative disorders, which may contribute to cytoplasmic sequestration of aggregation-prone and toxic proteins in neurons. Genetic or pharmacological modulation of autophagy to promote clearance of misfolded proteins may be a promising therapeutic avenue for these disorders. Here, we demonstrate robust autophagy induction in motor neuronal cells expressing SOD1 or TARDBP/TDP-43 mutants linked to amyotrophic lateral sclerosis (ALS). Treatment of these cells with rilmenidine, an anti-hypertensive agent and imidazoline-1 receptor agonist that induces autophagy, promoted autophagic clearance of mutant SOD1 and efficient mitophagy. Rilmenidine administration to mutant SOD1G93A mice upregulated autophagy and mitophagy in spinal cord, leading to reduced soluble mutant SOD1 levels. Importantly, rilmenidine increased autophagosome abundance in motor neurons of SOD1G93A mice, suggesting a direct action on target cells. Despite robust induction of autophagy in vivo, rilmenidine worsened motor neuron degeneration and symptom progression in SOD1G93A mice. These effects were associated with increased accumulation and aggregation of insoluble and misfolded SOD1 species outside the autophagy pathway, and severe mitochondrial depletion in motor neurons of rilmenidine-treated mice. These findings suggest that rilmenidine treatment may drive disease progression and neurodegeneration in this mouse model due to excessive mitophagy, implying that alternative strategies to beneficially stimulate autophagy are warranted in ALS.
Abbreviations
| ACTB | = | actin, beta |
| ALS | = | amyotrophic lateral sclerosis |
| AP | = | autophagosome |
| CHAT | = | choline acetyltransferase |
| CMA | = | chaperone-mediated autophagy |
| GFAP | = | glial fibrillary acidic protein |
| HSPA8/HSC70 | = | heat shock protein 8 |
| ISL1 | = | ISL1 transcription factor, LIM/homeodomain |
| LAMP2A | = | lysosomal-associated membrane protein 2A |
| MAP1LC3B/LC3B | = | microtubule-associated protein 1 light chain 3 beta |
| MNX1/HB9 | = | motor neuron and pancreas homeobox 1 |
| MTOR | = | mechanistic target of rapamycin (serine/threonine kinase) |
| RBFOX3/NeuN | = | RNA binding protein, fox-1 homolog (C. elegans) 3 |
| SNCA/α-synuclein | = | synuclein, alpha |
| SOD1 | = | superoxide dismutase 1, soluble |
| SQSTM1/p62 | = | sequestosome 1 |
| TARDBP/TDP-43 | = | TAR DNA binding protein |
| TOMM20 | = | translocase of outer mitochondrial membrane 20 homolog (yeast) |
| TUBB3/TuJ1 | = | tubulin, beta 3 class III |
| VCP/p97 | = | valosin containing protein |
| UPS | = | ubiquitin-proteasome system |
| WT | = | wild-type |
Introduction
Neurodegenerative disorders are characterized by intraneuronal or extracellular accumulation and aggregation of misfolded proteins, which are implicated in specific death of neuronal populations in defined regions of the CNS. In amyotrophic lateral sclerosis (ALS), a progressive, paralyzing and fatal disease, motor neurons are lost in selective regions of the brain, brainstem and spinal cord [Citation1]. While ALS is mainly sporadic, familial cases can be attributed to mutations in a growing number of genes and their products, notably SOD1 (superoxide dismutase 1), TARDBP/TDP-43 (TAR DNA binding protein), FUS (fused in sarcoma) and C9orf72 (chromosome 9 open reading frame 72) [Citation1]. A pathological hallmark of ALS is the presence of cytoplasmic ubiquitin-positive protein aggregates in affected motor neurons, which may contain misfolded forms of SOD1, TARDBP, FUS or dipeptide repeats of C9orf72 RAN translation products [Citation2,Citation3]. These proteins are present in protein aggregates of both familial and sporadic ALS, suggesting common pathological mechanisms. The accumulation of these proteins in motor neurons suggests that defects in intracellular protein clearance or handling may contribute to ALS. In addition, mutations in UBQLN2 (ubiquilin 2), OPTN (optineurin), SQSTM1/p62 (sequestosome 1), VCP/p97 (valosin containing protein) and TBK1 (TANK binding kinase 1), which mediate protein degradation pathways, are causative in ALS [Citation4], [Citation5] providing further support to the concept that a failure of proteostasis may play an important role in ALS pathogenesis.
Eukaryotic cells have 2 major intracellular protein degradation pathways: the ubiquitin-proteasome system (UPS) and autophagy. The UPS is highly selective for degradation of short-lived proteins [Citation6]. The narrow pore of the proteasome prevents the clearance of large protein aggregates [Citation7] and there is evidence of proteasomal inhibition in mutant SOD1 cell and mouse models due to aggregation of SOD1 protein [Citation8,Citation9]. Macroautophagy involves the formation of a cytoplasmic double-membrane structure known as the autophagosome (AP) where cargoes such as protein aggregates, damaged organelles or even intracellular bacteria are engulfed and delivered to the lysosome for degradation. Mitophagy is a subtype of macroautophagy involving autophagic turnover of defective mitochondria. Target recognition in macroautophagy is mediated by interactions of SQSTM1-tagged cytosolic substrates with MAP1LC3B/LC3B (microtubule associated protein 1 light chain 3 beta) on phagophores, the precursors to APs. Two other autophagy pathways, chaperone-mediated autophagy (CMA) and microautophagy exist with AP-independent mechanisms of substrate delivery to lysosomes [Citation10].
There is increasing evidence for compromised autophagy in ALS. Protein inclusions containing SQSTM1 accumulate in motor neurons of ALS patients [Citation11] and transgenic SOD1G93A mice [Citation12], implying defective autophagic clearance of substrates. Accumulation of autophagic vacuoles, including APs, occurs in motor neurons of ALS patients [Citation13] and mutant SOD1 mice [Citation14], consistent with impaired autophagic flux. There is also upregulation of lysosomal proteases such as cathepsins in affected motor neurons in ALS [Citation15] and mutant SOD1 mice [Citation16], indicative of lysosomal defects. Last, there is increased LC3-II processing, indicating autophagy activation in spinal cords of ALS patients [Citation17] and mutant SOD1 mice [Citation18]. Importantly, SOD1 and TARDBP are substrates of autophagy [Citation19,Citation20] and their accumulation in motor neurons in ALS implies defective autophagic clearance. Genetic or chemical modulation of autophagy to promote degradation of misfolded proteins therefore presents an attractive therapeutic approach for ALS.
In contrast to other models of neurodegeneration, interventions aiming to stimulate autophagy in ALS models have generated conflicting outcomes. Treatment of ALS patients and mutant SOD1 mice with lithium was initially reported to be beneficial by upregulating autophagy [Citation21], although these findings were not reproduced by others [Citation22]. Administration of rapamycin, which inhibits MTOR (mechanistic target of rapamycin [serine/threonine kinase]) leading to autophagy induction, has consistently produced no positive benefit in mutant SOD1 mice. Rapamycin treatment either exacerbates motor neuron loss and disease progression [Citation14,Citation23] or has no impact on survival [Citation24]. However, the influence of MTOR on non-neuronal cells and pathways other than autophagy regulation may account for these largely negative effects of rapamycin. For example, one study demonstrated that rapamycin was only beneficial to mutant SOD1 mice when they lacked mature T cells [Citation25].
Recent attention has shifted to modulation of MTOR-independent pathways of autophagy activation as a potential therapeutic target in neurodegeneration [Citation26]. Treatment with progesterone prolongs survival of mutant SOD1 mice and is associated with enhanced autophagy in spinal cord [Citation27], although mutant SOD1 clearance was not reported. Administration of trehalose to mutant SOD1 mice promotes autophagic degradation of mutant SOD1 in spinal cord and extended life span in some studies [Citation28,Citation29] but not another [Citation30]. Interestingly, a recent study demonstrated that the mechanism of trehalose action involves inhibition of glucose transporters leading to AMP-activated protein kinase activation which may influence MTOR-dependent autophagy [Citation31]. Further contributing to the conundrum, treatment with chloroquine, which blocks lysosomal acidification and therefore autophagy, normalizes proteostasis in spinal motor neurons of SOD1G85R mice [Citation32], although these mice express a SOD1-YFP transgene. Most recently, treatment with n-butylidenephthalide in SOD1G93A mice, which abrogates autophagy, prolongs survival [Citation33]. Thus, there is a pressing reason to evaluate whether additional agents that stimulate MTOR-independent pathways of autophagy have beneficial effects in models of ALS.
Rilmenidine is a clinically approved anti-hypertensive agent that acts by activating ADRA2/α2-adrenoceptors and imidazoline-1 receptors (I1Rs) in the brain and periphery [Citation34]. Interestingly, activation of I1Rs leads to induction of macroautophagy by a cAMP and inositol trisphosphate (IP3)-dependent signaling pathway [Citation26]. Rilmenidine promotes MTOR-independent autophagic clearance of mutant SNCA/α-synuclein in vitro [Citation26] and pathological expanded HTT (huntingtin) from the brain, and improves motor symptoms in a mouse model of Huntington disease (HD) [Citation34]. I1Rs are also highly expressed by motor neurons in the spinal cord and motor cortex [Citation35],, [Citation36] raising the possibility that rilmenidine-induced stimulation of autophagy may counter mutant SOD1 accumulation, toxicity and disease progression in ALS. Therefore, the aim of this study was to investigate whether MTOR-independent autophagy stimulation by rilmenidine affected mutant SOD1 accumulation, symptom progression and motor neuron pathology in the SOD1G93A mouse model of ALS.
Results
Autophagy activation in NSC-34 cells expressing different ALS-linked misfolded proteins
We first determined whether autophagy activation occurs in motor neuronal NSC-34 cells expressing different ALS-linked proteins. The levels of key macroautophagy and CMA markers in NSC-34 cells transfected with human WT or mutant SOD1 were determined using immunoblotting. LC3 was used as a marker for macroautophagy. Endogenous LC3 was detected as 2 bands at approximately 16 kDa and 18 kDa, corresponding to cytosolic LC3-I and phagophore or AP-bound LC3-II [Citation37], respectively (A). The ratio of LC3-II to ACTB correlates with AP number and is a robust marker of autophagy [Citation38]. LC3-II levels normalized to ACTB were significantly increased by 120% (p<0.05) and 150% (p<0.05) in NSC-34 cells expressing mutant SOD1G85R or SOD1G93A, respectively, compared to NSC-34 cells expressing WT SOD1 (B). Accumulation of SQSTM1 was similar in cells transfected with WT or mutant SOD1 (C). The levels of the CMA receptor, LAMP2A (lysosomal-associated membrane protein 2A) were increased by 75% and 60% in cells expressing the G85R or G93A mutant, respectively, relative to NSC-34 cells expressing WT SOD1 (D). Finally, the CMA chaperone HSPA8/HSC70 (heat shock protein 8) expression was similar in all cells (E).
Figure 1. Autophagy is activated in NSC-34 cells expressing ALS-linked misfolded proteins. (A) Immunoblot analysis of macroautophagy and CMA markers in NSC-34 cells stably transfected with wild-type (WT) or mutant G85R or G93A SOD1. Quantification of (B) LC3-II, (C) SQSTM1, (D) LAMP2A and (E) HSPA8 protein levels from immunoblots normalized to WT SOD1-expressing cells. (F) Immunoblot analysis of macroautophagy and CMA markers in NSC-34 cells stably transfected with WT or mutant Q331K or M337V TARDBP. Quantification of (G) LC3-II, (H) SQSTM1, (I) LAMP2A and (J) HSPA8 protein levels from immunoblots normalized to WT TARDBP-expressing cells. Data represent mean ± SD, n = 5-6 independent experiments, *p<0.05 and **p<0.01 compared to cells expressing the WT form of relevant protein using one-way ANOVA with Tukey's posthoc test.
Autophagy activation was then examined in NSC-34 cells transfected with either WT or mutant TARDBP (F). LC3-II levels were significantly elevated in cells expressing the Q331K (85%, p<0.01) and M337V (70%, p<0.05) mutants, compared to WT TARDBP (G). SQSTM1 levels were also significantly higher in cells expressing Q331K (50%, p<0.05) and M337V (40%, p<0.05) than WT TARDBP (H). LAMP2A levels were 30% higher in cells expressing the Q331K mutant (p<0.05) compared to WT TARDBP, but were only elevated by 10% in M337V-expressing cells (I). Again, HSPA8 levels were similar in cells expressing WT or mutant TARDBP (J). These results indicate that macroautophagy is induced by accumulation of SOD1 and TARDBP mutants. Thus, agents such as rilmenidine, which potentiate autophagy, may be beneficial in ALS.
Rilmenidine enhances macroautophagy and clears mutant SOD1 protein from NSC-34 cells
We evaluated the autophagic activity of rilmenidine using NSC-34 cells expressing WT or mutant SOD1 (A). The SOD1A4V mutation was studied because of its high propensity to aggregate in vitro [Citation39]. Treatment of cells with 10 µM rilmenidine induced macroautophagy by 45% (p<0.05) demonstrated by increased LC3-II levels in WT SOD1-expressing cells (B). SQSTM1 levels were also significantly elevated by 15% (p<0.05) by rilmenidine treatment (C). In SOD1A4V cells, LC3-II levels were elevated by 15% by 10 µM rilmenidine treatment (B), suggesting reinforced macroautophagy. SQSTM1 levels were slightly elevated by rilmenidine, although this was not statistically significant (C).
Figure 2. Rilmenidine stimulates macroautophagy and clears mutant SOD1 protein from NSC-34 cells. (A) Immunoblot analysis of macroautophagy markers in NSC-34 cells transiently transfected with wild-type (WT) or mutant SOD1A4V and treated with rilmenidine (Ril) for 18 h post-transfection. Quantification of (B) LC3-II and (C) SQSTM1 protein levels from immunoblots normalized to untreated cells. Data represent mean ± SD, n = 4-6 independent experiments, *p<0.05 compared to untreated cells using one-way ANOVA with Tukey's post hoc test. (D) Photomicrographs of NSC-34 cells transfected with mCherry-GFP-LC3 plasmid and treated with rilmenidine. In rilmenidine-treated cells, there is a significantly increased proportion of mCherry-positive mature autolysosomes without GFP (arrows), indicating fusion of autophagosomes (AP) and lysosomes. (E) Quantification of the percentage of mCherry-positive mature autolysosomes relative to total puncta per cell. Data represent mean ± SD, n = 3 independent experiments, *p<0.05 using an unpaired t-test. (F) Immunoblot analysis of LC3-II levels in NSC-34 cells transfected with mutant SOD1A4V and treated with 400 nM bafilomycin A1 (Baf A1) ± 10 µM rilmenidine for 24 h. (G) Quantification of LC3-II protein levels from immunoblots normalized to cells treated with bafilomycin A1 only. Data represent mean ± SD, n = 3 independent experiments, *p<0.05 compared to bafilomycin A1-treated cells using an unpaired t-test. (H) Immunoblot analysis of human SOD1 (HsSOD1) levels in WT or mutant SOD1A4V-transfected NSC-34 cells treated with rilmenidine for 24 h post-transfection. (I) Quantification of HsSOD1 protein levels from immunoblots normalized to untreated cells. Data represent mean ± SD, n = 5 independent experiments, *p<0.05 compared to untreated cells using one-way ANOVA with Tukey's posthoc test. (J) Effect of rilmenidine or rotenone (positive control) on cell viability determined by MTT reduction assay (expressed as % of untreated cells). Data represent mean ± SD, n = 3 independent experiments. **p<0.01, ***p<0.001 compared to untreated cells using one-way ANOVA with Tukey's posthoc test.
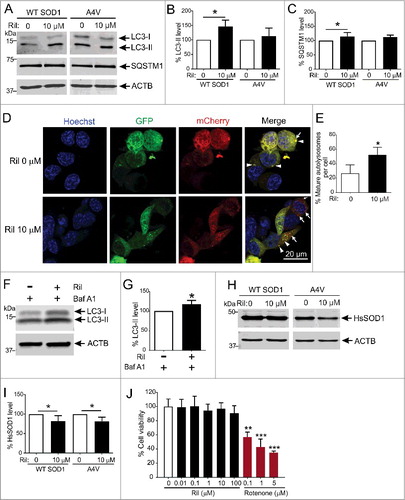
LC3-II and SQSTM1 accumulation may also reflect impaired autophagy flux caused by a failure of AP and lysosome fusion. We therefore utilized a tandem mCherry-GFP-LC3B reporter construct to accurately gauge autophagy flux induced by rilmenidine treatment. In untreated NSC-34 cells, there were few mature autolysosomes defined by red puncta (arrows), compared to autophagosomes identified by yellow puncta (arrowheads) (D). Treatment with rilmenidine significantly increased the proportion of autolysosomes by ∼2-fold, compared to untreated cells (p<0.05) (E), suggesting that rilmenidine enhances autophagy flux.
We also treated SOD1A4V-transfected NSC-34 cells with rilmenidine in the presence of the vacuolar-type H+-ATPase inhibitor bafilomycin A1 to distinguish autophagy flux augmentation from impairment. Rilmenidine significantly increased LC3-II levels in the presence of bafilomycin A1 (p<0.05) (F and G), indicating that rilmenidine elicited LC3-II induction is due to increased synthesis, rather than decreased degradation caused by inhibition of autophagy flux. These results collectively emphasize that rilmenidine is an autophagy-inducing agent.
In concert with enhanced macroautophagy induction by rilmenidine, WT SOD1 levels were significantly reduced by 20% (p<0.05) with 10 µM rilmenidine treatment compared to untreated cells (H and I). Importantly, 10 µM rilmenidine also significantly reduced mutant SOD1 accumulation by 20% (p<0.05), implying increased autophagic degradation (p<0.05). The ability of rilmenidine to stimulate macroautophagic clearance of mutant SOD1 suggests that it may be a promising agent to stimulate autophagy in vivo.
To confirm the concentration of rilmenidine employed in this study was not harmful to NSC-34 cells, we conducted a dose-response study of rilmenidine modulation of cell viability. Unlike the mitochondrial complex I inhibitor rotenone, which elicited significant cell death, rilmenidine was well tolerated even at high concentrations (J), suggesting rilmenidine treatment does not impair cell viability.
Rilmenidine does not promote CMA in NSC-34 cells
To evaluate a potential impact of rilmenidine on other autophagy pathways, we analyzed CMA markers in NSC-34 cells transfected with WT SOD1 and treated with 10 µM rilmenidine. Rilmenidine treatment did not modulate the expression levels of LAMP2A or HSPA8 (A, B and C). Wild-type SNCA was previously shown to be a CMA substrate [Citation40,Citation41]. We therefore investigated whether rilmenidine can reduce endogenous SNCA levels in NSC-34 cells, showing no effect of rilmenidine on SNCA accumulation (D). Hence, rilmenidine specifically promotes macroautophagy in NSC-34 cells.
Figure 3. Rilmenidine has no effect on the CMA pathway in NSC-34 cells. (A) Immunoblot analysis of CMA markers and substrate SNCA in NSC-34 cells transiently transfected with wild-type (WT) SOD1 and treated with rilmenidine (Ril) for 18 h post-transfection. Quantification of (B) LAMP2A, (C) HSPA8 and (D) SNCA protein levels from immunoblots normalized to untreated cells. Data represent mean ± SD, n = 3 independent experiments.
Rilmenidine enhances macroautophagy in human embryonic stem cell-derived motor neurons
To confirm whether the autophagy-inducing effects of rilmenidine are similar in neurons, we generated human embryonic stem cell (hESC)-derived spinal motor neurons and treated them with rilmenidine. Motor neurons positive for both MNX1/HB9 (A) and ISL1 (B) were generated from hESCs and were subsequently differentiated into mature spinal motor neurons as validated by CHAT (C) and TuJ1 (D) expression. Motor neuron differentiations were highly efficient as shown by 69 ± 6% MNX1/HB9+ and 80 ± 15% CHAT+ cells (mean ± SD).
Figure 4. Rilmenidine stimulates macroautophagy in H9 human embryonic stem cell-derived spinal motor neurons. Photomicrographs of motor neuron spheres stained for (A) HB9 and (B) ISL1, and dissociated mature motor neurons stained with (C) CHAT and (D) TUBB3 antibodies. (E) Immunoblot analysis of macroautophagy markers in induced motor neurons transiently transfected with wild-type SOD1 and treated with rilmenidine (Ril) for 24 h post-transfection. Quantification of (F) LC3-II and (G) SQSTM1 protein levels from immunoblots normalized to untreated cells. Data represent mean ± SD, n = 5 independent experiments, *p<0.05 compared to untreated cells using an unpaired t-test.
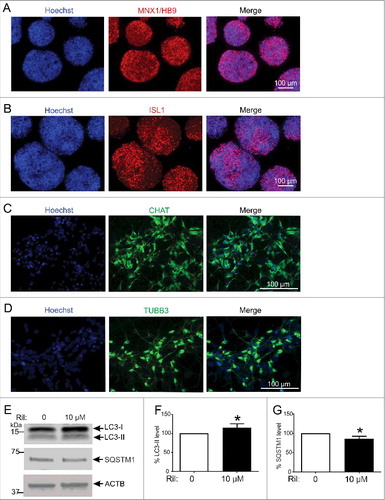
Mature motor neurons were transfected with a plasmid expressing WT SOD1 and treated with 10 µM rilmenidine, which significantly increased LC3-II levels (p<0.05) (E and F) and significantly decreased SQSTM1 accumulation (p<0.05) (G), consistent with macroautophagy induction. Thus, rilmenidine stimulates autophagy in both cell lines and human neurons in this study.
Rilmenidine enhances MTOR-independent macroautophagy and mitophagy in spinal cords of mutant SOD1 mice
To address the effects of rilmenidine-induced autophagy stimulation in vivo, SOD1G93A mice were treated with rilmenidine from postnatal day 60 (P60), using a dose regimen (10 mg/kg, 4-times a week, i.p. injection) reported to be effective in transgenic HD mice [Citation34]. Similar to observations of Rose and colleagues (2010) [Citation34], we noted that rilmenidine treatment induced transient hypoactivity in mice. This effect persisted up to 3 h following injections and most likely resulted from ADRA2/α2-adrenoceptor activation [Citation34]. Therefore, mice were weighed and rotarod performance was assessed on non-injection days. We first investigated whether rilmenidine enhanced autophagy in spinal cords of SOD1G93A mice collected at symptom onset (P90) (A) or endstage (B).
Figure 5. Rilmenidine treatment stimulates MTOR-independent macroautophagy and mitophagy in motor neurons of SOD1G93A mice. (A) Immunoblot analysis of macroautophagy and CMA markers in lumbar spinal cords from vehicle- or rilmenidine-treated SOD1G93A mice at 90 days of age. Quantification of (C) LC3-II, (D) SQSTM1 and (E) VDAC1 protein levels from immunoblots normalized to vehicle group. (B) Immunoblot analysis of autophagy markers and phosphorylated (p-MTOR) and total MTOR levels in spinal cords from vehicle- or rilmenidine-treated SOD1G93A mice at end stage. Quantification of (C) LC3-II, (D) SQSTM1 and (E) VDAC1 protein levels and (F) p-MTOR:MTOR ratio from immunoblots normalized to vehicle group. Data represent mean ± SD, n = 3-5 mice, *p<0.05 compared to vehicle-treated mice using an unpaired t-test.
At symptom onset, LC3-II levels were 55% higher in spinal cords of rilmenidine-treated mice, than in vehicle-treated mice (C). SQSTM1 levels were also elevated by 10% in spinal cords (p<0.05) of rilmenidine-treated mice compared to vehicle-treated mice (D). Expression of CMA markers was not affected in rilmenidine-treated mice (A). Levels of VDAC1, a marker of mitochondrial turnover and a macroautophagy substrate, were significantly lower (30%: p<0.05) in the spinal cords of rilmenidine-treated mice, than in vehicle-treated mice (E), consistent with enhanced mitophagy. Thus, rilmenidine stimulates efficient macroautophagy and mitophagy in spinal cords at symptom onset, the target tissue affected in SOD1G93A mice.
At end stage, LC3-II levels were 55% higher in spinal cords of rilmenidine-treated mice relative to vehicle-treated mice (p<0.05) (C), implying sustained autophagy induction. SQSTM1, LAMP2A, HSPA8 and VDAC1 levels were similar in spinal cords of rilmenidine- and vehicle-treated mice (B, D and E). Hence, macroautophagy remains elevated in spinal cords in SOD1G93A mice treated with rilmenidine until end stage disease.
To demonstrate that rilmenidine promotes MTOR-independent autophagy, serine 2448 phosphorylation of MTOR (p-MTOR) was measured using immunoblotting in mice. Analysis of spinal cords showed the expected p-MTOR and MTOR bands at approximately 289 kDa (B). MTOR activation, determined by the p-MTOR:MTOR ratio, was similar in spinal cords of rilmenidine- and vehicle-treated SOD1G93A mice (F), confirming that macroautophagy induction by rilmenidine occurs by a MTOR-independent pathway.
Rilmenidine increases autophagosome number in spinal cord motor neurons of mutant SOD1 mice
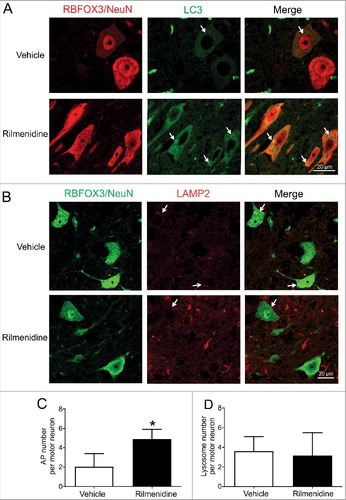
Rilmenidine acts through I1Rs, which are highly expressed by spinal motor neurons, to induce macroautophagy [Citation26]. Therefore, to confirm rilmenidine action on spinal motor neurons, the AP and lysosome content of these neurons, identified by their size, ventral horn location and RBFOX3/NeuN immunoreactivity, was assessed with immunohistochemistry. LC3-positive APs were diffusely distributed throughout the cytoplasm of motor neurons of vehicle-treated SOD1 mice (A, arrows). APs were more prominent in spinal motor neurons of rilmenidine-treated SOD1 mice and quantification demonstrated a significant increase in AP number in motor neurons (C), consistent with autophagy stimulation based on western blotting findings (A and B). LAMP2-positive lysosomes were located in the cytoplasm of motor neurons of vehicle- and rilmenidine-treated SOD1 mice (B, arrows). Quantification revealed similar numbers of lysosomes in motor neurons between treatment groups (D). These results establish that induction of macroautophagy occurs in target spinal motor neurons of SOD1G93A mice.
Figure 6. Rilmenidine treatment increases autophagosome number in spinal motor neurons of SOD1G93A mice. (A) LC3 immunohistochemical analysis in lumbar spinal cords of vehicle- and rilmenidine-treated SOD1G93A mice. In vehicle-treated mice, there is diffuse distribution of autophagosomes in the cytoplasm of RBFOX3/NeuN-positive motor neurons. In rilmenidine-treated mice, there is accumulation of autophagosomes (arrows) in motor neurons. (B) LAMP2 immunohistochemical analysis in lumbar spinal cords of vehicle- and rilmenidine-treated SOD1G93A mice. In vehicle- and rilmenidine-treated mice, lysosomes (arrows) are distributed in the cytoplasm of motor neurons. Quantification of (C) LC3-positive autophagosomes and (D) LAMP2-positive lysosomes in motor neurons. Data represent mean ± SD, n = 3 mice per group, *p<0.05 compared to vehicle-treated mice using an unpaired t-test.
Rilmenidine promotes disease progression and augments motor neuron degeneration while having no effect on glial pathology in mutant SOD1 mice
The impact of rilmenidine treatment on body weight, motor performance and disease progression in mutant SOD1 mice was next determined. Rilmenidine treatment had no effect on the age of weight loss onset (A) or the onset of locomotor deficits as measured by weekly rotarod analysis (B). However, survival objectively defined by the onset of hind limb paralysis was significantly decreased in rilmenidine-treated mutant SOD1 mice (154 ± 6 days, mean ± SD), compared to vehicle-treated mice (159 ± 6 days) (p<0.05) (C). Thus, despite robust autophagy induction in spinal cords and motor neurons, rilmenidine worsens the clinical outcome in mutant SOD1 mice.
Figure 7. Rilmenidine treatment worsens disease progression and neurodegeneration in SOD1G93A mice. (A) Onset of body weight decline and (B) locomotor activity were similar in rilmenidine- and vehicle-treated SOD1G93A mice. (C) Survival was significantly reduced by rilmenidine treatment compared to vehicle-treated animals. Data represent mean ± SD, n = 10 mice per group, *p<0.05 using the log-rank test. (D) Photomicrographs of ventral horns stained with cresyl violet in lumbar spinal cords of mice at 90 days of age. (E) Motor neuron counts in ventral horns of lumbar spinal cords of vehicle- and rilmenidine-treated mice. Motor neuron numbers in rilmenidine-treated mice were significantly decreased compared to vehicle-treated mice. Data represent mean ± SD, n = 5 mice per group, **p<0.01 compared to vehicle-treated mice using an unpaired t-test. Immunohistochemical analysis of (F) astrocytes using GFAP and (G) microglia using ITGAM/CD11b in lumbar spinal cords of mice at end stage. Astrocyte and microglial activation appear similar in spinal cords of rilmenidine- and vehicle-treated mice. Images are representative of 3 mice per group.
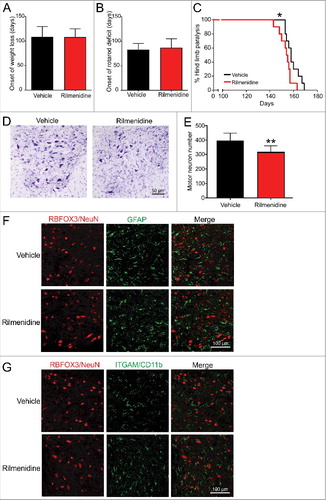
To account for the diminished survival of rilmenidine-treated mutant SOD1 mice, neuropathology was examined in spinal cords. Motor neuron counts in lumbar spinal cords at 90 days of age revealed a significant 20% reduction in neuronal number in rilmenidine-treated mutant SOD1 mice (p<0.01), compared to the vehicle group (D and E), suggesting rilmenidine-induced autophagy stimulation augments motor neuron degeneration in spinal cord.
The effect of rilmenidine treatment on inflammatory glial cell activation in spinal cords was next investigated. Astrocyte activation assessed by GFAP labeling (F) and microgliosis, determined by ITGAM/CD11b immunoreactivity (G) were similar in spinal cords of rilmenidine- and vehicle-treated mutant SOD1 mice. These data suggest that the absence of I1R expression in astrocytes and microglia precludes a direct effect of rilmenidine on these cell types. Thus, accelerated disease progression in rilmenidine-treated SOD1 mice is likely to reflect intrinsic motor neuron pathology, rather than influence by surrounding glial cells.
Rilmenidine stimulates pathological mutant SOD1 accumulation and aggregation in spinal motor neurons
We next determined whether rilmenidine-induced stimulation of autophagy in spinal cords affected mutant SOD1 protein load. Western blot analysis with a human SOD1-specific antibody showed a band at approximately 20 kDa corresponding to human SOD1 in spinal cords of mice (A). Soluble mutant SOD1 levels were reduced by 15% in spinal cords of rilmenidine-treated mice, compared to vehicle mice (B, p<0.01), supporting our findings obtained with NSC-34 cells (H and I). Western blotting with a misfolded human SOD1-specific antibody also revealed a band at 20 kDa corresponding to misfolded SOD1 (A). Surprisingly, misfolded SOD1 levels were increased by 40% in the soluble fraction of spinal cords from rilmenidine-treated SOD1 mice, compared to the vehicle group (C). This finding prompted us to investigate the level of insoluble human SOD1 protein in the pellet fraction of spinal cords. Western blot analysis with the human SOD1-specific antibody revealed a corresponding and significant increase of 15% in levels of insoluble mutant SOD1 in rilmenidine-treated mice (D and E, p<0.01). These data suggest that rilmenidine reduces the amount of soluble mutant SOD1 by increasing misfolded and insoluble mutant SOD1 species, termed pathological SOD1 here.
Figure 8. Rilmenidine treatment increases the burden of pathological and aggregated SOD1 in motor neurons of SOD1G93A mice. (A) Immunoblot analysis of soluble SOD1 protein levels in spinal cords of vehicle- and rilmenidine-treated SOD1G93A mice at end stage. Quantification of (B) human SOD1 (HsSOD1) and (C) misfolded SOD1 (misSOD1) protein levels normalized to vehicle-treated mice. (D) Immunoblot analysis of insoluble SOD1 protein levels in spinal cord pellet fractions of vehicle- and rilmenidine-treated SOD1G93A mice at end stage. (E) Quantification of HsSOD1 protein level in pellet fraction normalized to vehicle group. Data represent mean ± SD, n = 5 mice per group, **p<0.01 compared to vehicle-treated mice using an unpaired t-test. (F, H and I) Misfolded SOD1 immunohistochemical analysis of lumbar spinal cords of vehicle- and rilmenidine-treated SOD1G93A mice at 90 days of age. (F-H) In vehicle-treated mice, misfolded SOD1 shows diffuse staining in the cytoplasm of RBFOX3/NeuN-positive motor neurons (arrows). In rilmenidine-treated mice, SOD1 immunoreactivity is increased with accumulation of SOD1 into cytoplasmic aggregates in motor neurons. SOD1 accumulates into (H) Lewy body-like or (I) skein-like inclusions (arrows) in motor neurons. (G) Quantification of misfolded SOD1 aggregates in motor neurons. Data represent mean ± SD, n = 5 mice per group, **p<0.01 compared to vehicle-treated mice using an unpaired t-test.
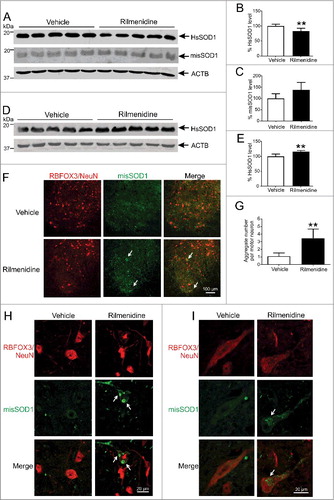
The subcellular distribution of misfolded SOD1 was next examined in spinal cord sections of mice using immunohistochemistry. In spinal motor neurons of vehicle-treated SOD1 mice, misfolded SOD1 distributed to small focal aggregates throughout the ventral horn (F). In rilmenidine-treated SOD1 mice, there was a drastic increase in misfolded SOD1 accumulation and aggregation in ventral horns, particularly in the cytoplasm of motor neurons (F, arrows), consistent with western blot findings. At higher magnification, we observed striking formation and accumulation of misfolded SOD1 into classic Lewy body-like (H, arrows) or skein-like (I, arrow) inclusions in the cytoplasm of motor neurons in rilmenidine-treated SOD1 mice, unlike vehicle mice. Quantification of misfolded SOD1 inclusions indicated that rilmenidine treatment led to a 3-fold increase in inclusion burden in motor neurons, compared to vehicle-treated mice (G, p<0.01). These data demonstrate that MTOR-independent autophagy induced by rilmenidine unexpectedly triggers accumulation of soluble SOD1 into pathological SOD1 species, forming large inclusions in spinal motor neurons, which may drive accelerated motor neuron loss and disease progression in mutant SOD1 mice.
Rilmenidine induces mutant SOD1 aggregation outside APs and lysosomes
To determine whether rilmenidine-induced SOD1 aggregates occur in the autophagy pathway, we examined APs and lysosomes for SOD1 inclusions. In vehicle-treated SOD1 mice, misfolded SOD1 was diffusely distributed in the cytoplasm of motor neurons and occasionally colocalized with LC3 puncta (A, arrowheads), suggesting mutant SOD1 translocation into APs. In contrast, large cytoplasmic misfolded SOD1 aggregates in rilmenidine-treated mutant SOD1 mice did not colocalize with LC3 puncta (A, arrows), implying APs are unable to encapsulate misfolded SOD1.
Figure 9. Rilmenidine-induced SOD1 inclusions accumulate outside the autophagy system in motor neurons of SOD1G93A mice. (A) Misfolded SOD1 and LC3 immunohistochemical analysis in lumbar spinal cords of vehicle- and rilmenidine-treated SOD1G93A mice at 90 days of age. Vehicle-treated mice show colocalization of SOD1 and autophagosomes (arrowheads). Large SOD1 aggregates in rilmenidine-treated mice (arrows) do not colocalize with autophagosomes (arrowheads). (B) Misfolded SOD1 and LAMP2 immunohistochemical analysis in lumbar spinal cords of vehicle- and rilmenidine-treated SOD1G93A mice at 90 days of age. Vehicle-treated mice show colocalization of SOD1 and lysosomes (arrowheads). Large SOD1 aggregates in rilmenidine-treated mice (arrows) do not colocalize with lysosomes (arrowheads).
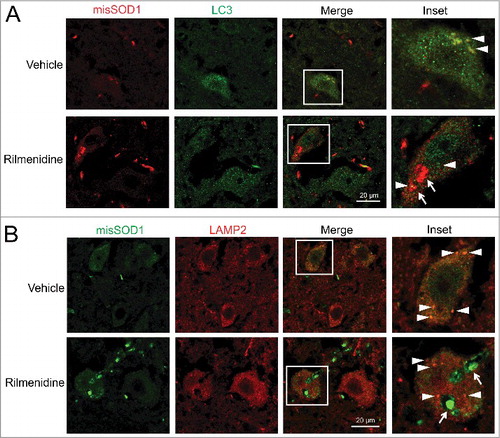
In vehicle-treated SOD1 mice, misfolded SOD1 and LAMP2 were colocalized in the cytoplasm of motor neurons (B, arrowheads), consistent with lysosomal uptake and catabolism of mutant SOD1. Again, in contrast, large misfolded SOD1 aggregates did not colocalize with LAMP2 puncta in motor neurons of rilmenidine-treated SOD1 mice (B, arrows). These data collectively suggest that the autophagic machinery cannot engage large misfolded SOD1 aggregates induced by rilmenidine treatment, suggesting their accumulation occurs outside the autophagy system.
Rilmenidine induces excessive mitophagy resulting in mitochondrial depletion in spinal motor neurons
Our western blotting findings suggest rilmenidine induces robust mitophagy in spinal cords of mutant SOD1 mice. To characterize this effect further, we used a mitochondrial localized Rosella reporter to measure mitophagy in NSC-34 cells. In control cells, all mitochondria were identified as yellow puncta, indicative of low-level basal mitophagy (A). Treatment of cells with the protonophore carbonyl cyanide m-chlorophenyl hydrazone (CCCP), which depolarizes mitochondria and triggers mitophagy, significantly increased the proportion of red puncta signifying mitochondria fused with lysosomes in 68% of the cells (B, p<0.001). Rilmenidine induced significant accumulation of red puncta in 55% of cells (p<0.01), an effect similar to CCCP, suggesting that rilmenidine induces very efficient mitophagy.
Figure 10. Rilmendine induces excessive mitophagy and mitochondrial depletion in spinal motor neurons of SOD1G93A mice. (A) Photomicrographs of NSC-34 cells transfected with mt-Rosella plasmid and treated with CCCP (positive control) or rilmenidine. In CCCP- and rilmenidine-treated cells, there is a significantly increased proportion of dsRed-positive puncta without pHluorin (arrowheads), indicating fusion of mitochondria and lysosomes. (B) Quantification of the percentage of dsRed-positive cells relative to total transfected cells. Data represent mean ± SD, n = 2 independent experiments, **p<0.01 and ***p<0.001 using a one-way ANOVA. (C) TOMM20 immunohistochemical analysis in lumbar spinal cords of vehicle- and rilmenidine-treated SOD1G93A mice. (D) Quantification of TOMM20 immunoreactivity showing mitochondrial depletion in RBFOX3/NeuN-positive motor neurons of rilmenidine-treated mice Data represent mean ± SD, n = 4 mice per group, *p<0.05 compared to vehicle-treated mice using an unpaired t-test.
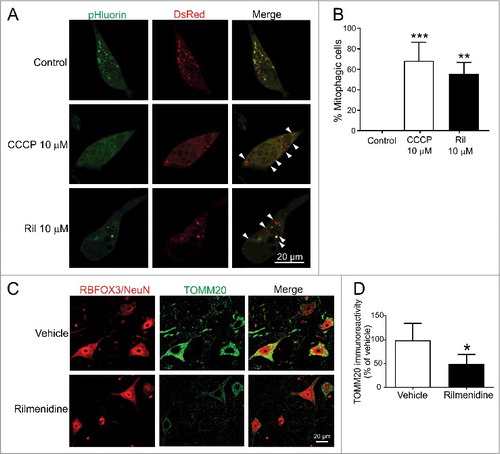
To correlate these findings in vivo, we examined mitochondrial content in spinal motor neurons of SOD1G93A mice treated with rilmenidine. In vehicle treated SOD1G93A mice, mitochondria identified by TOMM20 were highly enriched in the cytoplasm of motor neurons (C). Rilmenidine treatment induced a severe 50% depletion of mitochondria in motor neurons of SOD1G93A mice, suggesting excessive mitochondrial turnover (D). Together, these findings suggest that rilmenidine may induce excessive mitophagy in motor neurons, which could drive disease progression in mutant SOD1 mice.
Discussion
Autophagy is regulated by both MTOR-dependent and -independent processes and in this study, we report evidence of autophagy induction in ALS models. Treatment with the anti-hypertensive agent rilmenidine, which stimulates autophagy by I1R activation, induced macroautophagy and mitophagy, leading to reduced levels of soluble mutant SOD1 in cell culture and mouse models of ALS. However, there was a concomitant accumulation and aggregation of misfolded SOD1 and mitochondrial depletion in motor neurons of mutant SOD1G93A mice, which was linked to accelerated motor neuron degeneration driving disease progression. This evidence collectively points to rilmenidine treatment inducing mitochondrial degradation leading to hastened neuronal death and progression in this mouse model.
Our study is the first to report upregulation of the spectrum of macroautophagy and CMA markers in mutant SOD1 and TARDBP cell culture models of ALS. Other ALS gene products such as mutant OPTN also trigger autophagy [Citation42], suggesting autophagy is a common cellular response to diverse misfolded proteins in this disorder. Although LC3-II was upregulated indicative of autophagy induction, there was an associated accumulation of SQSTM1 in these cells, which may suggest inefficient AP fusion with lysosomes [Citation43], part of complete autophagy flux. Our observation of increased levels of the CMA marker LAMP2A in both mutant SOD1- and TARDBP-expressing cells implies that SOD1 and TARDBP may be substrates for the CMA pathway, which warrants further investigation.
We evaluated rilmenidine, an I1R agonist, which induces autophagy in mutant SOD1G93A mice. Robust autophagy induction as indicated by LC3-II conversion in spinal cord and increased AP abundance in spinal motor neurons suggests efficacy was achieved in our mice treated with rilmenidine. A previous study of transgenic HD mice treated with rilmenidine detected increased autophagy induction in skeletal muscle, but not CNS [Citation34]. Therefore, our study is the first to demonstrate rilmenidine-induced stimulation of autophagy activity in the CNS. Interestingly, autophagy induction by rilmenidine was pronounced in spinal cord, but not brain (data not shown), which overlaps with the anatomical distribution of target I1Rs mediating the effects of rilmenidine on spinal motor neurons [Citation35].
Rilmenidine was previously reported to increase autophagy by enhancing LC3-II levels [Citation26]. Our observations of increased LC3-II levels and AP accumulation induced by rilmenidine treatment in vivo while consistent with autophagy induction, could also indicate potential autophagy blockage due to impaired autophagic flux. However, multiple lines of evidence including our own findings presented here suggest rilmenidine promotes autophagic flux. First, rilmenidine stimulates clearance of soluble mutant SNCA [Citation26], HTT [Citation34] and SOD1 in this study, all misfolded protein substrates of autophagy and suggesting functional autophagic degradation. Second, LC3-II accumulation can signal increased AP synthesis or impaired AP-lysosome fusion which can be distinguished using bafilomycin A1 in vitro. Our observation of enhanced LC3-II levels induced by rilmenidine in the presence of bafilomycin A1 as confirmed by others [Citation34] supports increased AP formation, rather than autophagy inhibition, resulting from rilmenidine. Furthermore, our results confirming active AP-lysosome and mitochondrial-lysosome fusion induced by rilmenidine using mCherry-GFP-LC3 and mt-Rosella reporter assays suggest rilmenidine potentiates autophagic flux. Finally, diminished levels of SQSTM1 in motor neuron cultures, and other autophagy substrates, VDAC1 and TOMM20, in spinal cords of SOD1G93A mice with rilmenidine treatment, suggests that rilmenidine promotes autophagy. Collectively, this evidence across cell lines, human motor neurons and transgenic mice provides strong support that rilmenidine enhances autophagic flux.
In contrast, SQSTM1 accumulation was not reduced by rilmenidine treatment in NSC-34 cells and tissues of SOD1G93A mice. Although SQSTM1 levels reflect autophagy status, it is well established that SQSTM1 is a multifunctional protein and its steady-state levels are influenced by many conditions, including starvation, physical exercise, oxidative stress and proteasomal inhibition [Citation44], which may persist despite autophagy induction by rilmenidine, especially in SOD1G93A mice. Therefore, we consider degradation of the autophagy substrates mutant SOD1 and VDAC1 as more appropriate and sensitive measures of autophagic flux, supported by evidence of autophagy induction using the mCherry-GFP-LC3 reporter.
Despite achieving pharmacological efficacy, rilmenidine treatment was unable to improve the phenotype of mutant SOD1 mice, instead worsening the outcome. This effect is unlikely to be attributed to other activities of rilmenidine such as anti-hypertensive effects mediated by ADRA2/α2-adrenoceptor activation. Given that mutant SOD1 mice have elevated blood pressure [Citation45], rilmenidine would normalize blood pressure which is unlikely to be detrimental. Next, activation of I1Rs by rilmenidine reduces cytoplasmic IP3 levels thereby blocking Ca2+ release from the ER [Citation26], which would not promote motor neuron injury. Instead, our results point towards the autophagy-promoting activity of rilmenidine, particularly mitophagy, as key to our findings.
Rilmenidine triggered high level mitophagy in cell culture and mice, which could suggest very efficient mitochondrial turnover. However, the mitophagy-promoting effects of rilmenidine were comparable to the mitochondrial membrane uncoupler CCCP in NSC-34 cells, suggesting that rilmenidine may excessively stimulate mitophagy. A corresponding depletion of mitochondria was confirmed in spinal motor neurons of mutant SOD1G93A mice treated with rilmenidine. Basal mitophagy, mitochondrial metabolism and maintenance of bioenergetic reserve is essential for cell survival [Citation46]. However, excessive mitophagy in the absence of mitochondrial biogenesis will lead to bioenergetic deficits and subsequent cell death [Citation46]. It is therefore likely that rilmenidine enhanced mitophagy with excessive removal of mitochondria and that reduced energy capacity underlies the acceleration of neurodegeneration and progression in SOD1G93A mice. In support of this, excessive mitophagy and mitochondrial depletion is a mechanism contributing to neuronal loss in models of HD [Citation47] and Parkinson disease [Citation48]. Furthermore, VCP, which is mutated in ALS, regulates mitophagy [Citation49], suggesting a direct role for mitophagy dysfunction in ALS.
Rilmenidine also provoked accumulation and aggregation of pathological SOD1 species in motor neurons of mutant SOD1 mice. These SOD1 aggregates induced by rilmenidine treatment are likely to be aggresomes, which develop when a threshold of misfolded protein load is exceeded in cells [Citation50]. Interestingly, another study reported that modulation of excitability produced a dramatic accumulation of misfolded SOD1 content in motor neurons of SOD1G93A mice [Citation23]. Given mitochondrial metabolism and energy capacity are tightly coupled to motor neuron excitability, this evidence may provide a sound explanation for the effects of rilmenidine on SOD1 aggregation in this study.
Despite the outcome from this study, rilmenidine treatment of other ALS mouse models, which are less aggressive and perhaps more relevant to sporadic ALS pathology than mutant SOD1 mice may be warranted to fully determine whether autophagy stimulation using this drug can counter ALS-linked misfolded protein accumulation and slow disease progression. For example, autophagy induction may be a more relevant therapeutic strategy for TARDBP proteinopathy, as rapamycin treatment is beneficial in a FTLD-U mouse model with forebrain restricted TARDBPWT expression [Citation51]. Furthermore, stimulating autophagy improves TARDBP clearance and enhances survival in primary murine neurons and human stem cell-derived neurons [Citation52]. The duration of drug treatments may also be another consideration as short-term treatment with clemastine, an autophagy enhancer, is beneficial in SOD1G93A mice, whereas long-term treatment fails to ameliorate disease and triggers SOD1 aggregation [Citation53] as reported in this study.
In conclusion, this study demonstrates negative consequences of promoting mitophagy by rilmenidine treatment in mutant SOD1 mice. We therefore suggest that autophagy enhancers promoting CMA or alternative intracellular pathways mediating misfolded protein clearance may be beneficial in ALS. Furthermore, autophagy enhancers may need to be combined with agents and approaches that restore function across the proteostasis network for efficacy, including the UPS and endosome-lysosome system.
Materials and Methods
NSC-34 cell culture and stable transfection
Mouse neuroblastoma x spinal cord (NSC-34) cells (a gift from Prof. Neil Cashman, University of British Columbia, Vancouver) were cultured in Gibco Dulbecco's Modified Eagle Medium (Life Technologies, 10313) with 10% (v:v) heat inactivated fetal bovine serum (Sigma-Aldrich, 12003C), 1% (v:v) Gibco penicillin-streptomycin (Life Technologies, 15140) and 1% (v:v) Gibco glutamine (Life Technologies, 25030). pEGFP-N1 vector (Clontech, 6085-1) containing human wild-type (WT) or mutant (A4V, G85R, G93A) SOD1 cDNAs with a C-terminal EGFP tag were generated as previously described [Citation39]. pmCherry-N1 vector (Clontech, 632523) containing human WT or mutant (Q331K, M337V) TARDBP cDNAs with a C-terminal mCherry tag were generated as previously reported [Citation54]. Stable cell lines expressing SOD1-EGFP or TARDBP-mCherry constructs were generated as previously described [Citation54].
Rilmenidine treatment of NSC-34 cells
NSC-34 cells were subcultured in 6-well plates (5 × 10⁵ cells/well) overnight and transiently transfected with WT or A4V SOD1-EGFP constructs (2 μg/well) using Lipofectamine® 2000 (Invitrogen, 11668019) according to the manufacturer's protocol. At 1 h post-transfection, cells were treated with 10 µM rilmenidine dihydrogen phosphate (a gift from Servier, lot number 30717) dissolved in sterile water. Cells were lysed at 18 or 24 h post-transfection. For the bafilomycin A1 experiments, A4V SOD1-EGFP transfected NSC-34 cells were treated with 10 µM rilmenidine dihydrogen phosphate for 18 h and a saturating concentration (400 nM) of bafilomycin A134 (Sigma-Aldrich, B1793) was added to the cells in the last 4 h before harvesting. To analyze the fusion of APs with lysosomes, NSC-34 cells were grown on coverslips in 24-well plates (1 × 10⁵ cells/well) overnight and transfected with pDest-mCherry-GFP-LC3B plasmid (a gift from Dr Serhiy Pankiv, University of Tromsø, Norway) [Citation55] (1 μg) using Lipofectamine® 2000 and 24 h later treated with 10 µM rilmenidine dihydrogen phosphate. A further 24 h later, cells were fixed with 4% paraformaldehyde (PFA), stained with Hoechst 33342 (Invitrogen, 953557; 1:10,000) for 15 min and mounted on slides using fluorescence mounting medium (Dako, S3023) for microscopy using a FV 1000 confocal microscope (Olympus, Notting Hill, Australia). Percentage of mCherry-positive mature autolysosomes relative to total puncta per cell was calculated from at least 10 cells in 3 independent experiments.
Mitophagy assay
To analyze fusion of mitochondria with lysosomes, NSC-34 cells were subcultured in 24-well plates (1 × 10⁵ cells/well) overnight and transfected with pMito-DsRed.T3-pHluorin (mt-Rosella) plasmid (obtained from Professor Rodney Devenish, Monash University) [Citation56] (1 μg) using Lipofectamine® 2000 for 24 h. Cells were treated with 10 µM CCCP (Sigma-Aldrich, 857815) or 10 μM rilmenidine dihydrogen phosphate for a further 24 h. Cells were visualized using a 60x oil objective on an Olympus FV 1000 confocal microscope. The percentage of cells containing DsRed.T3-positive mitochondria fused with lysosomes relative to the total number of transfected cells was determined from at least 15 cells in 2 independent experiments.
Cell viability assay
Cells were subcultured into 96-well plates (1 × 10⁴ cells/well) overnight and treated with rilmenidine at 0.01-100 µM or rotenone (Sigma-Aldrich, R8875) at 0.1-5 µM for 24 h. Cell viability was assessed by reduction of 3-(4,5-dimethylthiazolyl-2)-2,5-diphenyltetrazolium bromide (MTT; Sigma-Aldrich, M2128). Cells were treated with MTT (0.5 mg/mL) for 30 min at 37°C, medium aspirated and cells solubilized in DMSO (Sigma-Aldrich, D2650). Reduced MTT absorbance was detected at 530 nm. Cell viability was expressed as a percentage of cell cultures without drug treatment (100%) from 3 independent experiments.
Human embryonic stem cell differentiation and rilmenidine treatment
Motor neuron differentiation was performed as previously described [Citation57] using H9 human embryonic stem cells (hESCs) [Citation58]. Motor neuron spheres at DIV 19 were dissociated into single cells with Accutase (STEMCELL Technologies, 7920) and plated into 6-well plates (2 × 10⁶ cells/well) overnight and transiently transfected with a WT SOD1-EGFP construct (2 μg/well) using Lipofectamine® 2000. At 3 h post-transfection, cells were treated with 10 µM rilmenidine. Cells were lysed at 24 h post-transfection.
MNX1/HB9- and CHAT-positive cells were quantified as a percentage of total Hoechst-positive cells. Counting was conducted over 2 independent differentiations by selecting a field with approximately 100 cells/field. Three fields per experiment were counted.
Immunocytochemistry
Motor neuron spheres were sedimented in a 15-ml tube, fixed with 4% PFA for 15 min, cryoprotected in 20% sucrose (Sigma-Aldrich, S9378), embedded in optimal cutting temperature (OCT) medium (Scigen Scientific, 4583) and cryosectioned at 20 μm. Mature motor neurons were fixed with 4% PFA for 15 min. Immunostaining was performed as previously described [Citation59]. Primary antibodies used were: HB9 (DSHB, 81.5C10; 5 µg/ml,), ISL1 (DSHB, 40.2D6; 5 µg/ml), TUBB3/TuJ1 (Promega, G7121; 1:100) and CHAT (Merck Millipore, ab143; 1:500) and imaged using an AxioObserver Z1 fluorescence microscope (Zeiss, North Ryde, Australia).
Cell lysis
Cells were lysed in buffer containing 20 mM Tris-Cl, pH 7.5, 150 mM NaCl, 1% Triton-X 100 (Merck, 9036-19-5), 1% (v:v) protease inhibitor cocktail (Sigma-Aldrich, P8340) and phosphatase inhibitors (50 mM NaF and 10 mM Na3VO4) for 20 min on ice. Lysates were centrifuged at 15,800 g for 20 min at 4°C to collect supernatants. Proteins were quantified using the bicinchoninic acid assay kit (Pierce, 23225) using bovine serum albumin standards.
Transgenic mice and rilmenidine treatment
All animal experiments conformed to the Australian National Health and Medical Research Council published Code of Practice and were approved by the Howard Florey Institute Animal Ethics Committee (permit number 13–038). Transgenic SOD1G93A mice (B6.Cg-Tg(SOD1*G93A)1Gur/J line, stock number 002726) were purchased from the Jackson Laboratory (Bar Harbor, ME, USA) and maintained on a C57BL/6 background. Starting from postnatal day 60 (P60), male SOD1G93A mice received intraperitoneal (i.p.) injections of 10 mg/kg rilmenidine or Gibco Dulbecco's phosphate-buffered saline (DPBS, Life Technologies, 14190) vehicle solution 4-times a week as previously described [Citation34]. Rilmenidine was freshly prepared in sterile DPBS before each injection. The experimenter was blind to the treatment groups throughout the study.
Behavioral analysis
Mice were weighed weekly and locomotor function was assessed on non-injection days using an accelerating mouse Rota-Rod 47600 (Ugo Basile, Italy) weekly from P60. Before testing, a training period was conducted with one steady session and two ramping sessions at 4–40 rpm over 5 min with 10 min rest intervals in between each. Testing was conducted with 2 sessions at 4–40 rpm over 5 min with a 10 min rest interval and the average latency to fall recorded (sec). The onset of weight loss was defined as the mean age of peak body weight and onset of motor deficit was defined as the age of peak rotarod performance as previously described [Citation60]. For survival analysis, SOD1G93A mice were killed at the time of clinical end point onset defined by failure to splay hind limbs due to paralysis. Mice were killed at P90 (pre-symptomatic) or clinical endpoint by lethal injection (sodium pentobarbitone, 100 mg/kg, i.p.).
Tissue lysis
Lumbar spinal cords were dissected out and snap-frozen. Tissues were homogenised in RIPA lysis buffer containing 50 mM Tris-Cl, pH 7.4, 150 mM NaCl, 0.1% SDS (AMRESCO, 0227), 1% sodium deoxycholate (Sigma, D6750), 1% Triton X-100, 1% protease inhibitor cocktail and freshly added phosphatase inhibitors (50 mM NaF and 10 mM Na3VO4) by sonicating at 50% output for 15 sec storing on ice for 20 min and centrifuging at 15,800 g for 20 min at 4°C to collect supernatants. Tissue pellets were rinsed once with 100 mM PBS (20 mM NaH2PO4, 80 mM Na2HPO4, pH 7.4), centrifuged at 15,800 g for 10 min and lysed with RIPA lysis buffer containing 1% SDS by sonicating at 50% output for 15 sec and supernatant was collected. Proteins from supernatant and pellet fractions were quantified as described above for cell lysates.
Immunoblotting
Proteins from cell lysates (20 µg) or tissue lysates (50 µg) were electrophoresed through 12.5% SDS polyacrylamide gels and transferred to Immobilon PVDF-FL membrane (Merck Millipore, IPFL00010). Membranes were blocked with 5% (w:v) skim milk dried powder (Fonterra, 492281) in Tris-buffered saline with Tween-20 (TBST; Tris base 20 mM, NaCl 140 mM, pH 8.0, 0.1% [v:v] Tween-20 [Sigma, P7949]) for 30 min and incubated with antibodies to rabbit LC3B (1:1,000; Sigma-Aldrich, L7543), mouse SQSTM1 (1:500; Abcam, ab56416), sheep SOD1 (1:4,000; Merck, 574597), rabbit LAMP2A (1:500; Abcam, ab18528), mouse HSPA8/HSC70 (1:500; Enzo Lifesciences, ALX-804-067), mouse SNCA (1:1,000; BD Transduction Labs, 610786), rabbit VDAC1 (1:1,000; Abcam ab15895), rabbit MTOR (1:1000; Cell Signaling Technology, 2983), rabbit phospho-MTOR (1:1000; Cell Signaling Technology, 2971), mouse human-specific SOD1 (1:2,000; R&D Systems, MAB3418), mouse misfolded SOD1 (C4F6) (1:250; Medimabs, MM-0070-2-P) or mouse ACTB (1:2,000; Sigma-Aldrich, A5316) antibodies in 3% (w:v) BSA (Sigma-Aldrich, A3912) in TBST overnight at 4°C. Blots were washed 3 times in TBST for 10 min and incubated with IRDye 680- or 800CW-conjugated secondary antibodies (1:10,000; LI-COR Biosciences) in TBST for 30 min, followed by 3 washes in TBST for 10 min, and detected on the Odyssey Classic infrared imaging system (LI-COR Biosciences, USA). Blots were quantified using ImageJ software (Rasband WS, NIH, Bethesda, MD, http://rsb.info.nih.gov/ij/) by taking the mean gray value of bands for the target protein normalized to ACTB levels, after subtracting background intensity. Phospho-MTOR bands were normalized to the level of MTOR. Results were expressed as percentage of WT, untreated or vehicle-treated controls (100%).
Histology
Mice were transcardially perfused with 100 mM PBS (pH 7.4) followed by 4% PFA in 0.1 M phosphate buffer at pH 7.4. Dissected lumbar spinal cords were post-fixed in 4% PFA for 2 h. For the misfolded SOD1 (C4F6) antibody immunostaining, spinal cords were fresh dissected and post-fixed in 4% PFA overnight. All tissue was cryoprotected in 30% sucrose in PBS at 4°C until tissue was sunk. Tissues were embedded in OCT medium by freezing in isopentane cooled by liquid nitrogen and horizontal 20-µm sections were cut. For motor neuron counts, sections were stained with 0.5% cresyl violet using a standard protocol, dehydrated and coverslipped. Nissl-positive motor neurons in every third section were counted from a total of 30 ventral horns per mouse (n = 5 mice per group) identified by neuronal morphology and size exceeding 20-µm diameter with a distinct nucleolar profile. Counts were conducted by 2 investigators who were blinded to the treatment groups, and averages were obtained.
Immunohistochemistry
Tissue sections were permeabilized in 0.4% Triton X-100 in PBS for 10 min, blocked in 5% skim milk in PBS for 30 min and incubated with antibodies to rabbit RBFOX3/NeuN (1:500; Abcam, ab104225), mouse GFAP (1:200; Merck Millipore, MAB360), mouse CD11B (1:100; AbD Serotec, MCA275GA), mouse LC3 (1:100; NanoTools, LC3-5F10), rabbit LC3B (1:50; Sigma-Aldrich), rat LAMP2 (1:50; Santa Cruz Biotechnology, sc-20004), rabbit TOMM20 (1:50; Santa Cruz Biotechnology, sc-11415) or mouse misfolded SOD1 (C4F6) (1:50) antibodies in 5% skim milk and 3% donkey serum (Merk Millipore, S30) overnight at 4°C. Next, sections were incubated with Alexa Fluor-conjugated secondary antibodies (1:100, Jackson ImmunoResearch, donkey anti-rabbit-488, 711-545-152; donkey anti-rabbit-594, 711-585-152; donkey anti mouse-488, 715-545-151; donkey anti mouse-594, 715-585-151; donkey anti-rat-488, 712-585-153) in 5% skim milk and 3% donkey serum for 2 h, stained with Hoechst 33342 (1:10,000) for 15 min and mounted on slides using fluorescence mounting medium for microscopy and imaged using a confocal microscope. Identical exposure and gain settings were used to capture the images, and the negative controls without primary antibodies produced no staining. Misfolded SOD1 aggregates were counted from at least 20 motor neurons per mouse with 5 mice per treatment group. LC3-positive APs and LAMP2-positive lysosomes were counted from at least 10 motor neurons per mouse and averaged with n = 3 mice per treatment group. Analysis of TOMM20 staining was performed using ImageJ software. Images were converted to grayscale and the area above threshold was determined. The same threshold brightness level was used for all images. Ten images per mouse were analyzed with 4 mice per genotype. Image analysis was restricted to nuclear RBFOX3/NeuN-positive motor neurons only.
Statistical analysis
Western densitometry data, motor neuron counts, weight loss and rotarod deficits were compared using one-way analysis of variance (ANOVA) with Tukey's posthoc test or an unpaired t-test. Survival data were analyzed using Kaplan-Meier survival analysis with the log-rank test. All statistical tests were performed with GraphPad Prism software (version 6.0, GraphPad Software, San Diego, CA, USA).
Disclosure of Potential Conflicts of Interest
No potential conflicts of interest were disclosed
Acknowledgements
We thank Servier (Paris) for generously providing rilmenidine and Prof. Michael Spedding for his support, Prof. Neil Cashman for donating NSC-34 cells, Assoc. Prof. Clare Parish and Dr Jon Niclis for providing H9 cells and expertise on differentiations, Dr. Serhiy Pankiv for gifting the pDest-mCherry-GFP-LC3B plasmid and Prof. Rodney Devenish for the mt-Rosella construct. We also thank Dr Mark Millan and Dr Michel Félétou (Servier) for valuable comments on the manuscript.
Additional information
Funding
REFERENCES
- Ruegsegger C, Saxena S. Proteostasis impairment in ALS. Brain Res. 2016;28:30161−30165.
- Blokhuis AM, Groen EJN, Koppers M, et al. Protein aggregation in amyotrophic lateral sclerosis. Acta neuropathologica. 2013;125:777−794. doi:10.1007/s00401-013-1125-6.
- Mori K, Weng SM, Arzberger T, et al. The C9orf72 GGGGCC repeat is translated into aggregating dipeptide-repeat proteins in FTLD/ALS. Science. 2013;339:1335−1338. doi:10.1126/science.1232927.
- Majcher V, Goode A, James V, et al. Autophagy receptor defects and ALS-FTLD. Mole Cell Neurosci. 2015;66:43−52. doi:10.1016/j.mcn.2015.01.002.
- Cirulli ET, Lasseigne BN, Petrovski S, et al. Exome sequencing in amyotrophic lateral sclerosis identifies risk genes and pathways. Science (New York, NY). 2015;347:1436−1441. doi:10.1126/science.aaa3650.
- Ciechanover A. The ubiquitin proteolytic system: from a vague idea, through basic mechanisms, and onto human diseases and drug targeting. Neurology. 2006;66:S7−19. doi:10.1212/01.wnl.0000192261.02023.b8.
- Knaevelsrud H, Simonsen A. Fighting disease by selective autophagy of aggregate-prone proteins. FEBS letters. 2010;584:2635−45. doi:10.1016/j.febslet.2010.04.041.
- Urushitani M, Kurisu J, Tsukita K, et al. Proteasomal inhibition by misfolded mutant superoxide dismutase 1 induces selective motor neuron death in familial amyotrophic lateral sclerosis. J Neurochem. 2002;83:1030–42. doi:10.1046/j.1471-4159.2002.01211.x. PMID:12437574
- Kabashi E, Agar JN, Taylor DM, et al. Focal dysfunction of the proteasome: a pathogenic factor in a mouse model of amyotrophic lateral sclerosis. J Neurochem. 2004;89:1325−35. doi:10.1111/j.1471-4159.2004.02453.x.
- Menzies FM, Fleming A, Rubinsztein DC. Compromised autophagy and neurodegenerative diseases. Nat Rev Neurosci. 2015;16:345−357. doi:10.1038/nrn3961.
- Mizuno Y, Amari M, Takatama M, Aizawa H, Mihara B, Okamoto K. Immunoreactivities of p62, an ubiqutin-binding protein, in the spinal anterior horn cells of patients with amyotrophic lateral sclerosis. J Neurol Sci. 2006;249:13−18. doi:10.1016/j.jns.2006.05.060.
- Gal J, Strom A-L, Kilty R, et al. p62 accumulates and enhances aggregate formation in model systems of familial amyotrophic lateral sclerosis. J Biol Chem. 2007;282:11068−11077. doi:10.1074/jbc.M608787200.
- Sasaki S. Autophagy in spinal cord motor neurons in sporadic amyotrophic lateral sclerosis. Journal of neuropathology and experimental neurology. 2011;70:349–359.
- Zhang X, Li L, Chen S, Yang D, et al. Rapamycin treatment augments motor neuron degeneration in SOD1(G93A) mouse model of amyotrophic lateral sclerosis. Autophagy. 2011;7:412−425. doi:10.4161/auto.7.4.14541.
- Kikuchi H, Yamada T, Furuya H, et al. Involvement of cathepsin B in the motor neuron degeneration of amyotrophic lateral sclerosis. Acta Neuropathol. 2003;105:462−468.
- Wootz H, Weber E, Korhonen L, et al. Altered distribution and levels of cathepsind and cystatins in amyotrophic lateral sclerosis transgenic mice: Possible roles in motor neuron survival. Neuroscience. 2006;143:419−430. doi:10.1016/j.neuroscience.2006.07.048.
- Hetz C, Thielen P, Matus S, et al. XBP-1 deficiency in the nervous system protects against amyotrophic lateral sclerosis by increasing autophagy. Genes Dev. 2009;23:2294−2306. doi:10.1101/gad.1830709.
- Morimoto N, Nagai M, Ohta Y, et al. Increased autophagy in transgenic mice with a G93A mutant SOD1 gene. Brain Res. 2007;1167:112−117. doi:10.1016/j.brainres.2007.06.045.
- Kabuta T, Suzuki Y, Wada K. Degradation of amyotrophic lateral sclerosis-linked mutant Cu,Zn-superoxide dismutase proteins by macroautophagy and the proteasome. J Biol Chem. 2006;281:30524−30533. doi:10.1074/jbc.M603337200.
- Caccamo A, Majumder S, Deng JJ, et al. Rapamycin Rescues TDP-43 Mislocalization and the Associated Low Molecular Mass Neurofilament Instability. J Biol Chem. 2009;284:27416−27424. doi:10.1074/jbc.M109.031278.
- Fornai F, Longone P, Cafaro L, et al. Lithium delays progression of amyotrophic lateral sclerosis. Proc Natl Acad Sci USA. 2008;105:2052−2057. doi:10.1073/pnas.0708022105.
- Pizzasegola C, Caron I, Daleno C, et al. Treatment with lithium carbonate does not improve disease progression in two different strains of SOD1 mutant mice. Amyotrophic lateral sclerosis : official publication of the World Federation of Neurology Research Group on Motor Neuron Diseases. 2009;10:221−228. doi:10.1080/17482960902803440.
- Saxena S, Roselli F, Singh K, et al. Neuroprotection through Excitability and mTOR Required in ALS Motoneurons to Delay Disease and Extend Survival. Neuron. 2013;80:80−96. doi:10.1016/j.neuron.2013.07.027.
- Bhattacharya A, Bokov A, Muller FL, et al. Dietary restriction but not rapamycin extends disease onset and survival of the H46R/H48Q mouse model of ALS. Neurobiol Aging. 2012;33:1829−1832. doi:10.1016/j.neurobiolaging.2011.06.002.
- Staats KA, Hernandez S, Schonefeldt S, et al. Rapamycin increases survival in ALS mice lacking mature lymphocytes. Molecular neurodegeneration. 2013;8:31. doi:10.1186/1750-1326-8-31. PMID:24025516
- Williams A, Sarkar S, Cuddon P, et al. Novel targets for Huntington's disease in an mTOR-independent autophagy pathway. Nature chemical biology. 2008;4:295−305. doi:10.1038/nchembio.79.
- Kim J, Kim T-Y, Cho K-S, et al. Autophagy activation and neuroprotection by progesterone in the G93A-SOD1 transgenic mouse model of amyotrophic lateral sclerosis. Neurobiology of disease. 2013;59:80−85. doi:10.1016/j.nbd.2013.07.011.
- Castillo K, Nassif M, Valenzuela V, et al. Trehalose delays the progression of amyotrophic lateral sclerosis by enhancing autophagy in motoneurons. Autophagy. 2013;9:1308−1320. doi:10.4161/auto.25188.
- Zhang X, Chen S, Song L, et al. MTOR-independent, autophagic enhancer trehalose prolongs motor neuron survival and ameliorates the autophagic flux defect in a mouse model of amyotrophic lateral sclerosis. Autophagy. 2014;10:588−602. doi:10.4161/auto.27710.
- Li Y, Guo Y, Wang X, et al. Trehalose decreases mutant SOD1 expression and alleviates motor deficiency in early but not end-stage amyotrophic lateral sclerosis in a SOD1-G93A mouse model. Neuroscience. 2015;298:12−25. doi:10.1016/j.neuroscience.2015.03.061.
- DeBosch BJ, Heitmeier MR, Mayer AL, et al. Trehalose inhibits solute carrier 2A (SLC2A) proteins to induce autophagy and prevent hepatic steatosis. Sci Signal. 2016;9:ra21. doi:10.1126/scisignal.aac5472. PMID:26905426
- Bandyopadhyay U, Nagy M, Fenton WA, et al. Absence of lipofuscin in motor neurons of SOD1-linked ALS mice. Proceedings of the National Academy of Sciences of the United States of America. 2014;111:11055−11060. doi:10.1073/pnas.1409314111.
- Hsueh KW, Chiou TW, Chiang SF, et al. Autophagic down-regulation in motor neurons remarkably prolongs the survival of ALS mice. Neuropharmacology. 2016;108:152−160. doi:10.1016/j.neuropharm.2016.03.035.
- Rose C, Menzies FM, Renna M, et al. Rilmenidine attenuates toxicity of polyglutamine expansions in a mouse model of Huntington's disease. Human molecular genetics. 2010;19:2144−153. doi:10.1093/hmg/ddq093.
- King PR, Gundlach AL, Louis WJ. Quantitative autoradiographic localization in rat brain of alpha 2-adrenergic and non-adrenergic I-receptor binding sites labelled by [3H]rilmenidine. Brain research. 1995;675:264−278. doi:10.1016/0006-8993(95)00083-3.
- De Vos H, Bricca G, De Keyser J, et al. Imidazoline receptors, non-adrenergic idazoxan binding sites and alpha 2-adrenoceptors in the human central nervous system. Neuroscience. 1994;59:589−598. doi:10.1016/0306-4522(94)90179-1.
- Mizushima N, Yoshimori T. How to interpret LC3 immunoblotting. Autophagy. 2007;3:542−545. doi:10.4161/auto.4600.
- Winslow AR, Chen CW, Corrochano S, et al. alpha-Synuclein impairs macroautophagy: implications for Parkinson's disease. The Journal of cell biology. 2010;190:1023−1037. doi:10.1083/jcb.201003122.
- Turner BJ, Atkin JD, Farg MA, et al. Impaired extracellular secretion of mutant superoxide dismutase 1 associates with neurotoxicity in familial amyotrophic lateral sclerosis. J Neurosci. 2005;25:108−117. doi:10.1523/JNEUROSCI.4253-04.2005.
- Cuervo AM, Stefanis L, Fredenburg R, et al. Impaired degradation of mutant alpha-synuclein by chaperone-mediated autophagy. Science. 2004;305:1292−1295. doi:10.1126/science.1101738.
- Orenstein SJ, Kuo SH, Tasset I, Arias E, Koga H, Fernandez-Carasa I, Cortes E, Honig LS, Dauer W, Consiglio A, et al. Interplay of LRRK2 with chaperone-mediated autophagy. Nat Neurosci. 2013;16:394−406. doi:10.1038/nn.3350.
- Shen X, Ying H, Qiu Y, et al. Processing of optineurin in neuronal cells. The Journal of biological chemistry. 2011;286:3618−3629. doi:10.1074/jbc.M110.175810.
- Bjorkoy G, Lamark T, Pankiv S, et al. Monitoring autophagic degradation of p62/SQSTM1. Methods Enzymol. 2009;452:181−197.
- Taylor JP, Brown RH, Jr., Cleveland DW. Decoding ALS: from genes to mechanism. Nature. 2016;539:197−206. doi:10.1038/nature20413.
- Kandinov B, Drory VE, Tordjman K, et al. Blood pressure measurements in a transgenic SOD1-G93A mouse model of amyotrophic lateral sclerosis. Amyotroph Lateral Scler. 2012;13:509−13. doi:10.3109/17482968.2012.662986.
- Kubli DA, Gustafsson AB. Mitochondria and mitophagy: the yin and yang of cell death control. Circulation research. 2012;111:1208−1221. doi:10.1161/CIRCRESAHA.112.265819.
- Guo X, Sun X, Hu D, et al. VCP recruitment to mitochondria causes mitophagy impairment and neurodegeneration in models of Huntington's disease. Nat Commun. 2016;7:12646. doi:10.1038/ncomms12646. PMID:27561680
- Dagda RK, Cherra SJ, 3rd, Kulich SM, et al. Loss of PINK1 function promotes mitophagy through effects on oxidative stress and mitochondrial fission. J Biol Chem. 2009;284:13843−13855. doi:10.1074/jbc.M808515200.
- Kim NC, Tresse E, Kolaitis RM, et al. VCP is essential for mitochondrial quality control by PINK1/Parkin and this function is impaired by VCP mutations. Neuron. 2013;78:65−80. doi:10.1016/j.neuron.2013.02.029 10.1016/j.neuron.2013.04.020.
- Johnston JA, Ward CL, Kopito RR. Aggresomes: a cellular response to misfolded proteins. The Journal of cell biology. 1998;143:1883−98. doi:10.1083/jcb.143.7.1883.
- Wang IF, Guo BS, Liu YC, et al. Autophagy activators rescue and alleviate pathogenesis of a mouse model with proteinopathies of the TAR DNA-binding protein 43. Proc Natl Acad Sci U S A. 2012;109:15024−15029.
- Barmada SJ, Serio A, Arjun A, et al. Autophagy induction enhances TDP43 turnover and survival in neuronal ALS models. Nat Chem Biol. 2014;10:677−685. doi:10.1038/nchembio.1563.
- Apolloni S, Fabbrizio P, Amadio S, et al. Actions of the antihistaminergic clemastine on presymptomatic SOD1-G93A mice ameliorate ALS disease progression. J Neuroinflammation. 2016;13:191. doi:10.1186/s12974-016-0658-8. PMID:27549088
- Perera ND, Sheean RK, Scott JW, et al. Mutant TDP-43 deregulates AMPK activation by PP2A in ALS models. PloS one. 2014;9:e90449. doi:10.1371/journal.pone.0090449. PMID:24595038
- Pankiv S, Clausen TH, Lamark T, et al. p62/SQSTM1 binds directly to Atg8/LC3 to facilitate degradation of ubiquitinated protein aggregates by autophagy. J Biol Chem. 2007;282:24131−24145. doi:10.1074/jbc.M702824200.
- Rosado CJ, Mijaljica D, Hatzinisiriou I, et al. Rosella: a fluorescent pH-biosensor for reporting vacuolar turnover of cytosol and organelles in yeast. Autophagy. 2008;4:205−213. doi:10.4161/auto.5331.
- Du ZW, Chen H, Liu H, et al. Generation and expansion of highly pure motor neuron progenitors from human pluripotent stem cells. Nat Commun. 2015;6:6626. doi:10.1038/ncomms7626.
- Thomson JA, Itskovitz-Eldor J, Shapiro SS, et al. Embryonic stem cell lines derived from human blastocysts. Science. 1998;282:1145−1147. doi:10.1126/science.282.5391.1145.
- Lau CL, O'Shea RD, Broberg BV, et al. The Rho kinase inhibitor Fasudil up-regulates astrocytic glutamate transport subsequent to actin remodelling in murine cultured astrocytes. Br J Pharmacol. 2011;163:533−545. doi:10.1111/j.1476-5381.2011.01259.x.
- Turner BJ, Alfazema N, Sheean RK, et al. Overexpression of survival motor neuron improves neuromuscular function and motor neuron survival in mutant SOD1 mice. Neurobiol Aging. 2014;35:906−915. doi:10.1016/j.neurobiolaging.2013.09.030.