
ABSTRACT
Macroautophagy/autophagy is an evolutionarily conserved cellular process whose induction is regulated by the ULK1 protein kinase complex. The subunit ATG13 functions as an adaptor protein by recruiting ULK1, RB1CC1 and ATG101 to a core ULK1 complex. Furthermore, ATG13 directly binds both phospholipids and members of the Atg8 family. The central involvement of ATG13 in complex formation makes it an attractive target for autophagy regulation. Here, we analyzed known interactions of ATG13 with proteins and lipids for their potential modulation of ULK1 complex formation and autophagy induction. Targeting the ATG101-ATG13 interaction showed the strongest autophagy-inhibitory effect, whereas the inhibition of binding to ULK1 or RB1CC1 had only minor effects, emphasizing that mutations interfering with ULK1 complex assembly do not necessarily result in a blockade of autophagy. Furthermore, inhibition of ATG13 binding to phospholipids or Atg8 proteins had only mild effects on autophagy. Generally, the observed phenotypes were more severe when autophagy was induced by MTORC1/2 inhibition compared to amino acid starvation. Collectively, these data establish the interaction between ATG13 and ATG101 as a promising target in disease-settings where the inhibition of autophagy is desired.
Abbreviations
| AMPK | = | AMP-activated protein kinase |
| ATG | = | autophagy-related |
| BafA1 | = | bafilomycin A1 |
| EBSS | = | Earle's Balanced Salt Solution |
| GABARAP | = | gamma-aminobutyric acid A receptor-associated protein |
| HORMA | = | Hop1, Rev7 and MAD2 |
| KO | = | knockout |
| LIR | = | LC3-interacting region |
| MAP1LC3/LC3 | = | microtubule-associated protein 1 light chain 3 |
| MEF | = | mouse embryonic fibroblast |
| MM-GB/SA | = | molecular mechanics Generalized Born solvent-accessible surface area |
| MTORC1/2 | = | mechanistic target of rapamycin (serine/threonine kinase) complex 1/2 |
| PAS | = | phagophore assembly site |
| PLPD | = | phospholipid-binding domain |
| RB1CC1/FIP200 | = | RB1-inducible coiled-coil 1 |
| RPS6KB1 | = | ribosomal protein S6 kinase, polypeptide 1 |
| SQSTM1/p62 | = | sequestosome 1 |
| ULK1/2 | = | unc-51 like kinase 1/2 |
| WIPI2 | = | WD repeat domain, phosphoinositide interacting 2 |
| WT | = | wild-type |
Introduction
Autophagy is an intracellular degradation process mediating the clearance of misfolded or damaged proteins, protein aggregates, or entire organelles. During the course of autophagy, a phagophore forms from microdomains of the ER. This phagophore further engulfs the cargo to be removed. By addition of membrane compartments originating from different cellular sources, the phagophore closes into a mature autophagosome. This double-membraned vesicle then fuses with lysosomes, giving rise to an autolysosome in which the cargo becomes degraded by lysosomal hydrolases. This process is conserved from yeast to higher eukaryotes including mammals, and autophagy is essential for functional metabolism and cell integrity. Accordingly, the dysregulation of autophagy is implicated in various human diseases such as cancer, neurodegenerative diseases such as Alzheimer and Parkinson, myopathies, and heart and liver diseases.Citation1–Citation4
Autophagy is executed on a basal level in most cell types, but can be actively induced by nutrient deprivation or other stress conditions. Autophagy-activating pathways all converge on the induction of the ULK1 complex, a central regulation node within the autophagy network. This protein complex comprises the Ser/Thr protein kinase ULK1 (unc-51 like kinase 1) and the interacting proteins ATG13, ATG101 and RB1CC1/FIP200 (RB1-inducible coiled-coil 1).Citation5–Citation8 Knockdown and knockout experiments revealed essential roles for each of these proteins in autophagy. Knockout of either Atg13 or Rb1cc1 leads to embryonic lethality,Citation9,Citation10 whereas ulk1−/− or ulk2−/− mice have rather mild autophagy phenotypes and ulk1/2−/− mice are alive but die shortly after birth.Citation11–Citation13 Fibroblasts isolated from these ulk1/2 double-knockout mice are responsive to glucose deprivation but do not display autophagy induction by amino acid withdrawal.Citation11 The ULK1 complex itself is regulated by upstream nutrient- and energy-sensing kinases, such as MTOR (mechanistic target of rapamycin [serine/threonine kinase]), AMPK (AMP-activated protein kinase), and AKT1 (reviewed in ref. Citation14–17). The individual subunits of the ULK1 complex have been investigated in detail over the past years, but still information about the relevance of the single protein-protein interactions within the complex is missing. Most reports suggest that ATG13 is the central subunit of this complex and recruits the remaining components,Citation6,Citation18–20 though one report indicates a direct interaction of ULK1 and RB1CC1 independent of ATG13.Citation5 Along these lines, the modulation of protein-protein interactions involving ATG13 might be a valuable approach to regulate autophagy signaling pathways.
The N terminus of ATG13 comprises a HORMA domain functioning as an ATG101-interaction platform. This domain was first identified in the Saccharomyces cerevisiae proteins Hop1, Rev7, and Mad2, which display sequence similarities but no functional overlaps.Citation21 Jao et al. are the first to identify a HORMA domain in ATG13.Citation22 Mad2 can switch between an open (O-Mad2) and a closed (C-Mad2) conformation, and the ATG13 HORMA structure corresponds to the C-Mad2 state.Citation22 This finding has been complemented by 3 other groups reporting the structure of ATG101 as O-Mad2-like and the HORMA-mediated dimerization of ATG13 and ATG101, respectively.Citation20,Citation23,Citation24 Suzuki et al. show that an ATG101 version which cannot dimerize with ATG13 is not incorporated into the ULK1 complex, ultimately leading to impaired autophagy induction. The recruitment of the other subunits into the complex is unaffected.Citation20 Of note, additional binding partners of the Atg13/ATG13 HORMA domain have been reported, including ATG14 and yeast Atg9.Citation22,Citation25 Next to the HORMA domain, ATG13 contains a phospholipid-binding motif at its extreme N terminus.Citation26 Four amino acid residues conserved across species mediate its interaction with phosphatic acid (PA), phosphatidylinositol 3-phosphate (PtdIns3P), phosphatidylinositol 4-phosphate (PtdIns4P) and to a lesser extent with phosphatidylinositol 3,4,5-trisphosphate (PtdIns(3,4,5)P3). Mutation of these 4 key residues severely decreases phospholipid binding, inhibits translocation of ATG13 to the autophagosome formation site and impedes autophagic flux upon starvation.Citation26
In contrast to the structured N terminus, the C-terminal part of ATG13 is intrinsically disordered.Citation27,Citation28 In yeast Atg13, the intrinsically disordered region (IDR) harbors the interaction sites for Atg1 and Atg17, representing the yeast orthologs for ULK1 and RB1CC1, respectively.Citation29,Citation30 In agreement with these data for yeast, Jung et al. have mapped the ULK1 and RB1CC1 interaction sites to the C terminus of human ATG13.Citation19 Our group has fine-mapped these sites. We have observed an ATG13 isoform in the DT40 chicken B-lymphocyte cell line missing a 26-amino-acid stretch encoded by exon12. This isoform cannot bind to RB1CC1.Citation31 With regard to ULK1, we have previously identified the last 3 amino acids of ATG13 to be indispensable for ULK1 binding.Citation18 Notably, the deletion of this short peptide and correspondingly the disruption of the ATG13-ULK1 interaction had only minor effects on autophagy induction.Citation18
Finally, a MAP1LC3/LC3-interacting region (LIR) motif was identified in ATG13. The LIR mediates interaction with members of the Atg8 family, and Alemu et al. have observed that the ATG13 LIR preferentially associates with the GABARAP subfamily of Atg8 proteins.Citation32 Suzuki et al. have determined the crystal structures of 3 MAP1LC3/LC3 isoforms in complex with a peptide containing the residues 436 to 447 of ATG13.Citation33 They also have performed mutational analysis of LC3A with either increased or decreased LIR-binding affinity and observe a defect in autophagosome formation.Citation33 However, since this defect might be caused by altered binding to other LIR-containing proteins and not necessarily to ATG13, the specific function of the ATG13 LIR remains elusive so far.
In the present work, we aimed at systematically investigating the individual importance of the ATG13 interaction sites for ULK1 complex formation, recruitment to the autophagosome formation site, and autophagy induction. For this, we made use of different proautophagic stimuli (i.e., amino acid starvation and MTOR inhibition) and different autophagy readouts (LC3 turnover; LC3, WIPI2, and ATG16L1 puncta formation). It appears that the association of ATG101 with ATG13 is central for autophagy induction. In contrast, binding of both ULK1 and RB1CC1 is not mandatory for this process. Generally, the observed effects were more pronounced upon MTOR inhibition, confirming the accepted model of MTOR-mediated regulation of the ULK1 complex and indicating that crude EBSS treatment might induce autophagy independently of the MTOR-ULK1 axis. We suggest that—next to the direct inhibition of ULK1 kinase activity—interference with the ATG13-ATG101 interaction might represent a promising approach to regulate autophagy induction.
Results
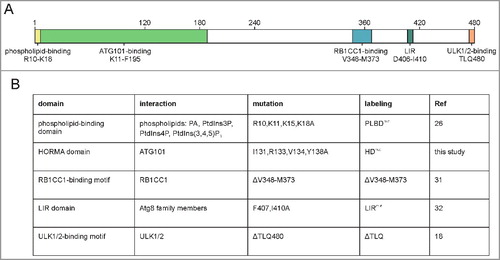
In order to comprehensively analyze the ATG13 domain requirements for autophagy, we performed a systematic analysis using specific ATG13 variants incapable of binding to phospholipids, ATG101, RB1CC1, Atg8 family members, or ULK1, respectively (A, B).
Figure 1. Interaction interfaces of human ATG13. (A) Schematic representation of human ATG13 (isoform 2; Uniprot identifier O75143-2). Amino acid sequences involved in binding to proteins and phospholipids are indicated.Citation18,Citation20,Citation23,Citation24,Citation26,Citation31–33,Citation56 (B) List of ATG13 mutations investigated in this paper. Targeted domains, interaction partners, applied mutations and labelling used for this manuscript are given.
The amino acid sequence V348-M373 of ATG13 comprises the RB1CC1 interaction site
The ATG13-RB1CC1 interaction site was reported to be located at the C terminus of ATG13.Citation19 We have previously identified an ATG13 isoform in the chicken B-lymphocyte cell line DT40, in which deletion of the amino acids encoded by exon 12 lead to inhibited interaction of ATG13 with RB1CC1.Citation31 The amino acid sequence encoded by avian exon 12 corresponds to the amino acid sequence V348 to M373 of human ATG13 isoform 2, which is encoded by human exon 14. Deletion of this sequence disrupted the ATG13-RB1CC1 interaction, while binding of ATG13 to ULK1 and ATG101 was not affected. This was evident from immunopurification experiments and from increased protein levels of ATG101 and ULK1 following the expression of ATG13 variants in atg13 KO MEFs (A). In order to exclude the possibility that the deletion of V348-M373 only results in a weakened interaction that is not detectable by immunopurification, we performed 2 additional assays to monitor protein interaction in vivo. First, we employed a proximity ligation assay that allows detection of single protein-protein interactions using antibody-recognition combined with exponential signal amplification by PCR. Visualization is mediated by fluorescent nucleotides. HA-tagged ATG13 variants were stained with mouse anti-HA antibodies and RB1CC1 with rabbit anti-RB1CC1 antibodies. As negative controls Atg13 WT MEFs expressing untagged ATG13 and atg13 KO MEFs expressing ATG13 lacking the entire C terminus (ΔC) were used. Cells reconstituted with full-length ATG13 displayed strong signals with significant difference to control cells (B). In contrast, MEFs expressing ATG13(ΔV348-M373) revealed a signal count similar to control cells, indicating the disruption of the interaction with RB1CC1. Second, we used the in vivo biotin labeling assay developed by Ting and colleagues.Citation34–36 In this assay, ATG13 variants were tagged with the ascorbate peroxidase derivative APEX2 and expressed in atg13 KO MEFs. Upon activation of the peroxidase, the provided biotin-phenol is converted to biotin-phenoxyl radicals, which covalently react with nearby electron-rich amino acids and thereby label proteins with biotin. Since phenoxyl radicals are short-lived and have a small labeling radius, only proteins proximal to the APEX2 fusion protein become biotinylated.Citation34–36 Subsequent cell lysis and enrichment of biotinylated proteins by streptavidine beads allow detection of interacting proteins. Immunoblotting revealed that RB1CC1 was only purified from cells expressing full-length ATG13 but was absent in all other samples (C). On the contrary, ATG101 was purified with all ATG13 variants. Note that ATG13 itself is biotinylated and purified; therefore, proteins might be purified due to biotinylation or interaction with ATG13. Nevertheless, both assays confirm that the ATG13 sequence V348-M373 mediates the interaction with RB1CC1.
Figure 2. The amino acid sequence V348-M373 comprises the RB1CC1 binding region in ATG13. (A) atg13 KO MEFs retrovirally transfected with empty vector or cDNA encoding either HA-ATG13 or HA-ATG13(ΔV348-M373) were lysed and cleared cellular lysates were subjected to immunopurifications with anti-HA-agarose or protein A/G beads in combination with anti-RB1CC1 or anti-ATG101 antibodies, respectively. Purified proteins were subjected to SDS-PAGE and analyzed by immunoblotting for RB1CC1, ULK1, ATG13, HA, or ATG101. (B) atg13 KO MEFs stably expressing HA-ATG13 or the indicated mutants were seeded onto glass cover slips. The next day cells were used for proximity ligation assay as described in the material and methods section (anti-HA antibody: covance MMS-101P). Nuclei were stained with DAPI. Signals and nuclei per image were counted and the signal:nuclei ratio was calculated. Data are represented as mean ± SEM. Samples without significant difference display identical letter (Student t test, 2-sample assuming unequal variances; minimum of 24 images was analyzed). (C) atg13 KO MEFs stably expressing HA-APEX2 alone or fused to either wild-type ATG13 or the indicated mutants were pre-incubated with phenol-biotin for 30 min and peroxidase was activated by adding H2O2 for 1 min. Cells were washed 3 times with quenching solution and lysed. Biotinylated proteins were purified using streptavidin agarose. Purified proteins were analyzed by immunoblotting for RB1CC1, HA, or ATG101. (D) S100 extracts of cells described in (A) were separated by size-exclusion chromatography on a Superose 6 increase column. Fractions were analyzed by immunoblotting for the indicated proteins. Diagrams show protein levels for each fraction at a ratio of the input and normalized to the fraction containing the highest concentration of the analyzed protein. Curves for controls (KO and ATG13) are reused in and .
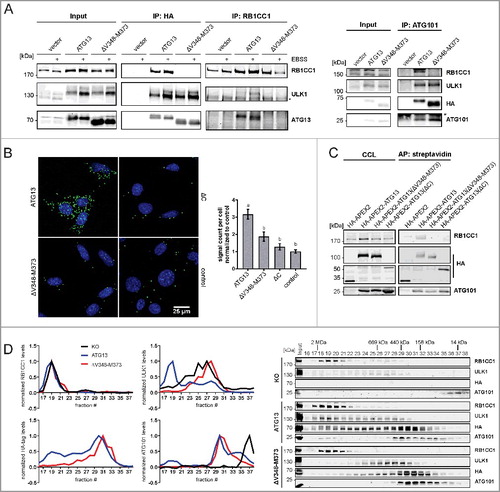
Next we questioned if and how the assembly of the ULK1 complex might be affected by the inhibition of the ATG13-RB1CC1 interaction. For this, size-exclusion chromatography experiments were conducted. As has been reported previously,Citation10 atg13 KO MEFs do not assemble the ULK1 complex (D, upper panels and black curve in diagrams). Whereas RB1CC1 is present in high-molecular mass fractions corresponding to complexes of approximately 3 MDa (D, fractions 18 to 21), ULK1 only distributes in lower-molecular mass fractions. ATG101 exists mainly as a monomer in fractions containing molecules lower than 43 kDa. Re-expression of wild-type ATG13 in these KO cells restores the assembly of the ULK1 complex, with all analyzed proteins being present in the high-molecular mass fractions (D, middle panels and blue curve in diagrams). Additionally, ATG101 and ATG13 display high protein amounts in fractions corresponding to a molecular mass of 400 to 200 kDa (D, middle panels, fractions 29 to 36). Finally, disruption of the RB1CC1 interaction with ATG13 by deleting the V348-M373 sequence resulted in a disassembled ULK1 complex and a shift of ATG13, ULK1 and ATG101 to lower-molecular mass fractions (D, lower panels and red curve in diagrams). Of note, ULK1 distribution resembles the atg13 KO phenotype, whereas ATG101 accumulates in fractions corresponding to 400 to 200 kDa protein complexes, which is different from KO cells (D, compare black and red curve in diagrams). Similarly, ATG13 protein levels are almost completely depleted in high-molecular mass fractions and are mainly present in later fractions. These data indicate that ATG13-containing subcomplexes are formed in cells expressing the ATG13(ΔV348-M373) variant rather than the entire RB1CC1-dependent ULK1 complex. Besides ATG13, these complexes might harbor ULK1, ATG101, or both (A).
Because the ULK1 complex is not formed when the interaction of ATG13 and RB1CC1 is inhibited, we next asked if this has an effect on the recruitment of both proteins to the autophagosome formation site. Immunofluorescence experiments showed diffuse distribution for both proteins under growing conditions in atg13 KO MEFs reconstituted with full-length ATG13 with a perinuclear accumulation of RB1CC1 (, ATG13 DMEM). Following autophagy induction by amino acid starvation, ATG13 and RB1CC1 exhibited colocalizing dots that likely represent the autophagosome formation site (, ATG13 EBSS, see inset). In contrast, expression of the ATG13(ΔV348-M373) variant did not promote the recruitment of either ATG13 or RB1CC1 to the PAS, and distribution of both proteins was unaffected by autophagy induction (, right panels).
Figure 3. Disruption of the RB1CC1-binding region in ATG13 inhibits mutual recruitment to the phagophore. atg13 KO MEFs retrovirally transfected with cDNA encoding either HA-ATG13 or HA-ATG13(ΔV348-M373) were seeded onto glass cover slips one day prior to stimulation with full medium (DMEM) or starvation medium (EBSS) for 1 h. Cells were fixed, permeabilized and stained for HA (covance MMS-101P) and RB1CC1. An inverse confocal laser scanning microscope was used for imaging. Puncta and colocalization per cell quantification was done using fiji software. Data represent mean + SEM. A minimum of 168 cells per stimulation was analyzed. Statistical analysis using the Student t test, 2-sample assuming unequal variances was performed comparing EBSS to DMEM for each individual cell line. No statistical significance with P < 0.05 was obtained. Columns for control (ATG13) are reused in , , and supplementary figure S9. Scale bar: 20 µm.
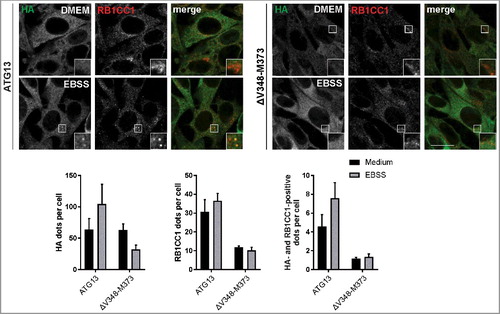
Taken together, the sequence V348-M373 represents the RB1CC1 interaction site in ATG13, and this protein-protein interaction can be abolished by the deletion of this peptide. This in turn provokes disassembly of the ULK1 complex and inhibited recruitment to the phagophore.
The amino acids I131, R133, V134 and Y138 of ATG13 are mandatory for the interaction with ATG101
In addition to the RB1CC1 interaction, we were also interested in the binding of ATG13 to ATG101. We conducted a computational alanine scanning of the ATG13-ATG101 interface on the structure of the human ATG13-ATG101 HORMA heterodimer (PDB ID: 5C50; Citationref. 24) using the DrugScorePPI webserver.Citation37 Interface residues resulting in a binding free energy change ΔΔG > 1 kcal mol−1 when mutated to alanine were considered binding hot spots (I131, R133, V134, Y138; A, upper panel). Isoleucine, arginine, and tyrosine are enriched in hot spot residues.Citation38 To independently validate the predicted hotspots, we performed MM-GB/SA calculations combined with a decomposition of the effective binding energy on a per-residue level.Citation39,Citation40 The MM-GB/SA calculations confirmed that R133, V134, Y138, and to a lesser extent I131, contribute most to the effective binding energy (A, middle panel). In addition, R139 and R142 were identified by MM-GB/SA but not by DrugScorePPI, and Y115 vice versa. Furthermore, a cluster of potential binding hot spots located in the connector loop (residues 33 to 58) of ATG13 was identified by MM-GB/SA but not by DrugScorePPI (Fig. S1). The consensus hot spot residues in the ATG13 interface (A, lower panel) were then changed to alanine, and binding of ATG101 to these ATG13 variants was analyzed by a bimolecular fluorescence complementation assay.
Figure 4. Mutation of residues I131, R133, V134 and Y138 in ATG13 is sufficient to inhibit its interaction with ATG101. (A) Computational alanine scanning of the ATG13-ATG101 interface was performed using the structure of the human ATG13-ATG101 HORMA heterodimer (PDB ID: 5C50, Citationref. 24) and the DrugScorePPI webserver Citation(ref. 37) (upper panel). ΔΔG denotes binding free energy differences for wild-type residue-to-Ala mutations; residues yielding ΔΔG > 1 kcal mol−1 are considered binding hot spots. In the middle panel, per-residue effective binding energies (ΔGbinding) computed by the MM-GB/SA approach (Citationref. 39, Citation40) are shown. Residues considered hot spots according to both methods are colored in red. In the lower panel, the localization of these residues in the ATG13 interface is shown. (B) atg13 KO MEFs stably expressing VenusC-ATG101 and VenusN-ATG13 (wild-type or the indicated mutants) were trypsinized and analyzed for Venus fluorescence using a flow cytometer. The median of fluorescence intensity for each sample was normalized to control cells lacking VenusN-ATG13 expression (“none”) and was plotted in a bar diagram representing mean ± SEM. Samples without significant difference display identical letters (Student t test, 2-sample assuming unequal variances). Representative data are plotted in a histogram. Cell lysates were examined for expression of the indicated proteins by immunoblotting. (C) atg13 KO MEFs retrovirally transfected with empty vector or cDNA encoding either HA-ATG13 or the indicated variants were lysed and cleared cellular lysates were subjected to immunopurification with anti-ATG101 antibodies and a protein A/G-Sepharose mix. Purified proteins were subjected to SDS-PAGE and analyzed by immunoblotting for RB1CC1, ULK1, or HA. (D) atg13 KO MEFs stably expressing the indicated HA-tagged ATG13 variants were grown on glass cover slips one day prior to incubation with starvation medium (EBSS) for 2 h, fixation and permeabilization. Immunofluorescence for HA (covance MMS-101P) and RB1CC1 was performed. An inverse confocal laser scanning microscope was used for imaging. Please note that we detected a high number of HA-positive puncta varying in size and intensity, of which only a minor portion colocalized with RB1CC1 puncta. This might be due to the exogenous expression of HA-ATG13 variants. Puncta and colocalization per cell quantification was done using fiji software. A minimum of 89 cells per stimulation was analyzed. Data represent mean + SEM. Statistical analysis using the Student t test, 2-sample assuming unequal variances was performed comparing EBSS to DMEM for each individual cell line. **P < 0.01, ***P < 0.001. Scale bar: 20 µm.
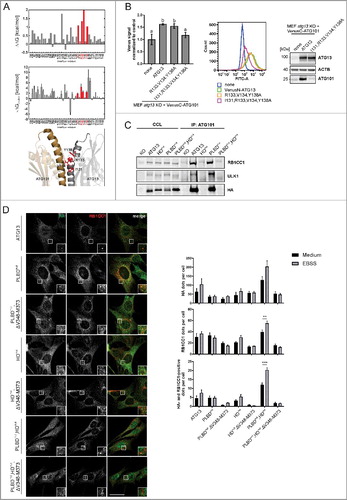
For this analysis, ATG13 and ATG101 were fused to the N- or C-terminal part of the YFP variant Venus, respectively. Upon expression of VenusN-ATG13 and VenusC-ATG101 fusion proteins in atg13 KO MEFs, Venus fluorescence was complemented by the interaction of wild-type ATG13 and ATG101. Mutations of single amino acids did not influence the interaction between ATG13 and ATG101 (data not shown). However, exchange of the 4 amino acids I131, R133, V134 and Y138 to alanine led to the disruption of the ATG13-ATG101 interaction as detected by decreased Venus fluorescence (B). When performing immunoblotting of ATG101, we detected low protein levels in cells transfected with the mutant ATG13 that were similar to the ones observed for atg13 KO MEFs (B). This is due to the absence of the stabilizing effect of the ATG13-ATG101 protein-protein interaction on ATG101; the stabilizing effect is evident in cells expressing full-length ATG13 (B). We also performed immunopurification experiments of ATG101. Only wild-type ATG13 was copurified, while the 4 amino acid ATG13 variant (I131,R133,V134,Y138A; named HORMA domain mutant, HDmut) was not capable of interacting with ATG101 (C). Furthermore, due to the missing ATG13 interaction, copurification of the other ULK1 complex members ULK1 and RB1CC1 was not possible. We also analyzed ATG13 harboring a mutated phospholipid-binding domain (PLBDmut). This motif is very proximal to the HORMA domain, and mutation might unintentionally affect the HORMA domain function. In our purification experiments, the ATG13(PLBDmut) variant was copurified with ATG101 indicating an intact HORMA domain (C, PLBDmut). By combining the HD mutation with the PLBD variant (C, PLBDmut,HDmut) the interaction with ATG101 was again inhibited. Importantly, the interaction with ATG14, which has recently been reported to bind to the HORMA domain of ATG13,Citation41 was neither affected by the HD nor the PLBD mutation (Fig. S2). The interaction of ATG13 with ULK1 or RB1CC1, respectively, was not affected either (Fig. S2).
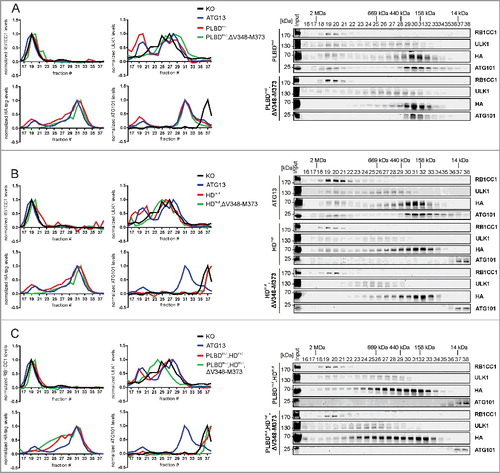
As described above for the RB1CC1-binding interface, we next investigated the ULK1 complex assembly by size-exclusion chromatography and recruitment to the phagophore by immunofluorescence. Mutation of the phospholipid-binding site did not affect the ULK1 complex assembly (A, PLBDmut; red curve in diagrams). In contrast, mutation of the ATG101 interaction site severely altered complex assembly (B, HDmut; red curve in diagrams). Distribution of ATG101 resembles the atg13 KO phenotype as it is only present as a monomer in the low-molecular mass fractions, while it is completely absent from both the 3 MDa and 400 to 200 kDa protein complexes. ATG13 was present in low amounts in the early molecular mass fractions and concentrated in later fractions. Additional mutation of the phospholipid-binding domain did not exhibit an additive effect on the distribution of the ULK1 components (C, PLBDmut,HDmut; red curve in diagrams). The described ATG13 variants were further analyzed in combination with a disrupted RB1CC1 interaction. Double mutation of the phospholipid- and RB1CC1-binding site (A, PLBDmut,ΔV348-M373; green curve in diagrams) induced a redistribution of ATG13, ATG101 and ULK1 into later fractions as was detected for the single ΔV348-M373 variant (see D). Combination of the RB1CC1 binding-deficient with the ATG101 binding-deficient mutant did not further impact ATG101 but promoted an additional reduction of ULK1 and ATG13 protein levels in early molecular mass fractions (B, HDmut,ΔV348-M373; green curve in diagrams). Finally, complex formation did not change in the triple mutant compared to the double mutant PLBDmut,HDmut (C, PLBDmut,HDmut,ΔV348-M373; compare red and green curves in diagrams).
Figure 5. Mutation of the HORMA domain, but not of the phospholipid-binding domain leads to disintegration of the ULK1 complex. (A to C) S100 extracts of atg13 KO MEFs stably expressing HA-ATG13 or the indicated mutants were separated by size-exclusion chromatography on a Superose 6 increase column. Fractions were analyzed by immunoblotting for the indicated proteins. Diagrams show protein levels for each fraction at a ratio of the input and normalized to the fraction containing the highest concentration of the analyzed protein. Curves for controls (KO and ATG13) are reused in and .
The immunofluorescence experiments revealed that most ATG13 variants that are not capable of a proper ULK1 complex formation do not support ATG13 and RB1CC1 colocalization upon autophagy induction either (D, PLBDmut,ΔV348-M373; HDmut,ΔV348-M373; PLBDmut,HDmut,ΔV348-M373). The corresponding single mutations lacking either intact ATG101- or phospholipid-binding properties supported formation of ATG13- and RB1CC1-positive puncta, though their number appeared to be independent of autophagy induction by starvation (D, PLBDmut; HDmut). However, in cells expressing the ATG13 variant lacking both the ATG101 and phospholipid interaction site, a permanent accumulation of ATG13 and RB1CC1 was detected, which was even increased upon autophagy induction (D and S3, PLBDmut,HDmut). This notable phenotype was reversed by additionally mutating the RB1CC1 interaction site (D, PLBDmut,HDmut,ΔV348-M373). Based on this observation, we hypothesize that the accumulation of ATG13 and RB1CC1 is potentially caused by inhibited signaling progression downstream of the recruitment of these proteins to the phagophore or a very early formation site. Since deletion of the RB1CC1 binding site abolished this accumulation, we suspect that the recruitment of ATG13 and RB1CC1 is dependent on their interaction and might occur earlier within the temporal hierarchy. In turn, ATG13-dependent binding to ATG101 and phospholipids are both important for the release of ATG13 and RB1CC1 from the phagophore. It is noteworthy that the disruption of one of the 2 interaction interfaces (PLBDmut or HDmut) does not affect signaling progression, indicating that interactions mediated by these interfaces might somehow compensate each other.
The ATG13-ULK1 interaction is required for ULK1 complex formation and recruitment to the autophagosome formation site while the LIR motif is dispensable
Two additional interaction interfaces have been reported for ATG13 proteins. The LC3-interacting region (LIR) domain mediates direct interaction of ATG13 with members of the Atg8 family. In agreement with the report on the LIR motif in ATG13 by Alemu et al.,Citation32 we exchanged F407 and I410 to alanine (B) to effectively inhibit interaction with LC3s and GABARAPs. These mutations did not have an effect on ULK1 complex formation as shown by size-exclusion chromatography (A, LIRmut; upper panels and red curve in diagrams), whereas a double mutant lacking both the LIR and the RB1CC1 interaction site showed disruption of the complex (A, LIRmut,ΔV348-M373; green curve in diagrams). Furthermore, we observed proper recruitment of ATG13 and RB1CC1 to the PAS after autophagy induction (B, LIRmut), which again was abolished by additional deletion of the RB1CC1 binding site (B, LIRmut,ΔV348-M373). Interestingly, mutation of the LIR motif did not affect the colocalization of ATG13 with LC3 after autophagy induction by EBSS treatment (C, LIRmut), which was also inhibited by deletion of the RB1CC1 interaction (C, LIRmut,ΔV348-M373). Of note, expression of this ATG13 double mutant led to increased localization of ATG13 to the nucleus despite autophagy induction.
Figure 6. Composition of the ULK1 complex is influenced by the ATG13-ULK1 interaction but not by the LIR motif of ATG13. (A) S100 extracts of atg13 KO MEFs stably expressing the indicated HA-ATG13 variants were separated by size-exclusion chromatography on a Superose 6 increase column. Fractions were analyzed by immunoblotting for the indicated proteins. Diagrams show protein levels for each fraction at a ratio of the input and normalized to the fraction containing the highest concentration of the analyzed protein. Curves for controls (KO and ATG13) are reused in and . (B) Cells described in (A) were seeded onto glass cover slips one day prior to stimulation with full medium (DMEM) or starvation medium (EBSS) for 1 h. Cells were fixed, permeabilized and stained for HA (covance MMS-101P) and RB1CC1. An inverse confocal laser scanning microscope was used for imaging. Puncta and colocalization per cell quantification was done using fiji software. A minimum of 127 cells per stimulation was analyzed. Data represent mean + SEM. Statistical analysis using the Student t test, 2-sample assuming unequal variances was performed comparing EBSS to DMEM for each individual cell line. *P < 0.05, **P < 0.01, ***P < 0.001. Scale bar: 20 µm. (C) atg13 KO MEFs stably expressing HA-ATG13 or the indicated mutants were seeded onto glass cover slips one day prior to stimulation with starvation medium (EBSS) for 2 h. Cells were fixed, permeabilized and stained for HA (covance MMS-101P) and LC3. An inverse confocal laser scanning microscope was used for imaging. Scale bar: 20 µm.
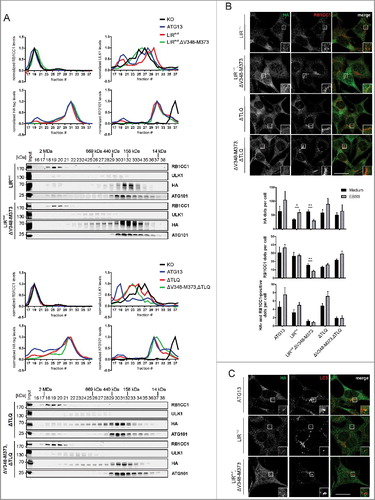
Finally, we applied the ΔTLQ mutation, which has previously been validated for the inhibition of the ULK1-ATG13 interaction (B).Citation18 Deletion of the minimal ULK1 interaction site in ATG13 resulted in a shift of ULK1 to later fractions in size-exclusion chromatography, while both ATG101 and ATG13 were still present in high-molecular mass fractions (Citationref. 18 and A, ΔTLQ; lower panels and red curve in diagrams). Deletion of both the ULK1 and RB1CC1 interaction sites in ATG13 resulted in the depletion of ATG101 from early fractions (A, ΔV348-M373,ΔTLQ; green curve in diagrams). Despite the fact that the ATG13(ΔTLQ) variant still interacts with RB1CC1, recruitment of both proteins to the autophagosome formation site was inhibited (B, ΔTLQ).
Mutations of interaction sites in ATG13 partly affect amino acid starvation-induced autophagy
After mapping the interaction sites between ATG13 and its binding partners, we were next interested in their relevance for autophagy regulation. First, we investigated the requirement of the ATG13-RB1CC1 interaction, since this interaction is apparently essential for the formation of the 3 MDa ULK1 complex. In a first approach, we analyzed amino acid starvation-induced mCitrine-LC3B degradation by flow cytometry. Cells with an intact autophagy signaling machinery display low fluorescence after autophagy induction, and this effect can be reversed by adding bafilomycin A1, as can be seen in Atg13 WT MEFs as well as in atg13 KO MEFs reconstituted with full-length ATG13 (A). Unexpectedly, expression of the ATG13 mutant ΔV348-M373 did not influence autophagy activity, since LC3B degradation as detected by a reduced fluorescence intensity was observed after treatment with EBSS (A). To further confirm this result, we performed immunofluorescence of endogenous LC3. This assay supported our previous observation, since the number of LC3-positive puncta increased in cells expressing either wild-type or ATG13(ΔV348-M373) upon bafilomycin A1 treatment, and this effect was enhanced by inducing autophagy with EBSS (B). Finally, we performed an LC3 turnover assay by immunoblotting. Again Atg13 WT MEFs and atg13 KO MEFs reconstituted with either full-length ATG13 or the ΔV348-M373 variant displayed similar LC3-II levels in cells treated with bafilomycin A1 alone (basal autophagy) or in combination with EBSS (induced autophagy) (C). Similar to the atg13 KO MEFs, an ATG13 version lacking the entire C terminus (ΔC) did not reveal any detectable autophagic flux (C). Since the autophagy readouts employed so far rely on LC3 lipidation and/or degradation, we decided to check another autophagic marker. We chose the early autophagy protein WIPI2, which is recruited to the phagophore shortly after ULK1 complex activation. Immunofluorescence of WIPI2 in atg13 KO MEFs expressing full-length ATG13 or the ΔV348-M373 mutant showed diffuse distribution in the cytoplasm under growing conditions, while WIPI2 puncta formation was induced by autophagy induction (, ATG13; and ΔV348-M373). Collectively, these data suggest that the interaction between ATG13 with RB1CC1 is not mandatory for autophagy induction.
Figure 7. Differential requirement of ATG13 interaction interfaces for amino acid starvation-induced LC3 turnover. (A) Atg13 wild-type MEFs (WT) or atg13 KO MEFs stably expressing mCitrine-LC3B and the indicated ATG13 variants were cultured in growth medium or starvation medium (EBSS) with or without 40 nM bafilomycin A1 (BafA1) for 8 h. Total cellular mCitrine-LC3B signals were analyzed by flow cytometry. The median of fluorescence intensity for each sample was normalized to wild-type cells incubated in growth medium. Data represent mean + SEM. **P < 0.01, ***P < 0.001 (Student t test, 2-sample assuming unequal variances). (B) Untransfected Atg13 wild-type (WT) MEFs or atg13 KO MEFs retrovirally transfected with empty vector (KO) or cDNA encoding the indicated ATG13 variants were grown on glass cover slips overnight and incubated for 2 h in growth medium or starvation medium (EBSS) in the presence or absence of 40 nM bafilomycin A1 (BafA1). Cells were fixed, permeabilized and stained for LC3. Imaging was performed using an inverse confocal laser scanning microscope and puncta per cell quantification was done using fiji software. Data represent mean + SEM. Statistical analysis using the Student t test, 2-sample assuming unequal variances was performed comparing LC3 puncta accumulation during EBSS + BafA1 treatment for depicted cell lines. **P < 0.01, ***P < 0.001 (Student t test, 2-sample assuming unequal variances). (C, D, F) Untransfected Atg13 wild-type MEFs (WT) or atg13 KO MEFs retrovirally transfected with empty vector (KO) or cDNA encoding the indicated ATG13 variants were incubated as described in (B). Cleared cellular lysates were analyzed by immunoblotting for HA, LC3, ACTB, and VCL. Fold changes were calculated by dividing each normalized ratio (protein to loading control) by the average of the ratios of the control lane (ATG13 in medium). Results are mean + SEM *P < 0.05, **P < 0.01, n.s., not significant (Student t test, 2-sample assuming unequal variances). (E) atg13 KO MEFs retrovirally transfected with empty vector (KO) or cDNA encoding the indicated ATG13 variants were incubated in growth medium or starvation medium (EBSS) for 2 h. Cleared cellular lysates were analyzed by immunoblotting for SQSTM1 or VCL.
Figure 8. Differential requirement of ATG13 interaction interfaces for amino acid starvation-induced WIPI2 puncta formation. (A) atg13 KO MEFs retrovirally transfected with cDNA encoding the indicated ATG13 variants were grown on glass cover slips overnight and incubated in growth medium (DMEM) or starvation medium (EBSS) for 2 h. Cells were fixed, permeabilized and stained for WIPI2. Imaging was performed using an inverse confocal laser scanning microscope. Puncta per cell quantification was done using fiji software. Data represent mean + SEM. Statistical analysis using the Student t test, 2-sample assuming unequal variances was performed comparing EBSS to DMEM for each individual cell line. *P < 0.05, **P < 0.01, ***P < 0.001. Scale bar: 20 µm.
As these findings were rather surprising, we further analyzed the other interaction motifs of ATG13. Mutation of the phospholipid-binding domain did not influence autophagy induction by amino acid starvation with EBSS either. LC3-II protein levels were similar in cells reconstituted with wild-type ATG13 or the PLBD mutant (D, PLBDmut). Likewise, mutation of both the phospholipid- and the RB1CC1-binding site did not significantly affect autophagic activity (D, PLBDmut,ΔV348-M373). In contrast, mutation of the ATG101 interaction site resulted in significantly reduced autophagic flux (D, HDmut). Concomitant deletion of the RB1CC1 interaction site did not have an additional effect (D, HDmut,ΔV348-M373). However, interference with both the phospholipid binding as well as the ATG101 interaction could further reduce the autophagic activity (D, PLBDmut,HDmut). This was also evident from the analysis of SQSTM1/p62 levels, which are highly accumulated in atg13 KO MEFs and in cells expressing the double mutant PLBDmut,HDmut (E). These results were further supported by WIPI2 immunofluorescence. While we detected WIPI2 puncta formation upon autophagy induction in cells expressing the ATG13 variants PLBDmut; and PLBDmut,ΔV348-M373 (, PLBDmut; and PLBDmut,ΔV348-M373), inhibition of ATG101 binding to ATG13 severely inhibited WIPI2 puncta formation after autophagy induction (, HDmut; HDmut,ΔV348-M373; PLBDmut,HDmut; and PLBDmut,HDmut,ΔV348-M373). Notably, these cells displayed very small WIPI2-positive structures, which were not regulated by autophagy induction.
As in our MEF cell lines the signal for LC3-II appeared to be very similar between full medium and EBSS in the presence of bafilomycin A1, we hypothesized that the induction of autophagy is masked by high levels of basal autophagy. We therefore repeated the starvation experiments for cell lines displaying reduced autophagic activity (HDmut; HDmut,ΔV348-M373; PLBDmut,HDmut; and PLBDmut,HDmut,ΔV348-M373) with a shortened incubation time of 1 h (Fig S4). In this setup, differences in autophagic flux caused by ATG13 mutations were even more obvious and further confirmed our result that inhibition of the ATG13-ATG101 interaction has a tremendous impact on autophagy induction.
Next, mutation of the LIR motif was analyzed. Interestingly, we detected a slight increase of LC3-II levels in samples treated with starvation medium and bafilomycin A1 compared to cells expressing wild-type ATG13 (F, LIRmut and ATG13; Fig. S5). This effect was reversed when both the interaction with LC3s or GABARAPs, and RB1CC1 were inhibited, since cells expressing this ATG13 double mutant displayed autophagic activity similar to wild-type ATG13 expressing cells (F, LIRmut,ΔV348-M373). WIPI2 staining also showed puncta formation upon autophagy induction (). However, with this readout, we did not observe significant differences between wild-type and LIRmut- and/or LIRmut,ΔV348-M373-expressing cells.
Finally, we investigated the mutation of both the ULK1 and the RB1CC1 interaction site. Our group has previously reported that inhibition of ATG13-ULK1 binding resulted in slightly but not significantly decreased autophagic activity.Citation18 This reduced autophagic activity was further decreased by additional mutation of the RB1CC1 interaction site (F, ΔV348-M373,ΔTLQ). Consistently, WIPI2 puncta formation upon autophagy induction is present in cells expressing the ATG13(ΔTLQ) mutant; however, it appears severely decreased by further mutation of the RB1CC1 interaction site (, ΔTLQ; and ΔV348-M373,ΔTLQ).
Mutations of interaction sites in ATG13 have severe effects on autophagy induction by MTORC1/2 inhibition
Because amino acid starvation by EBSS incubation is a rather crude treatment and ULK1/2-independent autophagy pathways have been described by several groups,Citation11,Citation31,Citation42–44 we next wanted to selectively target ULK1 signaling by the modulation of MTOR activity. To do so, we used torin2, a member of the Tor kinase domain inhibitor family (TORKInibs), which inhibits both MTOR complex 1 and 2 (MTORC1/2). Furthermore, rapamycin was used, which interacts with FKBP1A and thereby inhibits interaction of MTOR with RPTOR and MTORC1 formation.
First, we analyzed the ability of the inhibitors to induce the autophagy signaling pathway via MTOR inhibition. We found that torin2, similar to EBSS treatment, inhibits ULK1 phosphorylation at T758 as well as RPS6KB1 phosphorylation at T389, both of which are well known MTOR phosphorylation sites (Fig. S6A to C). Rapamycin-induced effects on RPS6KB1 phosphorylation at T389 were similar, but the inhibition of ULK1 T758 phosphorylation appeared much weaker (Fig. S6B and S6C). Nevertheless, this site was not absolutely “rapamycin-resistant”.Citation45 Consistently, ULK1 kinase activity as monitored by immunoblotting for phospho-S318 in ATG13 was more prominently induced by torin2 than by rapamycin (Fig. S6B and S6C). Furthermore, torin2 induced the recruitment of the ULK1 complex to the phagophore similarly as starvation with EBSS (Fig. S7).
In atg13 KO MEFs reconstituted with full-length ATG13 autophagy was induced following treatment with these inhibitors (A, ATG13). Interference with the RB1CC1-ATG13 interaction had only minor effects on autophagic activity (A, ΔV348-M373) as we have already detected for EBSS treatment.
Figure 9. Differential requirement of ATG13 interaction interfaces for autophagy induced by MTOR inhibition. (A to E) atg13 KO MEFs retrovirally transfected with empty vector (KO) or cDNA encoding the indicated ATG13 variants were incubated for 2 h in growth medium in the presence or absence of 250 nM torin2 (left panels) or 500 nM rapamycin (right panels) and 40 nM bafilomycin A1 (BafA1). Cleared cellular lysates were analyzed by immunoblotting for LC3 and ACTB. Fold changes were calculated by dividing each normalized ratio (protein to loading control) by the average of the ratios of the control lane (ATG13 in the medium). Results are mean + SEM *P < 0.05, **P < 0.01, ***P < 0.001 (Student t test, 2-sample assuming unequal variances).
Mutation of either the phospholipid-binding domain or the ATG101-interacting HORMA domain inhibited autophagy induction by torin2 and rapamycin (B, HDmut; and PLBDmut). Although this has been observed for the HDmut variant upon EBSS treatment, the effect for the PLBDmut is much more obvious for torin2 and rapamycin. It appears that cells expressing these ATG13 variants retain some autophagic activity, since we detected a slight increase of LC3-II levels in samples treated with bafilomycin A1. This was totally erased by mutating both the phospholipid- and the ATG101-binding domain (C, PLBDmut,HDmut). In these cells, the addition of bafilomycin A1 did not stimulate an accumulation of LC3-II compared to control cells. The subsequent deletion of the RB1CC1-binding domain did not have an additional effect (C, PLBDmut,HDmut,ΔV348-M373).
Next, the mutated LIR motif was investigated. In contrast to EBSS treatment, autophagy induction with torin2 or rapamycin neither increased nor inhibited autophagic activity in cells expressing the ATG13 variant (D, LIRmut). We detected an additive effect for the ATG13 double mutant additionally lacking the RB1CC1 interaction site (D, LIRmut,ΔV348-M373). In these cells, autophagic activity was significantly decreased when treated with torin2. These cells show increased levels when treated with bafilomycin A1 but this effect was not further increased by torin2. These results indicate that basal autophagy is still active but autophagy induction by torin2 is not possible. This was not the case for rapamycin stimulation, since we detected only minor effects on autophagy induction.
At last, we studied the ATG13(ΔTLQ) mutant lacking ULK1 interaction. Similar to the LIR mutant, autophagy was not induced by torin2 treatment although basal activity was still detectable (E, ΔTLQ). Additional mutation of the RB1CC1 interaction site did not have any further effect (E, ΔV348-M373,ΔTLQ). Rapamycin induced autophagy in cells expressing the ATG13(ΔTLQ) variant (E, ΔTLQ) although this was significantly reduced compared to control cells. Again autophagy was not induced in cells expressing the double mutant ΔV348-M373,ΔTLQ (E, ΔV348-M373,ΔTLQ).
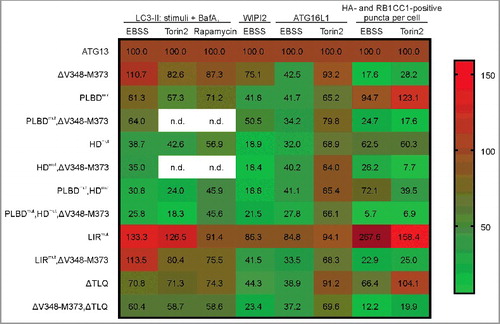
As has been done for EBSS experiments, we verified our results obtained for torin2-induced autophagy by immunofluorescence. Because we could not detect significant WIPI2 puncta formation upon torin2 treatment (Fig. S8), we monitored ATG16L1 puncta formation, another well-characterized marker for autophagosomes (Fig. S9). We observed a significant increase in puncta formation upon both EBSS and torin2 treatment for cells expressing wild-type ATG13 as well as ATG13 with a mutated LIR domain (Fig. S9, ATG13; LIRmut). Cells expressing ATG13 with disrupted RB1CC1- or ULK1-binding sites depicted inducible ATG16L1 puncta formation as well (Fig. S9, ΔV348-M373; ΔTLQ). For all other cell lines, ATG16L1 puncta were not detectable. Taking all our observations together, it appears that targeting the interaction between ATG101 and ATG13 has the most severe effects on autophagy induction with regard to all applied stimuli and readouts (, HDmut). LC3-II accumulation was blocked at least to ∼50%, while WIPI2 dot formation was reduced to less than 20% and ATG16L1 to ∼30%. These effects were even more pronounced when binding to both ATG101 and phospholipids was blocked (, PLBDmut,HDmut). In contrast, single interference with the binding to the other 2 ULK1 complex components, ULK1 and RB1CC1, respectively, did not or only weakly affect autophagy induction. However, the combination of these 2 mutations clearly inhibited autophagy induction upon MTOR inhibition (, ΔV348-M373,ΔTLQ).
Figure 10. Summary of the effects of mutations in ATG13 interaction interfaces on autophagy induction by amino acid starvation or MTOR inhibition. The heat map shows i) the percentage of LC3-II signal detected by immunoblotting for the indicated stimuli in the presence of bafilomycin A1 (columns 1 to 3), ii) the increase of WIPI2 and ATG16L1 puncta formation after autophagy induction by the indicated stimuli (columns 4 to 6), or iii) the percentage of colocalization events of HA-ATG13 variants and RB1CC1 after treatment with the indicated stimuli (columns 7 and 8). All values were normalized to the control, which was set to 100% (ATG13, first row). The range for mapping was defined from 5.7 to 159. The value for LIRmut under EBSS stimulation (267.6%) was set to out of range, and the color code dark red was manually assigned (n.d., not determined).
Discussion
In this study, we have systematically evaluated the relevance of the individual ATG13 interaction sites for the autophagic function of ATG13. In recent years, it became evident that the ULK1 protein kinase complex is an essential signaling node for the induction of autophagy. The core ULK1 complex consists of ULK1, ATG13, RB1CC1 and ATG101. Our analysis showed that targeting the ATG101-ATG13 protein interaction has the strongest effect on autophagy regulation. Though the remaining ATG13 interaction sites partially displayed functions during autophagy induction mediated by MTOR inhibition, mutations within the ATG13 HORMA domain clearly affected autophagy induced by amino acid starvation. In contrast, the interactions of ATG13 with ULK1 or RB1CC1 appeared to be rather dispensable for this type of autophagy induction.
The possibility to induce autophagy independently of ULK1/2 has been suggested by different groups. One might speculate that interference with the ATG13-ATG101 interaction targets both the ULK1 complex during canonical autophagy and potential ULK1-independent complexes that still rely on ATG13 and ATG101. These latter complexes might play a role in autophagy induction and/or during autophagy progression. Congruent to our observations, Suzuki et al. have reported that autophagy is defective in atg101 KO MEFs expressing an ATG101 version that can no longer bind ATG13.Citation20 The authors have already suggested that ATG101 fulfills 2 proautophagic functions: i) the stabilization of ATG13 and ii) the recruitment of downstream factors via a protruding loop termed WF finger.Citation20 Mutation of either the ATG13 interaction interface or the WF finger inhibited autophagy.Citation20 Future studies will have to reveal possible interacting molecules of the WF finger, and it remains to be shown that this motif is important for both ULK1-dependent and -independent processes.
Although the described observations suggest a central role for the ATG13-ATG101 interaction, we cannot entirely exclude that our ATG13 HORMA domain mutations simultaneously affect the binding to other reported interacting partners, i.e. ATG14 in higher eukaryotes and Atg9 in yeast.Citation25,Citation41 Recently, Park et al. reported that ATG14 is bound to a region between residues 1 to 198 in ATG13, which represents the HORMA domain.Citation41 They show that this interaction enables ULK1-dependent phosphorylation of ATG14, which in turn stimulates the kinase activity of the class III phosphatidylinositol 3-kinase (PtdIns3K) complex.Citation41 The observations by Park et al. are consistent with data obtained by Jao et al., who report that the HORMA domain of yeast Atg13 is important for the recruitment of the Atg14-containing class III PtdIns3K complex.Citation22 However, at least our immunopurification experiments indicate that binding to ATG14 is not altered for our ATG13 HORMA domain variants. In S. cerevisiae, a second binding partner of the Atg13 HORMA domain has been identified: Suzuki et al. show that Atg9 vesicles are recruited to the PAS via the interaction with the Atg13 HORMA domain.Citation25 This model has been recently refined by Yamamoto et al. Apparently, Atg13 links Atg17-Atg29-Atg31 complexes with each other via 2 distinct regions, ultimately resulting in the self-assembly of the Atg1 complexes.Citation30 The supramolecular self-assembly of the Atg1 complexes then leads to the recruitment of Atg9 vesicles.Citation30 Ohsumi and colleagues have been able to generate an Atg9 binding-deficient Atg13 variant, and the residues of Atg13 mediating this interaction are located to β-strands 4 to 6 and the hinge loop.Citation25 In contrast, human ATG13 binds to human ATG101 via the αC and the αA-αB connector, including β2’.Citation24 Furthermore, the interface between Atg101/ATG101 and Atg13/ATG13 is mostly conserved between fission yeast and human.Citation20,Citation24,Citation46 In all, there are 2 aspects that arise from these observations. First, there is certainly crosstalk between the Atg1/ULK1 complex and Atg9/ATG9, both in yeast and mammalian model systems. In 2004, Reggiori et al. report that Atg9 cycles through the PAS in an Atg1-Atg13-dependent manner.Citation47 Sekito et al. have found that Atg9 interacts with Atg17 in S. cerevisiae.Citation48 This interaction appears to be essential for the recruitment of Atg9 to the PAS and requires Atg1.Citation48 Rao et al. also report the direct interaction of Atg9 with Atg17.Citation49 They observe that the Atg9-Atg17 interaction is inhibited by the regulatory Atg31-Atg29 subcomplex but restored by the association of the Atg1-Atg13 subcomplex.Citation49 Finally, Papinski et al. have characterized Atg1-dependent phosphorylation of Atg9.Citation50 With regards to higher eukaryotes, Young et al observe that ULK1 regulates the starvation-induced redistribution of ATG9 from the trans-Golgi netwok to endosomes.Citation51 Mack et al. report that the AMPK-dependent phosphorylation of ULK1 regulates ATG9 localization,Citation52 and Weeraseekara et al. observe that these 2 kinases mediate the phosphorylation of ATG9.Citation53 Recently, Karanasios et al. report that the nucleation of autophagosomes is initiated by the ULK1 complex on ER tubulovesicular regions marked by ATG9 vesicles.Citation54 Second, to our knowledge, there is no evidence so far that Atg13/ATG13 directly interacts with Atg9/ATG9 in Atg101/ATG101-positive cells, i.e. fission yeast or higher eukaryotes. Along these lines, a simultaneous interaction of ATG101 and ATG9 with the HORMA domain of ATG13 has not been described. Further studies are necessary to characterize the mutual influence of the known and potentially additional ATG13 HORMA domain interaction partners in mammalian model systems.
The phospholipid-binding motif is located proximal to the HORMA domain and has been shown to be important for the translocation of ATG13 to early autophagosomal structures.Citation26 The lipid-binding capabilities of yeast Atg13 were addressed by Rao et al. They observe that Atg13 does not bind to small unilamellar vesicles containing either 40 mol% phosphatidylserine or 30 mol% phosphatidylinositol or 25 mol% phosphatidylinositol supplemented with 2.5 mol% phosphatidylinositol-3-phosphate.Citation49 However, Atg13 is still recruited to small unilamellar vesicles composed of yeast polar lipids, indicating that other lipids than the mentioned ones are required for Atg13 binding.Citation49 In our experimental setup, mutation of the phospholipid-binding motif clearly inhibited autophagy induction by rapamycin or torin2 treatment but not by amino acid starvation. These data are partially similar to the findings reported by Karanasios et al. Notably, the inhibition of both binding to phospholipids and ATG101 enhanced the phenotypes of both individual mutations and resulted in accumulation of ATG13 and RB1CC1 within puncta independent of autophagy induction. We speculate that the components of the ULK1 complex can be recruited to early autophagosomal structures possibly prior to phagophore formation, but that the subsequent release from this site is inhibited by blocked binding of phospholipids and ATG101. The observed accumulation of ATG13 and RB1CC1 was entirely abrogated by further inhibiting the ATG13-RB1CC1 interaction, hinting towards a hierarchical order of protein interactions. Nevertheless, neither the occurrence of these ATG13/RB1CC1 puncta nor their inhibition had implications for autophagy execution.
Generally, the data obtained for the RB1CC1-binding site are rather unexpected. Interference with the ATG13-RB1CC1 interaction resulted in disassembled ULK1 complexes and inhibited recruitment of ATG13 and RB1CC1 to the phagophore. However, we did not see any effect on autophagic activity. Our group has previously observed that deletion of the RB1CC1 interaction site in ATG13 results in inhibited autophagy in chicken DT40 B-lymphocytes.Citation31 Furthermore, Chen et al. have identified the corresponding amino acids in RB1CC1 mediating the interaction with ATG13.Citation55 The ATG13-binding site in RB1CC1 is established by amino acids 582 to 585 (LQFL) in human RB1CC1.Citation55 The authors employ a knock-in mouse model expressing a RB1CC1 variant that cannot bind ATG13, and they observe that autophagy is completely blocked but that the nonautophagic functions of RB1CC1 fully support embryogenesis.Citation55 These observations are contradictory to our results. The usage of different model systems and/or autophagy readouts might contribute to this discrepancy. We suggest that the components of the ULK1 complex become recruited to the phagophore independently of a fully assembled ULK1 complex, ultimately resulting in regular autophagy progression. Since we observe that the interaction between ATG13 and RB1CC1 is important for their recruitment to the autophagosome formation site but not mandatory for autophagy induction, it also appears possible that they support autophagy execution remotely from the autophagosome formation site. Still, we cannot exclude that ATG13- and RB1CC1-positive puncta might still form but are not detectable due to reduced size or shortened half-life. Alternatively, other ULK1 complex components than ATG13 might directly interact with RB1CC1, or mammalian ATG13 possesses multiple RB1CC1-binding sites, as has been reported for yeast Atg13.Citation30 However, all these possibilities are clearly not supported by our immunopurifications, proximity ligation assays, biotin-phenol labelling experiments, or size-exclusion chromatographies.
The interaction of ATG13 and ULK1 is relevant for proper autophagy induction by EBSS stimulation as reported by our group,Citation18 although the ΔTLQ-mutation-dependent reduction of the autophagic flux was not significant. In contrast, autophagic flux induced by rapamycin or torin2 was significantly decreased in cells expressing the ULK1 binding-deficient ATG13 variant, albeit basal autophagy levels were present. This is in accordance with the accepted model that autophagy induction by direct MTOR inhibition unequivocally relies on the ULK1 complex. At this point, we note that torin2 has a much stronger effect on ULK1 S758 and ATG13 S318 phosphorylation than rapamycin. Although we would not state that ULK1 S758 phosphorylation is rapamycin-resistant as previously suggested,Citation45 the rapamycin-induced reduction of ULK1 phosphorylation is weaker than the one observed for torin2.
We also investigated the relevance of the LIR motif in ATG13. To date LIR motifs (alternatively termed Atg8-family interacting motif, AIM) have been identified for several components of the Atg1/ULK1 complexes, e.g. for yeast Atg1 or mammalian ULK1, ATG13, and RB1CC1.Citation32,Citation33,Citation56–58 Kraft et al. report that mutation of the Atg1 LIR motif sensitizes cells for autophagy defects,Citation56 and Nakatogawa et al. observe that mutations in the Atg1 LIR cause a significant defect in autophagy, without affecting the functions of Atg1 during autophagosome formation.Citation57 With regard to mammalian ULK1, Kraft et al. show that the number of ULK1-positive structures upon starvation is significantly reduced for the LIR-mutated ULK1, whereas the total number of WIPI2 puncta is increased.Citation56 These data indicate that the ULK1 LIR motif is required for efficient recruitment to phagophores or autophagosomes and that WIPI2-positive autophagosomes or autophagosome precursors are stalled at an early stage during autophagy in cells expressing the ULK1 LIR mutant.Citation56 Similarly, Alemu et al. show that ULK1 needs the LIR motif to get recruited to WIPI2- and LC3-positive structures, again supporting the conclusion that ULK1 is located on phagophores and/or autophagosomes and might participate in later steps of autophagy.Citation32 Two groups have identified a LIR motif within ATG13.Citation32,Citation33 Suzuki et al. have determined the crystal structures of 3 LC3 isoforms in complex with the Atg13 LIR.Citation33 However, so far an investigation of the ATG13-specific relevance of the LIR motif has not been reported. We did not observe any alterations of the recruitment of ATG13 or RB1CC1 to puncta upon mutation of the ATG13 LIR motif. Furthermore, WIPI2 puncta formation was not significantly affected by LIR mutation. However, LC3 turnover appeared to be rather increased than repressed. Notably, mutation of both the LIR motif and the RB1CC1 interaction site resulted in an enhanced nuclear localization of both ATG13 and LC3 following autophagy induction.
Huang et al. report that nuclear LC3 becomes deacetylated by SIRT1 and then traffics to the cytoplasm and enables autophagosome formation.Citation59 The association of deacetylated LC3 with autophagy factors shifts its distribution from the nucleus toward the cytoplasm.Citation59 Although a nuclear function of ATG13 has not been reported yet, it is tempting to speculate that ATG13 (possibly in combination with RB1CC1) participates in the regulation of the subcellular LC3 distribution. When ATG13 is released from the ULK1 complex by deletion of the RB1CC1 interaction site, LC3 is retained in the nucleus. Notably, nuclear functions and/or localization have been reported for ULK1, ULK2 and RB1CC1.Citation60–62
In summary, we suggest that the ATG13-ATG101 interaction represents one Achilles heel of autophagy induction and, accordingly, is an attractive target for therapeutic interventions in disease settings where the inhibition of autophagy is desired. Several ULK1 kinase inhibitors have been identified and characterized.Citation63–66 However, these compounds neglect ULK1/2-independent autophagy pathways, which might still depend on the ATG13-ATG101 interaction. It is tempting to speculate that small-molecule compounds interfering with this protein-protein interaction might be therapeutically valuable drugs.
Materials and methods
Antibodies and reagents
Antibodies against ACTB/β-actin (clone AC-74, Sigma-Aldrich, A5316), ATG101 (Sigma-Aldrich, SAB4200175), ATG13 (Sigma-Aldrich, SAB4200100), ATG13 phospho (p)-S318 (Rockland Immunochemicals, 600-401-C49), ATG14 (MBL, PD026), ATG16L1 (MBL, PM040), HA (Covance, MMS-101R, now BioLegend, 901501), LC3 (for immunoblotting: Cell Signaling Technology, 2775 [detects endogenous levels of total LC3B protein; cross-reactivity may exist with other LC3 isoforms according to manufacturer specification]; for immunofluorescence: MBL International, PM036 [reacts with LC3A/LC3B/LC3C according to manufacturer specification]), RPS6KB1 phospho (p)-T389 (clone 1A5, Cell Signaling Technology, 9206), RB1CC1 (for immunoblotting: Bethyl Laboratories, A301-536A; for immunofluorescence: Proteintech, 17250-1-AP), SQSTM1/p62 (PROGEN Biotechnik, GP62-C), ULK1 (clone D8H5, Cell Signaling Technology, 8054), ULK1 phospho (p)-S757 (Cell Signaling Technology, 6888), VCL/Vinculin (Sigma-Aldrich, V9131), and WIPI2 (Serotec, MCA5780GA) were used. IRDye 800- or IRDye 680-conjugated secondary antibodies were purchased from LI-COR Biosciences (926-32210/11, 926–68070/71, 926–68024 and 926–32214), Alexa Fluor® 488-conjugated goat anti-mouse IgG and Alexa Fluor® 647-conjugated goat anti-rabbit or anti-mouse IgG antibodies from Jackson ImmunoResearch Laboratories (111-605-003 and 111-605-003). Other reagents used were bafilomycin A1 (Sigma-Aldrich, B1793 and Alfa Aesar, J61835), torin2 (Selleckchem, S2817), rapamycin (Calbiochem, 553210), protein A/G Sepharose (GE Healthcare, 17-5280-01 and 17-0618-01) and HA-agarose (Sigma-Aldrich, A2095).
Cell lines and cell culture
Wild-type and atg13 KO MEFs containing an insertion of a gene-trap cassette in the Atg13 gene have previously been described.Citation10 Cells were cultured in high glucose (4.5 g/l) DMEM supplemented with 10% FCS at 37°C in a 5% CO2 humidified atmosphere. For amino acid starvation, cells were washed once with DPBS (Dulbecco's Phosphate-Buffered Saline, Gibco, 14190-094) and incubated for the indicated time points in EBSS (Earle's Balanced Salt Solution, Gibco, 24010–043).
Immunopurification, immunoblotting and size-exclusion chromatography
Immunopurification and immunoblotting were done as described previously.Citation18 For size-exclusion chromatography, S100 extracts were prepared by resuspending cell pellets in RoederA buffer (10 mM HEPES, pH 7, 10 mM KCl, 1.5 mM MgCl2, 0.5 mM DTT and protease inhibitor cocktail [Roche, 04693132001]), incubating at room temperature for 10 min and disruption with 10 strokes in a 1 ml tight Wheaton-dounce homogenizer (Wheaton, 357538). NaCl concentration was adjusted to 150 mM and lysates were centrifuged at 17,000 x g for 30 min. Supernatants were filtered through a 45-nm PVDF filter unit and applied onto a Superose 6 increase 10/300 GL column (GE Healthcare, 29-0915-96). The column was calibrated with a Gel Filtration Calibration Kit (GE Healthcare, 28-4038-42, dextran blue [2 MDa], TG/thyroglobulin [669 kDa], ferritin [440 kDa], ALDO/aldolase [158 kDa] and RNaseA [14 kDa]). For quantification of protein levels in each fraction, immunoblotting was performed and densitometry was done using Image Studio Light Version 4 (LI-COR Biosciences). Protein ratios (fraction to input) were normalized to the fraction with highest signal intensity.
Immunofluorescence
Cells were grown on glass cover slips one day prior to stimulation, fixation with 4% formaldehyde-PBS for 15 min on ice, quenching with 50 mM NH4Cl for 15 min and permeabilization with 50 µg/ml digitonin (Roth, 4005) for 5 min. Samples were blocked with 3% BSA (Roth, 8076)-PBS and incubated with primary antibodies for 1 h. After secondary antibody incubation, samples were washed 2 times with 0.2% Tween-20 (Sigma-Aldrich, P1379) in PBS. Cells were embedded in Mowiol-488 (Sigma-Aldrich, 81381) containing DAPI. Imaging was performed with a Zeiss LSM 710 or 780 confocal laser scanning microscope (Zeiss, Köln, Germany) with a Plan Apochromat 63x/1.4 oil objective (Zeiss, Köln, Germany). Quantification of images was performed with fiji.Citation67 For that, signals and nuclei were counted per image and a signal-to-nuclei ratio was calculated.
Flow cytometry
Cells stably expressing mCitrine-LC3B were incubated in EBSS starvation medium for 8 h. Cells were trypsinized and analyzed for mCitrine fluorescence using an EC800 cell analyser (Sony, Tokyo, Japan).
Retroviral transfection
Generation of pMSCVpuro-HA-ATG13 based vectors has previously been described.Citation18 Briefly, for the generation of cDNAs encoding ATG13 mutants mutagenesis PCRs were performed using the following primers: ΔV348-M373: CAAACCCATTAACCAGGTGAATCCTCCAGATTC, ΔC: GTAATATACCCGTCTGTAGAATAAGCGGCCGCTCGAAAC, phospholipid-binding domain (PLBDmut): CTGATCTCAATTCCCAGGACGCAGCGGACCTGGACGCGTTTATTGCATTTTTTGCCCTCAAGACTG, HORMA domain (HDmut): CTGAAGTCCCTTCTTGCTGCAACTGCGGCGACACCAGCCGCTAGGCTCTCCAGGAAAC, LIR domain (LIRmut): CCATGATGACGCCGTTATGGCAGACTTTAAAC, ΔTLQ: CCTTTGTGGAATAAGCGGCCGCTCGAAAC. Reverse complement sequences of forward primers were used as reverse primers. Plat-E cells (kindly provided by Toshio Kitamura, Institute of Medical Science, University of Tokyo, Japan) were used as packaging cell line. Transfection with retroviral expression vectors was performed with FuGENE® 6 (Roche, 11988387001). atg13 KO MEF cells were incubated with retroviral supernatant fractions containing 3 mg/ml polybrene (Sigma-Aldrich, H9268-106) and selected in medium containing 2.5 μg/ml puromycin (InvivoGen, ant-pr-1). Generation of MEFs stably expressing mCitrine-LC3B was performed as previously described.Citation18
Bimolecular fluorescence complementation assay
Vectors containing the N- and C-terminal sequence of Venus were kindly provided by Michael Engelke.Citation68 Sequences encoding VAMP7 or ΔN-BLNK (also known as SLP-65) were excised by BamHI and EcoRI or BglII and NotI digestion, respectively. Vector backbones were blunted and ligated generating pMSCVbleo-VenusC and pMSCVpuro-VenusN. VenusC cDNA was then cloned into the pBABEhygro vector (Addgene, 1765; deposited by Hartmut Land, Jay Morgenstern and Bob Weinberg). ATG13 and ATG101 cDNAs were inserted by sequence and ligation-independent cloning (SLIC; Citationref. 69) using the following primers: ATG13 fwd: CAACTTCAAGATCCGCCACAACATCGAAGATCGGCCGCGAATTGCGTGCAAAATTCCGAATGATCTGAAACAGAAAGTGATG, ATG13 rev: GACTGCCTTGGGAAAAGCGCCTCCCCTACCCGGTAGAATTTTACTGCAGGGTTTCCACAAAGGC, ATG101 fwd: GCGTGCAAAATTCCGAATGATCTCGAGCAGAAAGTGATGAACCATAACTGTCGCTCGGAGGTGCTGGAG, and ATG101 rev: GACACACATTCCACAGGGTCGACTCAGAGGGCAAGGGTGTCTTTGATG. As templates pMSCV-HA-ATG13 and CMV-FLAG-ATG101 (Addgene, 22877; deposited by Noboru Mizushima) were used, thereby generating pMSCVpuro-VenusN-ATG13 and pBABEhygro-VenusC-ATG101. The SLIC protocol Citation(ref. 69) was performed with slight alterations, i.e., single strands were generated using the Klenow fragment at 37°C for 30 min, followed by heat inactivation at 75°C for 15 min. atg13 KO MEFs stably expressing VenusC-ATG101 were generated by retroviral transfection. These cells were further incubated with VenusN-ATG13 viroid supernatant for 24 h. Cells were trypsinized and used for flow cytometric analysis or cleared cellular lysates were obtained for immunoblotting.
Biotin-phenol labeling in live cells
For the generation of pMSCV-HA-APEX2-ATG13, SLIC was performed with the primers ACGATGTGCCAGATTACGCCGGATCCGGAAAGTCTTACCCAACTGTGAGTG and AGCCCGAGGTCGAGCCCGAGCCCTTGGCGGCATCAGCAAACCCAAGCTCGGAAAG using pcDNA3 Connexin43-GFP-APEX2 (Addgene, 49385; deposited by Alice Ting) as a template for APEX2 amplification and GGGCTCGGGCTCGACCTCGGGCTCGGGCGAAACTGATCTCAATTCCCAGGACAG and CCGGTAGAATTCGTTTCGAGCGGCCGCTTACTGCAGGG for ATG13 amplification. pMSCV-HA-ATG13 was digested with BamHI and NotI. Subsequently mutagenesis PCR was performed for ATG13 mutants and stable cell lines were generated by retroviral transfection. The biotinylation protocol was performed as previously described.Citation35 For enrichment of biotinylated proteins, cells were lysed in RIPA buffer containing protease quenchers, and streptavidin agarose (Sigma-Aldrich, S1638) was used for protein purification.
Proximity-ligation assay
In situ analysis of protein interaction was performed with the DuoLink® system from Sigma-Aldrich (Sigma-Aldrich, DUO92101). Cells were plated on glass cover slips 1 d prior to fixation with 4% formaldehyde-PBS for 15 min on ice, quenching with 50 mM NH4Cl for 15 min and permeabilization with 50 µg/ml digitonin for 5 min. Samples were blocked with 3% BSA-PBS and incubated with primary antibodies for 1 h. Secondary antibody probing, ligation and amplification were performed according to the manufacturer's protocol. Imaging was performed on an inverse laser scanning confocal microscope in z stacks. Stacks were merged with average intensities. Signals and nuclei were counted per image and the signal-to-nuclei ratio was calculated.
Computational alanine scanning and MM-GB/SA calculations
The structure of the human ATG13-ATG101 HORMA heterodimer (PDB ID: 5C50, Citationref. 24) was prepared with the protein preparation wizard in Maestro.Citation70 A conformational ensemble was generated from 3 explicit solvent MD simulations of 250 ns length, performed with the Amber14 software package. All MD simulations and subsequent MM-GB/SA calculations were carried out as described previously.Citation71 The same structure was used as input structure for the DrugScorePPI webserver to perform computational alanine scanning.Citation37
Disclosure of Potential Conflicts of Interest
The authors declare that there are no competing financial interests in relation to the work described.
supp-data-1387342.doc
Download MS Word (18.1 MB)Acknowledgments
We thank Toshio Kitamura for providing Plat-E cells and Michael Engelke for providing vectors containing the N- and C- terminal sequence of Venus.
Additional information
Funding
Related Research Data
References
- Dikic I, Johansen T, Kirkin V. Selective autophagy in cancer development and therapy. Cancer Res. 2010;70:3431–3434. doi:10.1158/0008-5472.CAN-09-4027. PMID:20424122
- Levine B, Kroemer G. Autophagy in the pathogenesis of disease. Cell. 2008;132:27–42. doi:10.1016/j.cell.2007.12.018. PMID:18191218
- Mizushima N, Levine B, Cuervo AM, Klionsky DJ. Autophagy fights disease through cellular self-digestion. Nature. 2008;451:1069–1075. doi:10.1038/nature06639. PMID:18305538
- Mowers EE, Sharifi MN, Macleod KF. Autophagy in cancer metastasis. Oncogene. 2017;36:1619–1630. doi:10.1038/onc.2016.333. PMID:27593926
- Ganley IG, Lam du H, Wang J, Ding X, Chen S, Jiang X. ULK1.ATG13.FIP200 complex mediates mTOR signaling and is essential for autophagy. J Biol Chem. 2009;284:12297–12305. doi:10.1074/jbc.M900573200. PMID:19258318
- Hosokawa N, Hara T, Kaizuka T, Kishi C, Takamura A, Miura Y, Iemura S, Natsume T, Takehana K, Yamada N, et al. Nutrient-dependent mTORC1 association with the ULK1-Atg13-FIP200 complex required for autophagy. Mol Biol Cell. 2009;20:1981–1991. doi:10.1091/mbc.E08-12-1248. PMID:19211835
- Hosokawa N, Sasaki T, Iemura S, Natsume T, Hara T, Mizushima N. Atg101, a novel mammalian autophagy protein interacting with Atg13. Autophagy. 2009;5:973–979. doi:10.4161/auto.5.7.9296. PMID:19597335
- Mercer CA, Kaliappan A, Dennis PB. A novel, human Atg13 binding protein, Atg101, interacts with ULK1 and is essential for macroautophagy. Autophagy. 2009;5:649–662. doi:10.4161/auto.5.5.8249. PMID:19287211
- Gan B, Peng X, Nagy T, Alcaraz A, Gu H, Guan JL. Role of FIP200 in cardiac and liver development and its regulation of TNFalpha and TSC-mTOR signaling pathways. J Cell Biol. 2006;175:121–133. doi:10.1083/jcb.200604129. PMID:17015619
- Kaizuka T, Mizushima N. Atg13 Is essential for autophagy and cardiac development in mice. Mol Cell Biol. 2015;36:585–595. doi:10.1128/MCB.01005-15. PMID:26644405
- Cheong H, Lindsten T, Wu J, Lu C, Thompson CB. Ammonia-induced autophagy is independent of ULK1/ULK2 kinases. Proc Natl Acad Sci USA 2011;108:11121–11126. doi:10.1073/pnas.1107969108. PMID:21690395
- Kundu M, Lindsten T, Yang CY, Wu J, Zhao F, Zhang J, Selak MA, Ney PA, Thompson CB. Ulk1 plays a critical role in the autophagic clearance of mitochondria and ribosomes during reticulocyte maturation. Blood. 2008;112:1493–1502. doi:10.1182/blood-2008-02-137398. PMID:18539900
- Lee EJ, Tournier C. The requirement of uncoordinated 51-like kinase 1 (ULK1) and ULK2 in the regulation of autophagy. Autophagy. 2011;7:689–695. doi:10.4161/auto.7.7.15450. PMID:21460635
- Alers S, Löffler AS, Wesselborg S, Stork B. Role of AMPK-mTOR-Ulk1/2 in the regulation of autophagy: cross talk, shortcuts, and feedbacks. Mol Cell Biol. 2012;32:2–11. doi:10.1128/MCB.06159-11. PMID:22025673
- Papinski D, Kraft C. Regulation of autophagy by signaling through the Atg1/ULK1 complex. J Mol Biol. 2016;428:1725–1741. doi:10.1016/j.jmb.2016.03.030. PMID:27059781
- Wesselborg S, Stork B. Autophagy signal transduction by ATG proteins: from hierarchies to networks. Cell Mol Life Sci: CMLS. 2015;72:4721–4757. doi:10.1007/s00018-015-2034-8. PMID:26390974
- Wong PM, Puente C, Ganley IG, Jiang X. The ULK1 complex: sensing nutrient signals for autophagy activation. Autophagy. 2013;9:124–137. doi:10.4161/auto.23323. PMID:23295650
- Hieke N, Löffler AS, Kaizuka T, Berleth N, Böhler P, Driessen S, Stuhldreier F, Friesen O, Assani K, Schmitz K, et al. Expression of a ULK1/2 binding-deficient ATG13 variant can partially restore autophagic activity in ATG13-deficient cells. Autophagy. 2015;11:1471–1483. doi:10.1080/15548627.2015.1068488. PMID:26213203
- Jung CH, Jun CB, Ro SH, Kim YM, Otto NM, Cao J, Kundu M, Kim DH. ULK-Atg13-FIP200 complexes mediate mTOR signaling to the autophagy machinery. Mol Biol Cell. 2009;20:1992–2003. doi:10.1091/mbc.E08-12-1249. PMID:19225151
- Suzuki H, Kaizuka T, Mizushima N, Noda NN. Structure of the Atg101-Atg13 complex reveals essential roles of Atg101 in autophagy initiation. Nat Struct Mol Biol. 2015;22:572–580. doi:10.1038/nsmb.3036. PMID:26030876
- Aravind L, Koonin EV. The HORMA domain: a common structural denominator in mitotic checkpoints, chromosome synapsis and DNA repair. Trends Biochem Sci. 1998;23:284–286. doi:10.1016/S0968-0004(98)01257-2. PMID:9757827
- Jao CC, Ragusa MJ, Stanley RE, Hurley JH. A HORMA domain in Atg13 mediates PI 3-kinase recruitment in autophagy. Proc Natl Acad Sci USA. 2013;110:5486–5491. doi:10.1073/pnas.1220306110. PMID:23509291
- Michel M, Schwarten M, Decker C, Nagel-Steger L, Willbold D, Weiergraber OH. The mammalian autophagy initiator complex contains two HORMA domain proteins. Autophagy. 2015;11:2300–2308. doi:10.1080/15548627.2015.1076605. PMID:26236954
- Qi S, Kim do J, Stjepanovic G, Hurley JH. Structure of the Human Atg13-Atg101 HORMA Heterodimer: an Interaction Hub within the ULK1 Complex. Structure. 2015;23:1848–1857. doi:10.1016/j.str.2015.07.011. PMID:26299944
- Suzuki SW, Yamamoto H, Oikawa Y, Kondo-Kakuta C, Kimura Y, Hirano H, Ohsumi Y. Atg13 HORMA domain recruits Atg9 vesicles during autophagosome formation. Proc Nat Acad Sci United States America. 2015;112:3350–3355. doi:10.1073/pnas.1421092112. PMID:25737544
- Karanasios E, Stapleton E, Manifava M, Kaizuka T, Mizushima N, Walker SA, Ktistakis NT. Dynamic association of the ULK1 complex with omegasomes during autophagy induction. J Cell Sci. 2013;126:5224–5238. doi:10.1242/jcs.132415. PMID:24013547
- Fujioka Y, Suzuki SW, Yamamoto H, Kondo-Kakuta C, Kimura Y, Hirano H, Akada R, Inagaki F, Ohsumi Y, Noda NN. Structural basis of starvation-induced assembly of the autophagy initiation complex. Nat Struct Mol Biol. 2014;21:513–521. doi:10.1038/nsmb.2822. PMID:24793651
- Mei Y, Su M, Soni G, Salem S, Colbert CL, Sinha SC. Intrinsically disordered regions in autophagy proteins. Proteins. 2014;82:565–578. doi:10.1002/prot.24424. PMID:24115198
- Chew LH, Lu S, Liu X, Li FK, Yu AY, Klionsky DJ, Dong MQ, Yip CK. Molecular interactions of the Saccharomyces cerevisiae Atg1 complex provide insights into assembly and regulatory mechanisms. Autophagy. 2015;11:891–905. doi:10.1080/15548627.2015.1040972. PMID:25998554
- Yamamoto H, Fujioka Y, Suzuki SW, Noshiro D, Suzuki H, Kondo-Kakuta C, Kimura Y, Hirano H, Ando T, Noda NN, et al. The intrinsically disordered protein atg13 mediates supramolecular assembly of autophagy initiation complexes. Dev Cell. 2016;38:86–99. doi:10.1016/j.devcel.2016.06.015. PMID:27404361
- Alers S, Löffler AS, Paasch F, Dieterle AM, Keppeler H, Lauber K, Campbell DG, Fehrenbacher B, Schaller M, Wesselborg S, et al. Atg13 and FIP200 act independently of Ulk1 and Ulk2 in autophagy induction. Autophagy. 2011;7:1423–1433. doi:10.4161/auto.7.12.18027. PMID:22024743
- Alemu EA, Lamark T, Torgersen KM, Birgisdottir AB, Larsen KB, Jain A, Olsvik H, Overvatn A, Kirkin V, Johansen T. ATG8 family proteins act as scaffolds for assembly of the ULK complex: sequence requirements for LC3-interacting region (LIR) motifs. J Biol Chem. 2012;287:39275–39290. doi:10.1074/jbc.M112.378109. PMID:23043107
- Suzuki H, Tabata K, Morita E, Kawasaki M, Kato R, Dobson RC, Yoshimori T, Wakatsuki S. Structural basis of the autophagy-related LC3/Atg13 LIR complex: recognition and interaction mechanism. Structure. 2014;22:47–58. doi:10.1016/j.str.2013.09.023. PMID:24290141
- Hung V, Zou P, Rhee HW, Udeshi ND, Cracan V, Svinkina T, Carr SA, Mootha VK, Ting AY. Proteomic mapping of the human mitochondrial intermembrane space in live cells via ratiometric APEX tagging. Mol Cell. 2014;55:332–341. doi:10.1016/j.molcel.2014.06.003. PMID:25002142
- Lam SS, Martell JD, Kamer KJ, Deerinck TJ, Ellisman MH, Mootha VK, Ting AY. Directed evolution of APEX2 for electron microscopy and proximity labeling. Nat Methods. 2015;12:51–54. doi:10.1038/nmeth.3179. PMID:25419960
- Rhee HW, Zou P, Udeshi ND, Martell JD, Mootha VK, Carr SA, Ting AY. Proteomic mapping of mitochondria in living cells via spatially restricted enzymatic tagging. Science. 2013;339:1328–1331. doi:10.1126/science.1230593. PMID:23371551
- Krüger DM, Gohlke H. DrugScorePPI webserver: fast and accurate in silico alanine scanning for scoring protein-protein interactions. Nucleic Acids Res. 2010;38:W480–W486. doi:10.1093/nar/gkq471. PMID:20511591
- Moreira IS, Fernandes PA, Ramos MJ. Hot spots–a review of the protein-protein interface determinant amino-acid residues. Proteins. 2007;68:803–812. doi:10.1002/prot.21396. PMID:17546660
- Gohlke H, Kiel C, Case DA. Insights into protein-protein binding by binding free energy calculation and free energy decomposition for the Ras-Raf and Ras-RalGDS complexes. J Mol Biol. 2003;330:891–913. doi:10.1016/S0022-2836(03)00610-7. PMID:12850155
- Homeyer N, Gohlke H. Free energy calculations by the molecular mechanics Poisson-boltzmann surface area method. Mol Inform. 2012;31:114–122. doi:10.1002/minf.201100135. PMID:27476956
- Park JM, Jung CH, Seo M, Otto NM, Grunwald D, Kim KH, Moriarity B, Kim YM, Starker C, Nho RS, et al. The ULK1 complex mediates MTORC1 signaling to the autophagy initiation machinery via binding and phosphorylating ATG14. Autophagy. 2016;12:547–564. doi:10.1080/15548627.2016.1140293. PMID:27046250
- Choi H, Merceron C, Mangiavini L, Seifert EL, Schipani E, Shapiro IM, Risbud MV. Hypoxia promotes noncanonical autophagy in nucleus pulposus cells independent of MTOR and HIF1A signaling. Autophagy. 2016;12:1631–1646. doi:10.1080/15548627.2016.1192753. PMID:27314664
- Gao Y, Liu Y, Hong L, Yang Z, Cai X, Chen X, Fu Y, Lin Y, Wen W, Li S, et al. Golgi-associated LC3 lipidation requires V-ATPase in noncanonical autophagy. Cell Death Dis. 2016;7:e2330. doi:10.1038/cddis.2016.236. PMID:27512951
- Manzoni C, Mamais A, Roosen DA, Dihanich S, Soutar MP, Plun-Favreau H, Bandopadhyay R, Hardy J, Tooze SA, Cookson MR, et al. mTOR independent regulation of macroautophagy by Leucine Rich Repeat Kinase 2 via Beclin-1. Sci Rep. 2016;6:35106. doi:10.1038/srep35106. PMID:27731364
- Kang SA, Pacold ME, Cervantes CL, Lim D, Lou HJ, Ottina K, Gray NS, Turk BE, Yaffe MB, Sabatini DM. mTORC1 phosphorylation sites encode their sensitivity to starvation and rapamycin. Science. 2013;341:1236566. doi:10.1126/science.1236566. PMID:23888043
- Noda NN, Mizushima N. Atg101: Not just an accessory subunit in the Autophagy-initiation complex. Cell Struct Funct. 2016;41:13–20. doi:10.1247/csf.15013. PMID:26754330
- Reggiori F, Tucker KA, Stromhaug PE, Klionsky DJ. The Atg1-Atg13 complex regulates Atg9 and Atg23 retrieval transport from the pre-autophagosomal structure. Dev Cell. 2004;6:79–90. doi:10.1016/S1534-5807(03)00402-7. PMID:14723849
- Sekito T, Kawamata T, Ichikawa R, Suzuki K, Ohsumi Y. Atg17 recruits Atg9 to organize the pre-autophagosomal structure. Gen Cell. 2009;14:525–538. doi:10.1111/j.1365-2443.2009.01299.x. PMID:19371383
- Rao Y, Perna MG, Hofmann B, Beier V, Wollert T. The Atg1-kinase complex tethers Atg9-vesicles to initiate autophagy. Nat Commun. 2016;7:10338. doi:10.1038/ncomms10338. PMID:26753620
- Papinski D, Schuschnig M, Reiter W, Wilhelm L, Barnes CA, Maiolica A, Hansmann I, Pfaffenwimmer T, Kijanska M, Stoffel I, et al. Early steps in autophagy depend on direct phosphorylation of Atg9 by the Atg1 kinase. Mol Cell. 2014;53:471–483. doi:10.1016/j.molcel.2013.12.011. PMID:24440502
- Young AR, Chan EY, Hu XW, Kochl R, Crawshaw SG, High S, Hailey DW, Lippincott-Schwartz J, Tooze SA. Starvation and ULK1-dependent cycling of mammalian Atg9 between the TGN and endosomes. J Cell Sci. 2006;119:3888–3900. doi:10.1242/jcs.03172. PMID:16940348
- Mack HI, Zheng B, Asara JM, Thomas SM. AMPK-dependent phosphorylation of ULK1 regulates ATG9 localization. Autophagy. 2012;8:1197–1214. doi:10.4161/auto.20586. PMID:22932492
- Weerasekara VK, Panek DJ, Broadbent DG, Mortenson JB, Mathis AD, Logan GN, Prince JT, Thomson DM, Thompson JW, Andersen JL. Metabolic-stress-induced rearrangement of the 14-3-3zeta interactome promotes autophagy via a ULK1- and AMPK-regulated 14-3-3zeta interaction with phosphorylated Atg9. Mol Cell Biol. 2014;34:4379–4388. doi:10.1128/MCB.00740-14. PMID:25266655
- Karanasios E, Walker SA, Okkenhaug H, Manifava M, Hummel E, Zimmermann H, Ahmed Q, Domart MC, Collinson L, Ktistakis NT. Autophagy initiation by ULK complex assembly on ER tubulovesicular regions marked by ATG9 vesicles. Nat Commun. 2016;7:12420. doi:10.1038/ncomms12420. PMID:27510922
- Chen S, Wang C, Yeo S, Liang CC, Okamoto T, Sun S, Wen J, Guan JL. Distinct roles of autophagy-dependent and -independent functions of FIP200 revealed by generation and analysis of a mutant knock-in mouse model. Gen Dev. 2016;30:856–869. doi:10.1101/gad.276428.115. PMID:27013233
- Kraft C, Kijanska M, Kalie E, Siergiejuk E, Lee SS, Semplicio G, Stoffel I, Brezovich A, Verma M, Hansmann I, et al. Binding of the Atg1/ULK1 kinase to the ubiquitin-like protein Atg8 regulates autophagy. EMBO J. 2012;31:3691–3703. doi:10.1038/emboj.2012.225. PMID:22885598
- Nakatogawa H, Ohbayashi S, Sakoh-Nakatogawa M, Kakuta S, Suzuki SW, Kirisako H, Kondo-Kakuta C, Noda NN, Yamamoto H, Ohsumi Y. The autophagy-related protein kinase Atg1 interacts with the ubiquitin-like protein Atg8 via the Atg8 family interacting motif to facilitate autophagosome formation. J Biol Chem. 2012;287:28503–28507. doi:10.1074/jbc.C112.387514. PMID:22778255
- Okazaki N, Yan J, Yuasa S, Ueno T, Kominami E, Masuho Y, Koga H, Muramatsu M. Interaction of the Unc-51-like kinase and microtubule-associated protein light chain 3 related proteins in the brain: possible role of vesicular transport in axonal elongation. Brain Res Mol Brain Res. 2000;85:1–12. doi:10.1016/S0169-328X(00)00218-7. PMID:11146101
- Huang R, Xu Y, Wan W, Shou X, Qian J, You Z, Liu B, Chang C, Zhou T, Lippincott-Schwartz J, et al. Deacetylation of nuclear LC3 drives autophagy initiation under starvation. Mol Cell. 2015;57:456–466. doi:10.1016/j.molcel.2014.12.013. PMID:25601754
- Chano T, Ikegawa S, Kontani K, Okabe H, Baldini N, Saeki Y. Identification of RB1CC1, a novel human gene that can induce RB1 in various human cells. Oncogene. 2002;21:1295–1298. doi:10.1038/sj.onc.1205178. PMID:11850849
- Joshi A, Iyengar R, Joo JH, Li-Harms XJ, Wright C, Marino R, Winborn BJ, Phillips A, Temirov J, Sciarretta S, et al. Nuclear ULK1 promotes cell death in response to oxidative stress through PARP1. Cell Death Differ. 2016;23:216–230. doi:10.1038/cdd.2015.88. PMID:26138443
- Shin SH, Lee EJ, Chun J, Hyun S, Kang SS. ULK2 Ser 1027 phosphorylation by PKA regulates its nuclear localization occurring through karyopherin beta 2 recognition of a PY-NLS motif. PLoS One. 2015;10:e0127784. doi:10.1371/journal.pone.0127784. PMID:26052940
- Egan DF, Chun MG, Vamos M, Zou H, Rong J, Miller CJ, Lou HJ, Raveendra-Panickar D, Yang CC, Sheffler DJ, et al. Small molecule inhibition of the autophagy kinase ULK1 and identification of ULK1 substrates. Mol Cell. 2015;59:285–297. doi:10.1016/j.molcel.2015.05.031. PMID:26118643
- Lazarus MB, Novotny CJ, Shokat KM. Structure of the human autophagy initiating kinase ULK1 in complex with potent inhibitors. ACS Chem Biol. 2015;10:257–261. doi:10.1021/cb500835z. PMID:25551253
- Lazarus MB, Shokat KM. Discovery and structure of a new inhibitor scaffold of the autophagy initiating kinase ULK1. Bioorg Med Chem. 2015;23:5483–5488. doi:10.1016/j.bmc.2015.07.034. PMID:26275681
- Petherick KJ, Conway OJ, Mpamhanga C, Osborne SA, Kamal A, Saxty B, Ganley IG. Pharmacological inhibition of ULK1 kinase blocks mammalian target of rapamycin (mTOR)-dependent autophagy. J Biol Chem. 2015;290:11376–11383. doi:10.1074/jbc.C114.627778. PMID:25833948
- Schindelin J, Arganda-Carreras I, Frise E, Kaynig V, Longair M, Pietzsch T, Preibisch S, Rueden C, Saalfeld S, Schmid B, et al. Fiji: an open-source platform for biological-image analysis. Nat Methods. 2012;9:676–682. doi:10.1038/nmeth.2019. PMID:22743772
- Engelke M, Pirkuliyeva S, Kuhn J, Wong L, Boyken J, Herrmann N, Becker S, Griesinger C, Wienands J. Macromolecular assembly of the adaptor SLP-65 at intracellular vesicles in resting B cells. Sci Signal. 2014;7:ra79. doi:10.1126/scitranslmed.2005104. PMID:25140054
- Li MZ, Elledge SJ. Harnessing homologous recombination in vitro to generate recombinant DNA via SLIC. Nat Methods. 2007;4:251–256. doi:10.1038/nmeth1010. PMID:17293868
- Sastry GM, Adzhigirey M, Day T, Annabhimoju R, Sherman W. Protein and ligand preparation: parameters, protocols, and influence on virtual screening enrichments. J Comput Aided Mol Des. 2013;27:221–234. doi:10.1007/s10822-013-9644-8. PMID:23579614
- Ciglia E, Vergin J, Reimann S, Smits SH, Schmitt L, Groth G, Gohlke H. Resolving hot spots in the C-terminal dimerization domain that determine the stability of the molecular chaperone Hsp90. PLoS One. 2014;9:e96031. doi:10.1371/journal.pone.0096031. PMID:24760083