
ABSTRACT
Macroautophagy/autophagy is an evolutionarily conserved pathway that is required for cellular homeostasis, growth and survival. The lysosome plays an essential role in autophagy regulation. For example, the activity of MTORC1, a master regulator of autophagy, is regulated by nutrients within the lysosome. Starvation inhibits MTORC1 causing autophagy induction. Given that MTORC1 is critical for protein synthesis and cellular homeostasis, a feedback regulatory mechanism must exist to restore MTORC1 during starvation. However, the molecular mechanism underlying this feedback regulation is unclear. In this study, we report that starvation activates the lysosomal Ca2+ release channel MCOLN1 (mucolipin 1) by relieving MTORC1's inhibition of the channel. Activated MCOLN1 in turn facilitates MTORC1 activity that requires CALM (calmodulin). Moreover, both MCOLN1 and CALM are necessary for MTORC1 reactivation during prolonged starvation. Our data suggest that lysosomal Ca2+ signaling is an essential component of the canonical MTORC1-dependent autophagy pathway and MCOLN1 provides a negative feedback regulation of MTORC1 to prevent excessive loss of MTORC1 function during starvation. The feedback regulation may be important for maintaining cellular homeostasis during starvation, as well as many other stressful or disease conditions.
INTRODUCTION
Macroautophagy (hereafter referred to as autophagy) is an evolutionarily conserved cellular process in which cells degrade their own organelles to generate energy and nutrients. During this process, targeted cytoplasmic constituents are isolated from the rest of the cell within a double-membraned compartment known as the autophagosome. The autophagosome then fuses with the lysosome to form the autolysosome where the cargos are degraded and recycled. Autophagy is not only an important housekeeping degradative process involved in cell growth, cell proliferation, tissue homeostasis and development, but also a cellular adaptation process that is essential for cell survival when nutrients or energy are limited.Citation1–Citation5
The lysosome plays an essential role in sensing and signaling cellular nutrient status by recruiting MTORC1 (mechanistic target of rapamycin complex 1), a ubiquitous protein kinase acting as a master regulator of autophagy. Interestingly, MTORC1 is stimulated by amino acids through an inside-out mechanism in which amino acids must accumulate in the lysosomal lumen to initiate signaling.Citation6 This process requires the vacuolar-type H+-translocating ATPase (V-ATPase), Ragulator and RRAG/Rag GTPases. V-ATPase interacts with the Ragulator that anchors the RRAG-MTORC1 complex to the lysosome. At rest, MTORC1 is localized on the lysosomal membrane where it is activated by lumenal amino acids. Starvation leads to MTORC1 dissociation from the lysosome and subsequent inhibition of MTORC1, triggering autophagy. Because MTORC1 is critically required for protein synthesis and cellular homeostasis, continuous loss of MTORC1 activity will damage the cell.Citation7,Citation8 Therefore, a feedback regulatory mechanism must exist to restore MTORC1 activity to survive stress conditions, in particular for prolonged starvation. However, the temporal feedback regulatory mechanism is unclear.
Intracellular Ca2+ signaling has recently been recognized as an important player in the regulation of MTORC1 and autophagy, although its exact role remains a matter of debate.Citation9–Citation12 Given that MTORC1 must be recruited to the surface of lysosomes to be activated,Citation6 it is interesting to test whether lysosomal Ca2+ regulates MTORC1 and autophagy. In this study, we systematically examined the role of mammalian MCOLN1 (mucolipin 1), an important lysosomal Ca2+ release channel in MTORC1 regulation. We have demonstrated that MCOLN1 is essential for MTORC1 recruitment and activation in a Ca2+-CALM (calmodulin)-dependent manner. We have also provided direct evidence showing that starvation activates MCOLN1 through relieving the inhibition of MTORC1 on MCOLN1. Thus, we suggest that during starvation MCOLN1-CALM and MTORC1 form a feedback loop in which MTORC1 inhibition leads to MCOLN1-CALM activation, and this in turn reactivates MTORC1. This feedback mechanism prevents MTORC1 from excess reduction of activity, a cellular adaptation mechanism that helps cells survive extreme conditions.
RESULTS
MCOLN1 promotes MTORC1 activity in lysosomes
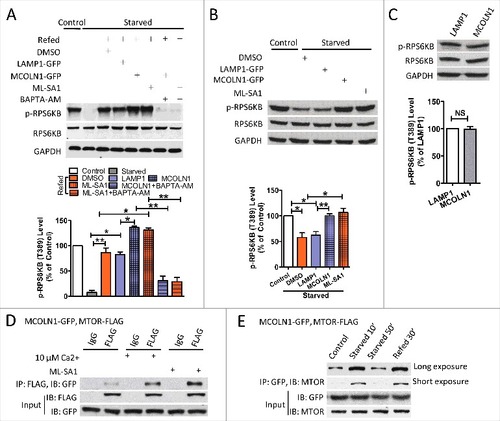
Because Ca2+ is required for MTORC1 activation occurring on the lysosomal membraneCitation6,Citation10 and because MCOLN1 is an important Ca2+ release channel on the lysosomal membrane,Citation13,Citation14 we hypothesized that MCOLN1 regulates MTORC1 activity. To test this, MCOLN1 was upregulated by MCOLN1-GFP overexpression or mucolipin synthetic agonist 1 (ML-SA1, 15 μM).Citation15,Citation16 MTORC1 activity was assessed by measuring the phosphorylation of the substrate RPS6KB/p70-S6 kinase. To detect the potentiation effect of MCOLN1 on MTORC1, we first starved cells for 50 min to decrease MTORC1 and then reactivated MTORC1 by refeeding cells.Citation6 Different starvation conditions have been used to study the MTORC1 signaling pathway, including complete nutrient deprivation, amino acid depletion, growth factor deprivation, and a milder but more physiological starvation.Citation17–Citation23 Our preliminary data suggested that MCOLN1 upregulation increased MTORC1 activity when complete nutrient deprivation (HBSS), amino acid depletion (DMEM without amino acid), or milder (HBSS or amino acid-free DMEM containing 1% fetal bovine serum [FBS]) conditions were applied (Fig. S1). To mimic physiological conditions, we adopted the milder starvation protocol (HBSS + 1% FBS).Citation17–Citation23 As shown in A, MTORC1 activity was increased by either MCOLN1 overexpression or ML-SA1 (15 μM) treatment in HEK293T cells, and this was inhibited by BAPTA-AM (10 μM). These data suggest that MCOLN1 regulates MTORC1 via releasing lysosomal Ca2+. To consolidate our conclusion, we tested whether upregulating MCOLN1 prevented MTORC1 inactivation. For this purpose, 30 min starvation was applied to ensure the presence of substantial amounts of MTORC1 on the lysosomal membrane where it is activated by MCOLN1. Consistently, in HEK293T cells, MCOLN1 overexpression or ML-SA1 (15 μM) treatment also prohibited the loss of MTORC1 activity upon starvation (B). Interestingly, under normal conditions, MCOLN1 upregulation (C) did not affect MTORC1 activity. This is consistent with previous reports showing that activating MCOLN1 does not change MTORC1 activity.Citation24,Citation25
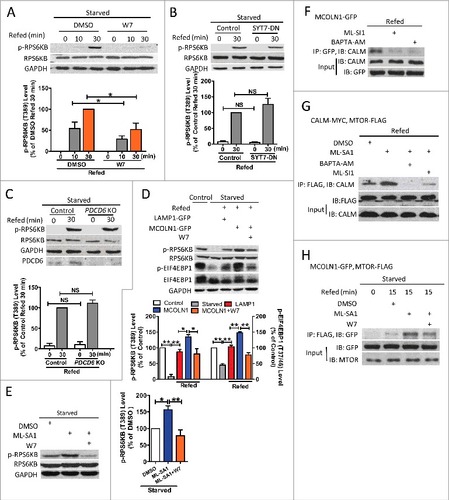
Figure 1. MCOLN1 promotes MTORC1 activation. (A) Upregulation of MCOLN1 promotes MTORC1 reactivation during refeeding, and this was inhibited by BAPTA-AM. HEK293T cells transfected with or without LAMP1-GFP, or MCOLN1-GFP were kept in normal culture medium, starved for 50 min or followed by nutrient refeeding for 15 min ± ML-SA1 (15 µM) and/or BAPTA-AM (10 µM) as indicated. Cell extracts were analyzed by western blotting using anti-p-RPS6KB (T389) and anti-RPS6KB antibodies, and anti-GAPDH antibody was used as a loading control. Histograms represent the mean percentage of the ratio of p-RPS6KB:RPS6KB (mean ± SEM, n = 3 independent experiments) in the indicated conditions, relative to that of the control. (B) Upregulation of MCOLN1 prohibited the loss of MTORC1 activity upon starvation. HEK293T cells transfected with or without LAMP1-GFP, or MCOLN1-GFP were starved for 30 min ± ML-SA1 (15 µM). Histograms represent the mean percentage of the ratio of p-RPS6KB:RPS6KB (mean ± SEM, n = 3 independent experiments) in the indicated conditions, relative to that of the control. (C) MCOLN1 overexpression did not alter MTORC1 activity under normal conditions. HEK293T cells were transfected with either LAMP1-GFP or MCOLN1-GFP. MTORC1 activity was examined after the cells were cultured for 2–4 h in fresh culture medium. Histograms represent the mean percentage of the ratio of p-RPS6KB:RPS6KB (mean ± SEM, n = 3 independent experiments) in the indicated conditions, relative to that of LAMP1-expressing cells. (D) Co-IP of MCOLN1 and MTORC1. HeLa cells expressing MCOLN1-GFP and MTOR-FLAG were kept in normal culture medium. Cell extracts were subject to FLAG or IgG immunoprecipitation ± ML-SA1 (15 µM) or 10 µM Ca2+ and analyzed by western blotting for the indicated proteins. Note that culture medium was not changed before the co-IP experiments. (E) The association of MCOLN1 and MTORC1 is regulated by starvation. Short-term (10 min) starvation increased the association between MCOLN1 and MTORC1, and this was suppressed by long-term (50 min) starvation. Nutrient refeeding also increases the association between MCOLN1 and MTORC1. HEK293T cells expressing MCOLN1-GFP and MTOR-FLAG were kept in fresh culture medium, starved for 10 min and 50 min, or starved for 50 min followed by 30 min refeeding. NS, not significant; *, P < 0.05; **, P < 0.01.
Because MCOLN1 has been suggested to regulate the fusion of autophagosomes with lysosomesCitation26 and subsequent protein degradation,Citation27–Citation29 an increase in MTORC1 activity could be attributed to an elevated nutrient regeneration, which is required for the reactivation of MTORC1. To test this, we examined whether activation of MCOLN1 promotes autophagosome-lysosome fusion. Autophagosome-lysosome fusion was studied using tandem mRFP-EGFP-LC3.Citation25,Citation30,Citation31 Because the low pH of autolysosomes quenches the fluorescent signal of EGFP but not mRFP, autophagosomes (high pH) and autolysosomes (low pH) will be labeled with yellow (i.e., mRFP+ EGFP+) and red (i.e., mRFP+ EGFP−) signals, respectively. An increase in the ratio of yellow to red puncta represents a blockade of autophagosome and lysosome fusion. We found that MCOLN1 upregulation inhibited autophagosome and lysosome fusion (Fig. S2A-S2C). This is in agreement with previous studies showing that MCOLN1 activation inhibits autophagosome-lysosome fusion.Citation25 The mechanism underlying MCOLN1 inhibiting autophagosome-lysosome fusion remains a fascinating question to be investigated. Altogether, we suggest that MCOLN1 facilitates MTORC1 activation likely through a mechanism independent of nutrient regeneration.
To further support our hypothesis, we investigated the physical association between MCOLN1 and MTORC1 using co-immunoprecipitation (co-IP) in HeLa cells transfected with MCOLN1-GFP and MTOR-FLAG. We found that MCOLN1 weakly associated with MTORC1 (D), and this was dramatically increased by Ca2+ (10 μM) application and by activating MCOLN1 with ML-SA1 (15 μM) (D). Unfortunately, the unavailability of MCOLN1 antibody precluded us from assessing the interaction of endogenous MCOLN1 and MTORC1. These data suggest that MCOLN1 and MTORC1 form a signaling complex on the lysosomal membrane when MCOLN1 is activated. Interestingly, the association between MCOLN1 and MTORC1 was also regulated by nutrient availability. Weak association between MCOLN1 and MTORC132 was increased by short-term starvation (10 min) but not long-term starvation (50 min) (E). These data suggest that starvation may activate MCOLN1.Citation33– Citation34 to increase its association with MTORC1,Citation35 whereas long-term or strong starvation likely causes MTORC1 dissociation from the lysosome, thereby decreasing the interaction between MCOLN1 and MTORC1.
MCOLN1 is required for MTORC1 activation in lysosomes
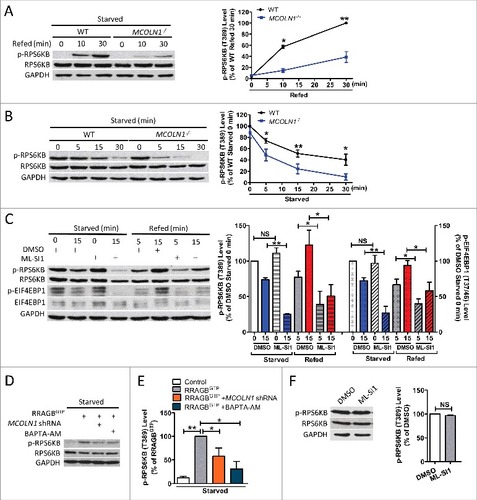
If MCOLN1 is important for MTORC1 activation, deletion of MCOLN1 will lead to a decrease in MTORC1 activity. Indeed, MTORC1 reactivation was compromised by MCOLN1 ablation in human skin fibroblasts (A). Supporting this, starvation suppressed MTORC1 activity more easily in MCOLN1−/− human fibroblasts (B). In the meantime, inhibiting MCOLN1 using ML-SI1 (50 μM)Citation16 suppressed MTORC1 activity upon starvation. MTORC1 reactivation induced by nutrient refeeding was also dramatically suppressed by ML-SI1 in HEK293T cells (C). Supporting the notion that MCOLN1-mediated Ca2+ release is required for MTORC1 activity, we found that MTORC1 reactivation upon nutrient refeeding was suppressed by BAPTA-AM treatment (Fig. S3). In addition, in the presence of RRAGBGTP, a GTP-bound mutant which partially mimics amino acid-replete conditions,Citation32,Citation36 MCOLN1 deletion or BAPTA-AM still reduced MTORC1 activity in starved cells (D,E). These data further suggest that MCOLN1 regulates MTORC1 activity through a mechanism independent of nutrient regeneration. In agreement with the finding showing that MCOLN1 upregulation did not alter MTORC1 activity under normal conditions (C),Citation24 neither MCOLN1 ablation (B) nor inhibition (F) affected MTORC1 activity under normal conditions. Note that MTORC1 activity was assessed by measuring the phosphorylation of RPS6KB and EIF4EBP1, another MTORC1 substrate (C). Altogether, these data suggest that MCOLN1 is required for MTORC1 activation when cells are stressed.
Figure 2. MCOLN1 is required for MTORC1 activation. (A) MCOLN1 ablation compromised MTORC1 reactivation during nutrient refeeding. WT and MCOLN1−/− human skin fibroblasts were starved for 50 min or followed by nutrient refeeding for 10 or 30 min as indicated. Cell extracts were analyzed by western blotting for the indicated proteins. The graph illustrates the mean percentage of the ratio of p-RPS6KB:RPS6KB (mean ± SEM, n = 3 independent experiments), relative to that in WT cells with 30 min refeeding. (B) MCOLN1−/− cells lose MTORC1 activity more easily compared with WT cells when starved. WT and MCOLN1−/− cells were kept in normal culture medium or starved for 5, 15 or 30 min. Cell extracts were analyzed by western blotting for the indicated proteins. The graph shows the mean percentage of the ratio of p-RPS6KB:RPS6KB (mean ± SEM, n = 3 independent experiments), relative to that in fed WT cells. (C) Inhibition of MCOLN1 suppressed MTORC1 activity upon starvation and nutrient refeeding. HEK293T cells were kept in normal culture medium, starved for 15 min, or starved for 50 min followed by nutrient refeeding for 5 or 15 min ± ML-SI1 (50 µM) as indicated. MTORC1 activity was assessed by measuring p-RPS6KB (T389) and p-EIF4EBP1 (T37/46) using western blot. The graph shows the mean percentage of the ratio of p-RPS6KB:RPS6KB (left) and p-EIF4EBP1:EIF4EBP1 (right) (mean ± SEM, n = 3 independent experiments), relative to that in nontreated fed cells. (D, E) High MTORC1 activity in cells expressing constitutively active RRAGB, which partially mimics nutrient-replete conditions was suppressed by MCOLN1 deletion and BAPTA-AM. HEK293T cells were transfected with RRAGBGTP or together with scramble or MCOLN1 shRNA; 24 h later cells were starved with amino acid-free DMEM for 30 min in the presence or absence of 10 μM BAPTA-AM. (F) MCOLN1 inhibition did not alter MTORC1 activity under normal conditions. HEK293T cells were treated with DMSO or ML-SI1 (50 μM) for 1 h in normal medium. The graph illustrates the mean percentage of the ratio of p-RPS6KB:RPS6KB (mean ± SEM, n = 3 independent experiments), relative to that in DMSO-treated cells. NS, not significant; *, P < 0.05; **, P < 0.01.
MCOLN1 regulates MTORC1 depending on the culture conditions
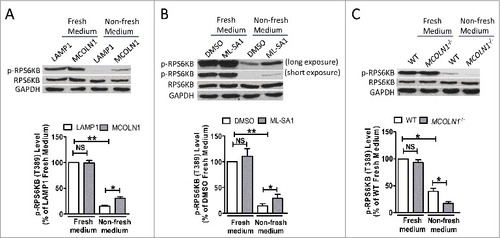
Recently, Li et al. reported that MCOLN1 but not other lysosomal channels, such as TPCN2 and P2RX4, regulate MTORC1 under normal conditions.Citation35 However, our data suggest that MCOLN1 regulates MTORC1 only under starvation but not normal fed conditions (, ).Citation24 To clarify this controversy, we repeated Li et al.’s experiment by carefully controlling the cell culture conditions. We suspected that the cells in Li et al.’s study were also under starvation conditions because Li et al. measured MTORC1 activity after 24 h culture without changing the medium.Citation35 Indeed, we found that neither MCOLN1 overexpression nor ML-SA1 affected MTORC1 activity under normal fed conditions. In contrast, both MCOLN1 overexpression and ML-SA1 increased MTORC1 activity when nonfresh medium was replaced after overnight culture (A,B). Consistently, MCOLN1 deletion compromised MTORC1 activity when cells were incubated in nonfresh culture medium but not in normal fed conditions (C). Altogether, these data further suggest that MCOLN1 regulates MTORC1 specifically when cells encounter nutrient shortage.
Figure 3. MTORC1 activity is regulated by culture medium conditions. (A) HEK293T cells were transfected with LAMP1-GFP or MCOLN1-GFP for 24 h, and then the culture medium was either changed to fresh complete medium for 2 h (fresh medium) or kept unchanged (nonfresh medium) before measuring MTORC1. MCOLN1 overexpression increased MTORC1 activity in cells incubated in nonfresh medium but not in fresh medium. Histograms represent the mean percentage of the ratio of p-RPS6KB:RPS6KB (mean ± SEM, n = 3 independent experiments) in the indicated conditions, relative to that of fed cells expressing LAMP1. (B) Cells were cultured for 24 h, and then treated with ML-SA1 (10 μM) for 3 h in fresh or nonfresh medium. Histograms represent the mean percentage of the ratio of p-RPS6KB:RPS6KB (mean ± SEM, n = 3 independent experiments) in the indicated conditions, relative to that of fed cells treated with DMSO. (C) WT and MCOLN1−/− human skin fibroblasts were cultured for 24 h, and then incubated in fresh or nonfresh medium for 2 h. Histograms represent the mean percentage of the ratio of p-RPS6KB:RPS6KB (mean ± SEM, n = 3 independent experiments) in the indicated conditions, relative to that of WT fed cells. NS, not significant; *, P < 0.05; **, P < 0.01.
MCOLN1 and Ca2+-dependent MTORC1 recruitment onto lysosomes
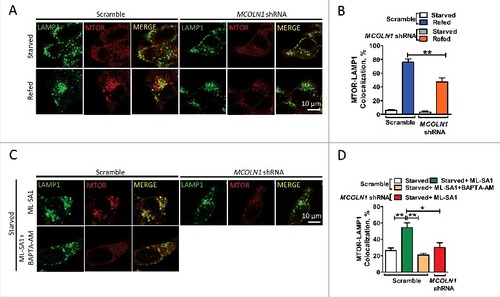
Nutrient deprivation results in the dissociation of MTORC1 from lysosomes, whereas nutrient replenishment restores lysosomal localization of MTORC1 and its activity.Citation17,Citation36-Citation40 Given that MCOLN1 is important for MTORC1 activation, we postulated that MCOLN1 regulates MTORC1 recruitment onto lysosomes. To test this, we acutely ablated MCOLN1 in HEK293T cells using MCOLN1 shRNA-expressing lentivirus (Fig. S4), and tested whether MCOLN1 is required for lysosomal MTOR recruitment. HEK293T cells were first starved for 60 min to completely diffuse MTOR and then refed with nutrients for 10 min.Citation6 Under starvation, MTOR normally failed to cluster onto lysosomes and instead was found in a diffuse staining pattern as shown in A and B. Interestingly, refeeding nutrients resulted in a significant increase in lysosomal MTOR puncta in control but not in MCOLN1 knockdown cells (A,B). Supporting this, ML-SA1 (15 μM) prevented starvation from dispersing MTOR in control but not MCOLN1 knockdown cells, and this was eliminated by chelating Ca2+ using BAPTA-AM (10 μM) (C,D). Consistently, in human fibroblasts, loss of MCOLN1 prevented MTOR recruitment onto lysosomes (Fig. S5A,B) in response to refeeding, and ML-SA1 (15 μM) prevented starvation from causing dispersal of MTOR from lysosomes (Fig. S5C,D). Conversely, neither MCOLN1 knockdown (Fig. S6A,B) nor MCOLN1 deletion (Fig. S6C,D) affected lysosomal localization of MTOR under normal conditions. This is in agreement with the data showing that MCOLN1 was not required for MTORC1 activation under normal conditions (C, B,F). Collectively, these data suggest that MCOLN1-mediated Ca2+ release is specifically required for lysosomal localization of MTORC1 under stress but not normal conditions. This finding is also in agreement with the data showing that MCOLN1 was weakly associated with MTORC1 (D,E) and minimally active under normal fed conditions.
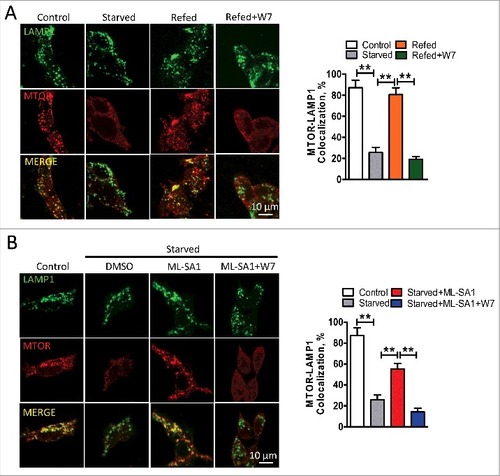
Figure 4. MCOLN1 regulates MTOR lysosome recruitment. (A) In the MCOLN1 knockdown HEK293T cell line that was generated with lentivirus carrying shRNA against MCOLN1, a decrease in MCOLN1 suppressed MTOR recruitment onto lysosomes. Scramble and MCOLN1 shRNA knockdown HEK293T cells were starved for 1 h followed by nutrient refeeding for 10 min. Cells were then fixed and immunostained with antibodies against LAMP1 and MTOR. (B) The percentage of colocalization between LAMP1 and MTOR as in (A). (C) Upregulation of MCOLN1 by ML-SA1 prohibited MTOR dissociation from lysosomes in control but not MCOLN1-deficient cells. This was blocked by BAPTA-AM. Scramble and MCOLN1 shRNA knockdown HEK293T cells were starved for 50 min in the presence of ML-SA1 (15 µM) ± BAPTA-AM (10 µM) as indicated. (D) The percentage of colocalization between LAMP1 and MTOR as in (C). More than 20 cells were analyzed for each condition in 3 independent experiments. NS, not significant; **, P < 0.01.
MCOLN1 activates MTORC1 through CALM
To understand how MCOLN1 recruits and activates MTORC1, we searched for Ca2+ sensor proteins that have been reported to be localized in the lysosomal membrane, including SYT7,Citation41 PDCD6/ALG2 (programmed cell death 6),Citation42 and CALM.Citation43,Citation44 We first evaluated whether these proteins are required for MTORC1 activation. We found that inhibition of CALM with W7 (3 μM), but not expression of the dominant negative mutant SYT7 (SYT7-DN)Citation45 or PDCD6 deletionCitation46 caused a reduction in MTORC1 activity (A-C and Fig. S7). We also observed that an increase in MTORC1 activity induced by MCOLN1 overexpression (D) or ML-SA1 (15 μM) (E) was inhibited by W7 (3 μM).
Figure 5. MCOLN1 activates MTORC1 through CALM. (A) W7 prevented MTORC1 reactivation during refeeding. HEK293T cells were starved for 50 min or followed by nutrient refeeding for 10 or 30 min ± W7 (3 µM) as indicated. Cell extracts were analyzed by western blotting using anti-p-RPS6KB (T389) and anti-RPS6KB antibodies, and anti-GAPDH antibody was used as a loading control. Histograms represent the mean percentage of the ratio of p-RPS6KB:RPS6KB (mean ± SEM, n = 3 independent experiments) in the indicated conditions, relative to that of cells with 30 min refeeding. (B) SYT7-DN had no effect on MTORC1 reactivation during refeeding. HEK293T cells transfected with or without a dominant negative form of SYT7 (SYT-DN) were starved for 50 min or followed by nutrient refeeding for 30 min. Histograms represent the mean percentage of the ratio of p-RPS6KB:RPS6KB (mean ± SEM, n = 3 independent experiments) in the indicated conditions, relative to that of cells with 30 min refeeding. (C) PDCD6 knockout did not influence MTORC1 reactivation during refeeding. Control HEK293T cells or cells with PDCD6 knockout were starved for 50 min or followed by nutrient refeeding for 30 min. Histograms represent the mean percentage of the ratio of p-RPS6KB/RPS6KB (mean ± SEM, n = 3 independent experiments) in the indicated conditions, relative to that of cells with 30 min refeeding. (D) The increased MTORC1 activity induced by MCOLN1 overexpression was inhibited by W7. HEK293T cells transfected with or without MCOLN1-GFP were kept in normal culture medium, starved for 50 min or followed by nutrient refeeding for 30 min ± W7 (3 µM) as indicated. MTORC1 activity was assessed by measuring RPS6KB (T389) and p-EIF4EBP1 (T37/46) using western blot. Histograms represent the mean percentage of the ratio of p-RPS6KB:RPS6KB (left) and p-EIF4EBP1:EIF4EBP1 (right) (mean ± SEM, n = 3 independent experiments) in the indicated conditions, relative to the control. (E) W7 inhibited the ML-SA1-induced increase of MTORC1 activity during starvation. HEK293T cells were starved for 15 min ± ML-SA1 (15 µM) with or without W7 (3 µM) as indicated, and then lysed and subjected to immunoblotting. Histograms represent the mean percentage of the ratio of p-RPS6KB:RPS6KB (mean ± SEM, n = 3 independent experiments) in the indicated conditions, relative to that of cells without treatment. (F) Co-IP of MCOLN1 and CALM. The interaction between MCOLN1 and CALM was inhibited by ML-SI1 or BAPTA-AM. HEK293T cells expressing MCOLN1-GFP were starved for 50 min followed by nutrient refeeding for 30 min ± ML-SI1 (50 µM) or BAPTA-AM (10 µM) as indicated. Cell extracts were subject to GFP immunoprecipitation and analyzed by western blotting for the indicated proteins. (G) Co-IP of CALM and MTORC1. The interaction between CALM and MTORC1 during refeeding was enhanced by activating MCOLN1 with ML-SA1, and this was eliminated by BAPTA-AM or ML-SI1. HEK293T cells expressing CALM-MYC-HIS and MTOR-FLAG were starved for 50 min followed by nutrient refeeding for 15 min ± ML-SA1 (15 µM), BAPTA-AM (10 µM) or ML-SI1 (50 µM) as indicated. Cell extracts were subject to FLAG immunoprecipitation and analyzed by western blotting for the indicated proteins. (H) Co-IP of MCOLN1 and MTORC1. During nutrient refeeding, the ML-SA1-induced increase in the interaction between MCOLN1 and MTORC1 was inhibited by W7. HEK293T cells expressing MCOLN1-GFP and MTOR-FLAG were starved for 50 min, or followed by nutrient refeeding for 15 min ± ML-SA1 (15 µM) with or without W7 (3 µM) as indicated. Cell extracts were subject to FLAG immunoprecipitation and analyzed by western blotting for the indicated proteins. NS, not significant; *, P < 0.05; **, P < 0.01.
In accordance with this, MCOLN1 and CALM were strongly associated and this association was eliminated by inhibiting MCOLN1 with ML-SI1 (50 µM) or chelating Ca2+ with BAPTA-AM (10 µM) (F). We also detected association between MTORC1 and CALM, and this was increased by activating MCOLN1 with ML-SA1 (15 μM), but suppressed by chelating Ca2+ using BAPTA-AM (10 μM) or inhibiting MCOLN1 with ML-SI1 (50 μM) (G). In addition, the interaction between MCOLN1 and MTORC1 was increased by ML-SA1 (15 μM) and this was inhibited by W7 (3 μM) (H). Altogether, these data suggest that MCOLN1, CALM and MTORC1 form a macromolecular complex on the lysosomal membrane where MCOLN1 releases lysosome Ca2+ to activate CALM and subsequently regulate MTORC1 activity.
CALM is required for MTORC1 recruitment
Data presented above suggest that CALM may also regulate MTORC1 recruitment. In agreement with this, inhibiting CALM with W7 (3 μM) suppressed lysosomal MTOR recruitment in HEK293T cells (A). Consistently, in the presence of W7, ML-SA1 (15 μM) failed to prohibit starvation from inducing dissociation of MTOR from lysosomes (B). These data suggest that CALM may function downstream of MCOLN1 to regulate MTORC1 recruitment.
Figure 6. MCOLN1 regulates MTOR recruitment onto lysosomes through CALM. (A) Inhibiting CALM by W7 prohibited MTOR recruitment induced by nutrient refeeding. HEK293T cells were starved for 50 min, followed by nutrient refeeding for 10 or 15 min ± W7 (3 µM) as indicated. The data was expressed as a percentage of colocalization between LAMP1 and MTOR. (B) W7 eliminated the effect of ML-SA1 on preventing MTOR dissociation from lysosomes. HEK293T cells were kept in normal culture medium, or starved for 50 min ± W7 (3 µM) and/or ML-SA1 (15 µM) as indicated. The data are expressed as a percentage of colocalization between LAMP1 and MTOR. More than 20 cells were analyzed for each condition in 3 independent experiments. **, P < 0.01.
MTORC1-dependent MCOLN1 activation by starvation
Recent studies have suggested that nutrient deprivation increases MCOLN1 expression via TFEB (transcription factor EB) that is activated by MCOLN1-mediated Ca2+ release.Citation47,Citation48 However, the molecular mechanism underlying the initial MCOLN1 activation upon starvation is unknown, especially considering that transient starvation has been shown to activate MCOLN1-mediated Ca2+ release.Citation47 Because MCOLN1 is suppressed by MTORC1 via direct phosphorylation,Citation33 we tested whether nutrient starvation inhibited MTORC1 to release the suppression of MCOLN1 by MTORC1. RRAG are widely known to regulate MTORC1 signaling.Citation36 Expression of RRAGBGTP displayed a high level of MTORC1 activity in starved cells, whereas expression of RRAGBGDP, a GDP-bound RRAG mutant, suppressed MTORC1 activity in refed cells following starvation (Fig. S8).Citation32,Citation36 Therefore, HEK293T cells expressing genetically encoded calcium indicator for optical imaging (GECO)-MCOLN1 together with RRAGBGDP or RRAGBGTP (RRAGBWT as control) were employed to identify the influence of MTORC1 on MCOLN1. MCOLN1-mediated lysosomal Ca2+ release was monitored by measuring ML-SA1 (10 µM)-mediated GECO-MCOLN1 response as previously reported.Citation45 As expected, nutrient starvation induced an increase in GECO-MCOLN1 response, which was reversed by nutrient refeeding (A,B). Expression of RRAGBGTP decreased GECO-MCOLN1 response in starved cells, whereas expression of RRAGBGDP increased GECO-MCOLN1 response in refed cells (E). In agreement with this, pretreatment with AZD8055 (1 µM, 30 min), a potent MTOR inhibitor,Citation49 enhanced the ML-SA1-evoked GECO-MCOLN1 response (Fig. S9). Notably, neither treatments affect the GECO-MCOLN1 response to glycyl-phenylalanine 2-naphthylamide (GPN, 200 μM), a substrate of the lysosomal exopeptidase CTSC (cathepsin C) that induces lysosome osmolysis to dump all Ca2+ out, or ionomycin (2 µM, with 2 mM Ca2+ in the bath), suggesting that they do not affect lysosomal Ca2+ content or MCOLN1 expression (F,G).Citation45 To directly test whether MTORC1 inhibition activates MCOLN1, GECO-MCOLN1 signals were monitored upon acute AZD8055 application. As shown in H-J, AZD8055 treatment induced ‘transient’ MCOLN1 activation. This is consistent with a previous report that starvation activates MCOLN1.Citation47 Altogether, we suggest that starvation continuously activates MCOLN1 to retain MTORC1 on the lysosome and to maintain MTORC1 activity.
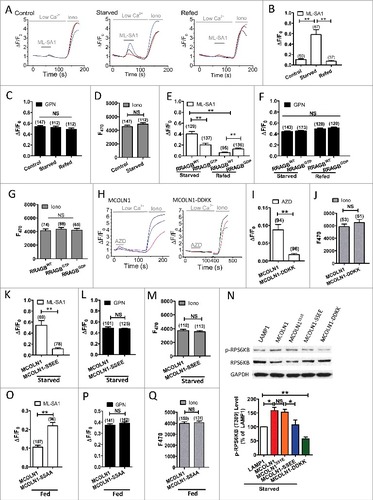
Figure 7. MTORC1-dependent regulation of MCOLN1-mediated lysosomal Ca2+ release. (A) Starvation increased MCOLN1 activity as indicated by elevated GECO-MCOLN1 responses to ML-SA1 in HEK293T cells expressing GECO-MCOLN1. Cells were kept in normal culture medium, starved for 50 min or followed by nutrient refeeding for 15 min prior to the measurement. (B) Summary of ML-SA1-induced GECO-MCOLN1 responses as in (A). (C, D) Starvation or refeeding did not affect GECO-MCOLN1 response to GPN (200 µM) (C) or ionomycin (Iono, 2 µM) (D). (E) RRAGBGTP decreased GECO-MCOLN1 responses in starved cells, whereas RRAGBGDP increased GECO-MCOLN1 responses in refeeding cells. HEK293T cells expressing GECO-MCOLN1 and RRAGBWT together with RRAGBGTP or RRAGBGDPwere subjected to starvation, or nutrient refeeding (DMEM + 10% FBS, 15 min). (F, G) GECO-MCOLN1 response to GPN (200 µM) (F) and Ionomycin (2 µM) (G) was comparable to conditions in (E). (H-J) Inhibition of MTOR with AZD8055 (1 µM) induced GECO responses in HEK293T cells expressing GECO-MCOLN1 but not GECO-MCOLN1-DDKK, a nonconducting mutant of MCOLN1. GECO signals were measured in the absence of external Ca2+. GECO responses to ionomycin (2 µM, with 2 mM Ca2+ in the bath) was used to compare the expression levels of GECO-MCOLN1 and GECO-MCOLN1-DDKK. (K) S571,576E phosphomimetic mutation of GECO-MCOLN1 (GECO-MCOLN1-SSEE) decreased ML-SA1-induced GECO responses upon starvation compared to GECO-MCOLN1. HEK293T cells expressing GECO-MCOLN1 and GECO-MCOLN1-SSEE, respectively, were subjected to starvation (50 min) prior to the measurement. (L, M) GECO-MCOLN1 response to GPN (200 µM) (I) or ionomycin (2 µM) (M) was comparable in conditions as in (H). (N) WT MCOLN1 but not MCOLN1-SSEE and MCOLN1-DDKK increased MTORC1 activity. HEK293T cells expressing LAMP1-GFP, MCOLN1-EGFP, MCOLN1S51E-EGFP, MCOLN1-SSEE-EGFP and MCOLN1-DDKK-GFP, respectively, were starved for 30 min. MCOLN1-DDKK-GFP (MCOLN1D471,472K-GFP) is a MCOLN1 nonconducting pore.Citation45 MCOLN1S51E-EGFP is a control phosphomimetic mutant that is not related to MTORC1 phosphorylation.Citation33 Cell extracts were analyzed by western blotting using anti-p-RPS6KB (T389) and anti-RPS6KB antibodies, and anti-GAPDH antibody was used as a loading control. Histograms represent the mean percentage of the ratio of p-RPS6KB:RPS6KB (mean ± SEM, n = 3 independent experiments) in the indicated conditions, relative to that of cells expressing LAMP1. (O-Q) Summary of ML-SA1-induced GECO responses in HEK293T cells expressing GECO-MCOLN1 and GECO-MCOLN1-SSAA under normal fed conditions. MCOLN1-SSAA displayed a higher activity in normal fed conditions compared to MCOLN1. However, MCOLN1-SSAA did not have an effect on lysosomal Ca2+ content. These findings suggest that the lysosome must have a mechanism to maintain its Ca2+ homeostasis. In this case, although MCOLN1-SSAA increases Ca2+ release, a compensational mechanism exists to increase Ca2+ uptake that depends on the endoplasmic reticulum Ca2+ release.Citation70-Citation73 NS, not significant; *, P < 0.05; **, P < 0.01.
Starvation changes cytoplasmic pH,Citation17 which may affect the GECO-MCOLN1 signals.Citation50 To exclude this possibility, we transfected HEK293T cells with G-GECO vectors and compared GECO fluorescence intensity between control and starvation groups. We found that GECO signals were not changed by our starvation conditions (Fig. S10). These data suggest that the ML-SA1 induced GECO-MCOLN1 response was specifically caused by MCOLN1 activation but not other nonspecific effects. It has been reported that MTORC1 phosphorylates human MCOLN1 on Ser572 and Ser576 leading to a decrease in MCOLN1 activity (corresponding to mouse MCOLN1 Ser571 and Ser576).Citation33 To test if starvation upregulates MCOLN1 via suppressing MTORC1-mediated MCOLN1 inhibition, the lysosomal Ca2+ release from the S571,576E phosphomimetic mutation of mouse MCOLN1 was examined. Upon starvation, cells expressing GECO-MCOLN1S571,576E (GECO-MCOLN1-SSEE) exhibited a significant decrease in ML-SA1-mediated Ca2+ release compared to cells expressing GECO-MCOLN1 (K), whereas lysosomal Ca2+ content (L) or MCOLN1 expression (M) was not altered. Consistently, an increase in MTORC1 activity induced by MCOLN1 overexpression was diminished by overexpressing MCOLN1-SSEE, but not MCOLN1S51E, a control mutant that does not respond to MTORC1 (N).Citation33 Additionally, the nonphosphorylatable GECO-MCOLN1S571,576A (GECO-MCOLN1-SSAA) mutation exhibited an increased GECO response compared with GECO-MCOLN1 in normal fed conditions (O-Q). Altogether, these data provide direct evidence that nutrient starvation upregulates MCOLN1-mediated Ca2+ release by relieving MTORC1's inhibition of the channel.
MCOLN1 is essential for MTORC1 reactivation during prolonged starvation
Following starvation-induced autophagy, autolysosomes degrade their contents to regenerate nutrients. Although MTORC1 signaling is inhibited during initiation of autophagy, it is reactivated by degradation products, such as amino acids, during prolonged starvation, which triggers the termination of autophagy and the formation of nascent lysosomes from autophagic membranes through an evolutionarily conserved cellular process called ALR (autophagic lysosome reformation).Citation51 ALR is critical for maintaining lysosome homeostasis.Citation51,Citation52 Given that MCOLN1 is important for MTORC1 activation, we aimed to test whether MCOLN1 plays an essential role in MTORC1 reactivation during ALR. For this purpose, a standard mild starvation protocol for ALR assessment was adopted. We found that prolonged starvation reactivated MTORC1 in WT (A,D) but not MCOLN1−/− human skin fibroblasts (B,D). In agreement with the notion that CALM is downstream of MCOLN1, W7 (3 µM) inhibited MTORC1 reactivation during prolonged starvation (C,D).
Figure 8. MCOLN1 is required for MTORC1 reactivation during prolonged starvation. (A) MTORC1 reactivation by prolonged starvation. WT human fibroblasts were starved in DMEM medium in the absence of FBS for 2, 4, 6, and 10 h.Citation51 Cell extracts were analyzed by western blotting using anti-p-RPS6KB (T389) and anti-RPS6KB antibodies, and anti-GAPDH antibody was used as a loading control. (B) Loss of MTORC1 reactivation in MCOLN1−/− human fibroblasts. (C) W7 inhibited MTORC1 reactivation in human fibroblasts. W7 (3 µM) was added in the DMEM medium during the 6 to 10 h of starvation. (D) Quantification of MTORC1 activity by assessing p-RPS6KB using western blot. Histograms represent the mean percentage of the ratio of p-RPS6KB:RPS6KB (mean ± SEM, n = 3 independent experiments) in the indicated conditions, relative to that of fed WT cells. (E) HBSS starvation for 48 h significantly decreased cell viability in MCOLN1−/− human skin fibroblasts compared to WT fibroblasts. Cell death was revealed by propidium iodide (PI) staining (mean ± SEM, n = 3 independent experiments). (F) Illustration of a feedback regulation between MTORC1 and MCOLN1 during starvation. Starvation caused a decrease in MTORC1 activity, leading to an increase in MCOLN1-mediated Ca2+ release. Ca2+ binds to CALM, promoting lysosomal MTORC1 recruitment and reactivation. This feedback regulatory mechanism is essential for autophagic lysosome reformation and cellular homeostasis during starvation. *: P < 0.05.
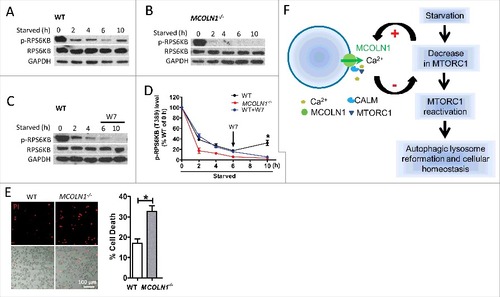
Starvation is an important evolutionarily conserved cellular process for maintaining lysosome homeostasis.Citation51,Citation52 Excessive starvation will cause autophagosome accumulation and cell death.Citation1,Citation3,Citation7,Citation31 In line with the role of MCOLN1 in MTORC1 activation, loss of MCOLN1 also causes accumulation of autophagosomesCitation27–Citation29 and cell death (E) during starvation.Citation28,Citation53,Citation54 Therefore, we think that impaired MTORC1 reactivation during starvation may contribute to the pathology of MLIV ().Citation27 Broadly, the MCOLN1-MTORC1 feedback loop may be important for many other LSDsCitation51 and common neurodegenerative diseases.Citation55–Citation57
DISCUSSION
The kinase MTORC1 is a key regulator of autophagy induction in response to nutrient shortage. Its activation suppresses autophagy, whereas its inhibition promotes autophagy. Because MTORC1 is also an important regulator of protein synthesis, cell growth and cellular homeostasis, continuous loss of MTORC1 activity during nutrient and energy deprivation leads to cell death.Citation7,Citation8 Thus, a feedback modulating mechanism must exist to maintain MTORC1 activity during starvation, in particular for prolonged starvation that induces ALR, an important cellular adaptation mechanism critical for lysosome homeostasis and cell survival.Citation51,Citation52 However, the molecular mechanism underlying the feedback regulation of MTORC1 is unclear. In this study, we have shown that upregulating MCOLN1 promotes, whereas downregulating MCOLN1 suppresses, lysosomal MTORC1 recruitment and MTORC1 activity during starvation. We have also shown that MCOLN1 regulates MTORC1 through activating CALM, and both MCOLN1 and CALM are required for MTORC1 reactivation during prolonged starvation. In addition, we provide direct evidence that starvation activates MCOLN1 by relieving MTORC1's inhibitory effect on the channel. Thus, MCOLN1 and MTORC1 form a negative feedback loop to maintain sustained MTORC1 activity during nutrient deprivation. MTORC1 inhibition due to starvation activates MCOLN1, which in turn promotes MTORC1 activity through Ca2+-mediated activation of CALM (F). This is also supported by a recent publication showing that MCOLN1 but not other lysosomal channels, such as TPCN2 and P2RX4, regulates MTORC1 when cells were cultured for 24 h without changing medium,Citation35 which leads to nutrient shortage ().
If this is true, why did MCOLN1 activate MTORC1 during the 15-min refeeding? We think that the negative feedback loop between MTORC1 and MCOLN1 is still functional during short-term refeeding because MTORC1 activity gradually recovers (A,C). Altogether, our data suggest that under normal conditions when MCOLN1 is inhibited by MTORC1 ( and Fig. S9),Citation33 MCOLN1 is dispensable for lysosomal MTORC1 recruitment and MTORC1 activity (C,B,F, and Fig. S6), whereas under stressful conditions, the reduction in MTORC1 activity activates MCOLN1-CALM, leading to MTORC1 restoration.
MCOLN1 regulating MTORC1 could also be attributed to nutrient regeneration during starvation because MCOLN1 has been suggested to regulate the fusion of autophagosomes with lysosomesCitation26 and subsequent protein degradation.Citation27-Citation29 However, we (Fig. S2A-C) and othersCitation25 suggested that upregulation of MCOLN1 did not increase autophagosome and lysosome fusion. We and othersCitation35 also found that knocking down MCOLN1 attenuated the activation of MTORC1 by overexpression of constitutively active RRAGB (D,E), which partially mimics amino acid-replete conditions (Fig. S8).Citation32,Citation36 We thus suggest that MCOLN1 regulating MTORC1 activity is likely through a direct stimulation of MTORC1 by Ca2+-CALM but not nutrient regeneration. This is also in agreement with the finding that Ca2+ and CALM activate the kinase activity of the isolated MTORC1 complex in vitro.Citation35 However, we cannot exclude the possibility that during prolonged starvation MCOLN1 may modulate MTORC1 activity through promoting nutrient regeneration.Citation27–Citation29
In contrast, previous work has suggested a positive feedback loop formed by MCOLN1 and TFEB during starvation,Citation47,Citation48 i.e. starvation activates MCOLN1 leading to TFEB activation through PPP3/calcineurin (protein phosphatase 3), which in turn increases the expression of MCOLN1. Because TFEB is the master transcriptional regulator of lysosomal biogenesis and autophagy,Citation58,Citation59 regulation of its activity would be important for efficient autophagy induction and sustained autophagic flux. Notably, activation of this transcriptional pathway is independent of MTORC1.Citation47,Citation48 Previous studies have also suggested that starvation causes perinuclear clustering of lysosomes.Citation17,Citation24 In this case, activated MCOLN1 interacts with the PDCD6-DCTN/dynactin-dynein complex to drive lysosomes toward the perinuclear area, and then fuse with autophagosomes.Citation17 Therefore, MCOLN1 is implicated in cellular adaptation to starvation using 3 different mechanisms, i.e. a negative feedback post-translational pathway involving MCOLN1-CALM-MTORC1-MCOLN1, a positive feedback transcriptional pathway involving MCOLN1-PPP3-TFEB-MCOLN1, and a lysosome positioning machinery involved MCOLN1-PDCD6-DCTN/dynactin-dynein. Future studies are needed to elucidate how these pathways work cooperatively to maintain cellular hemostasis in response to nutrient starvation and other types of cellular stresses.
Intracellular Ca2+ signaling is implicated in autophagy regulation.Citation12,Citation60 In parallel to the endoplasmic reticulum (ER) and the mitochondrion, the lysosome has also been recognized as an intracellular Ca2+ store.Citation61,Citation62 However, the role of lysosomal Ca2+ in MTORC1 has been neglected although MTORC1 needs to be recruited to and activated on the surface of lysosomes.Citation6 Although emerging evidence suggests that the lysosomal Ca2+ release channel MCOLN1 is involved in autophagy, the specific role of MCOLN1 in MTORC1Citation24–Citation26 is controversial. Wong et al.Citation26 suggest that Drosophila MCOLN1 is required for MTORC1 activation. Later studies suggest that activating MCOLN1 does not change MTORC1 activity.Citation24,Citation25 Most recently, Li et al.Citation35 suggest that MCOLN1 plays an important role in regulating MTORC1. We have now resolved this controversy by clarifying that MCOLN1 regulation of MTORC1 occurs specifically under stressful conditions. Because of the similarities between Drosophila and mammalian MCOLNs, we think that MCOLN1 regulating MTORC1 signaling is evolutionarily conserved.
In summary, we have further demonstrated that MCOLN1-mediated lysosomal Ca2+ signaling as an essential component in the canonical MTORC1 pathway. MCOLN1 and MTORC1 form a negative feedback loop to maintain cellular hemostasis during starvation. This feedback regulation of MTORC1 may provide an essential adaptation process that aids cellular survival under extreme conditions.Citation7,Citation8 MTORC1 and autophagy are associated with many physiological and pathological processes such as sustained exercise, development, differentiation, LSDs, neurodegenerative diseases, cancer, inflammatory, infectious and autoimmune conditions.Citation1-Citation5,Citation63 By promoting MTORC1 reactivation and maintaining cellular homeostasis, the MCOLN1-MTORC1 feedback regulatory mechanism may play an important role in these conditions. In particular, defective ALR blocks the termination of autophagy,Citation51,Citation52 thereby leading to impaired autophagic fluxCitation56,Citation57,Citation64 and cell death (E).Citation51,Citation55–Citation57,Citation65 Upregulating the MCOLN1-CALM-MTORC1 pathway may represent a potential therapeutic strategy for LSD patients and classical neurodegenerative diseases that are characterized by aberrant ALR.Citation51,Citation55
Materials and methods
Cell culture
HEK293T cells (ATCC, CRL-3216™) and HeLa cells (ATCC, CRL-3216™) were maintained in Dulbecco's Modified Eagle's Medium (DMEM; Thermo Fisher Scientific, 11995065) supplemented with 10% FBS (Thermo Fisher Scientific, 12483020). Human skin MCOLN1−/− fibroblasts (Coriell Institute for Medical Research, GM02629) from MLIV patients and WT nondisease fibroblasts (Coriell Institute for Medical Research, GM00969) were maintained in DMEM supplemented with 15% non-heat-inactivated FBS. HEK293T cells were transiently transfected using Lipofectamine 3000 (Thermo Fisher Scientific, L3000015) according to the manufacturer's manual with the indicated plasmids for further experiments. For taking images, cells were seeded on 0.01% poly-L-lysine (Sigma-Aldrich, P4832)-coated glass coverslips and cultured for 24 h before further experiments. In this study, a mild starvation condition HBSS (Thermo Fisher Scientific, 14170112) + 1% FBSCitation17–Citation23 was adopted to purposely mimic the physiological condition unless specifically indicated, and DMEM + 10% FBS was used as refeeding.
Antibodies and reagents
The following primary antibodies were used for immunofluorescence staining and western blotting: anti-LAMP1 (Developmental Studies Hybridoma Bank, H4A3); anti-CALM/calmodulin (Abcam, ab45689); anti-FLAG (Thermo Fisher Scientific, MA1-91878); anti-GFP (GF28R; Thermo Fisher Scientific, MA5-15256); anti-MTOR (7C10; Cell Signaling Technology, 2983); anti-p-RPS6KB (T389; Cell Signaling Technology, 9206); anti-RPS6KB (Cell Signaling Technology, 9202); anti-p-EIF4EBP1 (T37/46; Cell Signaling Technology, 2855); anti-EIF4EBP1 (Cell Signaling Technology, 9644); anti- PDCD6/ALG2 (Thermo Fisher Scientific, PIPA 527639); and anti-GAPDH (H-12; Santa Cruz Biotechnology, SC-166574). Secondary antibodies include goat-anti-mouse IgG-HRP (Santa Cruz Biotechnology, sc-2005); goat-anti-rabbit IgG-HRP (Thermo Fisher Scientific, PI31460); Alexa Fluor 488 goat anti-mouse antibodies (Thermo Fisher Scientific, A-11001); and Alexa Fluor 594 goat anti-rabbit antibodies (Thermo Fisher Scientific, A-11012). Chemical compounds: ML-SA1 (Tocris Bioscience, 4746); BAPTA-AM (Tocris Bioscience, 2787/25); GPN (Santa Cruz Biotechnology, sc-252858); ionomycin (Cayman Chemical, 11932-1); ML-SI1 (Enzo Life Sciences Inc, BML-CR112-0010); W-7 (Sigma-Aldrich, A3281); AZD8055 (Sigma-Aldrich, A-2345).
Molecular biology
GECO-MCOLN1, LAMP1-GFP, MCOLN1-GFP and MCOLN1-DDKK-GFP, CALM-MYC-HIS, MTOR-FLAG (FG4R), SYT7-DN, MCOLN1-HA were home-made or employed as described previously.Citation46,Citation66 The RRAGBWT (19313, David Sabatini), RRAGBGDP (T54L, 19314, David Sabatini), RRAGBGTP (Q99L, 19315, David Sabatini), psPAX2 (12260, Didier Trono), pMD2.G (12259, Didier Trono) and mRFP-EGFP-LC3 (21074, Tamotsu Yoshimori) clones were purchased from Addgene. Knockout of PDCD6 using the CRISPR-Cas9 system was carried out as previously reported.Citation46 Specific and efficient RNAi-mediated knockdown of endogenous human MCOLN1 expression in HEK293T cells was performed as previously described.Citation15,Citation67,Citation68 Oligonucleotide 5′-GCTACCTGACCTTCTTCCACA-3′Citation15 was cloned into the shRNA expression vector pLKO.1 (Addgene, 8453; deposited by Dr. Bob Weinberg). GECO-MCOLN1S571,576E mutant and GECO-MCOLN1S571,576A mutant were constructed using a site-directed mutagenesis kit (Thermo Fisher Scientific, A14604).
Immunoprecipitation and western blot
Cell lysates were incubated with 80 μl 50% protein A/G-agarose beads (Santa Cruz Biotechnology, sc-2003) in phosphate-buffered saline (PBS; 144.0 mg/L KH2PO4, 9000.0 mg/L NaCl and 795.0 mg/L Na2HPO4-7H2O) for 15 min at 4°C to reduce background proteins that nonspecifically bound to the beads. After centrifugation at 12,000 × g for 15 min to remove the beads, aliquots of cell lysates were incubated with the desired antibodies or control IgG at 4°C overnight in a final volume of 1 ml RIPA-PBS buffer (20 mM Tris-HCl, pH 7.5, 150 mM NaCl, 1 mM Na2 EDTA, 1 mM EGTA, 1% NP-40 [Sigma-Aldrich, 74385], 1% sodium deoxycholate [Sigma-Aldrich, S1287], 2.5 mM sodium pyrophosphate [Sigma-Aldrich, 221368], 1 mM b-glycerophosphate [Cayman Chemical, 14405], 1 mM Na3VO4 [Sigma-Aldrich, 450243], 1 µg/ml leupeptin [Sigma-Aldrich, L2884]) with constant rocking. After antibody incubation, protein A/G-agarose beads were added and the samples were incubated at 4°C for 4 h, followed by centrifugation at 300 g for 10 min at 4°C. The beads were then washed 3 times with pre-cooled RIPA buffer without proteinase inhibitors and each time centrifuged at 300 g for 10 min at 4°C. Immune complexes were resolved by SDS-PAGE and subjected to immunoblotting. Proteins were analyzed by standard western blot analysis methods. Proteins were resolved on 10% SDS-PAGE and transferred onto PVDF membranes (Bio-Rad, 164–0177). Nonspecific binding was blocked using 5% skim milk in TBS-T (0.1% Tween-20 [Fermentas, BP337500] in 2420.0 mg/L Tris-HCl, 8000.0 mg/L NaCl, pH 7.4) for 2 h at room temperature. Membranes were then incubated with specific primary antibody solution at 4°C overnight with gentle constant shaking. After 3 thorough TBS-T washes, the membranes were incubated with corresponding HRP-conjugated secondary antibody at room temperature for 1 h. Immunoreactive bands were visualized using Clear ECL (Bio-Rad, 170–5060) and autoradiography.
Lentivirus production and cell transduction
HEK293T cells were seeded in 6-cm dishes. When 50–70% confluent, the cells were cotransfected with 4 μg lentiviral vector pLKO.1 (Addgene, 8453), 3 μg psPAX2 (Addgene, 12260) and 1 μg pMD2.G (Addgene, 12259) using Lipofectamine 3000 according to the manufacturer's instructions. The supernatants were harvested at 24, 48 and 72 h, centrifuged at 300 g for 10 min, and then passed through 0.45-μm filters. The concentrated virus was stored at −80°C.
HEK293T cells were seeded in 10-cm culture dishes. When cells reached 40% confluence, lentiviral conditional medium was added. After 48 h, cells were treated with 1 μg/ml puromycin (Thermo Fisher Scientific, A11138-03) for 3 d to select transduced cells, and then MCOLN1 shRNA expression was induced by 100 ng/ml doxycycline (Sigma-Aldrich, D9891) for at least 48 h.
Real-time qPCR
HEK293T cells were transduced with lentivirus carrying scramble shRNA or MCOLN1 shRNA. After total RNA was extracted, cDNA was generated with an iScript™ Advanced cDNA Synthesis Kit (Bio-Rad, 1725037), and real-time qPCR was carried out using GoTaq® qPCR Master Mix (Promega Corporation, A6001). Real-time PCR primers were from Thermo Fisher Scientific, the primer sequence (5’-3’) is as follows: human MCOLN1 (F-CGGATGACACCTTCGCAGC CTAC, R-CGGATGACACCTTCGCAGCCTA C); GAPDH (F-GAAGGTGAAGGTCGGAGT C, R-GAAGATGGTGATGGGATTTC). GAPDH was used as a control.
Confocal microscopy
Confocal fluorescence images were taken using an inverted Zeiss LSM510 Axiovert200M confocal microscope with a 40 × or 63 × oil-immersion objective. Sequential excitation wavelengths at 488 nm and 543 nm were provided by argon and helium-neon gas lasers, respectively. Emission filters BP500-550 and LP560 were used for collecting green and red images in channels 1 and 2, respectively. After sequential excitation, green and red fluorescent images of the same cell were saved with ZEN2012 software. Images were analyzed by Zeiss software. Intensity of fluorescence was analyzed using ImageJ. The image size was set at 1,024 × 1,024 pixels.
Immunocytochemistry
Cells grown on coverslips were washed with PBS twice and fixed in 4% paraformaldehyde (Sigma-Aldrich, P6148) in PBS for 15 min at room temperature. Fixed cells were permeabilized with 0.1% Triton X-100 (Sigma-Aldrich, T8787) in PBS for 5 min and then blocked with 3% bovine serum albumin (Thermo Fisher Scientific, 3600500) in PBS for 60 min at room temperature. After 3 PBS washes, cells were incubated with primary antibodies at 4°C overnight. After 3 more PBS washes, cells were incubated with fluorescence-conjugated secondary antibodies for 45 min at room temperature in the dark. Images were acquired using a confocal microscope (LSM510, Zeiss; USA) with a 63X oil-immersion objective lens and captured using ZEN22012 software.
GECO Ca2+ imaging
HEK293T cells transfected with the indicated constructs were trypsinized and plated onto glass coverslips for 4–6 h prior to experiments. The fluorescence intensity at 470 nm (F470) was monitored using the EasyRatioPro system. Lysosomal Ca2+ release was measured under a ‘low’ external Ca2+ solution, which contained 145 mM NaCl, 5 mM KCl, 3 mM MgCl2, 10 mM glucose, 1 mM EGTA, 20 mM HEPES, pH 7.4). Ca2+ concentration in the nominally free Ca2+ solution is estimated to be 1–10 μM. With 1 mM EGTA, the free Ca2+ concentration is estimated to be < 10 nM based on the Maxchelator software (http://maxchelator.stanford.edu/). For measuring control or refed, but not starved or AZD8055-treated cells, 1 × amino acid mix was added to external solutions during the measuring.
Analysis of cell death
Cell death was analyzed by measuring the permeability of the plasma membrane to propidium iodide (PI; Sigma-Aldrich, P4170). After the indicated treatment, cells were collected and suspended in PBS. Cells were then stained with 2 μg/ml PI for 5–10 min at room temperature, and a 10-μl suspension was applied onto a microscope slide, covered with a cover slide and viewed immediately under a fluorescence microscope.
Data analysis
Quantification of western blot and confocal image was carried out using ImageJ software. For the analysis of colocalization between MTOR and LAMP1, a constant threshold was applied to all images, followed by application of the colocalization plug-in of ImageJ software. All channels were then projected (max) and quantified using Analyze particle plugin (particles 5 pixels and above were included).Citation69 Due to the high density of lysosomes in human fibroblasts, we used particles’ area instead of particles’ number to calculate the colocalization. The data were expressed as the percentage of MTOR area that colocalized with LAMP1 area. Data are presented as mean ± SEM from at least 3 independent experiments. Statistical comparisons were made using analysis of variance (ANOVA) and Student t test. P values of < 0.05 were considered statistically significant. *, P < 0.05; **, P < 0.01.
Abbreviations
| ALR | = | autophagic lysosome reformation |
| CALM | = | calmodulin |
| co-IP | = | co-immunoprecipitation |
| ER | = | endoplasmic reticulum |
| GPN | = | glycyl-phenylalanine 2-naphthylamide |
| LAMP1 | = | lysosomal associated membrane protein 1 |
| LSD | = | lysosomal storage disease |
| MTORC1 | = | mechanistic target of rapamycin complex 1 |
| PDCD6/ALG2 | = | programmed cell death 6 |
| PI | = | propidium iodide |
| PPP3/calcineurin | = | protein phosphatase 3 |
| SYT7 | = | synaptotagmin 7 |
| SYT7-DN | = | dominant negative mutant SYT7 |
| TFEB | = | transcription factor EB |
| V-ATPase | = | vacuolar-type H+-translocating ATPase |
| WT | = | wild type |
Disclosure of potential conflicts of interest
No potential conflicts of interest were disclosed.
supp_data_KAUP_A_1389822.pptx
Download MS Power Point (8.4 MB)Acknowledgements
This work was supported by startup funds to X.D. from the Department of Physiology and Biophysics, Dalhousie University, DMRF Equipment Grant, DMRF new investigator award, CIHR grant (MOP-119349), CIHR New Investigator award (201109MSH-261462-208625), NSHRF Establishment Grant (MED-PRO-2011-7485), CFI Leaders Opportunity Fund-Funding for research infrastructure (29291), and the Program of International S and T Cooperation (2015DFA31580). We thank Lin Mei for the CALM plasmids, Michael X. Zhu for the LAMP1 plasmids, Mitsunori Fukuda for the SYT7-DN plasmid, Robert pbell for the GECO construct, Rob Onyenwoke for the human MCOLN1-EGFP, MCOLN1S51E-EGFP and MCOLN1S572E,S576E-EGFP, and Stephen Whitefield for his assistance in image analysis. We appreciate the encouragement and helpful comments from other members of the Dong laboratory.
Correction Statement
This article has been republished with minor changes. These changes do not impact the academic content of the article.
Additional information
Funding
Related Research Data
References
- Levine B, Kroemer G. Autophagy in the pathogenesis of disease. Cell. 2008;132:27–42. doi:10.1016/j.cell.2007.12.018. PMID:18191218.
- Komatsu M, Waguri S, Chiba T, Murata S, Iwata J, Tanida I, Ueno T, Koike M, Uchiyama Y, Kominami E, Tanaka K. Loss of autophagy in the central nervous system causes neurodegeneration in mice. Nature. 2006;441:880–884. doi:10.1038/nature04723. PMID:16625205.
- Fulda S, Kogel D. Cell death by autophagy: Emerging molecular mechanisms and implications for cancer therapy. Oncogene. 2015;34(40):5105–13. doi:10.1038/onc.2014.458.
- Levine B, Mizushima N, Virgin HW. Autophagy in immunity and inflammation. Nature. 2011;469:323–35. doi:10.1038/nature09782. PMID:21248839.
- Mizushima N, Levine B. Autophagy in mammalian development and differentiation. Nat Cell Biol. 2010, 12:823–30. doi:10.1038/ncb0910-823. PMID:20811354.
- Zoncu R, Bar-Peled L, Efeyan A, Wang S, Sancak Y, Sabatini DM. mTORC1 senses lysosomal amino acids through an inside-out mechanism that requires the vacuolar H+-ATPase. Science. 2011;334:678–83. doi:10.1126/science.1207056. PMID:22053050.
- Maiuri MC, Zalckvar E, Kimchi A, Kroemer G. Self-eating and self-killing: crosstalk between autophagy and apoptosis. Nat Rev Mol Cell Biol. 2007;8:741–52. doi:10.1038/nrm2239. PMID:17717517.
- Liu Y, Levine B. Autosis and autophagic cell death: the dark side of autophagy. Cell Death Differ. 2015;22:367–76. doi:10.1038/cdd.2014.143. PMID:25257169.
- Hoyer-Hansen M, Bastholm L, Szyniarowski P, Campanella M, Szabadkai G, Farkas T, Bianchi K, Fehrenbacher N, Elling F, Rizzuto R, et al. Control of macroautophagy by calcium, calmodulin-dependent kinase kinase-beta, and Bcl-2. Mol Cell. 2007;25:193–205. doi:10.1016/j.molcel.2006.12.009. PMID:17244528.
- Gulati P, Gaspers LD, Dann SG, Joaquin M, Nobukuni T, Natt F, Kozma SC, Thomas AP, Thomas G. Amino acids activate mTOR complex 1 via Ca2+/CaM signaling to hVps34. Cell Metab. 2008;7:456–65. doi:10.1016/j.cmet.2008.03.002. PMID:18460336.
- Decuypere JP, Paudel RC, Parys J, Bultynck G. Intracellular Ca2+ signaling: A novel player in the canonical mTOR-controlled autophagy pathway. Commun Integr Biol. 2013;6:e25429. doi:10.4161/cib.25429. PMID:24265855.
- Decuypere JP, Bultynck G, Parys JB. A dual role for Ca2+ in autophagy regulation. Cell Calcium. 2011;50:242–50. doi:10.1016/j.ceca.2011.04.001. PMID:21571367.
- Dong XP, Cheng X, Mills E, Delling M, Wang F, Kurz T, Xu H. The type IV mucolipidosis-associated protein TRPML1 is an endolysosomal iron release channel. Nature. 2008;455:992–96. doi:10.1038/nature07311. PMID:18794901.
- Dong XP, Shen D, Wang X, Dawson T, Li X, Zhang Q, Cheng X, Zhang Y, Weisman LS, Delling M, Xu H. PI(3,5)P(2) controls membrane trafficking by direct activation of mucolipin Ca2+ release channels in the endolysosome. Nat Commun. 2010;1:38. doi:10.1038/ncomms1037. PMID:20802798.
- Grimm C, Jors S, Saldanha SA, Obukhov AG, Pan B, Oshima K, Cuajungco MP, Chase P, Hodder P, Heller S. Small molecule activators of TRPML3. Chem Biol. 2010;17:135–48. doi:10.1016/j.chembiol.2009.12.016. PMID:20189104.
- Shen D, Wang X, Li X, Zhang X, Yao Z, Dibble S, Dong XP, Yu T, Lieberman AP, Showalter HD, Xu H. Lipid storage disorders block lysosomal trafficking by inhibiting a TRP channel and lysosomal calcium release. Nat Commun. 2012;3:731. doi:10.1038/ncomms1735. PMID:22415822.
- Korolchuk VI, Saiki S, Lichtenberg M, Siddiqi FH, Roberts EA, Imarisio S, Jahreiss L, Sarkar S, Futter M, Menzies FM, et al. Lysosomal positioning coordinates cellular nutrient responses. Nat Cell Biol 2011, 13:453–460. doi:10.1038/ncb2204. PMID:21394080.
- Perera RM, Stoykova S, Nicolay BN, Ross KN, Fitamant J, Boukhali M, Lengrand J, Deshpande V, Selig MK, Ferrone CR, et al. Transcriptional control of autophagy-lysosome function drives pancreatic cancer metabolism. Nature. 2015;524:361–65. doi:10.1038/nature14587. PMID:26168401.
- Shang L, Chen S, Du F, Li S, Zhao L, Wang X. Nutrient starvation elicits an acute autophagic response mediated by Ulk1 dephosphorylation and its subsequent dissociation from AMPK. Proc Natl Acad Sci U S A. 2011;108:4788–93. doi:10.1073/pnas.1100844108. PMID:21383122.
- Tang Z, Lin MG, Stowe TR, Chen S, Zhu M, Stearns T, Franco B, Zhong Q. Autophagy promotes primary ciliogenesis by removing OFD1 from centriolar satellites. Nature. 2013;502:254–57. doi:10.1038/nature12606. PMID:24089205.
- Abkhezr M, Keramati AR, Ostad SN, Davoodi J, Ghahremani MH. The time course of Akt and ERK activation on XIAP expression in HEK 293 cell line. Mol Biol Rep. 2010;37:2037–42. doi:10.1007/s11033-009-9658-4. PMID:19649722.
- Arimoto K, Burkart C, Yan M, Ran D, Weng S, Zhang DE. Plakophilin-2 promotes tumor development by enhancing ligand-dependent and -independent epidermal growth factor receptor dimerization and activation. Mol Cell Biol. 2014;34:3843–54. doi:10.1128/MCB.00758-14. PMID:25113560.
- Peairs A, Dai R, Gan L, Shimp S, Rylander MN, Li L, Reilly CM. Epigallocatechin-3-gallate (EGCG) attenuates inflammation in MRL/lpr mouse mesangial cells. Cell Mol Immunol. 2010;7:123–32. PMID:20140007.
- Li X, Rydzewski N, Hider A, Zhang X, Yang J, Wang W, Gao Q, Cheng X, Xu H. A molecular mechanism to regulate lysosome motility for lysosome positioning and tubulation. Nat Cell Biol. 2016;18(4):404–17. doi:10.1038/ncb3324.
- Zhang X, Cheng X, Yu L, Yang J, Calvo R, Patnaik S, Hu X, Gao Q, Yang M, Lawas M, et al. MCOLN1 is a ROS sensor in lysosomes that regulates autophagy. Nat Commun 2016, 7:12109. doi:10.1038/ncomms12109. PMID:27357649.
- Wong CO, Li R, Montell C, Venkatachalam K. Drosophila TRPML is required for TORC1 activation. Curr Biol. 2012;22:1616–21. doi:10.1016/j.cub.2012.06.055. PMID:22863314.
- Sun T, Wang X, Lu Q, Ren H, Zhang H. CUP-5, the C. elegans ortholog of the mammalian lysosomal channel protein MLN1/TRPML1, is required for proteolytic degradation in autolysosomes. Autophagy. 2011;7:1308–15. doi:10.4161/auto.7.11.17759. PMID:21997367.
- Venkatachalam K, Long AA, Elsaesser R, Nikolaeva D, Broadie K, Montell C. Motor deficit in a Drosophila model of mucolipidosis type IV due to defective clearance of apoptotic cells. Cell. 2008;135:838–51. doi:10.1016/j.cell.2008.09.041. PMID:19041749.
- Schaheen L, Dang H, Fares H. Basis of lethality in C. elegans lacking CUP-5, the Mucolipidosis Type IV orthologue. Dev Biol. 2006;293:382–91. doi:10.1016/j.ydbio.2006.02.008. PMID:16530747.
- Mizushima N, Yoshimori T, Levine B: Methods in mammalian autophagy research. Cell. 2010;140:313–26. doi:10.1016/j.cell.2010.01.028. PMID:20144757.
- Klionsky DJ, Abdelmohsen K, Abe A, Abedin MJ, Abeliovich H, Acevedo Arozena A, Adachi H, Adams CM, Adams PD, Adeli K, et al. Guidelines for the use and interpretation of assays for monitoring autophagy (3rd edition). Autophagy. 2016;12:1–222. doi:10.1080/15548627.2015.1100356. PMID:26799652.
- Cang C, Zhou Y, Navarro B, Seo YJ, Aranda K, Shi L, Battaglia-Hsu S, Nissim I, Clapham DE, Ren D. mTOR regulates lysosomal ATP-sensitive two-pore Na+ channels to adapt to metabolic state. Cell. 2013;152:778–90. doi:10.1016/j.cell.2013.01.023. PMID:23394946.
- Onyenwoke RU, Sexton JZ, Yan F, Diaz MC, Forsberg LJ, Major MB, Brenman JE. The mucolipidosis IV Ca2+ channel TRPML1 (MCOLN1) is regulated by the TOR kinase. Biochem J. 2015;470:331–42. doi:10.1042/BJ20150219. PMID:26195823.
- Tong Y, Song F. Intracellular calcium signaling regulates autophagy via calcineurin-mediated TFEB dephosphorylation. Autophagy. 2015;11(7):1192–5. doi:10.1080/15548627.2015.1054594.
- Li RJ, Xu J, Fu C, Zhang J, Zheng YG, Jia H, Liu JO. Regulation of mTORC1 by lysosomal calcium and calmodulin. Elife. 2016;5:piie19360. doi:10.7554/eLife.19360.
- Sancak Y, Peterson TR, Shaul YD, Lindquist RA, Thoreen CC, Bar-Peled L, Sabatini DM. The Rag GTPases bind raptor and mediate amino acid signaling to mTORC1. Science. 2008;320:1496–501. doi:10.1126/science.1157535. PMID:18497260.
- Jewell JL, Russell RC, Guan KL. Amino acid signalling upstream of mTOR. Nat Rev Mol Cell Biol. 2013;14:133–39. doi:10.1038/nrm3522. PMID:23361334.
- Bar-Peled L, Sabatini DM. Regulation of mTORC1 by amino acids. Trends Cell Biol. 2014;24:400–06. doi:10.1016/j.tcb.2014.03.003. PMID:24698685.
- Sancak Y, Bar-Peled L, Zoncu R, Markhard AL, Nada S, Sabatini DM. Ragulator-Rag complex targets mTORC1 to the lysosomal surface and is necessary for its activation by amino acids. Cell. 2010;141:290–303. doi:10.1016/j.cell.2010.02.024. PMID:20381137.
- Kim E, Goraksha-Hicks P, Li L, Neufeld TP, Guan KL. Regulation of TORC1 by Rag GTPases in nutrient response. Nat Cell Biol. 2008;10:935–45. doi:10.1038/ncb1753. PMID:18604198.
- Martinez I, Chakrabarti S, Hellevik T, Morehead J, Fowler K, Andrews NW. Synaptotagmin VII regulates Ca2+-dependent exocytosis of lysosomes in fibroblasts. J Cell Biol. 2000;148:1141–49. doi:10.1083/jcb.148.6.1141. PMID:10725327.
- Vergarajauregui S, Martina JA, Puertollano R. Identification of the penta-EF-hand protein ALG-2 as a Ca2+-dependent interactor of mucolipin-1. J Biol Chem. 2009;284:36357–66. doi:10.1074/jbc.M109.047241. PMID:19864416.
- Colombo MI, Beron W, Stahl PD. Calmodulin regulates endosome fusion. J Biol Chem. 1997;272:7707–12. doi:10.1074/jbc.272.12.7707. PMID:9065429.
- Peters C, Mayer A. Ca2+/calmodulin signals the completion of docking and triggers a late step of vacuole fusion. Nature. 1998;396:575–80. doi:10.1038/25133. PMID:9859992.
- Cao Q, Zhong XZ, Zou Y, Zhang Z, Toro L, Dong XP. BK Channels Alleviate Lysosomal Storage Diseases by Providing Positive Feedback Regulation of Lysosomal Ca2+ Release. Dev Cell. 2015;33(4):427–41. doi:10.1016/j.devcel.2015.04.010.
- Cao Q, Zhong XZ, Zou Y, Murrell-Lagnado R, Zhu MX, Dong XP. Calcium release through P2X4 activates calmodulin to promote endolysosomal membrane fusion. J Cell Biol. 2015;209:879–94. doi:10.1083/jcb.201409071. PMID:26101220.
- Medina DL, Di Paola S, Peluso I, Armani A, De Stefani D, Venditti R, Montefusco S, Scotto-Rosato A, Prezioso C, Forrester A, et al. Lysosomal calcium signalling regulates autophagy through calcineurin and TFEB. Nat Cell Biol. 2015;17:288–99. doi:10.1038/ncb3114. PMID:25720963.
- Wang W, Gao Q, Yang M, Zhang X, Yu L, Lawas M, Li X, Bryant-Genevier M, Southall NT, Marugan J, et al. Up-regulation of lysosomal TRPML1 channels is essential for lysosomal adaptation to nutrient starvation. Proc Natl Acad Sci U S A. 2015;112:E1373–81. doi:10.1073/pnas.1419669112. PMID:25733853.
- Chresta CM, Davies BR, Hickson I, Harding T, Cosulich S, Critchlow SE, Vincent JP, Ellston R, Jones D, Sini P, et al. AZD8055 is a potent, selective, and orally bioavailable ATP-competitive mammalian target of rapamycin kinase inhibitor with in vitro and in vivo antitumor activity. Cancer Res. 2010;70:288–98. doi:10.1158/0008-5472.CAN-09-1751. PMID:20028854.
- Zhao Y, Araki S, Wu J, Teramoto T, Chang YF, Nakano M, Abdelfattah AS, Fujiwara M, Ishihara T, Nagai T, Campbell RE. An expanded palette of genetically encoded Ca2+ indicators. Science. 2011;333:1888–91. doi:10.1126/science.1208592. PMID:21903779.
- Yu L, McPhee CK, Zheng L, Mardones GA, Rong Y, Peng J, Mi N, Zhao Y, Liu Z, Wan F, et al. Termination of autophagy and reformation of lysosomes regulated by mTOR. Nature. 2010;465:942–46. doi:10.1038/nature09076. PMID:20526321.
- Chen Y, Yu L. Autophagic lysosome reformation. Exp Cell Res. 2013;319:142–6. doi:10.1016/j.yexcr.2012.09.004. PMID:22999865.
- Huynh JM, Dang H, Munoz-Tucker IA, O'Ketch M, Liu IT, Perno S, Bhuyan N, Crain A, Borbon I, Fares H. ESCRT-Dependent Cell Death in a Caenorhabditis elegans Model of the Lysosomal Storage Disorder Mucolipidosis Type IV. Genetics. 2016;202:619–38. doi:10.1534/genetics.115.182485. PMID:26596346.
- Colletti GA, Miedel MT, Quinn J, Andharia N, Weisz OA, Kiselyov K. Loss of lysosomal ion channel transient receptor potential channel mucolipin-1 (TRPML1) leads to cathepsin B-dependent apoptosis. J Biol Chem. 2012;287:8082–91. doi:10.1074/jbc.M111.285536. PMID:22262857.
- Magalhaes J, Gegg ME, Migdalska-Richards A, Doherty MK, Whitfield PD, Schapira AH. Autophagic lysosome reformation dysfunction in glucocerebrosidase deficient cells: relevance to Parkinson disease. Hum Mol Genet. 2016;25(16):3432–45. doi:10.1093/hmg/ddw185.
- Rong Y, McPhee CK, Deng S, Huang L, Chen L, Liu M, Tracy K, Baehrecke EH, Yu L, Lenardo MJ. Spinster is required for autophagic lysosome reformation and mTOR reactivation following starvation. Proc Natl Acad Sci U S A. 2011;108:7826–31. doi:10.1073/pnas.1013800108. PMID:21518918.
- Chang J, Lee S, Blackstone C. Spastic paraplegia proteins spastizin and spatacsin mediate autophagic lysosome reformation. J Clin Invest. 2014;124:5249–62. doi:10.1172/JCI77598. PMID:25365221.
- Settembre C, Di Malta C, Polito VA, Garcia Arencibia M, Vetrini F, Erdin S, Erdin SU, Huynh T, Medina D, Colella P, et al. TFEB links autophagy to lysosomal biogenesis. Science. 2011;332:1429–33. doi:10.1126/science.1204592. PMID:21617040.
- Sardiello M, Palmieri M, di Ronza A, Medina DL, Valenza M, Gennarino VA, Di Malta C, Donaudy F, Embrione V, Polishchuk RS, et al. A gene network regulating lysosomal biogenesis and function. Science. 2009;325:473–7. PMID:19556463.
- Parys JB, Decuypere JP, Bultynck G. Role of the inositol 1,4,5-trisphosphate receptor/Ca2+-release channel in autophagy. Cell Commun Signal. 2012;10:17. doi:10.1186/1478-811X-10-17. PMID:22770472.
- Calcraft PJ, Ruas M, Pan Z, Cheng X, Arredouani A, Hao X, Tang J, Rietdorf K, Teboul L, Chuang KT, et al. NAADP mobilizes calcium from acidic organelles through two-pore channels. Nature. 2009;459:596–600. doi:10.1038/nature08030. PMID:19387438.
- Haller T, Dietl P, Deetjen P, Volkl H. The lysosomal compartment as intracellular calcium store in MDCK cells: A possible involvement in InsP3-mediated Ca2+ release. Cell Calcium 1996;19:157–65. doi:10.1016/S0143-4160(96)90084-6. PMID:8689673.
- Nair U, Klionsky DJ. Activation of autophagy is required for muscle homeostasis during physical exercise. Autophagy. 2011;7:1405–06. doi:10.4161/auto.7.12.18315. PMID:22082869.
- Varga RE, Khundadze M, Damme M, Nietzsche S, Hoffmann B, Stauber T, Koch N, Hennings JC, Franzka P, Huebner AK, et al. In Vivo Evidence for Lysosome Depletion and Impaired Autophagic Clearance in Hereditary Spastic Paraplegia Type SPG11. PLoS Genet 2015, 11:e1005454. doi:10.1371/journal.pgen.1005454. PMID:26284655.
- Munson MJ, Allen GF, Toth R, Campbell DG, Lucocq JM, Ganley IG. mTOR activates the VPS34-UVRAG complex to regulate autolysosomal tubulation and cell survival. EMBO J 2015;34:2272–90. doi:10.15252/embj.201590992. PMID:26139536.
- Cao Q, Zhong XZ, Zou Y, Zhang Z, Toro L, Dong XP. BK Channels Alleviate Lysosomal Storage Diseases by Providing Positive Feedback Regulation of Lysosomal Ca2+ Release. Dev Cell. 2015;33:427–41. doi:10.1016/j.devcel.2015.04.010. PMID:25982675.
- Miedel MT, Rbaibi Y, Guerriero CJ, Colletti G, Weixel KM, Weisz OA, Kiselyov K. Membrane traffic and turnover in TRP-ML1-deficient cells: a revised model for mucolipidosis type IV pathogenesis. J Exp Med. 2008;205:1477–90. doi:10.1084/jem.20072194. PMID:18504305.
- Samie MA, Grimm C, Evans JA, Curcio-Morelli C, Heller S, Slaugenhaupt SA, Cuajungco MP. The tissue-specific expression of TRPML2 (MCOLN-2) gene is influenced by the presence of TRPML1. Pflugers Arch. 2009;459:79–91. doi:10.1007/s00424-009-0716-5. PMID:19763610.
- Carroll B, Maetzel D, Maddocks OD, Otten G, Ratcliff M, Smith GR, Dunlop EA, Passos JF, Davies OR, Jaenisch R, et al. Control of TSC2-Rheb signaling axis by arginine regulates mTORC1 activity. Elife. 2016;5:e11058. doi:10.7554/eLife.11058.
- Garrity AG, Wang W, Collier CM, Levey SA, Gao Q, Xu H. The endoplasmic reticulum, not the pH gradient, drives calcium refilling of lysosomes. Elife. 2016;5:e15887. doi:10.7554/eLife.15887.
- Lopez-Sanjurjo CI, Tovey SC, Prole DL, Taylor CW. Lysosomes shape Ins(1,4,5)P3-evoked Ca2+ signals by selectively sequestering Ca2+ released from the endoplasmic reticulum. J Cell Sci. 2013;126:289–300. doi:10.1242/jcs.116103. PMID:23097044.
- Phillips MJ, Voeltz GK. Structure and function of ER membrane contact sites with other organelles. Nat Rev Mol Cell Biol. 2016;17:69–82. doi:10.1038/nrm.2015.8. PMID:26627931.
- Wang W, Zhang X, Gao Q, Lawas M, Yu L, Cheng X, Gu M, Sahoo N, Li X, Li P, et al. A voltage-dependent K+ channel in the lysosome is required for refilling lysosomal Ca2+ stores. J Cell Biol. 2017;216(6):1715–30. doi:10.1083/jcb.201612123.