
ABSTRACT
The autophagy-lysosome pathway (ALP) regulates intracellular homeostasis of the cytosolic protein SNCA/alpha-synuclein and is impaired in synucleinopathies, including Parkinson disease and dementia with Lewy bodies (DLB). Emerging evidence suggests that ALP influences SNCA release, but the underlying cellular mechanisms are not well understood. Several studies identified SNCA in exosome/extracellular vesicle (EV) fractions. EVs are generated in the multivesicular body compartment and either released upon its fusion with the plasma membrane, or cleared via the ALP. We therefore hypothesized that inhibiting ALP clearance 1) enhances SNCA release via EVs by increasing extracellular shuttling of multivesicular body contents, 2) alters EV biochemical profile, and 3) promotes SNCA cell-to-cell transfer. Indeed, ALP inhibition increased the ratio of extra- to intracellular SNCA and upregulated SNCA association with EVs in neuronal cells. Ultrastructural analysis revealed a widespread, fused multivesicular body-autophagosome compartment. Biochemical characterization revealed the presence of autophagosome-related proteins, such as LC3-II and SQSTM1. This distinct “autophagosome-exosome-like” profile was also identified in human cerebrospinal fluid (CSF) EVs. After a single intracortical injection of SNCA-containing EVs derived from CSF into mice, human SNCA colocalized with endosome and neuronal markers. Prominent SNCA immunoreactivity and a higher number of neuronal SNCA inclusions were observed after DLB patient CSF EV injections. In summary, this study provides compelling evidence that a) ALP inhibition increases SNCA in neuronal EVs, b) distinct ALP components are present in EVs, and c) CSF EVs transfer SNCA from cell to cell in vivo. Thus, macroautophagy/autophagy may regulate EV protein composition and consequently progression in synucleinopathies.
Abbreviations
| ACTB | = | actin beta |
| ALP | = | autophagy-lysosome pathway |
| ANXA | = | annexin |
| AP(s) | = | autophagosome(s) |
| Baf | = | bafilomycin A1 |
| CALR | = | calreticulin |
| CM | = | conditioned medium |
| CQ | = | chloroquine |
| CSF | = | cerebrospinal fluid |
| CNS | = | central nervous system |
| DB | = | dot blot |
| DIV | = | day in vitro |
| DLB | = | dementia with Lewy bodies |
| ER | = | endoplasmic reticulum |
| EVs | = | extracellular vesicles |
| FLOT1 | = | flotillin 1 |
| FSGB | = | fish skin gelatin buffer |
| HRP | = | horseradish peroxidase |
| HSP | = | heat shock protein |
| ICC | = | immunocytochemistry |
| IHC | = | immunohistochemistry |
| ILVs | = | intralumenal vesicles |
| LAMP | = | lysosomal associated membrane protein |
| MAP1LC3/LC3 | = | microtubule associated protein 1 light chain 3 |
| MAP2 | = | microtubule associated protein 2 |
| MVB | = | multivesicular body |
| NPC | = | neuronal precursor cell |
| PD | = | Parkinson disease |
| PDCD6IP/ALIX | = | programmed cell death 6 interacting protein |
| RAB | = | RAB, member RAS oncogene family |
| Rapa | = | rapamycin |
| Rote | = | rotenone |
| RT | = | room temperature |
| SNCA | = | synuclein alpha |
| SQSTM1/p62 | = | sequestosome 1 |
| TFA | = | trifluoroacetic acid |
| TL | = | ToxiLight (assay) |
| TSG101 | = | tumor susceptibility 101 |
| TUBB3 | = | tubulin beta 3 class III |
| Veh | = | vehicle |
| WB | = | western blot |
| WT | = | wild type |
Introduction
The autophagy-lysosome pathway (ALP) regulates the intracellular homeostasis of the cytosolic protein SNCA/alpha-synuclein,Citation1–Citation5 which is tightly linked to age-related neurodegenerative synucleinopathies, including Parkinson disease (PD) and dementia with Lewy bodies (DLB).Citation6–Citation8 Evidence from post-mortem patient brain tissueCitation2,Citation9–Citation11 and rodent models of synucleinopathyCitation10,Citation12,Citation13 clearly support the notion that ALP impairment is present in synucleinopathies. Intriguingly, we and others have shown that the ALP plays an important role in regulating extracellular SNCA homeostasis by influencing its release,Citation14–Citation18 yet the underlying mechanisms are not well understood. Since SNCA pathology has been proposed to hierarchically spread and propagate in the synucleinopathy mileu,Citation19–Citation21 the elucidation of SNCA release mechanisms is imperative.
SNCA is readily detected in rodent and human body fluids, including the brain interstitial fluidCitation22–Citation25 and shown to be released from cell linesCitation14,Citation15,Citation18 and primary neurons.Citation25 The release of SNCA, as of other cytosolic proteins, does not occur via the endoplasmic reticulum (ER)-Golgi biosynthetic/secretory pathway,Citation14,Citation18,Citation26 but may be, at least in part, mediated by exosomes/other extracellular vesicles (EVs). Importantly, SNCA has been identified in EVs in several in vitro models of transient or stable SNCA overexpression,Citation14,Citation16–Citation18,Citation27 and more recently, in EVs isolated from human cerebrospinal fluid (CSF).Citation27,Citation28
EVs are generated as vesicles within the lumen of the maturing late endocytic/multivesicular body (MVB) compartment, and released upon fusion of MVBs with the plasma membrane.Citation29 EVs play an important role for intercellular communication in the central nervous system (CNS) (reviewed in Citationref. 30). Recently, SNCA was shown to associate with the MVB compartment at an ultrastructural level,Citation31 in a process involving the endosomal sorting complex required for transport (ESCRT) complex.Citation27,Citation31 In addition, the MVB resident protein ATP13A2/PARK9 (ATPase 13A2) regulates SNCA release via EVs.Citation32 Instead of releasing EVs, MVBs may be cleared via the ALP by fusing directly with lysosomes or autophagosomes (APs).Citation33–Citation35 The implications of this dynamic ALP-MVB interaction for SNCA release via EVs, especially under impaired ALP function, have not been addressed.
We previously reported that ALP inhibition in vitro and in vivo increases extracellular SNCA levels, leading to toxicity and inflammatory responses, particularly in cells residing in close proximity to SNCA-releasing cells.Citation15 In the present study, we hypothesized that ALP inhibition enhances SNCA release by stimulating the extracellular shuttling of MVB contents. Since MVBs may fuse with lysosomes and autophagosomesCitation33–Citation35 we reasoned that ALP inhibition may also alter the biochemical profile of released EVs. Last, the potential of EVs as contributors to the cell-to-cell transfer of SNCA was addressed in vivo.
Here we show that ALP inhibition increases the ratio of extra- to intracellular SNCA and upregulates SNCA association with EVs in neuronal cells. Ultrastructural analysis revealed a widespread, fused MVB-AP compartment. Intriguingly, EVs released under ALP inhibition showed typical EV ultrastructural morphology, but were biochemically characterized by the presence of LC3-II and SQSTM1, among other AP-related proteins, together with classical MVB-EV markers such as FLOT1 (flottillin 1). More importantly, this hybrid autophagosome-exosome-like profile was identified in CSF EVs from PD patients and control subjects. Finally, after intracortical injection of CSF-derived EVs into mice, human SNCA colocalized with endosome and neuronal markers. In addition, prominent SNCA immunoreactivity and a higher number of neuronal SNCA inclusions were observed upon injection of EVs derived from DLB patient CSF. By showing its role in regulating EV protein composition, this study places autophagy at the hub of mechanisms governing intracellular SNCA homeostasis and intercellular communication, and uncovers its disease-modifying potential in synucleinopathies.
Results
ALP inhibition enhances SNCA release
The effect of ALP inhibition on SNCA release was investigated in human neuroglioma (H4) cells and E18 rat primary cortical neuron cultures (). In the H4 cell model, human wild-type SNCA was stably and homogeneously overexpressed (“SNCA H4” cells, see Materials and Methods), whereas in the corresponding nontransgenic cells (“CTR H4”), endogenous SNCA expression was below the detection limit with immunocytochemistry (ICC) and western blot (WB) (A, C). Neuronal cultures were prepared from WT rats or the recently published bacterial artificial chromosome (BAC) SNCA transgenic rat model of synucleinopathy (SNCA-tg), which carries the full-length human wild-type SNCA locus.Citation36,Citation37 In SNCA-tg neuronal cultures SNCA was moderately overexpressed by 2.5 fold as compared to WT cultures, in which the protein was endogenously expressed (B, D).
Figure 1. ALP inhibition enhances SNCA release. (A, B) ICC showing increased expression and homogeneous SNCA distribution in SNCA-overexpressing H4 cells (SNCA H4 compared to CTR H4) and neurons (SNCA-tg compared to WT). TUBB3 or GFP were used to visualize cellular outline. Scale bar: 10 µm. SNCA expression was also examined by WB analysis of cell lysate from H4 cells (C) or neurons (D). SNCA is not detectable in CTR H4, therefore quantification was not applicable. SNCA-tg neurons overexpress the protein by 2.5 fold compared to WT (*p = 0.024, N = 3). ACTB or TUBB3 were used as loading controls. (E) Dot blot analysis of SNCA H4 conditioned medium (CM) shows that relative total extracellular SNCA levels increase by treatment with the ALP inhibitors Baf and CQ over the corresponding Veh, which is plotted as a dotted line. (For Baf: *p<0.05, with 2 nM N = 7, 10 nM N = 6, 20 and 200 nM N = 5, one sample t test; for 50 µM CQ: **p<0.008, N = 4, one sample t test.) (F) Total extracellular SNCA was assessed by ultra-sensitive ELISA, and values were normalized to total cell protein of the corresponding lysate. With 20 nM Baf or 50 µM CQ, an approximately 3-fold SNCA increase over Veh was measured (for Baf: **p = 0.002, N = 3; for CQ: *p = 0.013, N = 4). (G) The ratio of extracellular:intracellular SNCA was calculated from the ELISA measurements. Baf (20 nM) and CQ (50 µM) increased by approximately 4 fold the percent SNCA amount present extracellularly over intracellularly. (For Baf: ***p = 0.0003, N = 3; for CQ: ** p = 0.007, N = 4.)
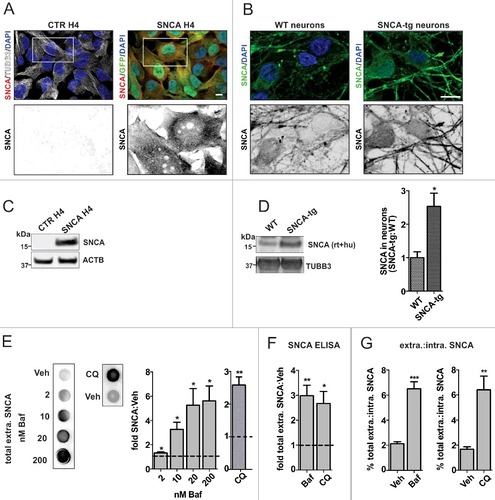
Initially, total extracellular SNCA was examined by dot blot (DB) analysis of H4 conditioned medium (CM; E). Treatment with 2–200 nM of the ALP inhibitor bafilomycin A1 (Baf) upregulated SNCA levels up to approximately 5-fold. We noted that the increase started at 2 nM and reached a maximum at 20 nM Baf, without further increase at 200 nM. Treatment with 50 µM of the ALP inhibitor chloroquine (CQ) also upregulated total extracellular SNCA levels by 2.5-fold. Assessment of toxicity by ToxiLight showed that ALP inhibition compromised membrane integrity in H4 cells (Fig. S1A) and neuronal cultures (Fig. S1C). Complementarily, cell number and trypan blue permeability were used to indicate cell viability (Fig. S1B). We found that 20 nM Baf led to approximately 20% fewer cells while no cell loss was observed with CQ (Fig. S1B). In each of the conditions assessed, more than 95% of cells detected were trypan blue negative, and therefore intact (Fig. S1B).
In order to address whether the equilibrium of intracellular expression and SNCA release is altered by ALP inhibition, we used an ultra-sensitive ELISA. With this quantitative method we confirmed that Baf and CQ increased total extracellular SNCA (F). In contrast to these compounds, the ALP inducer rapamycinCitation10 (Rapa) had no influence on extracellular SNCA levels (Fig. S2A). All 3 compounds had only moderate effects on the intracellular SNCA levels (Fig. S2B). Interestingly, a comparison of the ratio (expressed as percentage) of total extracellular over total intracellular SNCA showed that ALP inhibition led to a significant increase, suggesting that SNCA release was enhanced (G). Because total extracellular SNCA of CTR H4 cells was below the ELISA detection limit (data not shown), we did not further investigate the effect of ALP inhibition on SNCA release in this system.
SNCA is released via EVs
SNCA has been identified in EV fractions derived from cell culture medium, including exosomes and other nanovesicles, in several cell line models of SNCA overexpression.Citation14,Citation17,Citation38 We initially isolated and morphologically characterized EV fractions from the CM of H4 cells and neuronal cultures via ultracentrifugation. For this experiment, cells were treated with vehicle (Veh) or 20 nM Baf, because this concentration had the maximum effect on total extracellular SNCA levels (E). Ultrastructural analysis showed that the fractions contained vesicles with a diameter ranging from 60 to 160 nm (for details on size distribution see Fig. S3A-C), and typical EV morphology (Fig. S3). The association of SNCA with EVs released from SNCA H4 cells was visualized by immuno-gold electron microscopy, in which gold particle-labeled SNCA was found on the EV membrane and lumen (A). We observed that under basal conditions (Veh) approximately 7% of EVs were positive for gold particle-labeled SNCA, whereas this percentage increased to 35% under Baf treatment (A). To further examine whether SNCA was indeed present both on the EV membrane and inside the lumen, EVs were treated with 100 mM Na2CO3 at pH 11 (B). This procedure makes it possible to distinguish, after ultracentrifugation, the EV membrane (pellet) from the lumen (supernatant). SNCA was present in both fractions under Veh conditions, in agreement with previous reports,Citation14,Citation39 and increased in both fractions when treated with Baf (B). This finding suggested that a fraction of EV-associated SNCA is embedded in the EV membrane while the other fraction is lumenal.
Figure 2. SNCA release via EVs. (A) SNCA H4 cells were treated with Veh or 20 nM Baf, and EVs were isolated by ultracentrifugation. We observed SNCA-6-nm gold particle-positive EVs (examples are indicated by white arrows). Eight immuno-EM micrographs of approximately 0.3 µm2 area were analyzed, and Baf was found to increase SNCA-gold-positive EVs by 5 fold (****p<0.0001, N = 130 EVs). Scale bar: 50 nm. (B) EVs were treated with Na2CO3 and the soluble (sol.) and membrane (memb.) fractions were analyzed on the same WB. SNCA was detected in both fractions and increased by Baf (low “l” and higher “h” signal exposures are shown). (C) EVs were isolated from identical volumes of a single CM preparation, by either ultracentrifugation (ucf) or immuno-isolation (magnetic beads coupled to human tetraspanins CD9, CD63, CD81). Equal volumes were analyzed on the same WB and SNCA was identified in both EV preparations. EVs were positive for the MVB-EV marker FLOT1. The specific FLOT1 band is indicated by the arrow, because in immuno-isolated EVs an additional band was observed (indicated by the asterisk) at approximately 53 kDa. This band probably represents the immunoglobulin signal from the antibodies attached to the immuno-isolation beads. (D) Graphs show SNCA and FLOT1 immuno-reactivity normalized to the mean values measured in CD9-CD63-CD81+ EVs (and therefore represents “relative” levels). Baf led to approximately 4-fold higher SNCA levels (F[3,16] = 16.46, ****p<0.0001 with N = 5, one way ANOVA, where the F ratio is reported as degrees of freedom [between columns] and residual [random] degrees of freedom) and 1.5-fold higher FLOT1 levels (F[3,16] = 7.382, **p = 0.0025 with N = 5, one way ANOVA). (E) SNCA H4 cells were treated with Veh or 20 nM Baf and a volume of 2 mL SNCA H4 CM (containing EVs) was mixed with 2 mL EV-depleted CM from the identical preparation (containing “free” SNCA but no EVs). As control (ctr), the 2 mL of SNCA H4 CM were mixed with 2 mL unconditioned medium (containing no SNCA and no EVs). After incubation at 37 °C for 24 h, EVs were immuno-isolated and analyzed by WB. Graphs show fold SNCA and FLOT1 immuno-reactivity normalized to the mean values of Veh condition. SNCA within EVs was not altered by the addition of free SNCA (F[3,18] = 6.038, p = 0.005 with N = 7 for Veh and N = 4 for Baf, and Tukey´s post-hoc indicated a statistically significant difference for Veh vs. Baf but not for ctr vs. free SNCA comparisons). (F) After treatment with 20 nM Baf or 300 nM Rote, EVs were immuno-isolated and analyzed by WB. Baf led to a robust increase in SNCA levels, whereas Rote had only a moderate influence (F[2,9] = 38.37, p<0.0001 with N = 4, and Tukey´s post-hoc indicated a statistically significant difference for the Veh vs. Baf and Baf vs. Rote comparisons). FLOT1 appeared upregulated by Baf but not Rote (F[2,9] = 2.541, p>0.05 with N = 4).
![Figure 2. SNCA release via EVs. (A) SNCA H4 cells were treated with Veh or 20 nM Baf, and EVs were isolated by ultracentrifugation. We observed SNCA-6-nm gold particle-positive EVs (examples are indicated by white arrows). Eight immuno-EM micrographs of approximately 0.3 µm2 area were analyzed, and Baf was found to increase SNCA-gold-positive EVs by 5 fold (****p<0.0001, N = 130 EVs). Scale bar: 50 nm. (B) EVs were treated with Na2CO3 and the soluble (sol.) and membrane (memb.) fractions were analyzed on the same WB. SNCA was detected in both fractions and increased by Baf (low “l” and higher “h” signal exposures are shown). (C) EVs were isolated from identical volumes of a single CM preparation, by either ultracentrifugation (ucf) or immuno-isolation (magnetic beads coupled to human tetraspanins CD9, CD63, CD81). Equal volumes were analyzed on the same WB and SNCA was identified in both EV preparations. EVs were positive for the MVB-EV marker FLOT1. The specific FLOT1 band is indicated by the arrow, because in immuno-isolated EVs an additional band was observed (indicated by the asterisk) at approximately 53 kDa. This band probably represents the immunoglobulin signal from the antibodies attached to the immuno-isolation beads. (D) Graphs show SNCA and FLOT1 immuno-reactivity normalized to the mean values measured in CD9-CD63-CD81+ EVs (and therefore represents “relative” levels). Baf led to approximately 4-fold higher SNCA levels (F[3,16] = 16.46, ****p<0.0001 with N = 5, one way ANOVA, where the F ratio is reported as degrees of freedom [between columns] and residual [random] degrees of freedom) and 1.5-fold higher FLOT1 levels (F[3,16] = 7.382, **p = 0.0025 with N = 5, one way ANOVA). (E) SNCA H4 cells were treated with Veh or 20 nM Baf and a volume of 2 mL SNCA H4 CM (containing EVs) was mixed with 2 mL EV-depleted CM from the identical preparation (containing “free” SNCA but no EVs). As control (ctr), the 2 mL of SNCA H4 CM were mixed with 2 mL unconditioned medium (containing no SNCA and no EVs). After incubation at 37 °C for 24 h, EVs were immuno-isolated and analyzed by WB. Graphs show fold SNCA and FLOT1 immuno-reactivity normalized to the mean values of Veh condition. SNCA within EVs was not altered by the addition of free SNCA (F[3,18] = 6.038, p = 0.005 with N = 7 for Veh and N = 4 for Baf, and Tukey´s post-hoc indicated a statistically significant difference for Veh vs. Baf but not for ctr vs. free SNCA comparisons). (F) After treatment with 20 nM Baf or 300 nM Rote, EVs were immuno-isolated and analyzed by WB. Baf led to a robust increase in SNCA levels, whereas Rote had only a moderate influence (F[2,9] = 38.37, p<0.0001 with N = 4, and Tukey´s post-hoc indicated a statistically significant difference for the Veh vs. Baf and Baf vs. Rote comparisons). FLOT1 appeared upregulated by Baf but not Rote (F[2,9] = 2.541, p>0.05 with N = 4).](/cms/asset/f1fd9dff-db02-49d9-a7f5-0a4787a222a3/kaup_a_1395992_f0002_b.gif)
Ultracentrifugation is a robust method used for EV isolation, yet it remains unclear whether SNCA is released from the cell via EVs or associates with them as a methodological consequence of ultracentrifugation. We addressed this question using EV immuno-isolation, as a method complementary to ultracentrifugation. A single preparation of SNCA H4 conditioned medium (CM) was separated in identical volumes and EVs were collected either after ultracentrifugation or after positive selection for presence of the tetraspanins CD9, CD63 and CD81 which are putative EV markers (C). SNCA was clearly detected in EVs isolated by both methods (C). Using WB analysis we estimated that ultracentrifugation enriched by 2-fold the amount of SNCA in EVs (C, B). Within EVs from both methods, approximately 4-fold SNCA upregulation was quantified under Baf treatment (C, D). In addition, we observed that ultracentrifugation led to approximately 2.5-fold lower levels of the MVB-EV marker FLOT1 as compared to immuno-isolation (C, D). Within EVs from both methods, approximately 1.5-fold FLOT1 upregulation was quantified under Baf treatment (A, B). Overall these data indicate that ultracentrifugation moderately enriches the SNCA amount associating with EVs. Nevertheless, regardless of the method applied, Baf treatment robustly upregulated SNCA within EVs.
In order to address the possibility that SNCA associates with EVs in the CM, we examined whether increasing the amount of “free” (non EV-associated) SNCA in the CM would also increase SNCA within EVs (E). For this purpose, SNCA H4 cells were treated with Veh or Baf, and CM was complemented with either EV-depleted CM from the identical preparation (containing “free” SNCA) or unconditioned medium as control (E). After incubation, EVs were immuno-isolated and analyzed by WB. No alteration of SNCA levels within EVs was observed (E), indicating that in our paradigm, SNCA is released via EVs under basal and Baf treatment conditions and its levels are not affected by extracellular interaction of SNCA with EVs.
Subsequently, we examined whether the increased SNCA within EVs measured after Baf treatment is a consequence of the cellular loss (20%) observed with 20 nM treatment of the compound (S1B). To this end, the mitochondrial toxin rotenoneCitation40,Citation41 (Rote) was used in parallel to the 20 nM Baf and their effect in SNCA release was studied. Rote was used at 300 nM, a concentration at which mitochondrial morphology was affected (Fig. S4) and a reduction of cell number comparable to 20 nM Baf was measured (Fig. S1B). Dot blot quantification indicated approximately 2.5-fold higher total extracellular SNCA levels after treatment with Rote, whereas a 5-fold increase was measured with Baf (Fig. S5B). Intracellularly, Rote moderately upregulated SNCA levels by 1.2-fold according to WB analysis (Fig. S5A). Notably, Rote only marginally increased SNCA within EVs, whereas Baf led to a 4-fold increase (F). FLOT1 also appeared upregulated by Baf, albeit to a lesser extent. Consequently increased extracellular SNCA levels following Baf treatment is primarily attributed to ALP inhibition.
EVs released under ALP inhibition contain higher SNCA cargo
We then investigated SNCA levels in SNCA H4 EVs under basal and ALP inhibition conditions throughout a 2–200 nM Baf range. We observed a Baf concentration-dependent increase of SNCA in EVs (A), starting from 2 nM and reaching a maximum at 20 nM Baf, whereas 200 nM Baf did not lead to a further increase. Despite the increase of SNCA in EV fractions within this Baf concentration range, there was not a robust alteration in the activity of the EV-associated enzyme ACHE (acetylcholinesterase [Cartwright blood group]) (B), suggesting that EV abundance was not notably affected.Citation42 The biochemical profile of EVs was assessed by WB, after treatment with Veh, or 2 or 20 nM Baf (C). All fractions were positive for the MVB-EV markers FLOT1, CD81 and RAB11 (RAB11, member RAS oncogene family) (C). The ER marker CALR (calreticulin) and the mitochondrial chaperone HSPD1/HSP60 were both absent from the EVs, while abundant in the corresponding lysate, supporting the purity of the EV preparation (C). Using ultra-sensitive ELISA we confirmed that 20 nM Baf and CQ increased SNCA levels in SNCA H4 EVs, up to 5- or 4-fold, respectively (D). The fold SNCA increase was more prominent in the EV as compared to the total extracellular fraction for both Baf and CQ (E; also reflected by the increased percent of extracellular SNCA associating with EVs in Fig. S2B). Extracellular SNCA levels were overall not altered by the ALP inducer Rapa (Fig. S2A) and consequently, the compound did not influence the dynamics of total to EV-associated SNCA levels. The data support the idea that EV-associated SNCA release is particularly stimulated under conditions of ALP inhibition. Importantly, SNCA was found to be released via EVs in primary neuronal cultures (F). ALP inhibition with 20 nM Baf led to a robust 2-fold increase of SNCA in WT neuron EVs, and a 1.4-fold increase in SNCA-tg neurons. Furthermore, SNCA was found in association with nanovesicle fractions from the human CSF of control subjects and DLB patients (G). By WB analysis we confirmed that SNCA was present in these fractions, along with the MVB-EV markers PDCD6IP/ALIX, CD81 and CD63, whereas its levels appeared elevated in DLB CSF EV samples (H).
Figure 3. ALP inhibition particularly stimulates SNCA release in EVs. SNCA H4 cells were treated with the indicated compounds and EVs were isolated by ultracentrifugation. (A) WB analysis of equal EV volumes shows increased SNCA levels under 2–200 nM Baf treatment (F[4,25] = 5.903, **p = 0.002 with N ≥5, one way ANOVA). (B) ACHE assessment of equal EV volumes was performed to estimate EV abundance across different Baf concentration conditions. Baf did not lead to statistically significant changes (F[4,19] = 1.811, p>0.05 with N ≥5, one way ANOVA). (C) WB analysis confirming SNCA H4 EV fraction purity. EVs are positive for MVB-EV markers (FLOT1, RAB11 and CD81), but negative for ER (CALR) or mitochondria (Mito) marker (HSPD1/HSP60). All markers were identified in corresponding lysates (“cells”), which were analyzed on the same gel and shown for an identical exposure time (boxed). (D) SNCA was assessed by ELISA in sonicated EVs and values were normalized to total cell protein of the corresponding lysate. Baf (20 nM) and CQ (50 µM) increased SNCA levels by approximately 4 fold over Veh (dotted line) (for Baf: ***p = 0.0003, N = 3; and for CQ: *p = 0.035, N = 3). (E) The fold SNCA increase (by ELISA) in the total extracellular versus the EV fraction was statistically compared for 20 nM Baf or CQ. The increase was more prominent in the EV fraction (for Baf: *p = 0.032, N = 3; for CQ p>0.05, N = 3). (F) WB analysis of SNCA in equal EV volumes from neuronal cells. Application of 20 nM Baf increases SNCA over Veh (dotted line) in both WT and SNCA-tg neuronal culture EVs (*p = 0.023, N = 3). (G) SNCA immuno-gold labeling (lower panel) shows 10-nm gold particles, representing SNCA, in association with CSF EVs. Scale bar: 75 nm. (H) CSF EV fractions from control subjects and DLB patients are positive for SNCA and MVB-EV markers (PDCD6IP, CD81 and CD63).
![Figure 3. ALP inhibition particularly stimulates SNCA release in EVs. SNCA H4 cells were treated with the indicated compounds and EVs were isolated by ultracentrifugation. (A) WB analysis of equal EV volumes shows increased SNCA levels under 2–200 nM Baf treatment (F[4,25] = 5.903, **p = 0.002 with N ≥5, one way ANOVA). (B) ACHE assessment of equal EV volumes was performed to estimate EV abundance across different Baf concentration conditions. Baf did not lead to statistically significant changes (F[4,19] = 1.811, p>0.05 with N ≥5, one way ANOVA). (C) WB analysis confirming SNCA H4 EV fraction purity. EVs are positive for MVB-EV markers (FLOT1, RAB11 and CD81), but negative for ER (CALR) or mitochondria (Mito) marker (HSPD1/HSP60). All markers were identified in corresponding lysates (“cells”), which were analyzed on the same gel and shown for an identical exposure time (boxed). (D) SNCA was assessed by ELISA in sonicated EVs and values were normalized to total cell protein of the corresponding lysate. Baf (20 nM) and CQ (50 µM) increased SNCA levels by approximately 4 fold over Veh (dotted line) (for Baf: ***p = 0.0003, N = 3; and for CQ: *p = 0.035, N = 3). (E) The fold SNCA increase (by ELISA) in the total extracellular versus the EV fraction was statistically compared for 20 nM Baf or CQ. The increase was more prominent in the EV fraction (for Baf: *p = 0.032, N = 3; for CQ p>0.05, N = 3). (F) WB analysis of SNCA in equal EV volumes from neuronal cells. Application of 20 nM Baf increases SNCA over Veh (dotted line) in both WT and SNCA-tg neuronal culture EVs (*p = 0.023, N = 3). (G) SNCA immuno-gold labeling (lower panel) shows 10-nm gold particles, representing SNCA, in association with CSF EVs. Scale bar: 75 nm. (H) CSF EV fractions from control subjects and DLB patients are positive for SNCA and MVB-EV markers (PDCD6IP, CD81 and CD63).](/cms/asset/3bbc9dba-fdeb-47f8-b440-4e66c88b5f68/kaup_a_1395992_f0003_b.gif)
A widespread, fused MVB-AP compartment is observed under ALP inhibition
EVs are generated in the MVB compartment which is degraded via the ALP.Citation34,Citation35,Citation43 We therefore investigated the consequence of ALP inhibition for APs and MVBs at an ultrastructural level in H4 cells (A, B). APs (A Veh, left) and MVBs containing intralumenal vesicles (ILVs) (A, Veh, right) can be clearly defined under basal conditions. APs and MVBs were between 800 nm–1 µm in diameter (C). Upon ALP inhibition with 20 nM Baf, we observed a marked accumulation of vesicular structures with intralumenal content including proteins, nonprocessed cytoplasmic parts as well as small ILVs (Baf, B). These structures therefore represented a fused MVB-AP compartment, which was spread throughout the cell (Baf, B and S6). The individual vesicles of the compartment ranged between 800 nm to 1.6 µm in diameter (C).
Figure 4. Fused MVB-autophagosome compartment under ALP inhibition. H4 cells were treated with Veh or 20 nM Baf. (A) White arrows indicate an autophagosome (AP) (left) and a MVB (right), which are clearly distinguished under basal conditions (Veh). For an impression of the whole cytoplasm see Fig. S6A. Bar: 500 nm. (B) Baf leads to a widespread, fused AP-MVB compartment throughout the cytoplasm (also see Fig. S6A). The individual vesicles show characteristics of both APs and MVBs, because both cytoplasm and smaller vesicles resembling MVB intralumenal vesicles are present. Additionally, these structures are fused to one another. The enlarged frame on the right shows an example. Bar: 500 nm. (C) The size of the different intracellular structures is depicted. Under Veh, 11 autophagosomes (4 individual cells) and 2 MVBs were measured (2 individual cells, their definition was only possible at high magnification). Under Baf, 58 fused AP-MVB structures were measured (5 individual cells). (D) ICC analysis of the autophagy receptor protein SQSTM1, which accumulated in a punctate pattern under Baf. The number of SQSTM1 puncta per cell, analyzed by ImageJ, was increased (****p<0.0001, Veh N = 58 and Baf N = 55 individual cells were measured). Bar: 10 µm. (E) ALP flux was also analyzed by WB, for levels of SQSTM1 and autophagosome membrane marker LC3-II. The level of these markers was increased (*p = 0.026, N = 6), indicating that 20 nM Baf inhibited ALP flux.
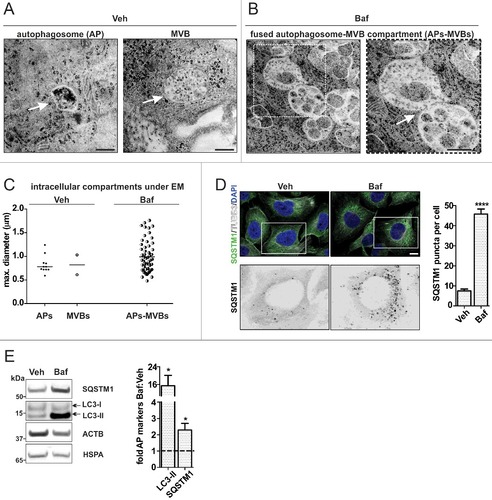
To determine whether the ultrastructural alteration was due to the expected inhibition of ALP clearance by Baf, we examined the distribution and levels of SQSTM1 (sequestosome 1) and MAP1LC3A/B (microtubule associated protein 1 light chain 3 alpha/beta; indicated as LC3-I/II on WBs), 2 protein markers used to indicate ALP flux.Citation44 ICC analysis showed that under Baf treatment, SQSTM1 accumulated throughout the cell in a punctate pattern (D). After WB analysis, we found that both SQSTM1 and the AP membrane-conjugated LC3-II form accumulated in the lysate under Baf treatment (E). These data confirmed that ALP clearance was inhibited by Baf.
LC3-II and SQSTM1 are protein components of neuronal EVs and become enriched during ALP inhibition
After observing the fused MVB-AP compartment, we hypothesized that AP proteins may also be shuttled extracellularly via EVs. We focused on the autophagy receptor protein SQSTM1Citation45 and the LC3-II form of LC3, which is conjugated with phosphatidylethanolamine on the phagophore and AP membrane.Citation46 SNCA H4 cells were treated with Veh, or 2 or 20 nM Baf because these concentrations represented the robust Baf effect range for SNCA release, and EVs were analyzed by WB (A). Comparing the WB pattern of LC3 between EVs and the corresponding lysates, we noted that specifically the LC3-II form was present in EVs following treatment with 20 nM Baf, whereas the cytosolic LC3-I form was only marginally detectable (A). All EV fractions were positive for FLOT1 and negative for CALR (A), confirming EV purity.
Figure 5. Increased autophagosome features in H4 EVs under ALP inhibition. SNCA H4 cells were treated with 2 or 20 nM Baf. (A) The lysate (cells) and corresponding EVs (equal volumes) were analyzed on the same WB. Note that in EVs, the ALP markers LC3-II and SQSTM1 are clearly identified under 20 nM Baf treatment. EV purity was confirmed by the presence of FLOT1 and the absence of CALR. The EV protein composition was further addressed after 20 nM Baf, 50 µM CQ or 200 ng/mL Rapa, in CTR H4 and SNCA H4 cells. (B) Equal EV volumes from both cell populations were analyzed on the same blot. The ALP markers LC3-II and SQSTM1 appeared exclusively under Baf and CQ, but not Rapa. The ALP-related marker GAPDH was present in all fractions. EV purity was confirmed by the presence of FLOT1 and PDCD6IP. (C-D) GAPDH levels in EVs were upregulated by Baf, without reaching statistical significance (p>0.05, N = 3 by one sample t test). FLOT1 levels in EVs were also upregulated over Veh (dotted line) by Baf and CQ, but not Rapa, in both cell populations (for CTR H4 Baf: *p = 0.047, N = 8; for SNCA H4 Baf **p = 0.003, N = 9 by one sample t test; for CQ: p>0.05, N = 4 by one sample t test; for Rapa: p>0.05, N = 3 by one sample t test).
To investigate the AP protein markers LC3-II and SQSTM1 in EVs in greater detail, we compared EV protein profile under treatment with Baf, CQ (ALP inhibitors) and Rapa (ALP inducer) (B-D, and see Figs. S6B-E and S7 for details on ALP flux effects). Both CTR H4 and SNCA H4 EVs were used, so as to address the potential influence of SNCA overexpression on EV protein profile. LC3-II and SQSTM1 were identified in EVs under Baf and CQ treatment, but not under Veh or Rapa (C). In addition, we examined the cytosolic protein GAPDH which, like SNCA, is cleared via the ALP but was also shown to associate with MVBs.Citation47 GAPDH was detected in EVs under all conditions and its levels over the corresponding Veh were notably increased by Baf in CTR H4 and SNCA H4 EVs (C). CQ increased GAPDH in SNCA H4 EVs but only marginally in CTR H4. No change was observed with Rapa (C). The levels of the MVB-EV marker FLOT1 were also robustly upregulated by Baf, and the change was more prominent in SNCA H4 compared to CTR H4 EVs (D). Neither CQ nor Rapa led to a significant effect on FLOT1 EV levels (D). Notably, using immuno-isolation we validated that SNCA, LC3-II and SQSTM1 were present within the same CD9-CD63-CD81-positive EVs (Fig. S5C). A 2.5-fold upregulation of SQSTM1 was observed under Baf but not Rote treatment. Moreover, in these immuno-isolated EVs, SQSTM1 was detected also in Veh EVs, probably due to the more sensitive signal detection method used (also see Materials and Methods; Fig. S5C). Last but not least, LC3-II was exclusively detected in Baf EVs (Fig. S5C).
For further insight into the EV protein composition, mass spectrometric analysis of EVs derived from Veh or Baf-exposed H4 cells was performed (). In addition to the aforementioned MVB-EV markers FLOT1, CD81 and PDCD6IP, TSG101 was also present in Veh and 20 nM Baf EVs (). Moreover, heat shock proteins HSPA/HSP70 and HSP90 as well as ANXAs (annexins) were identified under both conditions (). Importantly, several ALP-related protein components were identified in EVs exclusively under Baf treatment, namely VPS35 (VPS35, retromer complex component), ATP6V1A (ATPase H+ transporting V1 subunit A) and LAMP2 ().
Table 1. Selected set of proteins identified by mass spectrometry in H4 EVs
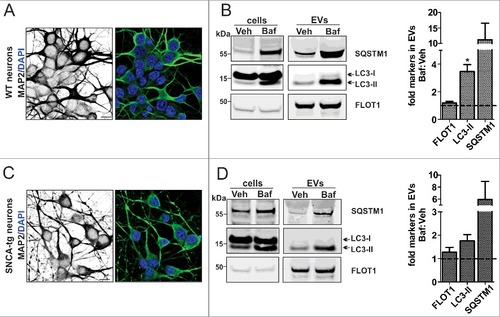
Finally, we examined the effect of ALP inhibition on the EV protein profile using rodent neuronal precursor cells (NPCs; Fig. S8) and neuronal cultures (). In NPCs, LC3-II positive EVs were also observed under Veh and notably increased with 20 nM Baf (Fig. S8B). SQSTM1 was not examined in these cells due to low endogenous levels at basal conditions. Instead, the lysosome and late endosome marker LAMP133 was examined, and found to be upregulated by Baf (Fig. S8B). Interestingly, we noted that in WT and SNCA-tg neuronal cultures (A, C), both LC3-II- and SQSTM1-positive EVs were present under Veh conditions and significantly elevated by Baf (B, D). FLOT1 was present in both fractions. Also in this paradigm, by comparing the LC3 WB pattern with the corresponding lysate we noted that specifically LC3-II was present in EVs (B, D). Taken together, the data suggested that independent of SNCA overexpression, ALP inhibition leads to the release of EVs, which exhibit both a classical MVB-EV protein profile (FLOT1, among others) and an additional, AP-like protein profile (LC3-II and SQSTM1, among others).
Figure 6. Increased autophagosome features in neuronal EVs under ALP inhibition. (A, C) ICC analysis of the neuronal marker MAP2 in WT and SNCA-tg neuronal cultures. (B, D) After application of 20 nM Baf, the lysate (cells) and corresponding EVs (equal volumes) were analyzed on the same WB. Note that in EVs, the ALP markers LC3-II and SQSTM1 are identified in both the Veh and 20 nM Baf condition. The quantification shows that these proteins are increased by Baf:Veh (dotted line) (*p = 0.038, N = 3, one sample t test). Levels of FLOT1 were not significantly altered (p>0.05, N = 3, one sample t test). The accumulation of LC3-II and SQSTM1 in the corresponding lysate confirmed ALP inhibition in both cell populations.
Human CSF EVs are LC3-II and SQSTM1 positive
The human cerebrospinal fluid (CSF) is derived from the choroid plexus of the central nervous system (CNS)Citation48 and reflects biochemical changes within the CNS. The CSF contains EVsCitation27,Citation49,Citation50 and EV-associated SNCA.Citation28 We investigated whether the ALP-related protein pattern of H4 and neuronal culture EVs was also exhibited by CSF EVs from PD patients and neurological controls (, subjects 7–12). We were able to collect and analyze CSF EVs from a volume of 1.4 to 4 mL of total CSF (A-C), which was important considering the limited availability of this biological fluid for routine testing (optimized final conditions are in the Materials and Methods). We examined 18 (out of 30) µL of the CSF EV fraction (containing approximately 2–4 µg protein) by WB (B, C). The FLOT1-positive fractions were also found positive for LC3-II, SQSTM1 and LAMP2A validating the conclusion that ALP-related proteins constitute the proteome also of PD patient and control CSF EVs (B, C and see Fig. S9 for the WB in detail). It is noteworthy and demonstrated in C (ii) that 2.5 mL CSF may be the limiting volume for obtaining a robustly detectable signal for LC3, whereas 1.4 mL (i) may be too low. For FLOT1, SQSTM1 and LAMP2A 1.4 mL was still sufficient for detection via WB.
Table 2. Demographics and comorbidities
Figure 7. Human CSF contains LC3-II- and SQSTM1-positive EVs. (A) EV isolation workflow. Total CSF was either centrifuged at 10,000 × g or filtered through 0.2-µm filter, followed by ultracentrifugation. All biochemical assays were performed after 1 or 2 cycles of freeze/thawing of the CSF-derived EVs. (B) WB analysis of EVs and total CSF from PD patients (, subjects 9–12). LC3-II and SQSTM1 was identified in the CSF-derived EVs isolated from 2.5 – 4 mL. FLOT1 indicates EV enrichment. EVs from 20 nM Baf-treated cells (H4 EVs) were used as a reference. A blot only probed with mouse IgG secondary antibody was simultaneously developed as control for FLOT1 specificity. Nonspecific bands are marked with an asterisk and specific bands are shown by the arrow (the original blot for 2 different exposures can be seen in Fig. S9). (C) WB analysis of CSF-derived EVs from 2 control subjects (, subjects 7, 8). EV samples collected from an initial volume of (i) 1.4 mL or (ii) 2.5 mL of total CSF were analyzed.
In additional samples obtained from PD patients and control subjects, SNCA in CSF EVs was measured by ELISA (, subjects 13–24) and the relative levels of SQSTM1 were analyzed by WB (, subjects 19–24 in Fig. S9B-D). We noted that SNCA levels were reduced in PD CSF EVs, in agreement with previously published findings.Citation28 Moreover, the mean SQSTM1 immuno-reactivity was marginally upregulated in PD as compared to control CSF EVs (Fig. S9B-C). Nevertheless, a quantitative comparison of the aforementioned proteins in CSF EVs demands an adequate number of samples to be systematically analyzed and goes beyond the objectives of the current study.
CSF EVs are involved in the cell-to-cell transfer of SNCA in vivo
CSF EV-associated SNCA from synucleinopathy patients was recently shown to potentiate endogenous SNCA aggregation in vitro.Citation28 Whether human CSF EV-associated SNCA can be transferred to recipient cells in vivo is not known. To address this question, we initially asked whether EVs released in cell culture interact with recipient cells. Cholesterol-labeled H4 EVs were administered to CTR H4 cells for 3 h. The fluorescent signal distribution in the recipient cell population was analyzed by flow cytometry (Fig. S10A-C) and a clear shift in mean intensity per cell was measured. Moreover, we found that Baf but not Rapa EVs decreased cell membrane integrity, according to ToxiLight (TL) assay (Fig. S10D). These observations suggested that labeled EVs may interact with the recipient cell population.
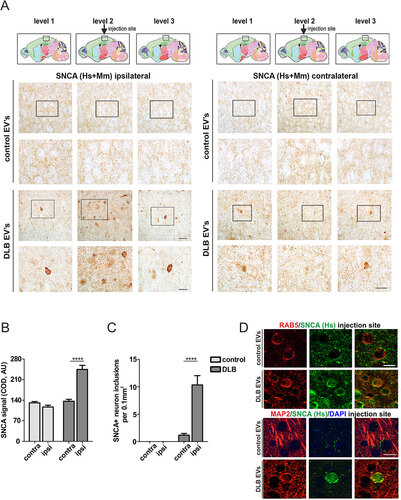
We then proceeded with the injection of CSF EVs from DLB patients or control subjects (subjects 1 to 6) into 8-mo-old mouse brain. Four wk post injection, SNCA in the neuropil was analyzed by immunohistochemistry (IHC) at the sides ipsi- and contralateral to the injection site (A). We noted that qualitatively, SNCA staining at the ipsilateral side appeared more intense close to the injection site (level 2) and attenuated in adjacent (levels 1 and 3) brain regions (A) in the case of DLB CSF EVs. Analysis of immunoreactivity close to the injection site showed that the SNCA signal was notably enhanced at the ipsilateral as compared to the contralateral side for DLB CSF EVs, whereas no alteration was found in the case of control CSF EVs (B). Moreover, the injection of DLB CSF EVs led to a significantly higher occurrence of SNCA inclusion bodies in neurons at the ipsilateral as compared to the contralateral side (C). In the case of control CSF EVs, no SNCA inclusion bodies were observed. To determine whether human CSF EV-associated SNCA was transferred to cells at the injection site, a human-specific SNCA antibody was used (D). Positive human SNCA signal was detected, partly colocalizing with the endosomal marker RAB5 and the neuronal marker MAP2. These data suggest that CSF EVs can deliver their SNCA cargo and, importantly, CSF EVs from synucleinopathy patients can also impair SNCA homeostasis through this process, in vivo.
Figure 8. CSF EVs are involved in the cell-to-cell transfer of SNCA in vivo. (A) IHC of SNCA (human and rodent, Hs+Mm) in the neuropil ipsilateral and contralateral to the EVs injection site (level 2, black box), 4 wk post injection. Intervals of 250-µm thickness from the injection site (levels 1 to 3) are shown. Anatomical reference images were modified from Allen Mouse Brain Atlas (Sagittal Atlas images 12, 13 and 14, http://mouse.brain-map.org/static/atlas).Citation93 Scale bar: 30 µm; corresponding insert: 15 µm. (B) SNCA corrected optical density (COD) at the injection site was plotted using the contralateral values as a reference for signal background and (C) graph depicts the number of neurons with SNCA inclusions per area. Two-way ANOVA indicated a significant interaction of treatment (control vs. DLB CSF EVs) with p<0.0001 and Bonferroni post-hoc indicated a significant difference ****p<0.0001 of contra vs ipsilateral side for DLB CSF EVs but not control CSF EVs). N = 6 mice were injected with control and N = 6 with DLB CSF EVs. (D) IHC of SNCA (human-specific antibody) at the injection site. Human SNCA partly colocalized with the endosomal marker RAB5 and the neuronal marker MAP2. Scale bar: 15 µm.
Discussion
This study uncovered a novel AP-MVB intracellular crosstalk, which regulates intercellular communication via EVs, thereby providing crucial insight into the mechanistic link between autophagy and SNCA release in neuronal cells. Under conditions of ALP inhibition, a fused AP-MVB intracellular compartment was observed, paralleled by increased SNCA release in EVs positive for LC3-II and SQSTM1, among other ALP-related proteins. This distinct autophagosome-exosome-like protein composition was identified in EVs derived from the human CSF, emphasizing the relevance of this AP-MVB crosstalk for the human CNS. In addition, we demonstrate that after intra-cortical injection of CSF-derived EVs from DLB patients into mice, human SNCA is present within mouse neurons and, importantly, SNCA inclusion pathology is observed. We therefore conclude that ALP impairment, which is a central aspect of synucleinopathies,Citation2,Citation9–Citation11 alters the EV protein composition and may thereby pathologically affect intercellular communication. Moreover, our findings highlight that EVs of the CSF are able to transfer SNCA from cell to cell in vivo, and may therefore contribute to the progression of synucleinopathies.
Previous studies by us and others reported that SNCA levels in EVs increase upon ALP inhibitionCitation14–Citation17,Citation38 in cell-line models of SNCA overexpression. In this study, we identified SNCA also in EVs from primary neuronal cultures of endogenous SNCA expression (F) as well as from the human CSF (G, H). ALP inhibition led to an increase of SNCA in EVs from SNCA H4 cells and neuronal cultures ( and ), whereas EV abundance was not significantly altered according to the ACHE assay (B). Although this assay does not allow for a direct quantification of EV number, the data suggest that ALP inhibition leads rather to an increased SNCA cargo in EVs.
Baf and CQ inhibited AP clearance by reducing lysosomal acidity (, S6-S7). These compounds were selected to specifically inhibit late stages of ALP clearance. Baf binds to a specific subunit (the V0 sector) of the lysosomal V-ATPase and blocks the influx of H+ into the lysosomes.Citation51–Citation53 CQ is a weak base, which passively diffuses across the lysosomal membrane, where it gets protonated and leads to an increase of pH.Citation51,Citation54 At 20 nM Baf, the concentration mainly used throughout our study, lysosomal pH was completely neutralized whereas at 50 µM CQ lysosomes were partially neutralized (Fig. S6). Both compounds upregulated SNCA release (E-G) and increased SNCA levels within EVs (D, E). By comparatively studying the effects of Rote, we demonstrated that this upregulation was primarily attributed to ALP inhibition (Figs. S1B and 2F). Importantly, the increase in extracellular SNCA was already noted for 2 nM Baf (E and A), a concentration at which lysosomal acidity was maintained (Fig. S6). This indicates that even a less severe ALP impairment may have a strong impact on SNCA release via EVs. It may therefore be speculated that a mild but chronic dysregulation of autophagy plays a key role in the proposed hierarchical spreading and propagation of SNCA pathology,Citation19–Citation21 partially mediated by EVs.
The mechanisms underlying the sorting of SNCA cargo in vesicles ultimately released as EVs, but not through the ER/Golgi secretory pathway, are not fully elucidated. We identified SNCA as both embedded into the EV membrane and inside the EV lumen (A, B), in agreement with previous reports.Citation14,Citation39 This observation is consistent with the concept that the trafficking and interaction of SNCA with MVBs depends on both protein-protein and protein-lipid interactions. Several factors have been suggested to influence these interactions. For instance, SNCA promptly interacts with endocytic vesicles due to their lipid composition and curvature.Citation55 In addition, SNCA was found to interfere with the ESCRT-III complex, which influenced the SNCA-MVB interaction and ultimately SNCA release or degradation.Citation31 Post-translational modifications are also important. Sumoylation, previously shown to stimulate the ALP-mediated degradation of SNCA,Citation56 directs its sorting to vesicles.Citation27 Similarly, phosphorylation at S87 and tyrosine nitration,Citation57,Citation58 may influence SNCA association with different biological membranes. The function of ATP13A2/PARK9 regulates both EV and EV-mediated SNCA release,Citation32 suggesting that MVB content turnover is highly relevant. Under this scope, the pervasive fused AP-MVB compartment, which we detected under ALP inhibition ( and S6A), raises the intriguing possibility that these 2 compartments also exchange cargo. Therefore, autophagy and AP turnover in particular, may be an additional modulator of SNCA sorting to MVBs.
MVBs are thought to unidirectionally converge with the ALP, for the purpose of MVB clearance. MVB contents are cleared via the ALP,Citation34,Citation59–Citation62 and early endosomes contribute to the formation of the AP membrane.Citation63–Citation65 It is noteworthy that in a recent report, SNCA was shown to be trafficked for degradation via its association with MVBs.Citation31 It is therefore imperative to decipher whether the MVB-AP interaction may be bidirectional, for the purpose of secretion/release via EVs. This study demonstrates that under ALP inhibition a fused AP-MVB compartment is formed and extends throughout the cell (A, B). The hybrid vesicles which constituted this compartment had both AP- and MVB-related content. Intriguingly, the presence of the fused APs-MVBs was paralleled by EVs possessing a distinct autophagosome-exosome-like phenotype. These “autophago-exosomes” are characterized by typical EV morphology (A and S3) and a hybrid protein profile, consisting of ALP-related proteins, including LC3-II and SQSTM1, as well as MVB-EV markers (, , , and ). Importantly, this biochemical phenotype was also identified in immuno-isolated EVs (Fig. S5C), validating that increased SNCA cargo is present on the same EVs containing increased LC3-II and SQSTM1. It is rather interesting that while in H4 neuroglioma cells, LC3-II and SQSTM1 were detected in EVs exclusively under Baf or CQ treatment (), in neuronal culture EVs these proteins were detected already at basal condition (). It is likely that “autophago-exosomes” are generated during AP-MVB fusion. Our ultrastructural and biochemical observations strengthen the assumption that ALP inhibition enforces the shuttling of AP components extracellularly, potentially leading to distinct alterations in the EV protein composition. Contrary to ALP inhibition, induction by Rapa neither affected SNCA release nor led to the identification of autophago-exosomes. As Rapa was reported to enhance MVB-AP fusion promoting clearance,Citation34 it may be proposed that the compound does not affect the cargo of remaining MVBs releasing their EVs. More specific to SNCA, although Rapa did not disturb the intra- or extracellular SNCA equilibrium, we cannot exclude target effects on distinct SNCA species. Indeed, the compound has been reported to reduce higher-order species within EVs and cells.Citation17,Citation66,Citation67 Deciphering how ALP modulation influences the sequestration and/or affinity of distinct SNCA species to MVBs is an important objective for future studies examining autophago-exosome biogenesis.
The extracellular shuttling of AP-related proteins via EVs was shown to occur after the downregulation of phosphoinositide 5-kinase, a kinase which ensures appropriate trafficking of MVBs via the endocytic pathway.Citation68 Previous reports have suggested an involvement of the ALP machinery in the release of proteins via non-ER or Golgi secretory routes,Citation69–Citation71 arguing for an actual function of autophagy in extracellular protein homeostasis (for a review see Citationref. 72). In the initial description of EVs, endosome-to-exosome movement was shown to be the main route for discarding plasma membrane components during early reticulocyte maturation.Citation73,Citation74 It was more recently demonstrated that during later stages of maturation the fusion of endosomal vesicles with APs precedes EV release.Citation75 In yeast, the term “exophagy” was proposed in order to describe the fusion of non-lytic MVB or autophagosome structures with the plasma membrane.Citation70 Whether this also occurs in mammalian cells has not been widely addressed. However, in an interesting study (using PC12 cells) by Ejlerskov et al., the process of exophagy was proposed to underlie increased extracellular SNCA in conditioned media fractions positive for the late endosome/amphisome markers ANXA5 and RAB27A.Citation76
The identification of LC3-II and SQSTM1 in human CSF EVs (, S9) substantiates the relevance of AP proteins in EVs for human CNS physiology. It is probable that a fraction of EVs exchanged/circulated between brain parenchymal cells utterly ends up in the CSF, because the CSF may enter the brain parenchyma and come into direct contact with the interstitial fluid.Citation77,Citation78 A limited number of studies have to date addressed the correlation of ALP components in biological fluids and their link to disease. For instance, an upregulation in the levels of LC3 (the isoform was not specified), LAMP1 and LAMP2 was reported in Alzheimer patient total human CSF as compared to control subjects.Citation79 Also, in brain-derived EVs purified from peripheral blood, the levels of LAMP1 and HSPA/HSP70 could be specifically correlated with AD progression.Citation80 The presence of SNCA, LC3-II and SQSTM1 in CSF EVs ( and S9) also raises the question of whether this protein pattern may be used for diagnostic purposes. In this respect, a clear limitation of our study is the small number of subject samples included and the need for relatively high volumes of CSF for the WB analysis of EVs (2-7 mL). Also, LC3-II could not be detected in the samples of Fig. S9 further suggesting that various technical parameters need further optimization for maximizing CSF EV protein recovery from single patient samples. Furthermore, neurons, glia and choroid plexus cells are considered to contribute to EVs encountered in the CSF.Citation81,Citation82 Therefore an important future objective would be to define a “standard” marker allowing for addressing SNCA and autophago-exosome profile in CSF EVs of parenchymal origin.
In vivo administration of EVs from human DLB CSF in mice led to significantly higher SNCA immunoreactivity at the ipsilateral side (B) and manifested a higher number of SNCA inclusions (C) as compared to control CSF EVs. In line with our observations, Stuendl et al. recently reported that CSF EVs obtained from patients with PD/DLB promote endogenous SNCA aggregation in vitro.Citation28 Thus, SNCA levels cannot be the sole determinant of the potential of CSF EVs to trigger SNCA pathology and subsequent cell-to-cell transfer, as in this study synucleinopathy CSF EVs had lower SNCA levels as compared to those of SNCA-unrelated degeneration or control subjects.Citation28 Due to the underlying ALP dysfunction, it may be proposed that synucleinopathy EVs exhibit multiple alterations in their biochemical composition and bioactivity. For instance, the mechanisms underlying protein sorting to the fused MVB-autophagosome compartment may enhance the sequestration of pathological SNCA species within EVs. Apart from SNCA, additional proteinaceous nucleating particles, which were destined for degradation, may be present within synucleinopathy EVs. Last but certainly not least, changes in the protein and lipid composition of the EV membrane may significantly enhance the CSF EV binding capacity or uptake efficiency. Exceeding the cellular threshold for appropriately processing EV cargo that has been taken up may trigger accumulation of EV-associated SNCA and its anatomical spread via cell-to-cell transfer.
In conclusion, the findings presented in this study underscore the importance of the ALP for the regulation not only of SNCA release but also of the general EV protein profile. The data suggest that this is a major homeostatic mechanism of intercellular communication with disease-modifying potential for the progression of synucleinopathies. A thorough investigation of the origin and composition of EVs in human biological fluids is imperative and may propose novel therapeutic strategies and diagnostic targets.
Materials and methods
Cell culture
Human neuroglioma (H4) cells (ATCC, HTB-148) were used for studying the association of SNCA with EVs. Lentiviral transfer vector (pCMV::SNCA-IRES-GFP) and helper plasmids (pVSVG, pMDL and pRev) were used to produce and purify lentiviral particles via a third generation lentiviral system as previously described.Citation83,Citation84 GFP-positive single cells were selected (but also nontransduced as controls) for further clonal expansion. The nontransduced (CTR H4) cells express SNCA at low endogenous levels, whereas the transduced (SNCA H4) cells stably and homogeneously overexpress SNCA. OptiMEM medium with GlutaMAX (Invitrogen, 51985–042), containing 10% fetal calf serum (FCS; Invitrogen, 10270–106) was used, at 5% CO2, 37 oC (referred to as normal growth conditions). For the preparation of embryonic d 18 (E18) rat primary cortical neurons, cortices were dissected and kept in ice-cold Opti-MEM (without FCS). Then, cortices were enzymatically dissociated in 1 mL Opti-MEM with 60 µL Papain 36 mg/mL and 40 µL DNAse for 30 min at 37 oC, with mild agitation every 10 min. The reaction was stopped by the addition of fresh OptiMEM with 10% FCS. Dissociated cells were washed by centrifugation at 500 × g for 5 min and maintained in Neurobasal medium (Invitrogen, 10888-022), with B27 serum-free supplement (Invitrogen, 17504-044), 0.5 mM L-glutamine, penicillin (100 U/mL) and streptomycin (100 μg/mL). These cells were plated onto poly-D-lysine-coated (10 µg/mL) dishes at a density of ∼200,000/cm2 or onto coverslips ∼150,000/cm2. At day in vitro (DIV) 4.25% of the conditioned medium was replaced by fresh medium. On day in vitro (DIV) 6, half of the medium was replaced with fresh for 24 h. Cells were harvested at DIV7. NPCs were isolated from the hippocampus of adult C57BL/6 mice with the MACS neural tissue dissociation kit according to the manufacturer's protocol (MACS Miltenyi Biotec, 130-092-628). The cells were cultured in growth medium consisting of DMEM F12 Glutamax (GIBCO, 10565018) medium with 1xNeurobrew-21 (MACS Miltenyi Biotec, 130-093-566), 1xPSF (GIBCO, 15240062), 8 mM HEPES, 10 ng/mL EGF (Peprotech, 315-09) and 10 ng/mL FGF-2 (Peprotech, 450-33) as neurospheres.
Compounds and treatments
Cells were treated for 12 h with 2–200 nM of the lysosomal ATPase inhibitor bafilomycin A153 (Baf; Applichem, A7823,0001) or 50 µM of the lysosomotropic agent chloroquine diphosphate saltCitation54 (CQ; Sigma Aldrich, C6628). These 2 compounds were used as ALP inhibitors, as in our previous reports.Citation2,Citation15 The ALP inducer rapamycinCitation10 (Rapa; Sigma Aldrich, R0395) was used at 200 ng/mL. The mitochondrial toxin rotenoneCitation41 (Rote; Sigma-Aldrich, R8875) was used at 300 nM. Vehicle (Veh) for Baf was 0.01% DMSO and for Rapa and Rote was 0.1% DMSO. CQ was diluted in fresh culture medium. In experiments involving EV isolation, the compounds were added during the last 12 out of the 24 h of conditioning.
LysoTracker Red DND-99 (Life Technologies, L7528) was administered in fresh medium containing the respective treatment at 75 nM, for 30 min. Subsequently, cells were washed twice with Dulbecco's Phosphate Buffered Saline (DPBS, without Ca2+, Mg2+; Sigma-Aldrich, D8537), and either fixed and visualized using fluorescence microscopy, or analyzed by flow cytometry (see below).
Toxicity
ToxiLight assay (Lonza, LT07–117) was performed according to the manufacturer´s instructions, as previously described.Citation15 Complementarily, total cell number and trypan blue-positive cells were assessed with an automated cell counter (Bio-Rad, TC20). Briefly, cells were suspended in fresh medium and mixed 1:1 with trypan blue. trypan blue-negative cells were considered intact.Citation85
Antibodies
For western blot analysis, the following primary antibodies were used: SNCA/Syn1, recognizing human and rodent SNCA (clone 42, 1:200; BD Transduction Laboratories, 610787); late endosome/lysosome markersCitation33 LAMP2A (1:500; Abcam, ab18528) and LAMP1 (1:500; Abcam, ab24170); ALP flux markersCitation44 MAP1LC3A/B (1:200 for cell lysate/EVs; Novus Biologicals, NB100-2331) and SQSTM1/p62 (1:1000 for cell lysate and 1:500 for EVs; MBL, PM045); loading controls TUBB3 (1:5000; Promega, G7121), HSPA/HSP70 (1:3000; Stressgen, SPA-810-D) and ACTB/β-actin (1:2500; Abcam, AB8226). Different MVB-EV markersCitation86 were used: FLOT1 (flotillin 1) (1:200; BD Biosciences, 610820), PDCD6IP/ALIX (3A9, 1:200; New England Biolabs, 2171S), CD81 (1:100; Santa Cruz Biotechnology, sc-23962), and RAB11 (1:100; BD Biosciences, 610656), Specifically in H, the antibodies to CD81 (Systems Bioscience, EXOAB-CD81A-1), CD63 (Systems Bioscience, EXOABCD63A-1) and PDCD6IP/ALIX (ABC40; Millipore) were used. In addition, antibodies to the ER marker CALR/calreticulin (FMC75; 1:1000, Abcam, ab22683) and the mitochondrial chaperone protein HSPD1/HSP60 (1:1,000; Santa Cruz Biotechnology, sc-1052) were used.
Fluorescently labeled secondary antibodies were Alexa Fluor 488 donkey anti-rabbit (1:1000; A21206, Invitrogen), Alexa Fluor 647 donkey anti-rabbit (1:1000; Dianova GmbH, 711-605-152), Alexa Fluor 647 donkey anti-rat (1:1000; Dianova GmbH, 712-605-153), Alexa Fluor 488 donkey anti-mouse (1:1000; Invitrogen, A21202), and Alexa Fluor 647 donkey anti-mouse (1:1000; Dianova GmbH, 715-605-151).
Cell lysates
Cells were twice washed with PBS and lysed for 20 min on ice in RIPA buffer (50 mM Tris-HCl, pH 8.0, 150 mM NaCl, 1% Nonidet P-40 [NP-40; Roche, 11754599001], 0.5% Na-deoxycholate [Sigma-Aldrich, D6750], 0.1% SDS [Applichem, A1112,0100], 2 mM EDTA), complemented with protease (Roche, 11836170001) and phosphatase (Roche, 04906837001) inhibitors. The post-nuclear supernatant of the lysate was obtained by centrifugation at 2000 × g, 10 min, 4 °C and protein was determined using the Pierce BCA protein assay (Thermo Scientific, 23225). 30 µg of total protein was used for western blot analysis. For measurement of lysates with ELISA, the STEN lysis buffer (50 mM Tris, pH 7.6, 15 0mM NaCl, 0.1% SDS, 1% NP-40, 2 mM EDTA, complemented with protease inhibitors) was used.
Western blot analysis
Cell lysates and EV fractions were separated on 4–12% Bis-Tris gels (Life Technologies, NP0322BOX), transferred to a polyvinylidene fluoride membrane (Immobilon-P; Millipore, IPFL00010) and blocked for 1 h, room temperature (RT) in 1% w:v BSA (Sigma-Aldrich, A9647) in PBS with 0.1% Tween 20 (Applichem, A1389,0500) (PBS-T). Incubation with primary antibodies was performed overnight at 4°C, and was followed by washing with PBS-T. The appropriate secondary antibodies were used for 1 h at RT, in the dark. Fluorescence intensity was analyzed by FusionFX (Peqlab, Erlangen, Germany) and quantified using the Bio1D Analyzer software (Vilber Lourmat, Eberhardzell, Germany).
Detection of SNCA in EVs
Protein was transferred onto nitrocellulose membrane (Millipore, VSWP02500) and the rat anti-mouse IgG1 secondary antibody, HRP conjugate (1:500; Invitrogen, 04–6120) was used. In the case of SNCA in immuno-isolated EVs an additional 30 min fixation of the membrane in 4% paraformaldehyde (PFA) was performed for intensifying the SNCA signal, according to a previously published protocol.Citation87 For detection, the Pierce ECL Plus Western Blotting substrate (Thermo Scientific, 32134) and SuperSignal West Femto kit (Thermo Scientific, 34094) were used.
Detection of proteins in the human CSF EVs
Protein was transferred onto polyvinylidene fluoride membrane (Millipore, IPVH00010) and detected using the secondary antibodies donkey anti-rabbit IgG (H+L) cross adsorbed secondary antibody, HRP conjugate (1:500; Invitrogen, SA1-200) and rat anti-mouse IgG1 secondary antibody, HRP conjugate (1:500; Invitrogen, 04–6120); the substrates used were as above.
Assessment of extracellular SNCA
Dot blot
Total extracellular SNCA was analyzed by dot blot (DB) after 12 h conditioning of SNCA H4 cells. After harvest, the medium was centrifuged at 300 × g for 5 min and then 4000 × g for 10 min, at 4oC. Aliquots (2 mL) were loaded onto a nitrocellulose membrane via a DB chamber (Minifold I, Schleicher & Schuell BioScience, Dassel, Germany) by gentle vacuum, and onto a nitrocellulose membrane (Millipore, VSWP02500). The membrane was 15-min air-dried, blocked and incubated with anti-SNCA (Syn1), diluted 1:500, overnight at 4°C. Following, incubation with secondary antibody (goat anti-mouse HRP 1:5000; Jackson Immuno, 115–035–068) and washing, the signal was developed by 5-min incubation with Pierce Super Signal West Femto Chemiluminescent Substrate Kit and quantified as for the WB.
Ultra-sensitive ELISA
The ultra-sensitive ELISA assay, described in CitationRefs. 23, and Citation25, was used to measure total extracellular SNCA or EV-associated SNCA in EVs after sonication. SNCA H4 cells were conditioned for a total of 24 h in EV collection medium (see below). After harvest, the conditioned medium was processed as for the dot blot. The corresponding EVs were sonicated prior to the assay.
EV isolation by ultracentrifugation
All centrifugations were performed at 4oC. Ultracentrifugation was at 100,000 × g for 90 min, unless otherwise indicated. The final pellet (EV fraction) was resuspended in 40 µL PBS, unless otherwise stated.
Exosome-depleted medium
Exosome depletion of FCS was performed similar to Théry et al.Citation88 Briefly, OptiMEM medium containing 20% FCS was ultracentrifuged for 16 h in ultracentrifugation tubes (Polyallomer, 35 mL, 25 × 89 mm; Beckman Coulter, 326823), using an Optima TM LE-80K centrifuge (Beckman Coulter, Pasadena, CA, USA) with a type SW28 Ti rotor (Beckman Coulter). The supernatant was sterilized and stored at 4°C.
H4 cell secreted EVs
H4 cells were cultured in a T75 flask format until 80% confluency. Culture medium was replaced with 13 mL of fresh 10% exosome-depleted FCS OptiMEM and conditioned for 24 h in total. The CM (corresponding to approximately 107 cells) was sequentially centrifuged at 300 × g, 5 min, then at 4000 × g, 10 min and finally, 11 mL were ultracentrifuged (Polyallomer, 13.2 mL, 14 × 89 mm; Beckman Coulter, 331372) for 90 min, using the SW41 Ti rotor (Beckman Coulter). For EV fractions destined for EM or proteomic screening, CM were passed through 0.2-µm pore-size filters (cellulose acetate -CA membrane; SARTORIUS, 9049101/16534K) prior to the ultracentrifugation.
Rat cortical neuron EVs
At DIV6 and 24 h before EV isolation, half of the culture medium was replaced with fresh medium. To further avoid the contamination with small debris, which is inevitable in primary cultures, the CM was centrifuged and gently passed through the 0.2-µm pore-size filters. Finally, 35 mL (corresponding to approximately 4.5 × 10⁷ cells) were ultracentrifuged.
EVs from hippocampal NPCs
Twenty-four h before EV isolation, growth medium was changed to OptiMEM medium with 10 ng/mL EGF and 10 ng/mL FGF. CM (35 mL; corresponding to approximately 40 × 107 cells) were processed (as for rat cortical neuron EVs).
Human CSF EVs
CSF was collected in polypropylene tubes by routine lumbar puncture. Samples were centrifuged, processed as previously describedCitation89 and aliquots were frozen at −80°C, 20–30 min after collection. Aliquots of human CSF were thawed on ice (“Total CSF”) and either centrifuged at 10,000 × g for 30 min or passed through 0.2-µm filters. Both options yielded similar results. Samples were finally ultracentrifuged and the final pellet (CSF EVs) was dissolved in 30 µL PBS.
CSF EV preparation for the in vivo injection
Frozen CSF (5 ml) from subjects 1 to 6 () was thawed on ice and centrifuged at 2,000 × g for 10 min. The resulting supernatant was processed using the ExoQuick protocol (EXOQ; System Biosciences, Inc., Mountain View, CA, USA), according to the manufacturer´s instructions. EVs were dissolved in PBS.
EV immuno-isolation
EVs were positively selected from the SNCA H4 conditioned medium using micro-beads recognizing the tetraspanins CD9, CD63, and CD81 (Exosome Isolation Kit Pan, human; Miltenyi, 130-110-912), with minor modifications of the manufacturer´s protocol. Briefly, 4 mL conditioned medium were incubated with 100 µL micro-beads for 1 h and then passed through a single column. Finally, 30 µL of the kit's isolation buffer were added to the column and micro-beads/immune-isolated EVs were precipitated from the columns by centrifugation up to 2,000 × g for 30 sec.
Quantification of EVs
Total EV protein was determined using the Pierce BCA protein assay (Thermo Scientific, 23225) and BSA standards ranging from 0.05 to 1 mg/mL were used to obtain the calibration curve of the assay (micro-BCA). EV number was indirectly assessed by measuring ACHE (acetylcholinesterase [Cartwright blood group]) activity, with minor modifications of previously published protocols.Citation42 Briefly, 10 µL of EVs appropriately diluted in PBS, were added to 240 µL of reaction buffer containing 0.1 mM 5,5′-dithiobis(2-nitrobenzoic acid) (Sigma-Aldrich, D8130) and 1.25 mM acetylthiocholine iodide (Sigma-Aldrich, A5751) in PBS. The final reaction volume was 250 μL. Standard concentrations of purified ACHE (from Electrophorus electricus; Sigma, C2888) were used to obtain the calibration curve. The assay was carried out for 30 min for H4 EVs and 60 min for human CSF EVs, at 37oC, and absorbance was measured at 415 nm.
EV treatment with Na2CO3
In order to separate membranes and membrane-integral proteins from soluble proteins, EV fractions were treated with 100 mM Na2CO3, pH 11, for 30 min at 4°C.Citation14,Citation90 After centrifugation at 50,000 × g, supernatant was collected in a separate tube and the membranous pellet was solubilized in RIPA.
EV labeling and administration
CTR H4 cells were labeled for 6 h with 1 µM TopFluor Cholesterol (Avanti Lipids, 810255) diluted in fresh normal medium. Medium was then aspirated and replaced with the H4 EV collection medium. From this step on, samples were protected from light. EVs were collected and frozen at −80 oC.
On the day of the experiment, EVs were thawed on ice, protein was assessed with micro-BCA, and 70 µg of EVs were administered to unlabeled CTR H4 in a confluent 12-well format, for 3 h.
Flow cytometry
For the detection of LysoTracker Red or TopFluor Cholesterol signal, cells were lifted with accutase (Sigma-Aldrich, A6964) and after the enzyme was deactivated with full medium, cells were washed with PBS and analyzed. The 3-laser BD FACSCanto II (BD) and BD FACSDiva 6 (BD) analysis and quantification software were used. Single cells were determined by forward and sideways scatter.
Immunocytochemistry
Glass coverslips were placed in 24-well dishes (Thermo Fisher Scientific, CB00130RAC/6302277). H4 cells were plated at a density 3 × 10⁴ cells/cm2 and rat cortical neurons at a density of ∼200,000/cm2 (used at DIV7). Cells were washed 2 times with DPBS (without Ca2+, Mg2+; Sigma-Aldrich, D8537) and fixed for 15 min in 4% PFA at RT. Cells were blocked in fish skin gelatin buffer (FSGB; 50 mM Tris-HCl pH 7.4, 1% BSA, 0.2% fish skin gelatin [Sigma-Aldrich, G7765], G7765), 0.1% Triton X-100 (Applichem, A1388,0500) for 1 h at RT. Incubation with primary antibody was performed overnight, at 4°C. Cells were washed and fluorescence-labeled secondary antibodies were applied for 1 h, at RT. Nuclei were stained with 4’6’-diamidino-2-phenylindol (DAPI, 1:10,000; Sigma-Aldrich, D8417) for 5 min. SNCA (human) (15G7, 1:200; Alexis-Axxora, ALX-804-258) or SNCA (human and rodent) (Clone 42/α-Synuclein, 1:200; BD Transduction Laboratories, 610787), SQSTM1 (1:700; MBL, PM045), TUBB3 (1:1000; Promega, G7121), and MAP2 (Clone AP-20, 1:500; Sigma Aldrich, M1406) antibodies were used. Secondary antibodies were as described above. Coverslips were mounted with Prolong Antifade reagent (Invitrogen, P36930) and captured with an Axio Imager M2 microscope combined with an AxioCam MRm camera and an ApoTome for AxioImager (Carl Zeiss AG, Jena, Germany). NPCs were seeded at a density of ∼530,000/cm2 and used after 2 d conditioning. Antibodies: SOX2 (anti-goat, 1:500; Santa Cruz Biotechnology, sc-17320), and Cy3 (anti-goat, 1:500; Jackson Laboratory, 705-165-147).
Analysis of SQSTM1 puncta
SQSTM1 puncta were estimated using ImageJ software (1.64r; NIH, Bethesda, MD, USA). To count the puncta, the plugin developed by Dagda et al.Citation91 was used and the threshold for SQSTM1 puncta detection was set for Veh and kept identical for Baf conditions.
Electron and immune-electron microscopy (EM)
EM of EVs
The EV pellet was fixed within the ultracentrifugation tube with 4% PFA for 30–60 min, at RT. The sample was then post-fixed in 1% OsO4 for 30 min and rinsed with distilled water, dehydrated in graded ethanol, block-stained with 1% uranyl acetate in 50% ethanol for 30 min and embedded in Taab 812 (Aldermaston, T031). Following polymerization at 60°C for 12 h, 50- to 60-nm ultrathin sections were cut using a Leica UCT ultramicrotome (Leica Microsystems, UK) and examined using a Hitachi 7100 transmission electron microscope (Hitachi Ltd., Japan). Electron micrographs were made using a Veleta 2k x 2k MegaPixel side-mounted TEM CCD camera (Olympus). Contrast/brightness of electron micrographs was edited by Adobe Photoshop CS4 (Adobe Photoshop Inc., CA, USA). “EV diameter” plotted in Fig. S3 represents the distance between 2 maximally distal points of the (ovoid) EV membrane and it was quantified using ImageJ Analysis Software (1.46 r).
Immuno-EM of EVs
The fixed EV pellet was blocked with EV FSGB buffer (5% FSGB, 5% BSA in 50 mM Tris-HCl, pH 7.4) and incubated with primary SNCA antibody (Syn1, 1:100 diluted in 1% FSGB and 1% BSA in PBS) overnight, at 4°C. After washing, the pellet was incubated with secondary antibody (goat anti-mouse IgG 6-nm gold particles 1:80, diluted in 0.2% BSA in PBS; AURION 806.022) for 2 h. The pellet was washed with 0.2% BSA in PBS and then with PBS alone. After post-fixation in 1% glutaraldehyde for 10 min, the pellet was washed 2 times with distilled water and processed for visualization as above.
EM cells
Thermanox plastic cover slips (13 mm; Thermo Fisher Scientific, 174950) were used as a carrier. After treatment, cells were fixed with 2.5% glutaraldehyde in 0.1 M phosphate buffer (pH 7.2), postfixed in 2% buffered osmium tetroxide, dehydrated in graded alcohol concentrations, and embedded in epoxy resin (Sigma-Aldrich, 45345) according to standard protocols.Citation94 Ultrathin sections were stained with 1% uranyl acetate and lead citrate and examined with a transmission electron microscope (EM 906E; Carl Zeiss NTS GmbH).
EV Proteomics
In-gel digestion
To each 50 µL exosome fraction in PBS, 145 µl SDS lysis buffer (250 mM Tris-HCl, pH 6.8, 10% [w:v] SDS, 5% [v:v] β-mercaptoethanol, 0.5% [w:v] bromophenol blue, 50% [v:v] glycerol) were added. Samples were heated for 10 min at 95°C and centrifuged for 1 min at 15,870 × g. Subsequently, 15 µL of the supernatant were loaded onto a Novex NuPage 4–12% Bis-Tris SDS gel (1.0 mm x 10 well) (Life Technologies, NP0321BOX). Gel electrophoresis was performed at 200 V for 3 min in SDS running buffer (0.05 M MES, 0.05 Tris base pH 7.5, 3.465 mM SDS, 1.025 mM ETDA). Afterwards, the gel was stained with colloidal Coomassie Brilliant Blue. Background staining was reduced with water before the protein bands were excised, chopped and destained by alternating 10 min treatments with buffer A (10 mM ammonium hydrogen carbonate [Fluka, 09830], pH 8.3) and buffer B (buffer A:100% acetonitrile 1:1 [v:v]). Gel pieces were dried in a vacuum concentrator (Christ, Osterode am Harz, Germany) and a solution containing 0.036 µg/µL trypsin (high-performance liquid chromatography purity > 90%; Serva, 37283) was added to the dried gel pieces with a trypsin:protein ratio of 1:20, followed by incubation at 37°C for 16 h. Peptides were extracted twice by adding 20 µL 0.1% trifluoroacetic acid (TFA):100% acetonitrile (v:v = 1:1) and incubation in an ultrasonic bath for 10 min. Combined supernatants were transferred into a high-performance liquid chromatography glass inlet (CS-chromatography service, Langerwehe, Germany). Pooled samples were evaporated to dryness in a vacuum concentrator, redissolved in 0.1% TFA and peptide concentration was subsequently determined using amino acid analysis.
Mass spectrometry and protein identification
Proteome analyses were performed as recently described in Maerkens et al. by means of LC-MS/MS on an UltiMate 3000 RSLCnano system online coupled to an Orbitrap Elite instrument (both Thermo Scientific, Bremen, Germany).Citation92 Briefly, in each measurement 150 ng tryptic-digested proteins in 15 µL 0.1% TFA was analyzed. For protein identification via database searches, the raw files were analyzed with the Proteome Discoverer software (ver. 1.4.1.14) (Thermo Fisher Scientific, Rockford IL, USA) using the Mascot search algorithm (ver. 2.5) (Matrix Science Ltd., London, UK) searching against the UniProtKB/Swiss-Prot database using human taxonomy (released 2015_05, 548,454 sequences entries in the whole database and 20,199 for human). The mass tolerances were set to 5 ppm and 0.4 Da for precursor and fragment ions, respectively. Furthermore, oxidation of methionine was considered as dynamic modification and one missed cleavage of trypsin was allowed. The software-implemented target decoy PSM validator was used to determine the confidence of peptide identification. The filter cut-off for the identified peptides was set to targeted false discovery rates of < 1%.
Animals
E18 rat primary cortical neuron cultures
WT Sprague–Dawley and BAC SNCA-tg (described in Citationref. 36) were housed in stable social groups of 3–4 animals under standard laboratory conditions, with a 12:12 light:dark cycle and free access to food and water, ad libitum. For E18 neuronal cultures, rats were paired in homozygosity (WT:WT or hom SNCA-tg:hom SNCA-tg) for 48 h, body-weight of the dams was monitored for 2 consecutive wk and pregnant females were then sacrificed by decapitation under isoflurane anesthesia after 18±1 d from the estimated mating date (protocol no. TS1/14). All procedures were approved by the local Animal Welfare and Ethics committee of Bavaria, Germany.
Mice and treatment with CSF-derived EVs
For this study N = 12 male mice maintained on the C57BL/6N × DBA/2 F1 background, were used at 8 mo of age. The animals received an injection of 1 µg CSF EVs (in a volume of 2 µL) from a starting volume of 5 mL CSF from subjects 1–6 () into one hemisphere of the neocortex (-2.0 from bregma, +1.5 lateral, −1.3 into). N = 6 animals were injected with DLB CSF EVs and the other N = 6 with control CSF EVs. Four wk post injection mice were anesthetized with chloral hydrate (Sigma, C8383) and flush-perfused trans-cardially with 0.9% saline. Brains were removed and fixed in phosphate-buffered 4% PFA, pH 7.4, at 4°C for 48 h for further analysis. All the procedures for animal experiments were approved by the Institutional Animal Care and Use Committee of the US (animal protocol number S02221).
Subjects
Demographics and diagnosis are presented in and written informed consent for the collection of samples and subsequent analysis was obtained from the patient. In G and (, subjects 1 to 6), CSF samples from N = 3 patients with a clinical diagnosis of probable DLB according to the 2005 DLB Consortium Criteria and N = 3 controls (neurologically and cognitively normal) were used. The study methodologies conformed to the standards set by the Declaration of Helsinki and Federal guidelines for the protection of human subjects. All procedures were reviewed and approved by the Institutional Review Boards. In , CSF ( subjects 7 to 12) samples from N = 2 control (neurologically unimpaired, ethical protocol number 4485) and N = 4 PD cases were used (ethical protocol numbers 9/7/04 and 36/07/02). In Fig. S9 CSF samples from N = 6 control and N = 6 PD cases (, subjects 13 to 24) were used (ethical protocol numbers 9/7/04 and 36/07/02).
Immunohistochemical analysis of in vivo SNCA transfer
Brain sections (40 μm) were serially generated (Vibratome 2000, Leica, Wetzlar, Germany). Free-floating sections relevant to the injection site, were incubated overnight at 4°C with anti-SNCA (Syn1) antibody, followed by biotinylated horse anti-mouse IgG (1:100; Vector Laboratories, BA-1000), avidin D-horseradish peroxidase (1:200; Vector Laboratories, A-2004), and subsequent detection with diaminobenzidine (Vector Laboratories, SK-4100). Sections were imaged with a bright-field digital microscope (Olympus, Shinjuku, Japan). In addition, the Tyramide Signal Amplification-Direct (TYR Red) system was used for the analysis of CSF EV-associated human SNCA uptake (TSA kit; PerkinElmer Life Sciences, NEL702). The following antibodies were used: Human specific SNCA antibody was Syn211 (Life Technologies, 32–8100), with 1:500 FITC. MAP2 (1:200, clone 2B; Millipore, MAB378) with 1:350 FITC (Vector Labs, FI-2000). RAB5 (15/RAB5; BD Biosciences, 610281) with 1:2000 TYR Red. Sections were imaged with a Zeiss 63X (N.A. 1.4) objective on an Axiovert 35 microscope (Zeiss, Germany) with an attached MRC1024 LSCM system (Bio-Rad).
Statistical analyses
GraphPad Prism was used (GraphPad Software, La Jolla, CA, USA). All numeric results are reported as mean ± standard error of the mean (SEM) and represent data from a minimum of 3 independent experiments (indicated as “N”), unless otherwise stated. For the statistical analysis of data, an unpaired two-tailed t test was used, unless otherwise specified in the figure legend.
Disclosure of potential conflicts of interest
The authors declare no competing financial interests.
supplemental_data_1395992.docx
Download MS Word (5.3 MB)Acknowledgements
We thank Stephan von Hörsten and Fabio Canneva for kindly providing E18 pregnant WT and SNCA-tg rats. We acknowledge Holger Meixner for excellent technical support with flow cytometric analysis and assistance in the preparation of extracellular vesicle fractions. We are also grateful to Margarita Trejo for performing EM and Alejandro Bisquert for performing biochemical analysis of the corresponding samples.
Additional information
Funding
Related Research Data
References
- Martinez-Vicente M, Cuervo AM. Autophagy and neurodegeneration: when the cleaning crew goes on strike. Lancet Neurol. 2007;6:352–361. doi:10.1016/S1474-4422(07)70076-5. PMID:17362839
- Klucken J, Poehler AM, Ebrahimi-Fakhari D, Schneider J, Nuber S, Rockenstein E, Schlötzer-Schrehardt U, Hyman BT, McLean PJ, Masliah E, et al. Alpha-synuclein aggregation involves a bafilomycin A 1-sensitive autophagy pathway. Autophagy. 2012;8:754–766. doi:10.4161/auto.19371. PMID:22647715
- Xilouri M, Vogiatzi T, Vekrellis K, Park D, Stefanis L. Abberant alpha-synuclein confers toxicity to neurons in part through inhibition of chaperone-mediated autophagy. PloS one. 2009;4:e5515. doi:10.1371/journal.pone.0005515. PMID:19436756
- Cuervo AM, Stefanis L, Fredenburg R, Lansbury PT, Sulzer D. Impaired degradation of mutant alpha-synuclein by chaperone-mediated autophagy. Science. 2004;305:1292–1295. doi:10.1126/science.1101738. PMID:15333840
- Ebrahimi-Fakhari D, Cantuti-Castelvetri I, Fan Z, Rockenstein E, Masliah E, Hyman BT, McLean PJ, Unni VK. Distinct roles in vivo for the ubiquitin-proteasome system and the autophagy-lysosomal pathway in the degradation of alpha-synuclein. The Journal of neuroscience: the official journal of the Society for Neuroscience. 2011;31:14508–14520. doi:10.1523/JNEUROSCI.1560-11.2011. PMID:21994367
- Nalls MA, Plagnol V, Hernandez DG, Sharma M, Sheerin UM, Saad M, et al. International Parkinson Disease Genomics Consortium. Imputation of sequence variants for identification of genetic risks for Parkinson's disease: a meta-analysis of genome-wide association studies. Lancet. 2011;377:641–649. doi:10.1016/S0140-6736(10)62345-8. PMID:21292315
- Spillantini MG, Schmidt ML, Lee VM, Trojanowski JQ, Jakes R, Goedert M. Alpha-synuclein in Lewy bodies. Nature. 1997;388:839–840. doi:10.1038/42166. PMID:9278044
- Klucken J, Ingelsson M, Shin Y, Irizarry MC, Hedley-Whyte ET, Frosch M, Growdon J, McLean P, Hyman BT. Clinical and biochemical correlates of insoluble alpha-synuclein in dementia with Lewy bodies. Acta Neuropathol. 2006;111:101–108. doi:10.1007/s00401-005-0027-7. PMID:16482476
- Alvarez-Erviti L, Rodriguez-Oroz MC, Cooper JM, Caballero C, Ferrer I, Obeso JA, Schapira AH. Chaperone-mediated autophagy markers in Parkinson disease brains. Archives of neurology. 2010;67:1464–1472. doi:10.1001/archneurol.2010.198. PMID:20697033
- Crews L, Spencer B, Desplats P, Patrick C, Paulino A, Rockenstein E, Hansen L, Adame A, Galasko D, Masliah E. Selective molecular alterations in the autophagy pathway in patients with Lewy body disease and in models of alpha-synucleinopathy. PloS one. 2010;5:e9313. doi:10.1371/journal.pone.0009313. PMID:20174468
- Anglade P, Vyas S, Javoy-Agid F, Herrero MT, Michel PP, Marquez J, Mouatt-Prigent A, Ruberg M, Hirsch EC, Agid Y. Apoptosis and autophagy in nigral neurons of patients with Parkinson's disease. Histology and Histopathology. 1997;12:25–31. PMID:9046040
- Rockenstein E, Schwach G, Ingolic E, Adame A, Crews L, Mante M, Pfragner R, Schreiner E, Windisch M, Masliah E. Lysosomal pathology associated with alpha-synuclein accumulation in transgenic models using an eGFP fusion protein. J Neurosci Res. 2005;80:247–259. doi:10.1002/jnr.20446. PMID:15765523
- Xilouri M, Brekk OR, Landeck N, Pitychoutis PM, Papasilekas T, Papadopoulou-Daifoti Z, Kirik D, Stefanis L. Boosting chaperone-mediated autophagy in vivo mitigates alpha-synuclein-induced neurodegeneration. Brain: A Journal of Neurology. 2013;136:2130–2146. doi:10.1093/brain/awt131. PMID:23757764
- Emmanouilidou E, Melachroinou K, Roumeliotis T, Garbis SD, Ntzouni M, Margaritis LH, Stefanis L, Vekrellis K. Cell-produced alpha-synuclein is secreted in a calcium-dependent manner by exosomes and impacts neuronal survival. The Journal of Neuroscience: The Official Journal of The Society for Neuroscience. 2010;30:6838–6851. doi:10.1523/JNEUROSCI.5699-09.2010. PMID:20484626
- Poehler AM, Xiang W, Spitzer P, May VE, Meixner H, Rockenstein E, Chutna O, Outeiro TF, Winkler J, Masliah E, et al. Autophagy modulates SNCA/alpha-synuclein release, thereby generating a hostile microenvironment. Autophagy. 2014;10:2171–2192. doi:10.4161/auto.36436. PMID:25484190
- Alvarez-Erviti L, Seow Y, Schapira AH, Gardiner C, Sargent IL, Wood MJ, Cooper JM. Lysosomal dysfunction increases exosome-mediated alpha-synuclein release and transmission. Neurobiol Dis. 2011;42:360–367. doi:10.1016/j.nbd.2011.01.029. PMID:21303699
- Danzer KM, Kranich LR, Ruf WP, Cagsal-Getkin O, Winslow AR, Zhu L, Vanderburg CR, McLean PJ. Exosomal cell-to-cell transmission of alpha synuclein oligomers. Molecular Neurodegeneration. 2012;7:42. doi:10.1186/1750-1326-7-42. PMID:22920859
- Lee HJ, Patel S, Lee SJ. Intravesicular localization and exocytosis of alpha-synuclein and its aggregates. The Journal of neuroscience: the official journal of the Society for Neuroscience. 2005;25:6016–6024. doi:10.1523/JNEUROSCI.0692-05.2005. PMID:15976091
- Braak H, Del Tredici K, Rub U, de Vos RA, Jansen Steur EN, Braak E. Staging of brain pathology related to sporadic Parkinson's disease. Neurobiology of Aging. 2003;24:197–211. doi:10.1016/S0197-4580(02)00065-9. PMID:12498954
- Li JY, Englund E, Holton JL, Soulet D, Hagell P, Lees AJ, Lashley T, Quinn NP, Rehncrona S, Björklund A, et al. Lewy bodies in grafted neurons in subjects with Parkinson's disease suggest host-to-graft disease propagation. Nature Medicine. 2008;14:501–503. doi:10.1038/nm1746. PMID:18391963
- Kordower JH, Chu Y, Hauser RA, Freeman TB, Olanow CW. Lewy body-like pathology in long-term embryonic nigral transplants in Parkinson's disease. Nature Medicine. 2008;14:504–506. doi:10.1038/nm1747. PMID:18391962
- El-Agnaf OM, Salem SA, Paleologou KE, Cooper LJ, Fullwood NJ, Gibson MJ, Curran MD, Court JA, Mann DM, Ikeda S, et al. Alpha-synuclein implicated in Parkinson's disease is present in extracellular biological fluids, including human plasma. FASEB Journal: Official Publication of the Federation of American Societies for Experimental Biology. 2003;17:1945–1947. PMID:14519670
- Emmanouilidou E, Elenis D, Papasilekas T, Stranjalis G, Gerozissis K, Ioannou PC, Vekrellis K. Assessment of alpha-synuclein secretion in mouse and human brain parenchyma. PloS one. 2011;6:e22225. doi:10.1371/journal.pone.0022225. PMID:21779395
- Tokuda T, Salem SA, Allsop D, Mizuno T, Nakagawa M, Qureshi MM, Locascio JJ, Schlossmacher MG, El-Agnaf OM. Decreased alpha-synuclein in cerebrospinal fluid of aged individuals and subjects with Parkinson's disease. Biochemical and Biophysical Research Communications. 2006;349:162–166. doi:10.1016/j.bbrc.2006.08.024. PMID:16930553
- Emmanouilidou E, Minakaki G, Keramioti MV, Xylaki M, Balafas E, Chrysanthou-Piterou M, Kloukina I, Vekrellis K. GABA transmission via ATP-dependent K+ channels regulates alpha-synuclein secretion in mouse striatum. Brain: A Journal of Neurology. 2016;139:871–890. doi:10.1093/brain/awv403. PMID:26912647
- Malhotra V. Unconventional protein secretion: an evolving mechanism. The EMBO Journal. 2013;32:1660–1664. doi:10.1038/emboj.2013.104. PMID:23665917
- Kunadt M, Eckermann K, Stuendl A, Gong J, Russo B, Strauss K, Rai S, Kügler S, Falomir Lockhart L, Schwalbe M, et al. Extracellular vesicle sorting of alpha-Synuclein is regulated by sumoylation. Acta Neuropathol. 2015;129:695–713. doi:10.1007/s00401-015-1408-1. PMID:25778619
- Stuendl A, Kunadt M, Kruse N, Bartels C, Moebius W, Danzer KM, Mollenhauer B, Schneider A. Induction of alpha-synuclein aggregate formation by CSF exosomes from patients with Parkinson's disease and dementia with Lewy bodies. Brain: A Journal of Neurology. 2016;139:481–494. doi:10.1093/brain/awv346. PMID:26647156
- Thery C, Zitvogel L, Amigorena S. Exosomes: composition, biogenesis and function. Nat Rev Immunology. 2002;2:569–579. PMID:12154376
- Budnik V, Ruiz-Canada C, Wendler F. Extracellular vesicles round off communication in the nervous system. Nat Rev Neuroscience. 2016;17:160–172. doi:10.1038/nrn.2015.29. PMID:26891626
- Spencer B, Kim C, Gonzalez T, Bisquertt A, Patrick C, Rockenstein E, Adame A, Lee SJ, Desplats P, Masliah E. alpha-Synuclein interferes with the ESCRT-III complex contributing to the pathogenesis of Lewy body disease. Human Molecular Genetics. 2016;25:1100–1115. doi:10.1093/hmg/ddv633. PMID:26740557
- Tsunemi T, Hamada K, Krainc D. ATP13A2/PARK9 regulates secretion of exosomes and alpha-synuclein. The Journal of Neuroscience: The Official Journal of the Society for Neuroscience. 2014;34:15281–15287. doi:10.1523/JNEUROSCI.1629-14.2014. PMID:25392495
- Vanlandingham PA, Ceresa BP. Rab7 regulates late endocytic trafficking downstream of multivesicular body biogenesis and cargo sequestration. J Biol Chem. 2009;284:12110–12124. doi:10.1074/jbc.M809277200. PMID:19265192
- Fader CM, Sanchez D, Furlan M, Colombo MI. Induction of autophagy promotes fusion of multivesicular bodies with autophagic vacuoles in k562 cells. Traffic. 2008;9:230–250. doi:10.1111/j.1600-0854.2007.00677.x. PMID:17999726
- Szatmári Z, Kis V, Lippai M, Hegedus K, Faragó T, Lorincz P, Tanaka T, Juhász G, Sass M. Rab11 facilitates cross-talk between autophagy and endosomal pathway through regulation of Hook localization. Mol Biol Cell. 2014;25:522–531. doi:10.1091/mbc.E13-10-0574. PMID:24356450
- Nuber S, Harmuth F, Kohl Z, Adame A, Trejo M, Schönig K, Zimmermann F, Bauer C, Casadei N, Giel C,, et al. A progressive dopaminergic phenotype associated with neurotoxic conversion of alpha-synuclein in BAC-transgenic rats. Brain: A Journal of Neurology. 2013;136:412–432. doi:10.1093/brain/aws358. PMID:23413261
- Kohl Z, Ben Abdallah N, Vogelgsang J, Tischer L, Deusser J, Amato D, Anderson S, Müller CP, Riess O, Masliah E, et al. Severely impaired hippocampal neurogenesis associates with an early serotonergic deficit in a BAC alpha-synuclein transgenic rat model of Parkinson's disease. Neurobiol Dis. 2016;85:206–217. doi:10.1016/j.nbd.2015.10.021. PMID:26523794
- Jang A, Lee HJ, Suk JE, Jung JW, Kim KP, Lee SJ. Non-classical exocytosis of alpha-synuclein is sensitive to folding states and promoted under stress conditions. J Neurochem. 2010;113:1263–1274. PMID:20345754
- Grey M, Dunning CJ, Gaspar R, Grey C, Brundin P, Sparr E, Linse S., et al. Acceleration of alpha-synuclein aggregation by exosomes. J Biol Chem. 2015;290:2969–2982. doi:10.1074/jbc.M114.585703. PMID:25425650
- Betarbet R, Sherer TB, MacKenzie G, Garcia-Osuna M, Panov AV, Greenamyre JT. Chronic systemic pesticide exposure reproduces features of Parkinson's disease. Nat Neurosci. 2000;3:1301–1306. doi:10.1038/81834. PMID:11100151
- Menges S, Minakaki G, Schaefer PM, Meixner H, Prots I, Schlotzer-Schrehardt U, Friedland K, Winner B, Outeiro TF, Winklhofer KF, et al. Alpha-synuclein prevents the formation of spherical mitochondria and apoptosis under oxidative stress. Sci Rep. 2017;7:42942. doi:10.1038/srep42942. PMID:28224980
- Savina A, Furlan M, Vidal M, Colombo MI. Exosome release is regulated by a calcium-dependent mechanism in K562 cells. J Biol Chem. 2003;278:20083–2090. doi:10.1074/jbc.M301642200. PMID:12639953
- Jones CB, Ott EM, Keener JM, Curtiss M, Sandrin V, Babst M. Regulation of membrane protein degradation by starvation-response pathways. Traffic. 2012;13:468–482. doi:10.1111/j.1600-0854.2011.01314.x. PMID:22118530
- Klionsky DJ, Abdelmohsen K, Abe A, Abedin MJ, Abeliovich H, Acevedo Arozena A, Adachi H, Adams CM, Adams PD, Adeli K, et al. Guidelines for the use and interpretation of assays for monitoring autophagy (3rd edition). Autophagy. 2016;12:1–222. doi:10.1080/15548627.2015.1100356. PMID:26799652
- Pankiv S, Clausen TH, Lamark T, Brech A, Bruun JA, Outzen H, Øvervatn A, Bjørkøy G, Johansen T. p62/SQSTM1 binds directly to Atg8/LC3 to facilitate degradation of ubiquitinated protein aggregates by autophagy. J Biol Chem. 2007;282:24131–24145. doi:10.1074/jbc.M702824200. PMID:17580304
- Kabeya Y, Mizushima N, Yamamoto A, Oshitani-Okamoto S, Ohsumi Y, Yoshimori T. LC3, GABARAP and GATE16 localize to autophagosomal membrane depending on form-II formation. Journal of cell science. 2004;117:2805–2812. doi:10.1242/jcs.01131. PMID:15169837
- Sahu R, Kaushik S, Clement CC, Cannizzo ES, Scharf B, Follenzi A, Potolicchio I, Nieves E, Cuervo AM, Santambrogio L. Microautophagy of cytosolic proteins by late endosomes. Developmental cell. 2011;20:131–139. doi:10.1016/j.devcel.2010.12.003. PMID:21238931
- Liddelow SA. Development of the choroid plexus and blood-CSF barrier. Frontiers in neuroscience. 2015;9:32. doi:10.3389/fnins.2015.00032. PMID:25784848
- Grapp M, Wrede A, Schweizer M, Hüwel S, Galla HJ, Snaidero N, Simons M, Bückers J, Low PS, Urlaub H, et al. Choroid plexus transcytosis and exosome shuttling deliver folate into brain parenchyma. Nature communications. 2013;4:2123. doi:10.1038/ncomms3123. PMID:23828504
- Street JM, Barran PE, Mackay CL, Weidt S, Balmforth C, Walsh TS, Chalmers RT, Webb DJ, Dear JW. Identification and proteomic profiling of exosomes in human cerebrospinal fluid. Journal of translational medicine. 2012;10:5. doi:10.1186/1479-5876-10-5. PMID:22221959
- Yoshimori T, Yamamoto A, Moriyama Y, Futai M, Tashiro Y. Bafilomycin A1, a specific inhibitor of vacuolar-type H(+)-ATPase, inhibits acidification and protein degradation in lysosomes of cultured cells. J Biol Chem. 1991;266:17707–17712. PMID:1832676
- Yamamoto A, Tagawa Y, Yoshimori T, Moriyama Y, Masaki R, Tashiro Y. Bafilomycin A1 prevents maturation of autophagic vacuoles by inhibiting fusion between autophagosomes and lysosomes in rat hepatoma cell line, H-4-II-E cells. Cell structure and function. 1998;23:33–42. doi:10.1247/csf.23.33. PMID:9639028
- Bowman EJ, Siebers A, Altendorf K. Bafilomycins: a class of inhibitors of membrane ATPases from microorganisms, animal cells, and plant cells. Proceedings of the National Academy of Sciences of the United States of America. 1988;85:7972–7976. doi:10.1073/pnas.85.21.7972. PMID:2973058
- Homewood CA, Warhurst DC, Peters W, Baggaley VC. Lysosomes, pH and the anti-malarial action of chloroquine. Nature. 1972;235:50–52. doi:10.1038/235050a0. PMID:4550396
- Pranke IM, Morello V, Bigay J, Gibson K, Verbavatz JM, Antonny B, Jackson CL. alpha-Synuclein and ALPS motifs are membrane curvature sensors whose contrasting chemistry mediates selective vesicle binding. J Cell Biol. 2011;194:89–103. doi:10.1083/jcb.201011118. PMID:21746853
- Shahpasandzadeh H, Popova B, Kleinknecht A, Fraser PE, Outeiro TF, Braus GH. Interplay between sumoylation and phosphorylation for protection against alpha-synuclein inclusions. J Biol Chem. 2014;289:31224–31240. doi:10.1074/jbc.M114.559237. PMID:25231978
- Paleologou KE, Oueslati A, Shakked G, Rospigliosi CC, Kim HY, Lamberto GR, Fernandez CO, Schmid A, Chegini F, Gai WP, et al. Phosphorylation at S87 is enhanced in synucleinopathies, inhibits alpha-synuclein oligomerization, and influences synuclein-membrane interactions. The Journal of neuroscience: the official journal of the Society for Neuroscience. 2010;30:3184–3198. doi:10.1523/JNEUROSCI.5922-09.2010. PMID:20203178
- Hodara R, Norris EH, Giasson BI, Mishizen-Eberz AJ, Lynch DR, Lee VM, Ischiropoulos H. Functional consequences of alpha-synuclein tyrosine nitration: diminished binding to lipid vesicles and increased fibril formation. J Biol Chem. 2004;279:47746–47753. doi:10.1074/jbc.M408906200. PMID:15364911
- Scotti E, Calamai M, Goulbourne CN, Zhang L, Hong C, Lin RR, Choi J, Pilch PF, Fong LG, Zou P, et al. IDOL stimulates clathrin-independent endocytosis and multivesicular body-mediated lysosomal degradation of the low-density lipoprotein receptor. Molecular and cellular biology. 2013;33:1503–1514. doi:10.1128/MCB.01716-12. PMID:23382078
- Piper RC, Katzmann DJ. Biogenesis and function of multivesicular bodies. Annual review of cell and developmental biology. 2007;23:519–547. doi:10.1146/annurev.cellbio.23.090506.123319. PMID:17506697
- Denzer K, Kleijmeer MJ, Heijnen HF, Stoorvogel W, Geuze HJ. Exosome: from internal vesicle of the multivesicular body to intercellular signaling device. Journal of cell science. 2000;113 Pt 19:3365–3374. PMID:10984428
- Martin S, Harper CB, May LM, Coulson EJ, Meunier FA, Osborne SL. Inhibition of PIKfyve by YM-201636 dysregulates autophagy and leads to apoptosis-independent neuronal cell death. PloS one. 2013;8:e60152. doi:10.1371/journal.pone.0060152. PMID:23544129
- Razi M, Chan EY, Tooze SA. Early endosomes and endosomal coatomer are required for autophagy. J Cell Biol. 2009;185:305–321. doi:10.1083/jcb.200810098. PMID:19364919
- Bento CF, Puri C, Moreau K, Rubinsztein DC. The role of membrane-trafficking small GTPases in the regulation of autophagy. Journal of cell science. 2013;126:1059–1069. doi:10.1242/jcs.123075. PMID:23620509
- Jäger S, Bucci C, Tanida I, Ueno T, Kominami E, Saftig P, Eskelinen EL. Role for Rab7 in maturation of late autophagic vacuoles. Journal of cell science. 2004;117:4837–4848. doi:10.1242/jcs.01370. PMID:15340014
- Kim C, Rockenstein E, Spencer B, Kim HK, Adame A, Trejo M, Stafa K, Lee HJ, Lee SJ, Masliah E. Antagonizing Neuronal Toll-like Receptor 2 Prevents Synucleinopathy by Activating Autophagy. Cell reports. 2015;13:771–782. doi:10.1016/j.celrep.2015.09.044. PMID:26489461
- Pérez-Revuelta BI, Hettich MM, Ciociaro A, Rotermund C, Kahle PJ, Krauss S, Di Monte DA. Metformin lowers Ser-129 phosphorylated alpha-synuclein levels via mTOR-dependent protein phosphatase 2A activation. Cell death & disease. 2014;5:e1209. doi:10.1038/cddis.2014.175.
- Hessvik NP, Øverbye A, Brech A, Torgersen ML, Jakobsen IS, Sandvig K, Llorente A. PIKfyve inhibition increases exosome release and induces secretory autophagy. Cellular and molecular life sciences: CMLS. 2016;73:4717–4737. doi:10.1007/s00018-016-2309-8. PMID:27438886
- Dupont N, Jiang S, Pilli M, Ornatowski W, Bhattacharya D, Deretic V. Autophagy-based unconventional secretory pathway for extracellular delivery of IL-1beta. The EMBO journal. 2011;30:4701–4711. doi:10.1038/emboj.2011.398. PMID:22068051
- Duran JM, Anjard C, Stefan C, Loomis WF, Malhotra V. Unconventional secretion of Acb1 is mediated by autophagosomes. J Cell Biol. 2010;188:527–536. doi:10.1083/jcb.200911154. PMID:20156967
- DeSelm CJ, Miller BC, Zou W, Beatty WL, van Meel E, Takahata Y, Klumperman J, Tooze SA, Teitelbaum SL, Virgin HW. Autophagy proteins regulate the secretory component of osteoclastic bone resorption. Developmental cell. 2011;21:966–974. doi:10.1016/j.devcel.2011.08.016. PMID:22055344
- Boya P, Reggiori F, Codogno P. Emerging regulation and functions of autophagy. Nature cell biology. 2013;15:713–720. doi:10.1038/ncb2788. PMID:23817233
- Johnstone RM, Adam M, Hammond JR, Orr L, Turbide C. Vesicle formation during reticulocyte maturation. Association of plasma membrane activities with released vesicles (exosomes). J Biol Chem. 1987;262:9412–9420. PMID:3597417
- Johnstone RM, Bianchini A, Teng K. Reticulocyte maturation and exosome release: transferrin receptor containing exosomes shows multiple plasma membrane functions. Blood. 1989;74:1844–1851. PMID:2790208
- Griffiths RE, Kupzig S, Cogan N, Mankelow TJ, Betin VM, Trakarnsanga K, Massey EJ, Lane JD, Parsons SF, Anstee DJ. Maturing reticulocytes internalize plasma membrane in glycophorin A-containing vesicles that fuse with autophagosomes before exocytosis. Blood. 2012;119:6296–6306. doi:10.1182/blood-2011-09-376475. PMID:22490681
- Ejlerskov P, Rasmussen I, Nielsen TT, Bergström AL, Tohyama Y, Jensen PH, Vilhardt F. Tubulin polymerization-promoting protein (TPPP/p25alpha) promotes unconventional secretion of alpha-synuclein through exophagy by impairing autophagosome-lysosome fusion. J Biol Chem. 2013;288:17313–17335. doi:10.1074/jbc.M112.401174. PMID:23629650
- Iliff JJ, Wang M, Liao Y, Plogg BA, Peng W, Gundersen GA, Benveniste H, Vates GE, Deane R, Goldman SA. et al. A paravascular pathway facilitates CSF flow through the brain parenchyma and the clearance of interstitial solutes, including amyloid beta. Science translational medicine. 2012;4:147ra11. doi:10.1126/scitranslmed.3003748.
- Bedussi B, van Lier MG, Bartstra JW, de Vos J, Siebes M, VanBavel E, Bakker EN. Clearance from the mouse brain by convection of interstitial fluid towards the ventricular system. Fluids and barriers of the CNS. 2015;12:23. doi:10.1186/s12987-015-0019-5. PMID:26435380
- Armstrong A, Mattsson N, Appelqvist H, Janefjord C, Sandin L, Agholme L, Olsson B, Svensson S, Blennow K, Zetterberg H., et al. Lysosomal network proteins as potential novel CSF biomarkers for Alzheimer's disease. Neuromolecular medicine. 2014;16:150–160. doi:10.1007/s12017-013-8269-3. PMID:24101586
- Goetzl EJ, Boxer A, Schwartz JB, Abner EL, Petersen RC, Miller BL, Kapogiannis D. Altered lysosomal proteins in neural-derived plasma exosomes in preclinical Alzheimer disease. Neurology. 2015;85:40–47. doi:10.1212/WNL.0000000000001702. PMID:26062630
- Balusu S, Van Wonterghem E, De Rycke R, Raemdonck K, Stremersch S, Gevaert K, Brkic M, Demeestere D, Vanhooren V, Hendrix A, et al. Identification of a novel mechanism of blood-brain communication during peripheral inflammation via choroid plexus-derived extracellular vesicles. EMBO molecular medicine. 2016;8:1162–1183. doi:10.15252/emmm.201606271. PMID:27596437
- Chiasserini D, van Weering JR, Piersma SR, Pham TV, Malekzadeh A, Teunissen CE, de Wit H, Jiménez CR. Proteomic analysis of cerebrospinal fluid extracellular vesicles: a comprehensive dataset. Journal of proteomics. 2014;106:191–204. doi:10.1016/j.jprot.2014.04.028. PMID:24769233
- Tiscornia G, Singer O, Verma IM. Production and purification of lentiviral vectors. Nature protocols. 2006;1:241–245. doi:10.1038/nprot.2006.37. PMID:17406239
- Winner B, Jappelli R, Maji SK, Desplats PA, Boyer L, Aigner S, Hetzer C, Loher T, Vilar M, Campioni S, et al. In vivo demonstration that alpha-synuclein oligomers are toxic. Proceedings of the National Academy of Sciences of the United States of America. 2011;108:4194–4199. doi:10.1073/pnas.1100976108. PMID:21325059
- Strober W. Trypan blue exclusion test of cell viability. Current protocols in immunology / edited by John E Coligan [et al] 2001; Appendix 3:Appendix 3B.
- Raposo G, Stoorvogel W. Extracellular vesicles: exosomes, microvesicles, and friends. J Cell Biol. 2013;200:373–383. doi:10.1083/jcb.201211138. PMID:23420871
- Sasaki A, Arawaka S, Sato H, Kato T. Sensitive western blotting for detection of endogenous Ser129-phosphorylated alpha-synuclein in intracellular and extracellular spaces. Sci Rep. 2015;5:14211. doi:10.1038/srep14211. PMID:26381815
- Thery C, Amigorena S, Raposo G, Clayton A. Isolation and characterization of exosomes from cell culture supernatants and biological fluids. Current protocols in cell biology / editorial board, Juan S Bonifacino [et al] 2006; Chapter 3:Unit 3 22.
- Mollenhauer B, El-Agnaf OM, Marcus K, Trenkwalder C, Schlossmacher MG. Quantification of alpha-synuclein in cerebrospinal fluid as a biomarker candidate: review of the literature and considerations for future studies. Biomark Med. 2010;4:683–699. doi:10.2217/bmm.10.90. PMID:20945981
- Fujiki Y, Hubbard AL, Fowler S, Lazarow PB. Isolation of intracellular membranes by means of sodium carbonate treatment: application to endoplasmic reticulum. J Cell Biol. 1982;93:97–102. doi:10.1083/jcb.93.1.97. PMID:7068762
- Dagda RK, Cherra SJ, 3rd, Kulich SM, Tandon A, Park D, Chu CT. Loss of PINK1 function promotes mitophagy through effects on oxidative stress and mitochondrial fission. J Biol Chem. 2009;284:13843–13855. doi:10.1074/jbc.M808515200. PMID:19279012
- Maerkens A, Olivé M, Schreiner A, Feldkirchner S, Schessl J, Uszkoreit J, Barkovits K, Güttsches AK, Theis V, Eisenacher M, et al. New insights into the protein aggregation pathology in myotilinopathy by combined proteomic and immunolocalization analyses. Acta Neuropathol Commun. 2016;4:8. doi:10.1186/s40478-016-0280-0. PMID:26842778
- Lein ES, Hawrylycz MJ, Ao N, Ayres M, Bensinger A, Bernard A, Boe AF, Boguski MS, Brockway KS, Byrnes EJ,, et al. Genome-wide atlas of gene expression in the adult mouse brain. Nature. 2007;445:168–176. doi:10.1038/nature05453. PMID:17151600
- Kuo J. Electron Microscopy: Methods and Protocols; 3rd ed. New York (NY): Humana Press; 2014.