
ABSTRACT
Damaged or dysfunctional mitochondria are toxic to the cell by producing reactive oxygen species and releasing cell death factors. Therefore, timely removal of these organelles is critical to cellular homeostasis and viability. Mitophagy is the mechanism of selective degradation of mitochondria via autophagy. The significance of mitophagy in kidney diseases, including ischemic acute kidney injury (AKI), has yet to be established, and the involved pathway of mitophagy remains poorly understood. Here, we show that mitophagy is induced in renal proximal tubular cells in both in vitro and in vivo models of ischemic AKI. Mitophagy under these conditions is abrogated by Pink1 and Park2 deficiency, supporting a critical role of the PINK1-PARK2 pathway in tubular cell mitophagy. Moreover, ischemic AKI is aggravated in pink1 andpark2 single- as well as double-knockout mice. Mechanistically, Pink1 and Park2 deficiency enhances mitochondrial damage, reactive oxygen species production, and inflammatory response. Taken together, these results indicate that PINK1-PARK2-mediated mitophagy plays an important role in mitochondrial quality control, tubular cell survival, and renal function during AKI.
Abbreviations
| ACTB | = | actin beta |
| AKI | = | acute kidney injury |
| BCL2 | = | BCL2, apoptosis regulator |
| BNIP3 | = | BCL2 interacting protein 3 |
| CASP3 | = | caspase 3 |
| COX4I1 | = | cytochrome c oxidase subunit 4I1 |
| DAPI | = | 4′,6-Diamidino-2-phenylindole dihydrochloride |
| DHE | = | dihydroethidium |
| DMSO | = | dimethyl sulfoxide |
| D-R | = | depletion-repletion |
| DsRed | = | Discosoma sp. red fluorescent protein |
| GFP | = | green fluorescent protein |
| HAVCR1 | = | hepatitis A virus cellular receptor 1 |
| I-R | = | ischemia reperfusion |
| KO | = | knockout |
| MAP1LC3B/LC3B | = | microtubule-associated protein 1 light chain 3 beta |
| MOM | = | mitochondrial outer membrane |
| mtDNA | = | mitochondrial DNA |
| nDNA | = | nuclear DNA |
| PRKN | = | parkin RBR E3 ubiquitin protein ligase |
| PARK2 | = | Parkinson disease (autosomal recessive, juvenile) 2 parkin |
| PINK1 | = | PTEN induced putative kinase 1 |
| PPIB/cyclophilin B | = | peptidylprolyl isomerase B |
| RKRB | = | Krebs-Ringer bicarbonate buffer |
| ROS | = | reactive oxygen species |
| SEM | = | standard error of the mean |
| siRNA | = | small interfering RNA |
| SQSTM1/p62 | = | sequestosome 1 |
| TEM | = | transmission electron microscopy |
| TIMM23 | = | translocase of inner mitochondrial membrane 23 |
| TOMM20 | = | translocase of outer mitochondrial membrane 20 |
| TRP53 | = | tumor protein p53 |
| TUBB5 | = | tubulin, beta 5 class I |
| TUNEL | = | terminal deoxynucleotidyl transferase-mediated dUTP nick end labeling |
| WT | = | wild type |
Introduction
Acute kidney injury (AKI) is a major kidney disease characterized by the rapid decline of renal function, which is often caused by renal ischemia-reperfusion (I-R), nephrotoxins, and sepsis.Citation1 Besides its acute consequence of high morbidity and mortality, AKI may also contribute significantly to the development and progression of chronic kidney diseases (CKD).Citation2-5 The pathogenesis of AKI is multifactorial, involving multiple cell types, cellular processes, and molecular mediators and regulators.Citation6-9 A critical pathological feature of AKI is sublethal and lethal injury of the epithelial cells in renal tubules.Citation10,Citation11
Mitochondrial damage and dysfunction play a causative role in the pathogenesis of AKI, especially for tubular epithelial cell injury and death. In this regard, pathological alterations in mitochondrial structure and function have been observed in renal tubular cells in various experimental models of AKI.Citation12-15 Damaged mitochondria not only compromise energy metabolism of the cell, but also produce excessive reactive oxygen species (ROS) and release pro-apoptotic factors (e.g., CYCS/cytochrome c), which may ultimately lead to renal tubular cell death. Consistently, preservation of mitochondrial structure and function by several mitochondria-targeted approaches has been shown to prevent tubular cell death, protect kidney tissues, and maintain significant renal function in AKI.Citation15-18 Therefore, maintenance of a cohort of healthy mitochondria is crucial for the homeostasis and viability of renal tubular cells in AKI.
Mitophagy is an important mechanism of mitochondrial quality control, which selectively removes excessive and defective mitochondria via autophagy. In development, mitophagy eliminates sperm-derived mitochondria in fertilized eggs to ensure the inheritance of maternal mitochondrial DNA, and mediates the clearance of mitochondria from developing erythrocytes.Citation19,Citation20 Under pathophysiological conditions, mitophagy identifies and tags damaged or dysfunctional mitochondria for degradation via autophagy.Citation21 In mammalian cells, mitophagy involves a coordination of autophagy induction and the priming of damaged mitochondria for selective autophagic recognition. Currently, 2 main pathways of mitochondrial priming for mitophagy have been suggested, i.e., PRKN/PARK2 (parkin RBR E3 ubiquitin protein ligase)-dependent and -independent pathways.Citation22 PRKN/PARK2-dependent mitophagy involves the cytosolic ubiquitin E3 ligase PRKN/PARK2 and the mitochondrial protein kinase PINK1(PTEN induced putative kinase 1). In healthy mitochondria, PINK1 is constitutively imported into mitochondria where it is cleaved and proteolytically degraded. When a subset of mitochondria become damaged and depolarized, the import of PINK1 into mitochondria is suppressed, resulting in the accumulation of full-length PINK1 on the mitochondrial outer membrane (MOM), which then recruits PRKN/PARK2 from the cytosol and activates its E3 ligase activity via phosphorylation.Citation23,Citation24 Upon activation, PRKN/PARK2 ubiquitinates various proteins on the MOM leading to the recruitment of macroautophagy/autophagy receptors, such asSQSTM1/p62 (sequestosome 1), OPTN (optineurin) and NBR1 (NBR1, autophagy cargo receptor), which bind to ubiquitin-tagged MOM proteins to promote the removal of mitochondria via autophagy.Citation25-28 In contrast, PRKN/PARK2-independent mitophagy is mediated directly by a mitophagy receptor, such as BNIP3 (BCL2 interacting protein 3), BNIP3L/NIX (BCL2 interacting protein 3 like), and FUNDC1 (FUN14 domain containing 1), which are constitutively expressed on the MOM.Citation29-32 In response to cellular stress, such as hypoxia, these mitophagy receptors can directly bind to MAP1LC3B/LC3B (microtubule-associated protein 1 light chain 3 beta) on phagophores, the precursors to autophagosomes, to promote mitophagy.Citation29-32
In kidneys, the induction of BNIP3 was shown during renal I/R in rats and hypoxia of renal tubular cells.Citation33 Kanwar and colleagues further showed the changes in PINK1 and PARK2 expression along with mitophagy in experimental models of diabetic kidney disease.Citation34 The latest work by Venkatachalam and colleagues further demonstrated the loss of mitochondria from proximal tubule cells after renal I-R, suggesting the possibility of mitophagy under this condition.Citation35 Despite these observations, the main pathway of mitophagy that is responsible for mitochondrial quality control in kidneys remains unclear and the role of mitophagy in the pathogenesis of renal diseases remains to be elucidated.Citation36 In the present study, we have demonstrated mitophagy induction in proximal tubular cells during renal I-R, which is suppressed in Pink1-and Park2-deficient mice. Notably, Pink1 and Park2 deficiency aggravate renal I-R-induced kidney injury, and enhance mitochondrial damage, ROS production, tubular cell apoptosis and tubulointerstitial inflammation. Together, these results support a critical role of PINK1-PRKN/PARK2-dependent mitophagy in mitochondrial quality control for tubular cell viability and function in AKI.
Results
Mitophagy is induced by ATP depletion-repletion in HK-2 cells
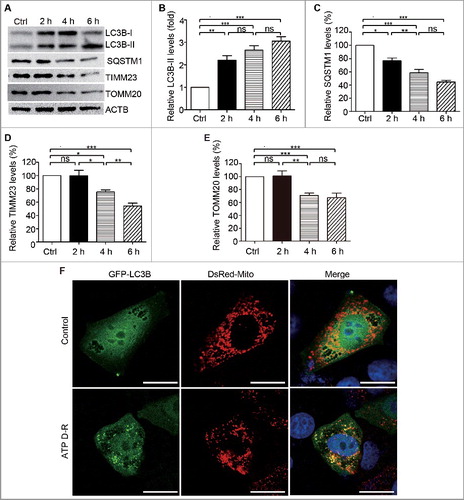
We initially examined mitophagy occurrence during ATP depletion-repletion (ATP D-R) in proximal tubular cells, a commonly used in vitro model of renal I-R. To this end, HK-2 cells were treated with CCCP (a mitochondrial uncoupler that inhibits ATP synthesis) in glucose-free buffer to induce ATP depletion and then returned to normal culture medium for ATP repletion as described previously.Citation37 In immunoblot analysis, ATP D-R induced a rapid increase in LC3B-II and a dramatic decrease in SQSTM1 (A-C), 2 biochemical hallmarks of autophagy activation. The changes in LC3B-II and SQSTM1 during ATP D-R were associated with a marked reduction in the mitochondrial inner membrane protein TIMM23 (translocase of inner mitochondrial membrane 23) and TOMM20 (translocase of outer mitochondrial membrane 20) (A, D and E). Moreover, chloroquine treatment resulted in more LC3B-II accumulation, and blocked degradation of SQSTM1 as well as TIMM23 and TOMM20 in HK-2 cells following ATP D-P (Fig. S1). Collectively, these findings suggested induction of mitophagy or mitochondrial clearance. To further verify mitophagy induction, we assessed the colocalization of mitochondria and autophagosomes. To this end, HK-2 cells were co-transfected with GFP-LC3B and DsRed-Mito plasmids to reveal autophagosomes and mitochondria, respectively. The cells were then subjected to ATP D-R or incubated in normal culture medium as a control. As shown in F, the control cells had very few GFP-LC3B puncta indicating a low level of autophagy. In sharp contrast, a large number of GFP-LC3B puncta were observed in HK-2 cells following ATP D-R, indicating autophagosome formation. Notably, in these cells, many GFP-LC3B-labeled autophagosomes colocalized with DsRed-Mito-labeled mitochondria (F), indicating the formation of mitophagosomes. These results demonstrate the activation of mitophagy during ATP D-R in renal proximal tubular cells.
Figure 1. Mitophagy is induced in HK-2in response to ATP depletion-repletion. (A-D) HK-2 cells were incubated in RKRB buffer containing 20 µm CCCP for 2∼6 h to induce ATP depletion, followed by recovery in normal cell culture medium for another 2 h (ATP repletion). Control (Ctrl) cells were cultured in normal medium without ATP depletion. Whole cell lysates were collected for immunoblot analysis of LC3B-I/II, SQSTM1, TIMM23, TOMM20 and ACTB (loading control). (A) Representative blots. (B, C, D and E) Densitometry of LC3B-II (B), SQSTM1 (C), TIMM23 (D), and TOMM20 (D)signals. For densitometry, the protein level of the control group was arbitrarily set as 100% in each blot, and the signals of other conditions in the same blot were normalized with the control to indicate their protein expression levels. Error bars: SEM, n = 3. *p<0.05; **p<0.01; ***p<0.001; ns, not significant.(E) Representative images of mitophagosome. HK-2 cells were transientlyco-transfected with GFP-LC3B and pDsRed-Mito plasmids. At 24 h aftertransfection, cells were treated with either solvent (DMSO; Control) or 20 µm CCCP in RKRB for6 h followed by recovery for another 2 h (ATP D-R). The cells were then fixed for confocal microscopy analysis for mitophagosome formation as assessed by colocalization of GFP-LC3B-positive autophagosomes (green) with pDsRed-Mito-labeled mitochondria (red). Nuclei were stained with DAPI (blue). Bar: 20 μm.
PINK1 and PRKN/PARK2 participate in ATP depletion-repletion-induced mitophagy in HK-2 cells
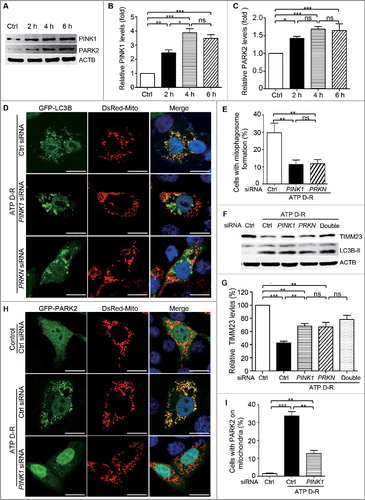
In response to ATP D-R, HK-2 cells showed remarkable increases in PINK1 and PARK2 expression (A and C). We therefore focused on PINK1-PARK2 to elucidate the pathway of mitophagy in renal tubular cells. To determine the role of PINK1-PRKN/PARK2, we knocked down their expression with specific siRNAs (Fig.S2). Compared to control siRNA-transfected cells, the cells with either PINK1 or PRKNsiRNA showed lower mitophagy (D). By cell counting, ATP D-R induced the formation of mitophagosomes in almost 30% of control siRNA-transfected cells, but only in about 10% of PINK1 or PRKNsiRNA transfected cells (E and S3), supporting an important role of PINK1 and PRKN/PARK2 in mitophagy under this experimental condition. Consistently, knockdown of PINK1 or PRKN alone or together partially restored the mitochondrial protein TIMM23 in HK-2 cells subjected to ATP D-R (F and G). We further analyzed the accumulation of PARK2 on mitochondria during ATP D-R, a key event in the PINK1-PARK2 pathway of mitophagy. As shown in H, GFP-PARK2 resided in the cytosol in control cells and, upon ATP D-R, GFP-PARK2 showed a granular staining that colocalized with DsRed-Mito-labeled mitochondria, indicating the recruitment of PARK2 to mitochondria. However, this recruitment was blocked in PINK1 siRNA transfected cells (H, I, and S4), supporting a role of PINK1 in recruiting PARK2. Collectively, these results demonstrated that the PINK1-PRKN/PARK2 pathway contributed critically to tubular cell mitophagy in response to ATP D-R.
Figure 2. PINK1 and PRKN/PARK2 participate in ATP depletion-repletion-induced mitophagy in HK-2 cells. (A-C) HK-2 cells were subjected to ATP depletion-repletion (ATP D-R) as in , and whole cell lysates were collected for immunoblot analysis of PINK1, PARK2, and ACTB. (A) Representative blots. (B, C) Densitometry of PINK1 and PARK2. (D,E) Silencing of PINK1 or PRKNinhibits ATP D-R-inducedmitophagosome formation. HK-2 cells were first transfected with PINK1siRNA, PRNKsiRNA,or control siRNA(CtrlsiRNA),and 24 h later these cells were cotransfected with plasmids encoding GFP-LC3B and pDsRed-Mito. After another 24 h, the cells were subjected to 6 h of ATP depletion followed by 2 h of ATP repletion. Finally, the cells were stained with DAPI (blue) and fixed for confocal microscopy analysis. (D) Representative images. Bar: 20 μm. (E) Quantitative analysis of mitophagosome formation. Over 200 cells positive for both GFP-LC3B and DsRed-Mito in each group were counted for those with colocalization of GFP-LC3B-positive autophagosomes and pDsRed-Mito-labeled mitochondria. (F and G) Silencing of PINK1andPRKN partially restores TIMM23 levels in HK-2 following ATP D-R. HK-2 cells were transfected with PINK1siRNA and PRKNsiRNA alone or both (Double), or CtrlsiRNA. At 48 h after transfection, the cells were subjected to 6 h of ATP depletion followed by 2 h of reperfusion, and whole cell lysates were collected for immunoblot analysis of TIMM23, LC3B-I/II, and ACTB. (F) Representative blots. (G) Densitometry of TIMM23.(H and I) Silencing of PINK1inhibits ATP D-R-induced mitochondrial translocation of PARK2. HK-2 cells were transfected with CtrlsiRNAandPINK1siRNA, and 24 h later the cells were further cotransfected with GFP-PARK2 and DsRed-Mito plasmids. After another 24 h, cells were subjected to ATP D-R. Finally, the cells were stained with DAPI (blue nuclei) and fixed for confocal microscopy. (H) Representative images. Bar: 20 μm.(I) Quantitative analysis of mitochondrial translocation of PARK2. Greater than 200 cells positive for both GFP-PARK2 and DsRed-Mito in each group were analyzed to determine the percent of cells showingPARK2 on mitochondria.Error bars: SEM, n = 3. *p<0.05; **p<0.01; ***p<0.001; ns, not significant.
Silencing of PINK1 or PRKN sensitizes HK-2 cells to ATP depletion-repletion-induced apoptosis
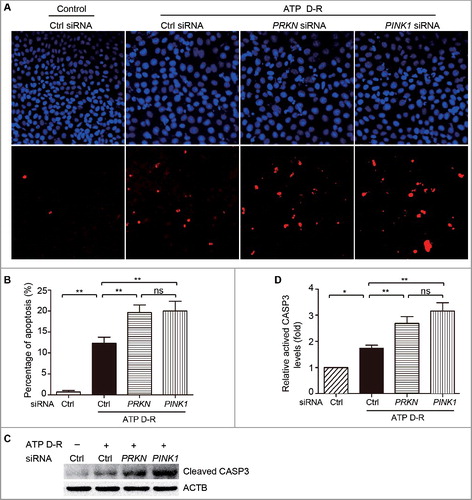
To determine the function of PINK1-PRKN/PARK2-mediated mitophagy in renal tubular cells, we initially assessed the effect of PINK1 and PRKN silencing on ATP D-R-induced apoptosis in HK-2 cells via fluorescence microscopy analysis of nuclear alterations and TUNEL assay. In HK-2 cells, apoptosis was minimal under control conditions regardless of the status of PINK1 and PRKN (Fig. S5). Upon ATP D-R, some cells showed the typical nuclear morphology of apoptosis including nuclear condensation and fragmentation as visualized by DAPI staining, and were TUNEL positive(A). Quantification by counting TUNEL-positive cells revealed that ATP D-R induced ∼15% apoptosis in control siRNA-transfected cells, but 25–30% apoptosis in cells transfected with PINK1 or PRKNsiRNA (B). The TUNEL assay results were confirmed by immunoblot analysis of activated CASP3 (caspase 3). In response to ATP D-R, HK-2 cells with PINK1 and PRKN silencing had significantly higher levels of activated CASP3 than control siRNA cells (C and D). Collectively, these findings suggest that PINK1-PRKN/PARK2-mediated mitophagy plays a cytoprotective or prosurvival role during ATP D-R in renal tubular cells.
Figure 3. Silencing of PINK1andPRKN sensitizes HK-2 cells to ATP depletion-repletion-induced apoptosis. HK-2 cells were transfected with controls iRNA(CtrlsiRNA), PRKNsiRNA, orPINK1siRNA. At 48 h after transfection, cells were subjected to 6 h of ATP depletion followed by2 h of repletion (ATP D-R). Apoptosis was assessed by nuclear morphology, TUNNEL assay and CASP3 activation. (A) Representative nuclear morphology and TUNNEL assay (× 200). (B) Apoptosis percentage. Greater than 200 cells in each group were evaluated to determine the percentage of TUNNEL-positive cells. (C) Whole cell lysates were collected for immunoblot analysis of activated CASP3and ACTB. (D) Densitometry of activated CASP3. The signal of activated CASP3 was normalized to the ACTB signal of the same samples to determine the ratios with control (Ctrl) set as 1. Error bars: SEM, n = 3. *p<0.05; **p<0.01; ***p<0.001; ns, not significant.
Renal ischemia-reperfusion induces mitophagy in proximal tubular cells in mice
In vivo, we first determined whether mitophagy was activated during renal I-R in mice. C57BL/6mice (male, ∼8–10-wk old) were subjected to 30 min of bilateral kidney ischemia followed by 48 h of reperfusion as described.Citation38 Renal cortical tissues were collected for immunoblot analysis. As shown in A-F, renal I-R induced notable increases in LC3B-II, PINK1, and PARK2, which was accompanied by a significant reduction in TIMM23 and TOMM20. Moreover, mitochondrial content assay showed that renal I-R led to an ∼15% decrease in the ratio of mitochondrial to nuclear DNA (mtDNA:nDNA) in renal cortex compared to sham-operated mice (G). Further examination using transmission electron microscopy (TEM) revealed autophagosome and mitophagosome formation in tubular cells after renal I-R (H), which were rarely observed in kidney tissues from sham-operated mice. Taken together, these findings provided in vivo evidence of mitophagy induction in proximal tubular cells following renal I-R.
Figure 4. Mitophagy is induced in proximal tubular cells after renal ischemia-reperfusion in mice. C57BL/6 wild-type mice (male, 8–10-wk old) were subjected to 30 min of bilateral renal ischemia followed by 48 h of reperfusion (I-R) or sham operation (Sham). Renal cortex and outer medullawere collected for immunoblot analyses of LC3B-I/II, TIMM23, TOMM20, PINK1, PARK2 and PPIB (loading control), for mitochondrial DNA content analysis, and for transmission electronic microscopyanalysis. (A) Representative blots. (B-E) Densitometry of LC3B-II (B), TIMM23 (C), TOMM20 (D), PINK1 (E) and PARK2 (F) signals. The signal of each protein of the I-R samples was divided by that of the sham control that was arbitrarily set as 1. (G) Relative mitochondrial DNA content (mtDNA:nDNA). (H) Representative TEM images of autophagosomes (pointed to by the arrowhead in the left panel) and a mitophagosome (pointed to by the arrowhead in the right panel) in renal proximal tubule cells after I/R. Error bars: SEM, n = 3. *p<0.05; **p<0.01; ***p<0.001; ns, not significant.
Renal ischemia-reperfusion induces more severe kidney injury in Pink1- and/or Park2-deficient mice
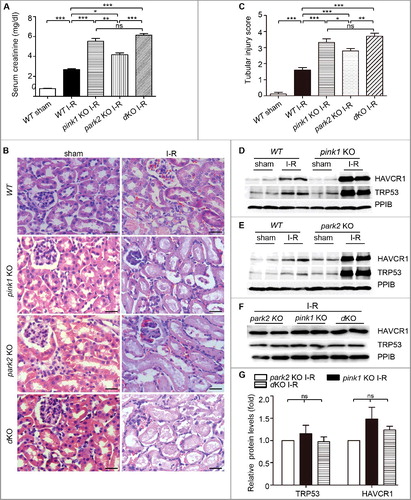
To determine the role of PINK1-PARK2-mediated mitophagy in the development of AKI in vivo, we tested pink1 and park2 single- or double-knockout (KO) mouse models (Fig. S6). Under control condition, knockout mice and their wild-type (WT) littermates showed similarly low levels of serum creatinine, indicating normal renal function (Fig. S7). Two d after renal I-R, WT mice had a serum creatinine increase to 2.68 mg/dl, indicative of renal failure. In the same experiment, pink1-KO, park2-KO, and pink1park2 double-KO (dKO) mice showed dramatic increases in serum creatinine to 5.51 mg/dl, 4.17 mg/dl, and 6.10 mg/dl, respectively (A). Consistently, renal I-R induced more severe tubular damage and acute tubular necrosis (Fig. S8) in pink1 and park2 single- or double-knockout mice than WT mice. In hematoxylin and eosin staining, these tissues displayed extensive tubule injury in renal cortex and outer medulla, including loss of brush border, formation of tubular casts, sloughing of cells into tubular lumen, and leukocyte infiltration (B). Quantitative analysis revealed that after renal I-R, pink1-KO, park2-KO, and pink1 park2-dKO kidneys had a tubular damage score of 3.32, 2.75, and 3.76, respectively, whereas the score was 1.61 for WT renal tissues(C). Immunoblot analysis also showed that renal I/R induced significantly higher levels of Havcr1/KIM-1 (hepatitis A virus cellular receptor 1) and TRP53/p53 (transformation related protein 53) in knockout mice than wild-type mice (D-G).
Figure 5. Pink1 and/orPark2 deficiency worsens renal ischemia-reperfusion-induced kidney injury. pink1 knockout (KO), park2 KO, pink1park2double-KO (dKO), and wild-type (WT) mice (male, 8–10-wk old) were subjected to 30 min of bilateral renal ischemia followed by 48 h of reperfusion (I-R) or sham operation (Sham). (A) Blood samples were collected for measurements of serum creatinine.(B) Representative histology of kidney cortex by hematoxylin-eosin (H-E) staining.Bar: 25μm. (C) Pathological score of tubular damage. (D-F) Whole tissue lysate of kidney cortex was collected for immunoblot analysis of HAVCR1, TRP53 and PPIB. (G) Densitometry of HAVCR1and TRP53 signals to compare I-R induction in park2-KO, pink1-KO, and double-KO tissues. The HAVCR1and TRP53 signals were normalized to the PPIB signal of the same samples to determine the ratios. The ratios of park2 KO were arbitrarily set as 1. Error bars: SEM, n = 3. *p<0.05; **p<0.01; ***p<0.001; ns, not significant.
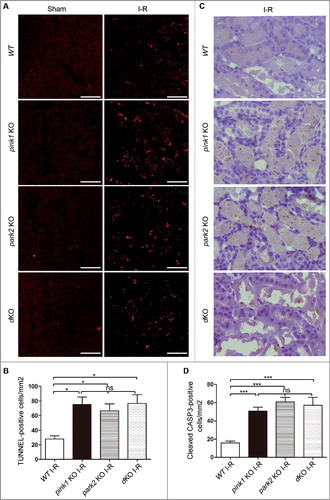
We further evaluated renal tubular cell apoptosis after renal I-R by TUNEL assay (A). Quantification by cell counting showed more TUNEL-positive tubular cells in KO mice compared to WT mice (B). Consistent with the results of the TUNEL assay, immunohistochemical staining of activated CASP3 also revealed significantly more activated CASP3-positive tubular cells in mutant kidneys than WT kidneys (C and D). Notably, both TUNEL assay and activated CASP3staining demonstrated that pink1 and park2 single- and double-knockout mice had comparable levels of tubular cell apoptosis after renal I-R (D). Collectively, these in vivo findings provide compelling evidence for a protective role of PINK1-PRKN/PARK2-mediated mitophagy in ischemic AKI.
Figure 6. Pink1 and/or Park2 knockout increases tubular cell apoptosis during renal I-R injury. pink1-KO, park2 KO, pink1 and park2 double-KO (dKO) and WT mice were subjected to renal I-R or sham operation (Sham) as in . (A) Representative images of TUNEL staining of kidney tissues. Bar:20 µm.(B) Quantification of TUNEL-positive cells in kidney tissues. (C) Representative images of histochemical staining of activated CASP3 in kidney tissues. Bar:20 µm.(D) Quantification of activated CASP3-positive cells in kidney tissues. Error bars: SEM, n = 3. *p<0.05; **p<0.01; ***p<0.001; ns, not significant.
Pink1 and Park2 deficiency enhance inflammatory cell infiltration after renal I-R
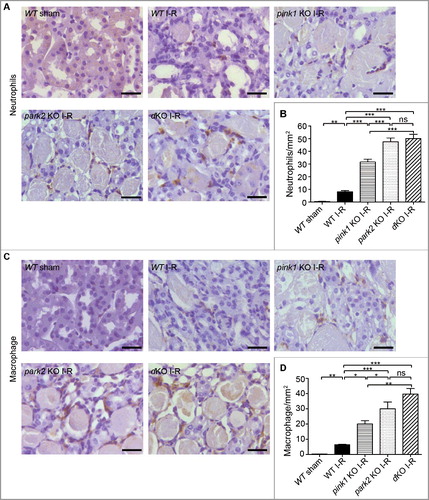
Inflammation plays an important role in the initiation and extension phases of AKI. We analyzed inflammatory cell infiltration into kidneys following renal I-R by immunohistochemical analysis of neutrophils and macrophages in renal tissue sections (A and C). Quantitative analysis by cell counting revealed in renal I-R increased neutrophils in kidneys tissues in both WT and KO mice 2 d after reperfusion. Notably, all KO mice had more neutrophils in kidneys than WT mice after renal I-R. Among KO mice, neutrophil infiltration in park2-KO and pink1 park2-dKO mice was similar, whereas the infiltration in pink1-KO mice was relatively lower ( B). Similarly, renal I-R induced higher levels of macrophage infiltration in KO mice than in WT mice (C and D). park2-KO and pink1 park2-dKO mice also showed more macrophages in kidney tissues than in pink1-KO mice after renal I-R (D).Taken together, these results suggested that Pink1 and Park2 deficiency enhanced inflammation during renal I-R.
Figure 7. Pink1 and Park2 deficiency enhances inflammatory cell infiltration during renal I-R. pink1 KO, park2 KO, pink1 and park2 double-KO (dKO) and WT mice were subjected to renal I-R or sham operation (Sham) as above. Kidneys were collected and processed for immunohistochemical analysis of neutrophils and macrophages. (A) Representative images of neutrophil staining. Scale bar: 20 μm. (B) Quantification of neutrophil-positive cells. (C)Representative images of macrophage staining. Scale bar: 20 μm. (D) Quantification of neutrophil-positive cells. Error bars: SEM, n = 3. *p<0.05; **p<0.01; ***p<0.001; ns, not significant.
Pink1 and Park2 deficiency aggravate mitochondrial damage and reduces mitochondrial ubiquitination during renal I-R
Mitophagy defines a process of selective removal of dysfunctional or damaged mitochondria via autophagy. Thus, defects in mitophagy may result in the accumulation of damaged mitochondria. We examined mitochondrial morphology in tubular cells of pink1-KO, park2-KO, pink1 park2-double KO, and WT kidneys by electron microscopy and morphometric analysis as described.Citation16 As shown in A, under control condition, the mitochondria in renal tubular cells of KO and WT mice were found to be similar in size and shape, with most mitochondria displaying tubular structure with a length greater than 2 μm. After I-R, many small and round mitochondria with a length less than 2 μmwere observed in tubular cells of WT mice, indicating mitochondrial fragmentation. Notably, tubular cell mitochondria in pink1-KO, park2-KO, and pink1 park2-dKO kidneys were more severely damaged, showing fragmentation, swelling, vacuoles in the mitochondrial matrix, and loss of cristae. For quantification, we counted the proximal tubule cells that contained all fragmented, and no long (>2 µm), mitochondria, and revealedthat sham-operated control mice had approximately 6% proximal tubule cells with mitochondrial fragmentation. After renal I-R, 15%, 22%, 28%, and 32% proximal tubule cells had fragmented mitochondria in WT, pink1-KO, park2-KO, and pink1 park2-dKO kidney tissues, respectively (B). Statistical analysis verified that, compared to WT, pink1- or park2-KO kidneys had significantly more proximal tubule cells with fragmented mitochondria, although there were no significant differences among the KO mice. These findings demonstrated a critical role of PINK1 and PARK2 in the elimination of damaged mitochondria.
Figure 8. Pink1 and/orPark2 deficiency aggravates renal I-R-induced mitochondrial damage and abrogates renal I-R-induced mitochondrial ubiquitination. (A, B) pink1 KO, park2 KO, pink1 and park2 double-KO(dKO) and WT mice were subjected to renal I-R or sham operation (Sham). Renal cortex was fixed and processed for transmission electron microscopy analysis. (A) Representative TEM images of mitochondrial morphology in proximal tubular cells. Scale bars:2 μm.(B) Quantification of mitochondrial fragmentation. Mitochondrial length was measured in individual tubular cells to determine the percentage of cells in which mitochondria with length> 2 µm was less than 1%. A total of 30 cells in control and 50 cells in ischemic kidneys from 3 animals in each condition were evaluated. (C, D) After renal I-R, renal cortex was collected and fractionated to separate cytosolic (cyto) and mitochondrial (mito) fractions followed by immunoblot analysis of ubiquitin, COX4I1 (mitochondrial marker), and TUBB5 (cytosolic marker). (C) Representative blots. (D) Densitometry of ubiquitin signals. For densitometry, the total signals of ubiquitinated mitochondrial proteins of the sham operation group was arbitrarily set as one in each blot, and the signals of other conditions in the same blot were normalized with the control. Error bars: SEM, n = 3. *p<0.05; **p<0.01; ***p<0.001; ns, not significant.
In the PINK1-PRKNPARK2 pathway of mitophagy, PINK1 phosphorylates and recruits PRKN/PARK2 to mitochondria, where PRKN/PARK2 is converted into an E3 ligase for the ubiquitination of mitochondrial proteins resulting in the recruitment of autophagy receptors and lysosomes.Citation25,Citation39,Citation40 Obviously, ubiquitination of mitochondrial proteins is an essential step in this specific pathway of mitophagy. We evaluated the effect of Pink1 and Park2 deficiencyon mitochondrial ubiquitination. Mitochondria were isolated from the renal cortex of renal I-R or sham-operated mice, and then subjected to immunoblot analysis of uibiquitin. As shown in C and D, renal I-R induced an evident increase in mitochondrial protein ubiquitination in WT mice kidneys, which was largely attenuated in Pink1- and Park2-deficient mice, suggesting a major roleof PINK1-PARK2in mitochondrial protein ubiquitination during renal I-R.
Pink1 and Park2 deficiency enhances ROS production during renal I-R
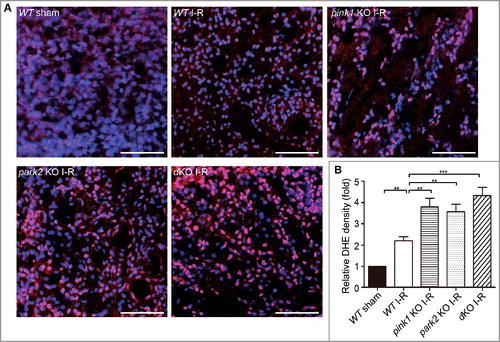
Damaged and dysfunctional mitochondria are a major source of ROS. We initially evaluated the levels of mitochondrial ROS in HK-2 cells by staining with the fluorgenic dye MitoSOX Red. Compared to control cells, HK-2 cells subjected to ATP D-R showed a dramatic increase in fluorescence intensity of MitoSOX (Fig. S9). We further determined ROS levels in renal tubular cells after renal I-R in vivo by dihydroethidium (DHE) staining, which exhibits red fluorescence in the nucleus when oxidized by ROS. Consistent with in vitro results, a significant increase in the fluorescence intensity of DHE was detected in tubular cells of WT mice after renal I-R (A), and the DHE signal appeared stronger in renal tubule cells of pink1 and park2 knockout mice (A). Analysis of fluorescence intensity indicated that the DHE signal increased to ∼2 fold of the sham control after renal I-R in WT mice, whereas pink-KO and park2-KO tissues had 3.5∼4-fold increases (B). These results are consistent with ROS production by accumulated dysfunctional mitochondria in Pink1- and Park2-deficient kidney tubule cells.
Figure 9. Pink1 and/orPark2 deficiencyenhances renal ischemia-reperfusion-induced ROS production in renal tubular cells. (A) Representative images of dihydroethidium (DHE) staining. pink1 KO, park2 KO, pink1 and park2double-KO (dKO) and WT mice were subjected to renal I-R or sham operation (Sham), and then stained with DHE. DHE nuclear staining indicates the presence of reactive oxygen species (ROS). Scale bar: 20 μm. (B) Quantification of DHE fluorescence intensity. Error bars: SEM, n = 3. *p<0.05; **p<0.01; ***p<0.001; ns, not significant.
Discussion
The involvement and regulation of mitophagy in the pathogenesis of kidney diseases, including AKI, remains poorly understood. In this study, we have shown mitophagy induction in renal tubular cells during ischemic AKI using both in vitro and in vivo models. We have further demonstrated that tubular cell mitophagy under this condition is mainly mediated by the PINK1-PRKN/PARK2 pathway. Functionally, deficiency of Pink1and/or Park2 resulted in increased tubular damage and aggravated AKI following renal I-R, supporting a protective role of PINK1-PRKN/PARK2-mediated mitophagy. We further showed evidence that, by clearing damaged mitochondria, this pathway of mitophagy may reduce ROS production and inflammation, contributing to cell survival and tissue homeostasis.
In the past few years, autophagy induction has been demonstrated in various experimental models of AKI.Citation41,Citation42 Moreover, inhibitors of autophagy enhanced AKI whereas activators of autophagy showed protective effects, suggesting a renoprotective role of autophagy in this disease condition.Citation43-45 The protective role of autophagy, especially autophagy in renal tubule cells, was further established by the tests of autophagy-deficient mouse models.Citation46-49 Despite these studies, it remains elusive as to how autophagy protects renal tubule cells in AKI.Citation41,Citation42 Currently, there are at least 2 schools of thought in the field to explain the cytoprotective effects of autophagy. First, autophagy and cell death share some of the key molecules and, as a result, the activation of autophagy may affect cell death. In this regard, a good example is BECN1 (Beclin 1), which normally binds BCL2 (BCL2, apoptosis regulator), but upon cell stress, it dissociates from BCL2 to initiate the formation of the class III phosphatidylinositol 3-kinasecomplex for autophagy.Citation50,Citation51 Thus, the activation of autophagy may release BCL2 (from BECN1), an important anti-apoptotic protein, to protect cells from death. Second, autophagy is a known mechanism for clearing cytoplasmic macromolecule aggregates and dysfunctional organelles that are potentially cytotoxic. The results of our present study support the second possibility. Specifically, our results indicate that removal of damaged mitochondria via mitophagy is an important mechanism of the renoprotective effect afforded by autophagy.
Mitophagy is a form of selective autophagy where priming of mitochondria is a determining event because it tags specific mitochondria for autophagic recognition and degradation. In renal pathophysiology, the information about mitochondrial priming for mitophagy is scarce. BNIP3 was implicated in mitochondrial priming in oxidative stress-induced mitophagy in renal tubular cells in vitro,Citation33 but its role in tubular cell mitophagy in vivo has not been investigated or verified. Alteration in PINK1 and PRKN/PARK2 expression was described in tubular cells in experimental models of diabetic nephropathy,Citation34 but functionally the role of these proteins remains unclear. In the current study, we detected the induction of PINK1 and PRKN/PARK2 in tubular cells in both in vitro and in vivo models of renal I-R injury (A andA). Furthermore, Pink1 and Park2 deficiency abrogated mitophagy in these models. During ATP D-R in HK-2 cells,silencing of PINK1 or PRKNreducedmitophagosome formation and restored mitochondrial protein TIMM23 (D and F). In vivo, Pink1 and Park2 deficiency resulted in the accumulation of damaged mitochondria in renal tubule cells and the reduction of ubiquitination in mitochondrial proteins during renal I-R (). Together, these results demonstrate strong evidence for the role of PINK1 and PRKN/PARK2 in mediating tubular cell mitophagyin ischemic AKI.
Of note, silencing of PINK1 and PRKN in HK-2 cells inhibited mitophagy during ATP D-R, but it did not have a significant effect on general or nonselective autophagy (F), indicating that RNAi-mediated knockdown of PINK1 and PRKN was insufficient to suppress general autophagy.This observation is not surprising, because, as described above, mitophagy is a selective form of autophagy that requires a unique priming process that is mainly mediated by PINK1-PRKN/PARK2 during ATP D-R in renal tubular cells. In the PINK1-PRKN/PARK2 pathway, it is generally accepted that PRKN/PARK2-mediated ubiquitination of mitochondrial proteins on the MOM is essential for mitophagy induction.Citation23, Citation24, Citation52 However, Lazarou et al. recently reported that PINK1 coulddirectly recruit autophagy receptors to induce mitophagy independently of PARK2.Citation53 Conversely, Kubli et al. showed that in cardiac myocytes, PARK2 was recruited to mitochondria for mitochondrial protein ubiquitination and mitophagy independent of PINK1.Citation54 In our present study, Pink1 and Park2 single or double knockout resulted in similar levels of reduction in mitochondrial ubiquitination and accumulation of damaged mitochondria following renal I-R (). In other words, double knockout did not show additive effects, suggesting that PINK1 and PARK2 mainly work in a common pathway of mitophagy in renal tubular cells.
During AKI, mitochondria become fragmented in a significant number of renal tubule cells due to the change of mitochondrial dynamics from fusion to fission, and mitochondrial fragmentation contributes to tubular cell death.Citation16,Citation17,Citation55 Fragmented mitochondria persist in some tubular cells during the progression of AKI to chronic pathologies.Citation35 In line with those studies, we detected mitochondrial fragmentation in tubular cells after renal I-R (A andB). The percentage of tubular cells withfragmented mitochondria in this study was lower than seen in previous work,Citation16 which was most likely caused by the difference in the time-points of observation. We examined mitochondria at 48 h of reperfusion in this study, whereas the previous study did the analysis after a very brief period (15 min) of reperfusion.Citation16 During the 48 h of reperfusion, some fragmented mitochondria may re-fuse, while others may be removed by mitophagy. Compared to wild type, a significantly higher percentage of tubular cells contained fragmented mitochondria in Pink1- and/or Park2-deficient mice (B), suggesting that the PINK1-PARK2 pathway plays an important role in clearing damaged mitochondria in tubular cells during renal I-R. Apparently, the mitochondria in these cells also showed more severe ultrastructuralchanges including mitochondrial swelling, loss of cristae, and vacuolization in the matrix (A). Of note, in sham-operated control mice, pink1 and park2 single- and double-knockout mice showed alarger number of mitochondria with irregular morphologies, including some apparently fragmented mitochondria and somewhat swollen mitochondria (A).This may be caused by reduced mitophagy and mitochondrial turnover in renal tubular cells of these mutant mice under basal conditions.
In addition to compromising cellular energetics, damaged mitochondria may induce cytotoxicity by producing excessive ROS. We verified that in pink1- and park2-knockout mice, renal I-R induced theaccumulation of damaged mitochondria, along with marked increases in ROS production in tubular cells (). Under this condition, it is conceivablethat ROS produced by damaged mitochondria may induce further damage to mitochondria, forming a vicious cycle ultimately resulting inirreversible cell injury and cell death. ROS and various factors or contents released upon cell death are also potent activators of inflammation. Consistently, renal I-R induced a stronger inflammatory response in pink1- and park2-KO mice than wild-type mice, as evidenced by significantly highermacrophage and neutrophil infiltration into kidneys in these mutant mice(). Of note, although pink1 and park2 single- or double-knockout mice had comparable ROS levels after renal I-R, park2-KO and pink1park2-dKO mice showed significantly more macrophages and neutrophils in kidney tissues than pink1-KO mice, suggesting that PARK2 may have some additional effects on inflammation. In this regard, mitochondrial DNA that escapes from autophagy degradation can also activate inflammationCitation56,Citation57; thus, it would be interesting to investigate if PARK2 is involved in the regulation of mitochondrial DNA clearance and release.
Recent studies have suggested that PINK1 and PRKN/PARK2 may have other functions beyond mitohagy. For instance, PINK1 and PRKN/PARK2 regulate vesicle trafficking in mitochondria.Citation58 PINK1 is also implicated in the regulation of mitochondrial bioenergetics by modulating complex I activity.Citation59 In innate immunity, PRKN/PARK2 may promote autophagic degradation of intracellular bacterial pathogens.Citation60 In addition, PINK1 and PRKN/PARK2 were recently shown to suppress mitochondrial antigen presentation by negatively regulating the mitochondria-derived vesicle pathway under conditions of endotoxicity and heat stress.Citation61 Thus, it would be interesting to investigate mitophagy-independent functions of PINK1 and PRKN/PARK2 in kidney diseases such as AKI.
In summary,this study has demonstrated substantial evidence for the activation of mitophagy in both in vitro and in vivo models of ischemic AKI. Mitophagy under this condition is mainly mediated by thePINK1-PRKN/PARK2 pathway. By clearing damaged mitochondria, PINK1-PRKN/PARK2-mediated mitophagy plays an important role in the maintenance of mitochondrial quality, helping renal tubular cells to survive and recover from ischemic stress. In addition, timely removal of damaged mitochondria also reduces ROS production and inflammation. It is suggested that enhancing mitophagymay offer a novel therapeutic strategy for AKI.
Materials and methods
Cells, antibodies, and special reagents
The immortalized human kidney proximal tubular cell line HK-2 (CRL-2190) was obtained from American Type Culture Collection (USA) and maintained for experiments using a standard protocol. Antibodies in the study were from the following sources: anti-LC3B (2775), anti-SQSTM1 (5114), anti-TRP53 (2524), anti-COX4I1/COXIV (11967), anti-TUBB5 (tubulin, beta 5 class I) (2128)and anti-activated CASP3 (9664) from Cell Signaling Technology; anti-PINK1 (BC100-494) from Novus Biologicals; anti-PARK2 (1679-1) from Epitomics; anti-TIMM23 (sc-514463)and anti-TOMM20 (sc-11415) from Santa Cruz Biotechnology; anti-HAVCR1 (NP_001160104) from R&D Systems; anti-PPIB/cyclophilin B (peptidylprolylisomerase B) (ab16045), anti-macrophage (RM0029-11H3) and anti-neutrophil (NIMP-R14) from Abcam; and anti-ACTB (actin beta) (SAB2108641) from Sigma-Aldrich. All secondary antibodies for immunoblot analysis were from Thermo Fisher Scientific. Special reagents were purchased from the following sources: carbonyl cyanide m-chlorophenylhydrazone (CCCP; C2759) from Sigma-Aldrich; Mitosox (M36008) and DHE (D11347) from Thermo Fisher Scientific; TUNEL assay kit (12156792910) from Roche Life Science.
Animals and renal ischemia-reperfusion
C57BL/6 mice (8 to 10 wk, male) were purchased from SJA Laboratory Animal Corporation (Hunan, China). pink1-KO mice and park2-KO mice were previously described.Citation63,Citation63 Pink1-KO mice were crossed with Park2-KO mice to produce Pink1Park2 double-KO mice. Genotyping were performed as previously described.Citation62 The mice were housed in a pathogen-free animal facility under a 12-hour light-dark pattern with free access to food and water. Male mice ∼8–10-wk old were used for experiments. Renal ischemia-reperfusion was induced in mice as described in our recent work.Citation38 Briefly, after being anesthetized with pentobarbital (50 mg/kg, i.p.), mice were kept on a Homeothermic Blanket Control Unit (Harvard Apparatus Ltd, U.K.) to monitor and maintain body temperature at ∼36.5 °C. Renal pedicles were exposed by flank incisions for bilateral clamping to induce 30 min of ischemia. The clamps were then released for reperfusion. Color change of kidneys was observed to visually monitor ischemia and reperfusion. Sham control mice underwent the same operation without renal pedicle clamping. All animal experiments were conducted in accordance with a protocol approved by the Institutional Animal Care and Use Committee of the Second Xiangya Hospital of Central South University.
Renal function and histopathology
Serum creatinine was measured by using a commercial kit (DICT-500) from BioAssay Systems to indicate renal function. In brief, blood samples were collected for coagulation and centrifugation at room temperature to collect serum. Serum samples were added to a pre-warmed (37°C) reaction mixture and the absorbance at 510 nm was monitored kinetically at 0 and 5 min of reaction. Creatinine levels (mg/dl) were then calculated based on standard curves. Renal pathology was performed as described in our recent studies.Citation47 Briefly, kidney tissues were fixed with 4% paraformaldehyde, embedded in paraffin, and sectioned at 4 µm. Hematoxylin-eosin staining was performed using standard procedures and renal tubules with the following histopathological changes were considered injured: loss of brush border, tubular dilation and disruption, cast formation, and cell lysis. Tissue damage was examined in a blinded manner and scored by the percentage of damaged tubules: 0, no damage; 1, < 25%; 2, 25-50%; 3, 50-75%; 4, > 75%.
Immunohistochemical staining of activated CASP3
Paraffin-embedded kidney sections were deparaffinized and incubated with 0.1 M sodium citrate, pH 6.0 at 65°C for antigen retrieval. After subsequently being incubated with 0.03% H2O2 to block endogenous peroxidase activity and with a buffer containing 5% BSA (Sigma-Aldrich, A9647), and 0.1% Triton X-100 (Sigma-Aldrich, T9284) to reduce nonspecific binding, the slides were sequentially exposed to 1:200 anti-cleaved CASP3(Cell Signaling Technology, 9664) at 4°C overnight, and HRP-conjugated secondary antibody (Thermo Fisher Scientific,31460) for 1 h at room temperature. Signals of the antigen-antibody complexes were visualized with VECTASTAIN® ABC Standard kit (Vector Laboratories, PK-4000) and DAB Peroxidase Substrate Kit (Vector Laboratories,SK-4100) following the protocol of the manufacturer. Finally, the slides were counterstained with DAPI (Sigma-Aldrich, D9542). Positive cell staining was detected by phase contrast microscopy. For quantification, 10–20 fields were randomly selected from each tissue section and the amount of positive cells per mm2 was evaluated.
Plasmids, short interfering RNA, and transfection
The GFP-LC3B fusion plasmid was obtained from Addgene (11546; deposited by Karla Kirkegaard at Stanford University School of Medicine, USA). pDsRed2-Mito (632421) was from Clontech Laboratories, Inc. Short interfering RNA (siRNA) oligonucleotides against PINK1, PRKN and their negative control siRNA were synthesized by GenePharma (China). The sequences of siRNA oligonucleotides were as follows: PINK1siRNA, 5'-ccaggctgggccgcaggaccg; PRKNsiRNA, 5'-ggatcagcagagcattgttca; control siRNA, 5'-uucuccgaacgugucacgu. Transient transfections of HK-2 cells with plasmid DNA or RNAi were performed using Lipofectamine 2000 reagents (Thermo Fisher Scientific, 11668019).
ATP depletion-repletion
ATP depletion-repletion in renal tubular cells is completed as previously described.Citation37 Briefly, HK-2 cells were washed with phosphate-buffered saline (137 mMNaCl, 2.7 mMKCl, 10 mMNa2HPO4, and 1.8 mMKH2PO4, pH 7.4)and then incubated in glucose-free RKRB buffer (composition: 115 mMNaCl, 1 mMKH2PO4, 4 mMKCl, 1 mMMgSO4, 1.25 mMCaCl2, 25 mMNaHCO3, pH 7.4) containing 20 mMCCCP for 2∼6 h to induce ATP depletion, which was followed by recovery in normal medium for another 2 h (repletion)to mimic reperfusion.
Analysis of apoptosis
Apoptosis of cultured proximal tubular cells was determined byTdT-mediated dUTP nick-end labeling (TUNEL) assay, nuclear morphological change and biochemical methods as described in our previous work.Citation16, Citation43The TUNEL assay was applied using an in situ cell death detection kit according to the manufacturer's instructions. For quantification, 4 fields with ∼200 cells per field were examined for TUNEL-positive cells in each condition to estimate the apoptosis percentage.To examine nuclear morphology, cells were stained with DAPI, and then examined by fluorescence microscopy. Typical apoptotic cells were identified by their morphology including nuclear condensation and fragmentation, and formation of apoptotic bodies.Inaddition, apoptosis was also evaluated by immunoblot analysis of cleaved CASP3. Apoptotic cells in renal tissue were identified by TUNEL assay as described previously.Citation16, Citation43 Briefly, tissue sections were deparaffinized and pretreated with 0.1 M sodium citrate, pH 6.0 at 65°C for 30 min and then incubated with a TUNEL reaction mixture for 1 h at 37 °C in a humidified/dark chamber. Positive staining with nuclear DNA fragmentation was detected by fluorescence microscopy. For quantification, 10 representative fields were selected from each tissue section and the amount of TUNEL-positive cells per mm2 was evaluated.
Mitochondrial isolation
Isolation of mitochondria from kidneys was achieved using a procedure based on differential centrifugation as described with minor modification.Citation64 Briefly, kidneys were rinsed in cold PBS and homogenized in 1 ml of ice-cold isotonic homogenization buffer (210 mMmannitol, 70 mMsucrose, 5 mMTris-HCl, 1 mMEDTA, pH 7.4) with a Dounce-type glass homogenizer (Fisher Scientific,06-434). The homogenate was then centrifuged 3 times (1,000 × g for 10 min at 4°C) to pellet tissue debris and nuclei, yielding a supernatant enriched in mitochondria. Mitochondria from the supernatant were finally pelleted by centrifugation at 12,000 × g and 4°C for 10 min.
Quantification of mitochondrial DNA content
Renal cortex and outer medulla were harvested from renal ischemia-reperfused mice and sham-operated control. Total cellular DNA was extracted using the DNeasy Blood and Tissue kit (Qiagen,69504) according to the manufacturer's instruction. The relative content of mitochondrial DNA (mtDNA) were measured as previously described.Citation65Briefly, both mtDNA (measured by mitochondrial 16SrRNA gene) and nuclear DNA (nDNA, measured by the B2m/β2-microglobulin gene) in the same experimental condition were evaluated by quantitative PCR using a CFX96 Real-Time PCR Detection System (Bio-Rad) with the SyBRGreenERqPCRSuperMix (Thermo Fisher Scientific,11760100). Primer sequences were as follows: 16S forward, 5’-GCCTTCCCCCGTAAATGATA-3’;16S reverse, 5’-TTATGCGATTACCGGGCTCT-3’; B2m forward, 5’-TGCTGTCTCCATGTTTGATGTATCT-3’; B2m reverse, 5’-TCTCTGCTCCCCACCTCTAAGT-3’.
Determination of reactive oxygen species
Mitochondrial ROS in HK-2 cells was measured using MitoSOX Red (Thermo Fisher Scientific, M36008) following the manufacturer's instructions. Briefly, cells grown on coverslips were washed twice with PBS to remove the medium and subsequently incubated in 5 μM MitoSOX Red at 37°C for 10 min followed by washing cells with PBS 3 times. Fluorescent images in different groups of cells were captured by confocal microscopy with exactly the same conditions. ROS in kidney tissues was determined by dihydroethidium (Thermo Fisher Scientific, D11347) staining as previously described.Citation66 Briefly, a kidney was cut into 2 halves and rinsed in cold (4°C) PBS immediately after harvest. Kidney tissues were then placed in Tissue-Tek optimal cutting temperature compound (Sakura Finetek, 4583) followed by snapping frozen in liquid nitrogen. Twenty-μm-thick cryosections of unfixed frozen kidney tissues were obtained and placed on glass slides, which was followed by incubation with 10 μMDHE in a humidified and dark chamber at 37°C for 30 minand then counterstainedwith DAPI (Sigma-Aldrich, D9542). Fluorescent images were obtained with confocal microscopy. For quantification, the fluorescent densityin the nuclei of proximal tubular cells within 10 random optical sections was determined with ImageJ software.
Transmission electron microscopy
Kidney tissues were dissected from renal ischemia-reperfused mice and sham-operated control mice for electron microscopy as previously described.Citation16 Briefly, kidney tissues were fixed in paraformaldehyde and glutaraldehyde (Sigma-Aldrich, 340855), post-fixed in osmium tetroxide (Sigma-Aldrich, 201030), dehydrated in ethanol, and embedded in Epon (Sigma-Aldrich, 45345). After polymerization of Epon, blocks were sectioned to generate 70-nm-thick sections on a microtome (Leica, Germany). The sections were sequentially stained with uranyl acetate (TED PELLA,19481) and lead citrate (Sigma-Aldrich,15326). The stained tissue sections were examined initially at low magnification (×3,000) to identify representative proximal tubules. Cells in these tubules were then examined at high magnification (×10,000) to reveal mitochondria. Mitochondrial fragmentation was determined as described in our previous work.Citation16 Briefly, digital images with scale bars were collected by TEM. The lengths of individual mitochondria in a cell were measured by tracing using NIH ImageJ software. For each cell, approximately 50 mitochondria in a representative area were measured. We determined the percentage of cells that contained less than 1% long (>2 μm) mitochondria to indicate the degree of mitochondrial fragmentation.
Immunoblot analysis
Cells or renal cortical tissues were lysed with 2% SDS buffer containing protease inhibitor cocktail (Sigma-Aldrich, P8340). Protein concentration was determined with BCA reagent (23225) from Thermo Scientific. Proteins (25 μg) were separated on SDS-polyacrylamide gels. After being transferred onto polyvinylidenedifluoride membrane, blots were blocked with 5% fat-free milk and probed subsequently with primary antibodies and horseradish peroxidase-conjugated secondary antibodies (Thermo Fisher Scientific,31430 and 31460). Antigens were visualized with an enhanced chemiluminescence kit (Thermo Fisher Scientific,32106). Either ACTB or PPIB was used to monitor protein loading and transferring. For quantification, the protein bands were analyzed with ImageJ software (NIH).
Statistics
Qualitative data are representatives of at least 3 experiments. Quantitative data were expressed as means ± SEM. Statistical analysis was conducted using the GraphPad Prism software. Statistical differences in multiple groups were determined by multiple comparisons with ANOVA followed by Tukey's post-tests. Statistical differences between 2 groups were determined by 2-tailed unpaired or paired Student t test.
Disclosure of Potential Conflicts of Interest
No potential conflicts of interest were disclosed.
supp_data_1405880.zip
Download Zip (14.7 MB)Acknowledgments
This study was supported inpart by grants from National Natural Science Foundation of China (81720108008, 81430017), and the National Institutes of Health and Department of Veterans Administration of USA.
Additional information
Funding
Related Research Data
References
- Mehta RL, Burdmann EA, Cerdá J, Feehally J, Finkelstein F, García-García G, Godin M, Jha V, Lameire NH, Levin NW, et al. Recognition and management of acute kidney injury in the international society of nephrology 0by25 global snapshot: a multinational cross-sectional study. Lancet.2016;387:2017–2025; PMID: 27086173; http://dx.doi.org/10.1016/S0140-6736(16)30240-9.
- Venkatachalam MA, Weinberg JM, Kriz W, Bidani AK. Failed tubule recovery, AKI-CKD transition, and Kidney disease progression.J Am SocNephrol. 2015;26:1765–1776; PMID: 25810494; http://dx.doi.org/10.1681/ASN.2015010006.
- Hsu CY. Yes, AKI truly leads to CKD. J Am SocNephrol.2012;23:967–969; PMID: 22499588; http://dx.doi.org/10.1681/ASN.2012030222.
- Chawla LS, Eggers PW, Star RA, Kimmel PL. Acute kidney injury and chronic kidney disease as interconnected syndromes. N Engl J Med.2014;371:58–66; PMID: 24988558; http://dx.doi.org/DOI:10.1056/NEJMra1214243.
- Ferenbach DA, Bonventre JV. Mechanisms of maladaptive repair after AKI leading to accelerated kidney ageing and CKD. Nat Rev Nephrol.2015;11:264–276; PMID: 25643664; http://dx.doi.org/DOI:10.1038/nrneph.2015.3.
- Bonventre JV, Yang L. Cellular pathophysiology of ischemic acute kidney injury. J. Clin. Invest.2011; 121:4210–4221; PMID: 22045571; http://dx.doi.org/DOI:10.1172/JCI45161.
- Sharfuddin AA, Molitoris BA. Pathophysiology of ischemic acute kidney injury.Nat Rev Nephrol.2011;7:189–200; PMID: 21364518; http://dx.doi.org/10.1038/nrneph.2011.16.
- Pabla N, Dong Z. Cisplatin nephrotoxicity: mechanisms and renoprotective strategies. Kidney Int.2008;73:994–1007; PMID: 18272962; http://dx.doi.org/10.1038/sj.ki.5002786.
- Basile DP, Anderson MD, Sutton TA. Pathophysiology of acute kidney injury.Compr Physiol.2012;2:1303–1353; PMID: xxx; http://dx.doi.org/10.1002/cphy.c110041.
- Linkermann A, Chen G, Dong G, Kunzendorf U, Krautwald S, Dong Z. Regulated cell death in AKI. J Am SocNephrol.2014;25:2689–2701; PMID: 24925726; http://dx.doi.org/10.1681/ASN.2014030262.
- Havasi A, Borkan SC. Apoptosis and acute kidney injury. Kidney Int.2011;80:29–40; PMID: 21562469; http://dx.doi.org/10.1038/ki.2011.120.
- Parikh SM, Yang Y, He L, Tang C, Zhan M, Dong Z. Mitochondrial function and disturbances in the septic kidney. SeminNephrol.2015;35:108–119; PMID: 25795504; http://dx.doi.org/10.1016/j.semnephrol.2015.01.011.
- Yang Y, Liu H, Liu F, Dong Z. Mitochondrial dysregulation and protection in cisplatin nephrotoxicity. Arch Toxicol.2014;88:1249–1256; PMID: 24859930; http://dx.doi.org/10.1007/s00204-014-1239-1.
- Tang C, Dong Z. Mitochondria in Kidney injury: when the power plant fails. J Am SocNephrol.2016;27:1869–1872; PMID: 26744487; http://dx.doi.org/10.1681/ASN.2015111277.
- Ishimoto Y, Inagi R. Mitochondria: a therapeutic target in acute kidney injury. Nephrol Dial Transplant.2016;31:1062–1069; PMID: 26333547; http://dx.doi.org/10.1093/ndt/gfv317.
- Brooks C, Wei Q, Cho SG, Dong Z. Regulation of mitochondrial dynamics in acute kidney injury in cell culture and rodent models. J Clin Invest.2009;119:1275–1285; PMID: 19349686; http://dx.doi.org/10.1172/JCI37829.
- Suzuki T, Yamaguchi H, Kikusato M, Hashizume O, Nagatoishi S, Matsuo A, Sato T, Kudo T, Matsuhashi T, Murayama K, et al. Mitochonic acid 5 binds mitochondria and ameliorates renal tubular and cardiac myocyte damage. J Am SocNephrol.2016;27:1925–1932; PMID: 26609120; http://dx.doi.org/10.1681/ASN.2015060623.
- Birk AV, Liu S, Soong Y, Mills W, Singh P, Warren JD, Seshan SV, Pardee JD, Szeto HH. The mitochondrial-targeted compound SS-31 re-energizes ischemic mitochondria by interacting with cardiolipin. J Am SocNephrol.2013;24:1250–1261; PMID: 23813215; http://dx.doi.org/10.1681/ASN.2012121216.
- Sandoval H, Thiagarajan P, Dasgupta SK, Schumacher A, Prchal JT, Chen M, Wang J. Essential role for Nix in autophagic maturation of erythroid cells. Nature.2008;454:232–235; PMID: 18454133; http://dx.doi.org/10.1038/nature07006.
- Sato M, Sato K. Degradation of paternal mitochondria by fertilization-triggered autophagy in C. elegans embryos. Science.2011;334:1141–1144; PMID: 21998252; http://dx.doi.org/10.1126/science.1210333.
- Springer MZ, Macleod KF. In brief: mitophagy: mechanisms and role in human disease. J Pathol.2016;240:253–255; PMID: 27453450; http://dx.doi.org/10.1002/path.4774.
- Youle RJ, Narendra DP. Mechanisms of mitophagy.Nat Rev Mol Cell Biol.2011;12:9–14; PMID: 21179058; http://dx.doi.org/10.1038/nrm3028.
- Matsuda N, Sato S, Shiba K, Okatsu K, Saisho K, Gautier CA, Sou YS, Saiki S, Kawajiri S, Sato F, et al. PINK1 stabilized by mitochondrial depolarization recruits Parkin to damaged mitochondria and activates latent Parkin for mitophagy. J Cell Biol.2010;189:211–221; PMID: 20404107; http://dx.doi.org/10.1083/jcb.200910140.
- Kane LA, Lazarou M, Fogel AI, Li Y, Yamano K, Sarraf SA, Banerjee S, Youle RJ. PINK1 phosphorylates ubiquitin to activate Parkin E3 ubiquitin ligase activity. J Cell Biol.2014;205:143–153; PMID: 24751536; http://dx.doi.org/10.1083/jcb.201402104.
- Geisler S, Holmström KM, Skujat D, Fiesel FC, Rothfuss OC, Kahle PJ, Springer W. PINK1/Parkin-mediated mitophagy is dependent on VDAC1 and p62/SQSTM1. Nat Cell Biol.2010;12:119–131; PMID: 20098416; http://dx.doi.org/10.1038/ncb2012.
- Wong YC, Holzbaur EL. Optineurin is an autophagy receptor for damaged mitochondria in parkin-mediated mitophagy that is disrupted by an ALS-linked mutation. ProcNatlAcadSci U S A.2014;111:E4439–48; PMID: 25294927; http://dx.doi.org/10.1073/pnas.1405752111.
- Shi J, Fung G, Deng H, Zhang J, Fiesel FC, Springer W, Li X, Luo H. NBR1 is dispensable for PARK2-mediated mitophagy regardless of the presence or absence of SQSTM1. Cell Death Dis.2015; 6:e1943; PMID: 26512954; http://dx.doi.org/10.1038/cddis.2015.278.
- Gegg ME, Cooper JM, Chau KY, Rojo M, Schapira AH, Taanman JW. Mitofusin 1 and mitofusin 2 are ubiquitinated in a PINK1/parkin-dependent manner upon induction of mitophagy. Hum Mol Genet.2010;19:4861–4870; PMID: 20871098; http://dx.doi.org/10.1093/hmg/ddq419.
- Zhang H, Bosch-Marce M, Shimoda LA, Tan YS, Baek JH, Wesley JB, Gonzalez FJ, Semenza GL. Mitochondrial autophagy is an HIF-1-dependent adaptive metabolic response to hypoxia. J Biol Chem.2008;283:10892–10903; PMID: 18281291; http://dx.doi.org/10.1074/jbc.M800102200.
- Ding WX, Ni HM, Li M, Liao Y, Chen X, Stolz DB, Dorn GW2nd, Yin XM. Nix is critical to two distinct phases of mitophagy, reactive oxygen species-mediated autophagy induction and Parkin-ubiquitin-p62-mediated mitochondrial priming. J Biol Chem.2010;285:27879–27890; PMID: 20573959; http://dx.doi.org/10.1074/jbc.M110.119537.
- Liu L, Feng D, Chen G, Chen M, Zheng Q, Song P, Ma Q, Zhu C, Wang R, Qi W, et al. Mitochondrial outer-membrane protein FUNDC1 mediates hypoxia-induced mitophagy in mammalian cells. Nat Cell Biol.2012;14:177–185; PMID: 22267086; http://dx.doi.org/10.1038/ncb2422.
- Liu L, Sakakibara K, Chen Q, Okamoto K. Receptor-mediated mitophagy in yeast and mammalian systems. Cell Res.2014;24:787–795PMID: 24903109; http://dx.doi.org/10.1038/cr.2014.75.
- Ishihara M, Urushido M, Hamada K, Matsumoto T, Shimamura Y, Ogata K, Inoue K, Taniguchi Y, Horino T, Fujieda M, et al. Sestrin-2 and BNIP3 regulate autophagy and mitophagy in renal tubular cells in acute kidney injury. Am J Physiol Renal Physiol.2013;305:F495–509; PMID: 23698117; http://dx.doi.org/10.1152/ajprenal.00642.2012.
- Zhan M, Usman IM, Sun L, Kanwar YS. Disruption of renal tubular mitochondrial quality control by Myo-inositol oxygenase in diabetic kidney disease.J Am SocNephrol.2015;26:1304–1321; PMID: 25270067; http://dx.doi.org/10.1681/ASN.2014050457.
- Lan R, Geng H, Singha PK, Saikumar P, Bottinger EP, Weinberg JM, Venkatachalam MA. Mitochondrial pathology and glycolytic shift during proximal tubule atrophy after ischemic AKI. J Am SocNephrol.2016;27:3356–3367; PMID: 27000065; http://dx.doi.org/10.1681/ASN.2015020177.
- Tang C, He L, Liu J, Dong Z. Mitophagy: basic mechanism and potential role in Kidney diseases. Kidney Dis (Basel).2015;1:71–79; PMID: 27536667; http://dx.doi.org/10.1159/000381510.
- Mikhailov V, Mikhailova M, Pulkrabek DJ, Dong Z, Venkatachalam MA, Saikumar P. Bcl-2 prevents Baxoligomerization in the mitochondrial outer membrane. J Biol Chem.2001;276:18361–18374; PMID: 11279112; http://dx.doi.org/10.1074/jbc.M100655200.
- Wei Q, Dong Z. Mouse model of ischemic acute kidney injury: technical notes and tricks. Am J Physiol Renal Physiol.2012;303:F1487–94; PMID: 22993069; http://dx.doi.org/10.1152/ajprenal.00352.2012.
- Gegg ME, Schapira AH. PINK1-parkin-dependent mitophagy involves ubiquitination of mitofusins 1 and 2: Implications for Parkinson disease pathogenesis. Autophagy.2011;7:243–245;PMID: 21139416; http://dx.doi.org/10.4161/auto.7.2.14332.
- Bingol B, Tea JS, Phu L, Reichelt M, Bakalarski CE, Song Q, Foreman O, Kirkpatrick DS, Sheng M. The mitochondrial deubiquitinase USP30 opposes parkin-mediated mitophagy. Nature.2014;510:370–375; PMID: 24896179; http://dx.doi.org/10.1038/nature13418.
- Kaushal GP, Shah SV. Autophagy in acute kidney injury.Kidney Int.2016;89:779–791; PMID: 26924060; http://dx.doi.org/10.1016/j.kint.2015.11.021.
- Havasi A, Dong Z. Autophagy and tubular cell death in the Kidney. SeminNephrol.2016;36:174–188; PMID: 27339383; http://dx.doi.org/10.1016/j.semnephrol.2016.03.005.
- Jiang M, Liu K, Luo J, Dong Z. Autophagy is a renoprotective mechanism during in vitro hypoxia and in vivo ischemia-reperfusion injury. Am J Pathol.2010;176:1181–1192; PMID: 20075199; http://dx.doi.org/10.2353/ajpath.2010.090594.
- Periyasamy-Thandavan S, Jiang M, Wei Q, Smith R, Yin XM, Dong Z. Autophagy is cytoprotective during cisplatin injury of renal proximal tubular cells. Kidney Int.2008;74:631–640; PMID: 18509315; http://dx.doi.org/10.1038/ki.2008.214.
- Yang C, Kaushal V, Shah SV, Kaushal GP. Autophagy is associated with apoptosis in cisplatin injury to renal tubular epithelial cells. Am J Physiol Renal Physiol.2008;294:F777–87; PMID: 18256309; http://dx.doi.org/10.1152/ajprenal.00590.2007.
- Mei S, Livingston M, Hao J, Li L, Mei C, Dong Z. Autophagy is activated to protect against endotoxic acute kidney injury. Sci Rep.2016;6:22171; PMID: 26916346; http://dx.doi.org/10.1038/srep22171.
- Jiang M, Wei Q, Dong G, Komatsu M, Su Y, Dong Z. Autophagy in proximal tubules protects against acute kidney injury. Kidney Int.2012;82:1271–1283; PMID: 22854643; http://dx.doi.org/10.1038/ki.2012.261.
- Takahashi A, Kimura T, Takabatake Y, Namba T, Kaimori J, Kitamura H, Matsui I, Niimura F, Matsusaka T, Fujita N, et al. Autophagy guards against cisplatin-induced acute kidney injury. Am J Pathol.2012;180:517–525; PMID: 22265049; http://dx.doi.org/10.1016/j.ajpath.2011.11.001.
- Shi M, Flores B, Gillings N, Bian A, Cho HJ, Yan S, Liu Y, Levine B, Moe OW, Hu MC. alphaKlotho mitigates progression of AKI to CKD through activation of autophagy. J Am SocNephrol.2016;27:2331–2345; PMID: 26701976; http://dx.doi.org/10.1681/ASN.2015060613.
- Pattingre S, Tassa A, Qu X, Garuti R, Liang XH, Mizushima N, Packer M, Schneider MD, Levine B. Bcl-2 antiapoptotic proteins inhibit Beclin 1-dependent autophagy. Cell.2005;122:927–939; PMID: 16179260; http://dx.doi.org/10.1016/j.cell.2005.07.002.
- Kang R, Zeh HJ, Lotze MT, Tang D. The Beclin 1 network regulates autophagy and apoptosis. Cell Death Differ.2011;18:571–580; PMID: 21311563; http://dx.doi.org/10.1038/cdd.2010.191.
- Kazlauskaite A, Kondapalli C, Gourlay R, Campbell DG, Ritorto MS, Hofmann K, Alessi DR, Knebel A, Trost M, Muqit MM. Parkin is activated by PINK1-dependent phosphorylation of ubiquitin at Ser65. Biochem J.2014;460:127–139; PMID: 24660806; http://dx.doi.org/10.1042/BJ20140334.
- Lazarou M, Sliter DA, Kane LA, Sarraf SA, Wang C, Burman JL, Sideris DP, Fogel AI, Youle RJ. The ubiquitin kinase PINK1 recruits autophagy receptors to induce mitophagy. Nature.2015;524:309–314; PMID: 26266977; http://dx.doi.org/10.1038/nature14893.
- Kubli DA, Cortez MQ, Moyzis AG, Najor RH, Lee Y, Gustafsson AB. PINK1 Is Dispensable for Mitochondrial Recruitment of Parkin and Activation of Mitophagy in Cardiac Myocytes. PLoS One.2015;10:e0130707; PMID: 26110811; http://dx.doi.org/10.1371/journal.pone.0130707.
- Tran M, Tam D, Bardia A, Bhasin M, Rowe GC, Kher A, Zsengeller ZK, Akhavan-Sharif MR, Khankin EV, Saintgeniez M, et al. PGC-1alpha promotes recovery after acute kidney injury during systemic inflammation in mice. J Clin Invest.2011;121:4003–4014; PMID: 21881206; http://dx.doi.org/10.1172/JCI58662.
- Oka T, Hikoso S, Yamaguchi O, Taneike M, Takeda T, Tamai T, Oyabu J, Murakawa T, Nakayama H, Nishida K, et al. Mitochondrial DNA that escapes from autophagy causes inflammation and heart failure. Nature.2012;485:251–255; PMID: 22535248; http://dx.doi.org/10.1038/nature10992.
- Tsuji N, Tsuji T, Ohashi N, Kato A, Fujigaki Y, Yasuda H. Role of Mitochondrial DNA in Septic AKI via Toll-Like Receptor 9. J Am SocNephrol.2016;27:2009–2020; PMID:26574043; http://dx.doi.org/10.1681/ASN.2015040376.
- McLelland GL, Soubannier V, Chen CX, McBride HM, Fon EA. Parkin and PINK1 function in a vesicular trafficking pathway regulating mitochondrial quality control. EMBO J.2014;33:282–295; PMID: 24446486; http://dx.doi.org/10.1002/embj.201385902.
- Morais VA, Haddad D, Craessaerts K, De Bock PJ, Swerts J, Vilain S, Aerts L, Overbergh L, Grünewald A, Seibler P, et al. PINK1 loss-of-function mutations affect mitochondrial complex I activity via NdufA10 ubiquinone uncoupling. Science.2014;344:203–207; PMID: 24652937; http://dx.doi.org/10.1126/science.1249161.
- Manzanillo PS, Ayres JS, Watson RO, Collins AC, Souza G, Rae CS, Schneider DS, Nakamura K, Shiloh MU, Cox JS. The ubiquitin ligase parkin mediates resistance to intracellular pathogens. Nature.2013;501:512–516. PMID: 24005326; http://dx.doi.org/10.1038/nature12566.
- Matheoud D, Sugiura A, Bellemare-Pelletier A, Laplante A, Rondeau C, Chemali M, Fazel A, Bergeron JJ, Trudeau LE, Burelle Y, et al. Parkinson's disease-related proteins PINK1 and parkin repress mitochondrial antigen presentation. Cell.2016;166:314–327. PMID: 27345367; http://dx.doi.org/10.1016/j.cell.2016.05.039.
- Xiong H, Wang D, Chen L, Choo YS, Ma H, Tang C, Xia K, Jiang W, Ronai Z, Zhuang X, et al. Parkin, PINK1, and DJ-1 form a ubiquitin E3 ligase complex promoting unfolded protein degradation. J Clin Invest.2009;119:650–660 PMID:19229105; http://dx.doi.org/10.1172/JCI37617.
- Choo YS, Tang C, Zhang Z. Critical role of PINK1 in regulating Parkin protein levels in vivo. Arch Neurol.2011;68:684–685; PMID: 21555650; http://dx.doi.org/10.1001/archneurol.2011.95.
- Fernandez-Vizarra E, Lopez-Perez MJ, Enriquez JA. Isolation of biogenetically competent mitochondria from mammalian tissues and cultured cells.Methods.2002;26:292–297; PMID: 12054919; http://dx.doi.org/10.1016/S1046-2023(02)00034-8.
- Bueno M, Lai YC, Romero Y, Brands J, St Croix CM, Kamga C, Corey C, Herazo-Maya JD, Sembrat J, Lee JS, et al. PINK1 deficiency impairs mitochondrial homeostasis and promotes lung fibrosis. J Clin Invest2015; 125:521–538; PMID: 10.1172/JCI74942; http://dx.doi.org/10.1172/JCI74942.
- Nijmeh J, Moldobaeva A, Wagner EM. Role of ROS in ischemia-induced lung angiogenesis.Am J Physiol Lung Cell Mol Physiol.2010;299:L535–41; PMID: 20693319; http://dx.doi.org/10.1152/ajplung.00002.2010.