
ABSTRACT
HSPA5/GRP78/BiP plays an important role in cell survival or tumor progression. For these reasons, HSPA5 is an emerging therapeutic target in cancer development. Here we report that HSPA5 contributes to head and neck cancer (HNC) survival via maintenance of lysosomal activity; however, a nonthermal plasma (NTP, considered as a next-generation cancer therapy)-treated solution (NTS) inhibits HNC progression through HSPA5-dependent alteration of lysosomal activity. HSPA5 prevents NTS-induced lysosome inhibition through lysosomal-related proteins or regulation of gene expression. However, NTS-induced MUL1/MULAN/GIDE/MAPL (mitochondrial ubiquitin ligase activator of NFKB 1) leads to downregulation of HSPA5 via K48-linked ubiquitination at the lysine 446 (K446) residue. MUL1 knockdown hinders NTS-induced lysosome inhibition or cytotoxicity through the reduction of HSPA5 ubiquitination in HNC cells. While MUL1 was suppressed, HSPA5 was overexpressed in tissues of HNC patients. NTS strongly inhibited HNC progression via alterations of expression of MUL1 and HSPA5, in vivo in a xenograft model. However, NTS did not induce inhibition of tumor progression or HSPA5 reduction in MUL1 knockout (KO) HNC cells which were generated by CRISPR/Cas9 system. The data provide compelling evidence to support the idea that the regulation of the MUL1-HSPA5 axis can be a novel strategy for the treatment of HNC.
Abbreviations
| AKT1 | = | thymoma viral proto-oncogene homolog1 |
| ATG3 | = | autophagy-related 3 |
| ATG5 | = | autophagy-related 5 |
| ATG7 | = | autophagy-related 7 |
| BAX | = | BCL2-associated X protein |
| BID | = | BH3 interacting domain death agonist |
| Cas9 | = | CRISPR associated protein 9 |
| CASP3 | = | caspase 3 |
| CFC1 | = | cripto, FRL-1, cryptic family 1 |
| CHX | = | cycloheximide |
| CRISPR | = | clustered regularly interspaced short palindromic repeats |
| CTSD | = | cathepsin D |
| CTSL | = | cathepsin L |
| EIF2AK3/PERK | = | eukaryotic translation initiation factor 2 alpha kinase 3 |
| EIF2S1 | = | eukaryotic translation initiation factor 2, subunit 1 alpha |
| E-64 | = | L-trans-epoxysuccinyl-leucylamido(4-guanidino)butane |
| ER | = | endoplasmic reticulum |
| ERN1/IRE1 | = | endoplasmic reticulum (ER) to nucleus signaling 1 |
| GFP | = | green fluorescent protein |
| GAPDH | = | glyceraldehyde-3-phosphate dehydrogenase |
| HNC | = | head and neck cancer |
| HSPA5/GRP78/BiP | = | heat shock protein 5 |
| LAMP1 | = | lysosomal-associated membrane protein 1 |
| MAP1LC3-II | = | microtubule-associated protein 1 light chain 3-II |
| MG132 | = | carbobenzoxy-leu-leu-leucinal |
| MMP | = | mitochondrial membrane potential |
| MTOR | = | mechanistic target of rapamycin (serine/threonine kinase) |
| MUL1 | = | mitochondrial ubiquitin ligase activator of NFKB 1 |
| NTP | = | nonthermal plasma |
| NTS | = | NTP-treated solution |
| NH4Cl | = | ammonium chloride |
| PRKAA/AMPK | = | protein kinase, AMP-activated, alpha 1 catalytic subunit |
| ROS | = | reactive oxygen species |
| RPS6 | = | ribosomal protein S6 |
| SQSTM1/p62 | = | sequestome 1 |
| TFEB | = | transcription factor EB |
| TOMM20 | = | translocase of outer mitochondrial membrane 20 homolog (yeast) |
| TUDCA | = | tauroursodeoxycholic acid |
| Ub | = | ubiquitin |
| ULK1 | = | unc-51 like kinase 1 |
| UPS | = | ubiquitin-proteasome system |
| Z-VAD-FMK | = | benzyloxycarbonyl-Val-Ala-Asp (OMe) fuoromethylketone. |
Introduction
Cells experience endoplasmic reticulum (ER) stress when the efficiency of secretory protein folding is threatened, which elicits the homeostatic unfolded protein response (UPR) [Citation1]. The cores of most tumors inevitably become hypoxic and nutrient-depleted [Citation2]. The UPR is activated in various cancers by impaired generation of ATP that compromises ER protein foldin [Citation2] and activation of the UPR in tumors leads to increased autophagy [Citation3]. Accordingly, hypoxic regions of human tumor xenografts show high expression of autophagy factors, such as MAP1LC3-II, leading to autophagy [Citation3].
HSPA5/GRP78/BiP (heat shock protein 5) is a master regulator of the UPR. It also interacts with CFC1/Cripto. CFC1 is a glycosylphosphatidylinositol-anchored, developmentally regulated oncoprotein [Citation4]. HSPA5 may also directly protect cells against ER stress and damage due to reactive oxygen species (ROS) [Citation5]. HSPA5 can regulate the activity of the macroautophagic receptor SQSTM1/p62 (sequestosome 1) via N-terminal arginylation by cellular stressors such as ROS [Citation6]. HSPA5 plays an important role in cell survival by clearance of misfolded proteins in lysosomes through the interaction of SQSTM1 [Citation6]. In addition, HSPA5 regulates calcium (Ca2+) signaling and controls cell survival in mitochondria-associated ER membrane (MAM) through interaction with SIGMAR1/Sig-1Rs/sigma-1 [Citation7]. However, the protective mechanism of HSPA5 remains unclear.
MUL1/MULAN/GIDE/MAPL (mitochondrial ubiquitin ligase activator of NFKB 1) has E3 ligase activity through a RING finger domain and is embedded in the outer mitochondrial outer membrane [Citation8]. MUL1 regulates mitochondrial fission through sumoylation of DNM1L/Drp1 [Citation9,Citation10]. MUL1 also associates with mitophagy in a ULK1 dependent fashion [Citation11]. MUL1 can induce K48-linked ubiquitination of AKT and inhibits cancer cell proliferation and migration [Citation8,Citation12]. MUL1 expression is increased by cigarette smoke and results in pulmonary emphysema due to cell death of lung vascular endothelial cells [Citation13]. We have previously described that MUL1 is suppressed in HNC cells compared with normal cells [Citation14]. In the same study, we also chronicle the inhibition of head and neck cancer (HNC) progression in vitro and in vivo by MUL1-mediated ubiquitination of AKT. Thus, MUL1 may contribute to HNC progression; however, the role of MUL1 in HNC remains unclear.
Nonthermal plasma (NTP) is an ionized gas composed of charged particles, electronically excited atoms, molecules, radicals, and ultraviolet (UV) photons [Citation15]. NTP is a convergence technology that has been studied as a next-generation cancer therapy. NTP has demonstrated anticancer effects in several different solid tumors in vitro and in vivo [Citation15–18], including HNC as in our previous reports [Citation19,Citation20]. The inhibition of HNC progression stated above was equally achieved by direct application of NTP spray or in the form of a solution (NTP-treated solution, NTS) on cultured cells or tissues. Two types of NTP are distinguished by their manufactured forms—the aforementioned NTP direct spray and NTS. NTP is effective as a cancer treatment, but has limitations because it cannot be directly delivered to the tumor because of the covering subcutis and other surrounding tissues. In contrast, NTS allows easy delivery in vivo while offering similar or more potent anticancer effects [Citation14]. NTS inhibits HNC progression through MUL1-dependent AKT ubiquitination and degradation [Citation14]. The biggest advantage of using NTS in cancer therapy is the cancer cell-specific activity [Citation14,Citation21]. However, the molecular mechanisms remain largely unclear.
In the present study, we report that HSPA5 controls lysosomal activity through lysosome-related proteins or regulation of gene expression. Secondly, we document MUL1-induced ubiquitination of HSPA5 at lysine 446 (K446) and NTS controlled MUL1-mediated HSPA5 ubiquitination. The data indicate that NTS-mediated MUL1 regulation induces ubiquitination of HSPA5 and leads to a change in cell signaling from autophagy-mediated survival to apoptosis in HNC cells. We suggest that the MUL1-HSPA5 axis can be a novel therapeutic target for HNC therapy.
Results
Autophagy is involved in NTS-induced cell death in HNC
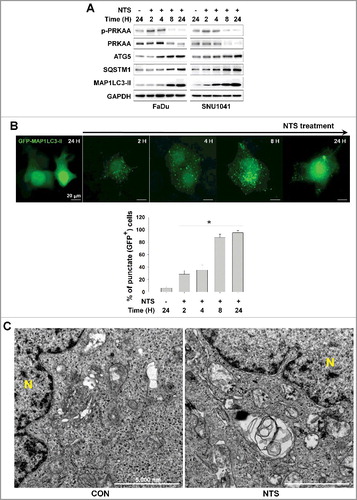
Previously we described the manufacturing process of NTS and its inhibitory effect on progression of HNC in vitro and in vivo [Citation14]. NTS reduced viability of HNC cells such as oral cavity cancer (Figure S1A) and the hypopharynx cancer cell line (Figure S1B). Following our previous demonstration that NTS induces cell death by degrading AKT [Citation14], we now confirm the process with respect to phosphorylated (p)-AKT and AKT levels. Both p-AKT and AKT decreased in response to NTS in FaDu and SNU1041 HNC cells (Figure S1C). p-MTOR and MTOR levels were also decreased in NTS-treated cells. The AKT-MTOR signaling pathway plays a role in autophagy, as MTOR regulates conditions that lead to its own inhibition, such as starvation and lysosomal stress, as well as increased lysosomal and autophagic gene transcription [Citation22]. Therefore, to determine whether autophagy in involved in NTS-induced HNC cell death, we analyzed the autophagy-related protein SQSTM1/p62 (sequestosome 1) or phosphorylation of AMP-activated protein kinase (AMPK, whose alpha subunits are also denoted by the common “root” acronym “PRKAA”). NTS induced PRKAA phosphorylation at an earlier period, however, SQSTM1 was increased from 8 h by NTS (A). To confirm the induction of autophagy by NTS in HNC, we checked the level of ATG3, ATG5 and ATG7. The content of these proteins increased with time in response to NTS treatment in both HNC cell types (Figure S1D). In the GFP-MAP1LC3-II puncta assay, GFP-MAP1LC3-II-positive puncta were also significantly increased with time in response to NTS (B). Particularly, GFP-MAP1LC3-II-positive puncta were strongly increased after 8 h. Autophagic vesicles were observed in NTS-treated HNC cells by transmission electron microscopy (TEM, C). Because autophagy can be activated as a means of cell survival in tumors [Citation2]. we checked the protective effect of autophagy during NTS treatment. Blockade of autophagy in HNC cells by ATG5 siRNA revealed a synergistic effect against NTS, however, SQSTM1 was accumulated by NTS and it was enhanced in ATG5 knockdown cells (Figure S1E). The finding supports the view that NTS was lethal to HNC cells even though autophagy was operating as a protective mechanism for survival in the cells.
Figure 1. Autophagy signaling is involved in NTS-mediated HNC cell death. (A) FaDu and SNU1041 cells were treated with or without NTS for the indicated times in the absence of serum and then each protein level was determined with western blots. (B) NTS induced accumulation of GFP-MAP1LC3-II puncta. The GFP-MAP1LC3-II plasmid was transfected into FaDu cells. After 24 h, NTS treatment was given for the indicated times and GFP-MAP1LC3-II puncta were analyzed by fluorescence microscopy (scale bar: 20 μm). GFP-MAP1LC3-II puncta were observed by fluorescence microscopy in 5 fields captured randomly and the GFP-MAP1LC3-II puncta-positive cells were counted (n = 3; scale bar: 20 μm). Data are means ± SD. Asterisks indicate statistically significant differences (P < 0.05). (C) TEM analysis in NTS-treated cells. FaDu cells were treated with NTS for 24 h, and then autophagic vesicles were observed by TEM (N, nucleus; scale bar: 5,000 nm).
NTS induces ER stress or autophagy through HSPA5 downregulation
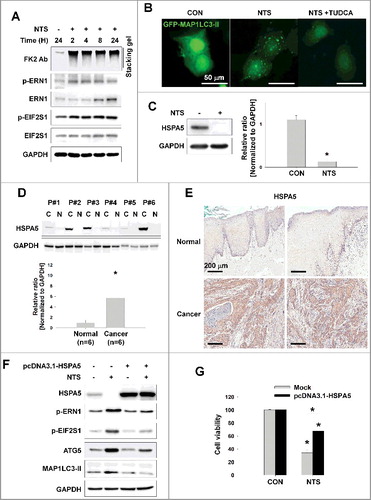
Autophagy was induced by NTS as a protective mechanism, yet the HNC cells died (). ER stress effects cellular autophagy as a means of clearing misfolded proteins [Citation23]. Therefore, we determined whether NTS could induce ER stress and play a role in cell survival. NTS activated ER stress by increasing phosphorylation of the regulators of ER stress-induced autophagy, such as ERN1 and EIF2S1 (Figure S2A). The ubiquitin-proteasome system (UPS) is a major degradation system for short-lived proteins [Citation24] and is important for degradation of misfolded proteins exported from the ER. We have reported previously that NTS treatment leads to the accumulation of ubiquitinated AKT [Citation14]. Thus, we hypothesized that NTS induces initiation of ER stress or autophagy via accumulation of ubiquitinated proteins. Immunoblots with an antipolyubiquitinated protein antibody (clone FK2) revealed ubiquitinated proteins in NTS-treated cells beginning at 2 h; the effect on proteins was sustained for 24 h (A) even though proteasome activity is unchanged in response to NTS under the same conditions [Citation14]. ERN1 and EIF2S1 phosphorylation were also increased in a time-dependent manner by NTS treatment. Cells in which ER stress had been inhibited using the chemical chaperone tauroursodeoxycholic acid (TUDCA) showed an attenuated response in NTS-induced GFP-MAP1LC3-II puncta, ER stress, or cytotoxicity (B, as well as S2B and S2C). HSPA5 is important in ER stress regulation and the ubiquitination of proteins destined for autophagic bodies [Citation6]. This observation prompted us to test the influence of NTS on HSPA5 status. NTS induced the downregulation of HSPA5 (C). In the present study, HSPA5 was highly expressed in tumor tissues from HNC patients compared to normal tissues, in frozen or paraffin-embedded specimens (D and E). NTS-induced ER stress, autophagy, and cytotoxicity were inhibited by HSPA5 overexpression (F and G). These results indicated that HSPA5 is pivotal in HNC cell survival via ER stress or autophagy regulation.
Figure 2. NTS-induced inhibition of HSPA5 expression and its pivotal role in ER stress or autophagy. (A) FaDu cells were treated with NTS for the indicated times and protein levels were evaluated by western blot assay. (B) Inhibition of NTS-induced ER stress prevents autophagy. GFP-MAP1LC3-II plasmids were transfected into FaDu cells and 24 h later, the cells were pretreated with TUDCA (1 mg/ml) for 1 h. NTS treatment was given for 24 h with or without TUDCA in absence of serum. GFP-MAP1LC3-II puncta were analyzed with a fluorescence microscope (scale bar: 50 μm). (C) HSPA5 was decreased in response to NTS. FaDu cells were treated with NTS for 24 h in the absence of serum, and HSPA5 expression was determined by western blot assay (n = 3). (D) HSPA5 overexpression in HNC tissues. Proteins were isolated from frozen tissues of 6 patients with HNC, and HSPA5 expression level was determined by western blot assay (n = 6; C, cancer tissue; N, normal tissue; P, patient). (E) The immunohistochemistry analysis of HSPA5 in cancer or normal (scale bar: 200 μm). (F and G) HSPA5 overexpression inhibited NTS-induced ER stress, autophagy and cytotoxicity. HSPA5 plasmids were transfected into FaDu cells, and the cells were treated with NTS for 24 h in the absence of serum. Protein levels were evaluated by western blot assay (F) and MTT assay (G; n = 6). (C, D and G) Data are means ± SD. Asterisks indicate statistically significant differences (P < 0.05).
HSPA5 is important in maintenance of lysosomal activity
ER stress and autophagy are activated in cancer cells as a survival mechanism [Citation2,Citation23]. However, HNC cells could not avoid NTS-induced death despite ER stress or autophagy activation (). In these circumstances, we observed 2 different HNC cell phenotypes from the NTS treatment. NTS treatment alone did not affect cell viability for 4 h, but cells began to die after 8 h (A). During the earlier period, NTS-induced HNC death was prominent in ATG5 knockdown cells (Figure S3A). Therefore, autophagy acted as a protective mechanism in NTS-treated HNC cells. However, GFP-MAP1LC3-II puncta had accumulated by 24 h of NTS treatment (B, S1D and S1E). Autophagic bodies are digested in the lysosome, which is important for clearing misfolded proteins via ER stress-mediated autophagy [Citation2,Citation6,Citation23]. Thus, we tested whether NTS could affect lysosomal activity or homeostasis. Lysosomal activity was significantly decreased by NTS treatment compared with nontreated cells (B). We confirmed that NTS induced lysosome inhibition using lysosomal inhibitors, such as ammonium chloride (NH4Cl) or a lysosomal protease inhibitor (E-64), through determination of GFP-MAP1LC3-II puncta accumulation. Accumulation of GFP-MAP1LC3-II puncta was strongly induced in NH4Cl- and E-64-treated cells, and NTS showed a similar effect (C). NTS-induced death was enhanced in cells cotreated with a lysosome inhibitor (Figure S3B). If the apoptosis signal is initiated or activated in cells, autophagy would be inactivated [Citation25]. This prompted us to check ATG5 and ATG7 gene expression in NTS-treated cells. ATG5 and ATG7 were increased from 2 h, but the 2 genes were suppressed from 8 h by NTS treatment (Figure S3C). These data indicated that NTS induced switching of HNC cell signal events from autophagy-mediated survival to apoptosis, by inactivating lysosomes. The autophagic receptor SQSTM1 is important in the transport of ubiquitin-conjugated cargoes to autophagosomes and subsequent degradation in lysosomes [Citation26,Citation27]. This observation prompted us to confirm the inhibitory effect of NTS against lysosomal activity by monitoring the change in the level of SQSTM1. NTS induced not a decrease but an increase in the level of SQSTM1 in HNC cells which also exhibited higher MAP1LC3-II levels (A, S1E and S3D). Similarly, PRKAA phosphorylation was decreased from 8 h in response to NTS (A). These results indicated that NTS-induction of cell death in HNC might be related to alterations in lysosomal activity.
Figure 3. HSPA5 has a pivotal role in NTS-mediated regulation of lysosomal activity. (A) FaDu cells were seeded in a 48-well plate and treated with NTS for the indicated times. Cells viability was measured by the MTT assay (n = 6). Data are means ± SD. Asterisks indicate statistically significant differences (P < 0.05). (B) FaDu cells were treated with or without NTS for 24 h in the absence of serum and lysosomal activity was measured by FACS analysis (n = 3). Data are means ± SD. Asterisks indicate statistically significant differences (P < 0.05) (*, vs O H). (C) GFP-MAP1LC3-II puncta was accumulated by inhibiting lysosomes. NH4Cl (10 mM), E-64 (10 μM), and NTS were added to GFP-MAP1LC3-II-transfected cells for 24 h in the absence of serum. GFP-MAP1LC3-II puncta were observed by fluorescence microscopy. Scale bar: 20 μm. (D) HSPA5 overexpression inhibits NTS-induced downregulation of lysosome-related proteins or gene expression. FaDu cells were transfected with or without pcDNA3.1-HSPA5 for 24 h, and then cells were treated with NTS for the indicated times. The indicated proteins or gene expression were determined by western blot assay or RT-PCR. (E to G) HSPA5 overexpression inhibits NTS-induced downregulation of lysosomal activity. HSPA5-transfected or nontransfected cells were treated with NTS for 24 h and then lysosomal activity was assessed with FACS analysis (E), TFEB transcription factor activity assay (F) or CTSD (cathepsin D) activity assay (G). (E, F and G) Data are means ± SD. Asterisks indicate statistically significant differences (n = 3, P < 0.05).
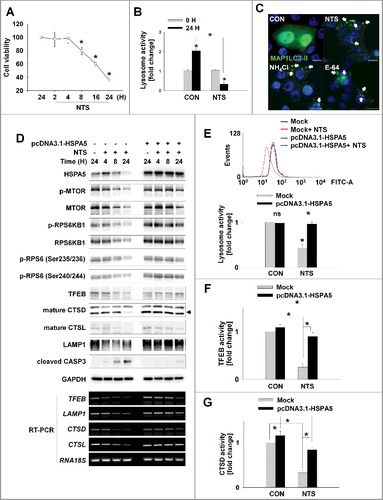
Having demonstrated the pivotal role of HSPA5 in NTS-induced ER stress, autophagy, and cytotoxicity (), we evaluated the involvement of HSPA5 in NTS-mediated lysosome inhibition. pcDNA-HSPA5 plasmids were used to transfect into FaDu human hypopharynx cancer cells and the status of proteins related to lysosomal activity was determined. MTOR regulates lysosomal homeostasis and activity [Citation22,Citation28,Citation29]. NTS inhibited MTOR phosphorylation and kinase activity in a time-dependent fashion (D, mock-transfected group). Lysosomal homeostasis- and activity-related proteins were also affected by NTS. TFEB is a key regulator of lysosomal and autophagic functions, and energy metabolism [Citation30,Citation31]. LAMP1, is a TFEB target gene that plays a role in MAP1LC3-II -associated phagocytosis by conjugating MAP1LC3-II to phagosomal membranes [Citation32]. NTS led to a downregulation of TFEB, CTSD (cathepsin D), CTSL (cathepsin L), and LAMP1 protein levels (D, mock-transfected group). However, there were no changes in the levels of NTS-induced MTOR or lysosome-related proteins in HSPA5-overexpressing cells (D, pcDNA3.1-HSPA5-transfected group). Additionally, RT-PCR demonstrated that HSPA5 overexpression inhibited the reduction in TFEB, LAMP1, CTSD, and CTSL gene expression mediated by NTS (D, RT-PCR). For these reason, HSPA5 overexpression could protect lysosomal function from NTS-induced inhibition of lysosomal activity (E), TFEB transcription factor (F) or CTSD activity (G). In contrast, HSPA5 knockdown cells showed a synergistic effect in the NTS-mediated decrement of lysosomal activity (Figure S3E). Although more detailed experiments are necessary to elucidate the signaling relationship between HSPA5 and MTOR, as well as HSPA5 and lysosome-related gene expression, the present observations indicate that HSPA5 has a pivotal role in NTS-induced lysosomal activity for the regulation of homeostasis in HNC cells. The data indicate that the accumulation of NTS-induced autophagy-related proteins like MAP1LC3-II after 8 h of NTS treatment was not associated with the induction of autophagy (Figure S3C) but was associated with lysosome inhibition. The data reinforce the pivotal role of HSPA5 in the regulation of NTS-induced lysosomal activity.
HSPA5 inhibits NTS-mediated apoptosis through mitochondrial membrane potential (MMP) regulation of reactive oxygen species (ROS)
NTS-mediated ER stress was initiated from 2 h and was sustained until 24 h (B). A previous study demonstrates that ER stress induces mitochondrial dysfunction through Ca2+ accumulation into mitochondria, derived from the ER [Citation33]. Presently, autophagy was pivotal in early stage of NTS-induced HNC cell death (Figure S3A). However, cells underwent death after 8 h of NTS treatment due to lysosome inhibition that occurred in an HSPA5-dependent manner (). This prompted us to investigate whether NTS could turn-on apoptosis through mitochondrial dysfunction and whether HSPA5 is involved in the signaling events of NTS-mediated apoptosis. Since the mitochondrial membrane potential (MMP) is affected by ER stress [Citation33], we checked the NTS-induced MMP status relative to time of exposure to NTS. NTS weakly caused the downregulation of MMP at 4 h and MMP was strongly exchanged from healthy (red) to apoptotic (green) status at 24 h (Figure S4A). Since the apoptosis signal pathway can be induced by ROS derived from mitochondria, we investigated whether NTS could induce increases in the level of intracellular ROS. NTS did indeed induce an increase in a time-dependent manner (Figure S4B). Western blots showed that HSPA5 was decreased in a time-dependent manner and MAP1LC3-II was increased from 2 h with continued accumulation until 24 h in the presence of NTS (Figure S4C). At the same time, BID cleavage was induced from 6 h and BAX was increased by NTS. Cleaved CASP3 was detected from 8 h and increased until 24 h. NTS-induced HNC cytotoxicity was prevented by the caspase protease inhibitor, Z-VAD-FMK (A).
Figure 4. HSPA5 inhibits NTS-induced apoptosis through intracellular ROS control. (A) NTS-induced cytotoxicity was prevented by the caspase protease inhibitor, Z-VAD-FMK. FaDu cells were pretreated with Z-VAD-FMK (10 μM) for 1 h and then the NTS treatment was given for a further 24 h. Cell viability was assessed by MTT assay. Data are means ± SD. Asterisks indicate statistically significant differences (n = 6, P < 0.05). (B and C) HSPA5-transfected cells exhibited inhibition of NTS-induced mitochondrial apoptosis signaling and the alleviation of MMP alteration. FaDu cells were transfected with or without pcDNA3.1-HSPA5 for 24 h and then NTS treatment was given for 24 h. The indicated protein levels were determined by western blot (B) and MMP alteration was evaluated by JC-1 assay (C, healthy, red; apoptotic, green). JC-1-stained live cells were observed by fluorescence microscopy in 5 fields captured randomly and red/green fluorescent density ratio was quantified (n = 3; scale bar: 20 μm). Data are means ± SD. Asterisks indicate statistically significant differences (P < 0.05). (D) The ROS increment induced by NTS was inhibited by HSPA5 overexpression. NTS treatment was given to pcDNA3.1-HSPA5-transfected or nontransfected cells for 24 h and then intracellular ROS levels were determined by FACS analysis (n = 3). Data are means ± SD. Asterisks indicate statistically significant differences (P < 0.05). (E and F) NTS induced translocation of HSPA5 to mitochondria. (E) FaDu cells were seeded on cover-slips and then NTS treatment was given for 8 h in the absence of serum. After cell fixing, mitochondria (green) or endogenous HSPA5 (red) were stained with anti-TOMM20 or anti-HSPA5 antibodies. Green and red signal intensity was measured by confocal microscopy (allow). (F) NTS treatment was given to FaDu cells for the indicated times. After cellular fractionation, HSPA5 levels were assessed by western blot (Whole: whole cells lysate; cyto, cytosolic fraction; mito, mitochondria fraction).
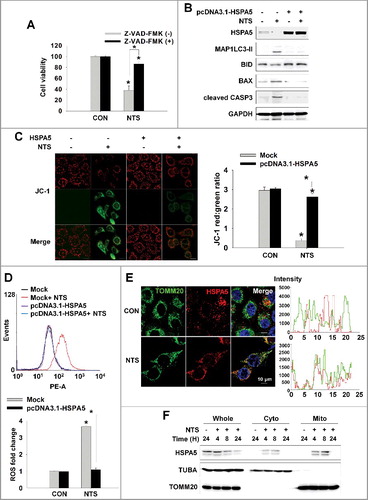
HSPA5 overexpression contributed to the inhibition of NTS-induced cytotoxicity through ER stress, autophagy, and lysosomal activity alterations. Accordingly, we investigated the involvement of HSPA5 in the mitochondrial apoptosis signaling pathway induced by NTS or MMP change. HSPA5 overexpression alleviated NTS-induced mitochondrial apoptosis signaling and MMP alteration (B and C). The NTS-induced ROS increment was inhibited in HSPA5-overexpressing cells (D). In contrast to HSPA5 overexpression, basal or NTS-induced ROS levels were increased in HSPA5 siRNA-transfected cells (Figure S4D). HSPA5 plays a pivotal role in the maintenance of mitochondrial status in HNC cells. One report supports the importance of HSPA in mitochondria-associated ER membrane for cell survival [Citation7]. For these reasons, HSPA5 might be observed in mitochondria of HNC cells and considered as relevant in the alleviation against NTS-induced increases in ROS (E and F).
NTS contains several ROS and reactive nitrogen species (RNS) like nitric oxide, hydrogen, oxygen, and ozone [Citation14]. Given that ROS are early inducers of autophagy [Citation34,Citation35] we hypothesized that ROS plays a role in NTS-induced cellular events. Accordingly, NTS-induced ROS alteration did appear to be important in HNC cellular signaling events including ER stress, autophagy, lysosomal activity, and survival (Figures S5A to S5F). However, HSPA5-overexpressing cells were protected from the NTS-derived ROS damage (D). HSPA5 has been suggested to directly protect cells against ER stress and ROS damage [Citation5]. Nonetheless, NTS presently induced HNC cell death via HSPA5 downregulation directly or indirectly.
MUL1 is a novel negative regulator of HSPA5
We showed that NTS induced downregulation of HSPA5, which is pivotal in NTS-induced lysosomal activity regulation and mitochondria-mediated apoptosis in HNC ( and ). HSPA5 affects the kinase activity of AKT by protein-protein interactions [Citation36] and also acts as an upstream target of AKT in cisplatin-resistant lung cancer [Citation37]. AKT signaling is activated after ER stress-induced UPR, which results in cell survival [Citation38]. Chaperone-mediated autophagy is a selective form of degradation of cytosolic proteins in lysosomes that is also regulated by AKT [Citation39]. Given our earlier description that NTS induces the UPS of AKT in HNC cells [Citation14], we tested the involvement of AKT in NTS-mediated ER stress, autophagy, and cytotoxicity. AKT was important in NTS-induced downregulation of HSPA5 or cellular signal events, such as ER stress, autophagy, and cytotoxicity (Figures S6A to S6C). AKT was closely related to NTS-mediated HNC cellular events.
Because NTS induced downregulation of HSPA5, we tested whether HSPA5 can induce degradation through a post-transcriptional modification (PTM) event, such as ubiquitination because NTS did not change the level of HSPA5 gene expression (Figure S7A). HSPA5 was rapidly downregulated from 8 h and onwards in a cycloheximide (CHX)-chase assay. However, its decrement was inhibited by the proteasome inhibitor, MG132 (Figure S7B). NTS-induced mitochondrial apoptotic events were inhibited by HSPA5 overexpression (B and C). In particular, HSPA5 was translocated to mitochondria in NTS-treated HNC cells (E and F). The findings indicate that the role of HSPA5 might be pivotal in protecting mitochondria.
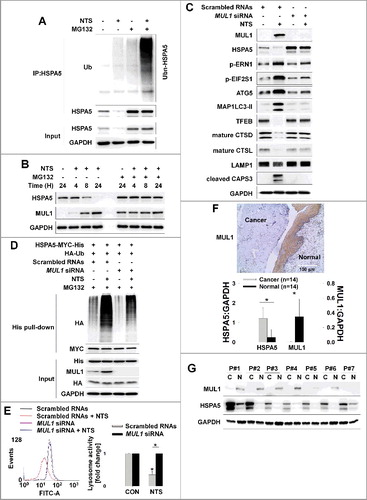
MUL1 is localized in the mitochondrial outer membrane, where it acts as an E3 ligase for AKT [Citation12,Citation13], and is involved in the regulation of the apoptotic signaling pathway [Citation8,Citation12]. Of note, MUL1 has been reported as a regulator in mitochondrial dynamics [Citation40]. MUL1 also participates in NTS-induced HNC inhibition [Citation14]. NTS strongly induced ubiquitination of endogenous and exogenous HSPA5 (A and S7C). We hypothesized that MUL1 could act as negative regulator against HSPA5 because HSPA5 is closely related to AKT [Citation36,Citation37] which is a substrate for MUL1 [Citation12,Citation14]. We transfected a GFP-MUL1 plasmid into FaDu cells at different doses and checked the endogenous HSPA5 protein levels. Endogenous HSPA5 was decreased by GFP-MUL1 in a dose-dependent manner (Figure S8A). NTS induced an increase in the level of MUL1 from 8 h onward. However, HSPA5 was decreased at the same time and both were inhibited by MG132 (B). MUL1 was expressed endogenously in HNC tissues because MUL1 was observed in the presence of MG132 (B). However, MUL1 could be suppressed in HNC by negative regulation via some intracellular signaling pathways. Endogenous HSPA5 was increased by MUL1 siRNA in MUL1-positive bronchial epithelial cells (BEAS-2B, Figure S8B). Both MUL1 and HSPA5 were shown to be short-lived proteins by the CHX-chase assay. However, the HSPA5 level was consistently attenuated until 24 h in MUL1 knockdown cells (Figure S8B). A very recent study identifies RORA/RORα (RAR-related orphan receptor alpha) as a novel MUL1 transcriptional regulator [Citation13]. This finding prompted us to check the expression levels of MUL1 and HSPA5 in rora knockout (KO, rorasg/sg) MEF cells. MUL1 was suppressed in rora KO cells but HSPA5 was increased compared to wild-type cells (Figure S8C). NTS-induced HSPA5 downregulation was blocked in MUL1 knockdown cells and HSPA5-mediated ER stress-, autophagy-, and lysosome-related proteins level changes were also abolished (C). MUL1 knockdown cells were inhibited in NTS-induced HSPA5 ubiquitination (D). For these reasons, NTS-induced lysosome inhibition and ROS alteration were normalized by knockdown of MUL1 (E and S8D). MUL1 knockdown effects showed opposite results compared to HSPA5-overexpressing cells. Elsewhere, the growth of HeLa cells expressing MUL1 reportedly is significantly suppressed [Citation12]. This was also the case in HNC cells (Figure S8E). MUL1 was strongly stained in the normal region of tissues from HNC patients (F). These findings spurred us to determine the expression status of MUL1 and HSPA5 in frozen tissues from 14 HNC patients, by western blot. MUL1 or HSPA5 expression patterns differed between cancer tissues and normal tissues. Whereas HSPA5 was increased, MUL1 was significantly suppressed in cancer tissues (G). These expression patterns were similar in HNC cells compared to normal cells (Figure S8F). In BEAS-2B cells, NTS did induce upregulation of MUL1; however, HSPA5 or p-AKT was weakly increased at the same time (Figure S8G). NTS will probably play different roles in cancer or normal cells through MUL1 regulation. For these reasons, NTS does not show any side effects such as cytotoxicity or embryogenesis in normal cells [Citation14]. These data show that MUL1 acts as a negative regulator against HSPA5 in HNC.
Figure 5. MUL1 negatively regulates HSPA5. (A) NTS induced ubiquitination of HSPA5. NTS treatment was given to FaDu cells for 24 h, in the absence of serum and MG132 (10 μM) was included for 8 h before cell harvest. Endogenous HSPA5 was immunoprecipitated by an anti-HSPA5 antibody and the determination of ubiquitin-conjugated HSPA5 was performed with an anti-ubiquitin antibody. (B) NTS induced UPS of HSPA5. FaDu cells were treated with NTS for each indicated time. A pretreatment of MG132 (10 μM) was given for 1 h before the NTS treatment. Endogenous HSPA5 or MUL1 was evaluated by western blot assay. (C and D) MUL1 knockdown inhibited NTS-mediated HNC cellular events or HSPA5 ubiquitination. FaDu cells were transfected with scrambled RNAs or MUL1 siRNA and 24 h later, NTS treatment was given for 24 h in the absence of serum. The cells were subjected to western blot assay with the indicated antibodies (C) or Ni-NTA His affinity-isolation ubiquitination assay (D). (E) MUL1 knockdown prevented NTS-induced lysosome inhibition. NTS treatment was given for 24 h to scrambled RNA- or MUL1 siRNA-transfected cells. Lysosomal activity was assessed with FACS analysis (n = 3). Data are means ± SD. Asterisks indicate statistically significant differences (P < 0.05). (F) MUL1 was suppressed in HNC regions. MUL1 expression in HNC patients was analyzed by immunohistochemistry using anti-MUL1 antibody. (G) HSPA5 or MUL1 expression levels were different between tissues from cancer patients or healthy controls. Proteins were isolated from tissues of 14 patients with HNC, and HSPA5 or MUL1 expression levels were determined by western blot (C, cancer tissue; N, normal tissue; P, patient). Data are means ± SD. Asterisks indicate statistically significant differences (P < 0.05).
MUL1 induces K48-linked ubiquitination of HSPA5 at lysine 446
In HNC cells, NTS induced ubiquitination of HSPA5 and MUL1 was associated with NTS-mediated HSPA5 ubiquitination (D). To determine whether MUL1 could act as a novel E3 ligase against HSPA5, FaDu cells were transfected with GFP-MUL1 together with pcDNA-HSPA5-MYC-His, and the interaction between HSPA5 and MUL1 was assessed by immunoprecipitation or Ni-NTA His affinity-isolation assay. MUL1 bound to endogenous or exogenous HSPA5 (A and S9A) and NTS induced the increase of endogenous HSPA5-MUL1 interaction, in immunocytochemistry (Figure S9B) or proximity ligation assays (PLA, Figure S9C). Furthermore, MUL1 induced ubiquitination of HSPA5 through an in vitro ubiquitination assay (Figure S9D) and MUL1-mediated ubiquitination of HSPA5 occurred in a K48-linked dependent manner (B). These findings were associated with NTS-mediated HSPA5 downregulation with UPS. To identify the lysine residue in HSPA5 that is required for protein stability and ubiquitination by MUL1, we generated N terminus (N-HSPA5) or C terminus (C-HSPA5) HSPA5 constructs (Figure S10A). MUL1 was bound in C-HSPA5 as well as wild-type HSPA5 (Figure S10B). C-HSPA5 displayed significant reduction of MUL1 through the UPS (Figure S10C). MUL1 could not bind and influence degradation of N-HSPA5, thus, the C terminus in HSPA5 was ubiquitinated by MUL1. To evaluate the correlation between HSPA5 ubiquitination and mutations on 25 lysine residues in C-HSPA5, all lysine (K) to alanine (R) mutants of the putative ubiquitin-conjugation residues in HSPA5 were generated by site-directed mutagenesis. Degradation of HSPA5K446R was inhibited compared with that of HSPA5 wild type (WT) or the other mutants (Figure S11A). The ubiquitination of HSPA5K446R was also inhibited by MUL1 (C). The expression of the HSPAK446R mutant showed only miniscule decreases even though MUL1 was overexpressed (D). The protein half-life of HSPA5K446R was prolonged compared with HSPA5 WT in a CHX-chase assay (E). For these reasons, NTS could not induce ubiquitination of HSPA5K446R compared with the wild type, despite MUL1 induction (F). The K446 residue of HSPA5 is well conserved in different species (Figure S11B). The K447 residue is also conserved and ubiquitinated by AMFR/GP78 (autocrine motility factor receptor), via HDAC6 (histone deacetylase 6)-mediated deacetylated HSPA5 in breast cancer [Citation41]. However, in the present study, expression of the HSPA5K447R mutant protein was reduced and it exhibited ubiquitination by MUL1 in HNC cells (C and S11A). Taken together, the results suggest that lysine 446 in HSPA5 is a specific residue for MUL1-mediated HSPA5 ubiquitination.
Figure 6. Lysine 446 of HSPA5 is a site of MUL1-mediated K48-linked ubiquitination. (A) HSPA5 interacted with MUL1. At 24 h after cotransfection with the indicated plasmids, FaDu cells were treated with MG132 (10 μM) for 8 h before cell harvest and then subjected to immunoprecipitation with an anti-GFP antibody, followed by western blot with the indicated antibodies. (B) MUL1 induced K48-linked ubiquitination of HSPA5. FaDu cells were cotransfected with plasmids as indicated. At 24 h after cotransfection, cells were treated with MG132 (10 μM) for 8 h and further subjected to ubiquitination assay. (C) K446 is a putative ubiquitination site for MUL1. Each indicated plasmid was transfected into FaDu cells together with or without EGFP-MUL1 and 24 h later, cells were treated with MG132 (10 μM) for 8 h and further subjected to Ni-NTA His affinity-isolation ubiquitination assay. (D) The effect of MUL1 on HSPA5 protein stability was inhibited in the HSPA5K446R mutant, compared to wild-type HSPA5. K446R mutant was inhibited MUL1-dependent protein stability compared with wild type of HSPA5. WT HSPA5-MYC-His or HSPA5K446R-MYC-His plasmids were transfected into FaDu cells together with or without EGFP-MUL1 dose dependently and 24 h later, the level of each indicated protein was determined by western blot. (E) The half-life of the K446R mutant protein was compared with the wild type of HSPA5. WT HSPA5-MYC-His or HSPA5K446R-MYC-His plasmids were transfected into BEAS-2B cells and 24 h later, treatment with CHX (20 μg/ml) was included for each indicated time. Endogenous MUL1 or exogenous HSPA5 were detected using anti-MUL1 or anti-MYC antibodies. (F) K446R did not induce ubiquitination from the NTS. Cells transfected with each indicated plasmid, were treated with NTS for 24 h and the ubiquitinated form of HSPA5 was detected by Ni-NTA His affinity isolation assay.
MUL1 KO HNC cells show resistance to NTS treatment in vivo
We determined the anticancer effect of NTS through MUL1-dependent HSPA5 ubiquitination in vitro. To confirm whether the NTS inhibitory effect on tumor progression occurs in vivo, we inoculated mice subcutaneously with FaDu cells then treated the mice daily with intratumoral injection of NTS. Tumor growth was inhibited after the eighth NTS injection, and the anticancer effect was sustained for 2 wk (Figure S12A). Tumor volume was decreased after the ninth injection in the NTS-treated group. To determine whether NTS induced NHC cell death through regulation of the MUL1-HSPA5 axis, we analyzed changes at the molecular level of MUL1, HSPA5, MAP1LC3-II, TFEB, LAMP1, and cleaved CASP3, by immunohistochemistry (A). NTS increased positive staining for MUL1, MAP1LC3-II, and cleaved CASP3, while it was decreased in the other proteins in response to NTS (A). A western blot assay revealed that ER stress-, autophagy-, and lysosome-related proteins changed significantly in the NTS-treated group (Figures S12B). In PLA or immunohistochemistry, MUL1-HSPA5 interaction was increased significantly in NTS-treated mouse tissues (B, S13A and S13B). While cellular organelles were well organized in control tumors, the autophagic vesicles and organelles were disrupted in NTS-treated tumors in the TEM analysis (C, arrow). To confirm the role of MUL1 in NTS-mediated antitumor effects, we generated MUL1 KO stable cells using the CRISPR-Cas9 system (Figure S14A). The induction of HSPA5 ubiquitination, lysosomal activity inhibition or cytotoxicity were prevented in MUL1 KO cells (Figures S14B to S14E). NTS inhibited tumor growth in MUL1 WT cells; however, MUL1 KO cells were resistant to the NTS treatment (D). The reduction in HSPA5 expression mediated by NTS was inhibited in MUL1 KO tumors (E). Taken together, we suggest that NTS has a beneficial effect for HNC therapy and targeting the MUL1-HSPA5 axis can be a novel strategy for the treatment of HNC ().
Figure 7. MUL1 KO HNC cells show resistance to NTS treatment in a xenograft in vivo model. Human FaDu (5 × 10⁶ cells) HNC cells were injected subcutaneously into BALB/c nu/nu mice and the mice were treated with NTS every day for 14 d (PBS, n = 5; NTS, n = 8). Tumor volume and images are shown in Figure S12A. (A) Immunohistochemical analysis of HSPA5, p-AKT, MAP1LC3-II, TFEB, LAMP1, and cleaved CASP3 (scale bar: 100 μm). Protein levels were analyzed and quantified by western blot assay in Figures S12B. (B) NTS induced increases in level of the interaction between MUL1 and HSPA5 in NTS-treated mice tumors. The interaction of MUL1 and HSPA5 induced by NTS was assessed by PLA in mice tissues. Arrows indicate PLA-positive (+) cells (scale bar: 60 μm). Numbers of PLA (+) cells were counted at x200 magnification in 5 randomly chosen fields. Data are means ± SD. Asterisks indicate statistically significant differences (P < 0.05). The distribution of PLA (+) cells in whole tumor (Figure S13A) or immunostaining between HSPA5 and MUL1 (Figure S13B) is represented in Figure S13. (C) TEM of NTS-treated tumor. Arrows indicate autophagic vesicles (scale bar: 2,000 nm). (D) MUL1 knockout (KO) HNC cells showed resistance to NTS treatment. MUL1 KO cells were generated by the CRISPR/Cas9 system (Figure S14A to S14E). FaDu cells with wild-type MUL1 (WT) or MUL1 KO (each 5 × 10⁶ cells) were injected subcutaneously into BALB/c nu/nu mice and the mice were treated with NTS every day for 15 d. Data are means ± SD. Asterisks indicate statistically significant differences (P < 0.05). (E) Immunohistochemical analysis of MUL1 or HSPA5 in tumors (scale bar: 100 μm). MUL1- or HSPA5-positive stain intensity was measured and quantified by ImageJ program. Data are means ± SD. Asterisks indicate statistically significant differences (P < 0.05).
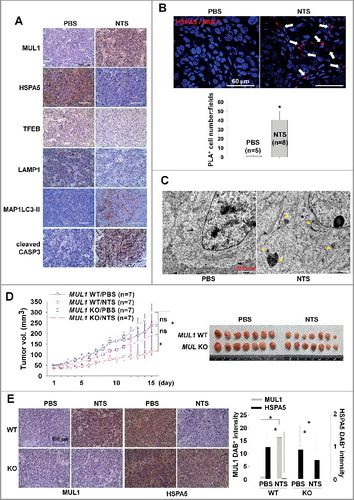
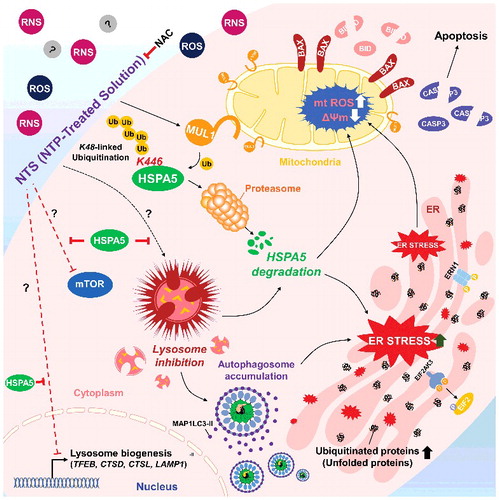
Figure 8. Schema of the MUL1-HSPA5 axis in HNC. HSPA5 shows a protective mechanism through control of lysosomal activity; however, NTS-mediated MUL1 induces HSPA5 ubiquitination at the K446 residue and leads to alteration in the signal from survival to apoptosis, through lysosome inhibition. NAC, N-acetylcysteine.
Discussion
The present study examined the anticancer effects of NTS, a next-generation therapeutic tool for HNC, through the negative regulation of HSPA5 by MUL1. HSPA5 protected cells from NTS-induced apoptosis, through maintenance of lysosomal activity. However, NTS led to the downregulation of HSPA5 via MUL1-dependent ubiquitination of HSPA5 at the K446 residue, which was lethal to HNC cells. MUL1 KO cells which were generated by the CRISPR/Cas9 system showed resistance to NTS treatment in a xenograft in vivo model. The present study achieved 2 novel findings. HSPA5 is important in maintenance of lysosomal activity in HNC cells. Second, MUL1 acts as a novel E3 ligase against HSPA5 and MUL1 induced K48-linked ubiquitination at K446.
HSPA5 is an important regulator of ER stress. Factors in the tumor microenvironment like glucose deprivation, acidosis, and severe hypoxia lead to the accumulation of underglycosylated and misfolded proteins in the ER, which triggers the UPR [Citation42]. In particular, HSPA5 expression is induced by glucose starvation [Citation43] and plays a role in tumor cell growth by facilitating proper protein folding, which prevents intermediates from aggregating, and targets misfolded proteins for proteasome degradation [Citation42] Although HSPA5 expression is maintained at low basal levels in adult tissues, it is strongly induced in tumors [Citation6], [Citation42], [Citation44]. Therefore, HSPA5 has been suggested as a cancer-targeting marker because it is found on the cell surface of tumors, but not in normal organs. This opens up the opportunity of targeting the cell-surface function of HSPA5 [Citation43]. HSPA5 is arginylated by ATE1 (arginyltransferase 1). The arginylated HSPA5 relocates to the cytosol, binds to the autophagic receptor SQSTM1/p62, and is delivered to phagophores (the precursor to the autophagosome) of stressed cells [Citation6]. These findings suggest that HSPA5 is crucial in cancer development. For these reasons, HSPA5 inhibition (e.g. through HA15, a novel HSPA5 inhibitor) is suggested as a new therapeutic strategy against melanomas resistant to inhibition of B-Raf proto-oncogene, serine/threonine kinase (BRAF) [Citation45]. In the present study, HSPA5 was implicated in HNC development (D, E and G). Also, NTS inhibited HNC progression through MUL1-dependent HSPA5 ubiquitination ( and ). Thus, HSPA5 could be a therapeutic target for HNC therapy with NTS.
Although more detailed experiments are necessary to elucidate how HSPA5 is involved in lysosome-related protein status and lysosomal activity, the finding that lysosomal activity was inhibited by NTS is interesting because lysosomes are important for clearing misfolded proteins. Autophagy is another important mechanism in clearing misfolded proteins from the secretory pathway [Citation46]. The functional role of ER stress-mediated autophagy varies and may be cell specific [Citation47]. Normal cells rarely encounter such conditions, which eliminates the need for the UPR. However, cancer cells are exposed to UPR-activating conditions, such as glucose deprivation, acidosis, and severe hypoxia. Therefore, autophagy may be activated for survival or metastasis of HNC cells. In addition, tumor cells may activate autophagy in response to cellular stress or increased metabolic demands related to rapid cell proliferation. Presently, NTS-induced HNC apoptosis was enhanced in cells where autophagy had been blocked (Figure S1E and S3A). Therefore, inhibition of autophagy, combined with NTS or chemotherapy could be a new therapeutic target of HNC therapy. In particular, TFEB coordinates this program by driving expression of autophagy and lysosomal genes [Citation30], [Citation31]. Our data show that NTS induces decreased levels of TFEB, CSTD, CTSL, and LAMP1 in an HSPA5-dependent manner (D), which is essential for lysosomal function. The discovery of the roles of HSPA5 in the regulation of lysosomal activity and homeostasis is very interesting and completely novel. A recent study characterizes TMEM175 (transmembrane protein 175) as a novel lysosomal K+ channel that regulates lysosomal function [Citation48]. However, we did not detect any change in NTS-treated HNC cells (data not shown).
UPS is one of the most powerful quality control pathways in cells. If UPS is disrupted to affect the half-life status of proteins, cells will be transformed to abnormal cells. Thus, UPS is used to control many cellular processes including protein degradation [Citation49]. In the present study, MUL1 negatively regulated HSPA5 through K48-linked ubiquitination at the K446 residue (C and S11A). While HSPA5 was overexpressed in HNC tissues, MUL1 was suppressed compared with normal cells (G and S8E). MUL1 has been implicated as a tumor-suppressor protein through inhibition of tumor-cell proliferation and migration [Citation8], [Citation12]. Therefore, MUL1 might contribute to the development of HNC (F and G). We also tested MUL1 expression level in HNC and frozen tissues that had been obtained from patients with liver, colorectal, gastric, and lung cancer. However, MUL1 was only weakly observed in gastric and lung cancer (data not shown). Recently, one study reports that HDAC6 (histone deacetylase 6) increases acetylation of HSPA5 and reduces AMFR-mediated ubiquitination of HSPA5 at K447 in breast cancer [Citation41]. But K447 in HSPA5 was not the putative site against MUL1 (C and S11A). We cannot exclude the possibility that simultaneous ubiquitination at multiple sites affects the stability of HSPA5 by other ubiquitin E3 ligases. However, we suggest that MUL1 has a pivotal role in HNC progression by inducing ubiquitination of HSPA5 and AKT [Citation12], [Citation14]. HSPA5 rather than AKT may play an important role in cell survival, because hspa5 knockout mice die at the embryonic stage [Citation50]. Nonetheless, AKT and HSPA5 are important in cancer development. If we can control MUL1 gene expression or stability, MUL1 could be a good therapeutic target for HNC therapy exploiting HSPA5 or AKT ubiquitination and degradation. Our previous [Citation14] and current data show that MUL1 can be a novel therapeutic target for HNC therapy through AKT or HSPA5 ubiquitinations using NTS. MUL1 also regulates mitochondrial fission through sumoylation of DNM1L/Drp1 [Citation9], [Citation10]. However, NTS did not induce mitochondrial fragmentation (F, TOMM20 blot). Recently, the pivotal role of ULK1 in autophagy or mitophagy has been reported as a novel substrate of MUL1 [Citation11]. Our results show that ULK1 was reduced by MUL1-dependent fashion in NTS-treated HNC cells (Figure S15A), thus, NTS could not affect the changes of mitochondrial morphology in HNC cells (E and S9B).
NTS in almost all cases are ROS, RNS, free radicals, and ozone [Citation14], [Citation22], [Citation51]. One study reports that oxidative stress induced by plasma-activated medium (PCM, a variant of NTS) due to hydrogen peroxide (H2O2) in particular, induces A549 cell injury by reduction of MMP [Citation51]. More recently, the authors report another set of results showing that the hydroxyl radical (·OH) is generated by the NTS in the presence of iron ions and this causes distribution of the mitochondrial-nuclear network in cancer cells [Citation22]. NTS manufactured in our experimental condition, contained about 1 μM H2O2 (1.83 ppm) [Citation14]. Thus, we tested the effect of NTS-derived H2O2 in HSPA5 downregulation. H2O2 did not induce a change in the MUL1 or HSPA5 level and HNC cell death (Figures S15B and S15C), so NTS-derived H2O2 could not affect the MUL1-HSPA5 axis-mediated regulation of signaling in cell events such as lysosomal function or ROS control in HNC. Unfortunately, there are certain limitations in measuring the composition of NTS, since there is a lack of detection methods and devices for this very unstable compound combination. Although undetectable and unknown compounds cannot be excluded in the manufactured NTS in our experimental condition, NTS did not show any side effects, such as cytotoxicity or embryotoxicity of normal cells [Citation14]. If the NTS-derived ROS and RNS, free radicals, and/or unknown compositions affect HNC cell death, normal cells or embryogenesis would also be damaged by NTS.
In the present study, HSPA5 plays an important role in HNC survival through lysosomal activity maintenance; however, NTS-induced MUL1 leads to ubiquitination of HSPA5 at the K446 residue suggesting that NTS has a beneficial effect for HNC therapy and that the MUL1-HSPA5 axis could be a good therapeutic target for HNC.
Materials and methods
Cells
Head and neck cancer (HNC) cell lines including FaDu (human hypopharynx cancer cells; ATCC®, HTB-43™), SCC15 (human oral cavity cancer; ATCC®, HTB-43™), SCC25 (human oral cavity cancer; ATCC®, CRL1628™, and Cal27 (human oral cavity cancer; ATCC®, CRL2095™) were purchased from the American Type Culture Collection. SNU1041 (human hypopharynx cancer; KCLB, 01041.1) cells were obtained from the Korean Cell Line Bank. Normal human lung fibroblasts (NHLFs; CC-2512) was purchased from Lonza. AMC-HN6 (floor of mouth cancer), and BEAS-2B (human normal bronchial epithelial cells) were kindly provided by Dr. Sang-Yong Kim (Asan Medical Center, University of Ulsan College of Medicine, South Korea). Mouse embryonic fibroblasts from wild-type (WT) and homozygous rora knockout, staggerer (rorasg/sg) cells were generously given by Dr. Keun Il Kim (Sookmyung Women's University, South Korea). FaDu, AMC-HN6 and SCC-QLL1 cells were grown in Minimum Essential Medium (MEM; GIBCO, 11095-080) supplemented with 10% fetal bovine serum (FBS; GIBCO, 10270-106) and 100 U/mL antibiotics (GIBCO, 15240-062). SNU1041 cells were maintained in Roswell Park Memorial Institute 1640 (RPMI 1640; GIBCO, 22400-089) supplemented with 10% FBS and antibiotics at 37°C with 5% CO2 under humidified conditions. SCC15 and SCC25 (oral cavity cancer) cells were grown in Dulbecco's Modified Eagle's Medium: Nutrient Mixture F-12 (DMEM/F12; #11320-033, GIBCO) supplemented with 10% FBS and antibiotics at 37°C with 5% CO2 under humidified conditions. Cal27, NHLF and BEAS-2B cells were maintained in DMEM (GIBCO, 11965-092) supplemented with 10% FBS and antibiotics at 37°C with 5% CO2 under humidified conditions.
Plasmids
The coding regions of HSPA5 and MUL1 were generated by PCR from cDNA synthesized from Human Universal QUICK-Clone™ II (Clontech Laboratories, Inc, 637260). Human HSPA5 cDNA was cloned into pcDNA3.1-MYC-His (Invitrogen, V855-20) and human MUL1 cDNA was cloned into pEGFP-N1 (Clontech Laboratories, Inc, 6085-1). The sequences of primers used for PCR are listed in Table S1. The following plasmids were obtained from Addgene: pcDNA3.1(+)-HSPA5 (32701, deposited by Richard C. Austin), pRK5-HA-Ubiquitin WT (17608), KO (17603), K33 (17607), K48 (17605), K63 (17606, deposited by Ted Dawson), K6 (22900), K11 (22901), K27 (22902) and K29 (22903, deposited by Sandra Weller). pSELECT-GFP-HsMAP1LC3-II (psetz-gfplc3) was purchased from InvivoGen. Constitutively active AKT (myristoylated AKT, Myr AKT-MYC-His) plasmids were used as described previously [Citation14]. The HSPA5 lysine mutants were created using the QuikChange II Site-Directed Mutagenesis Kit (Agilent Technologies, 200524) according to the manufacturer's instructions.
Reagents and antibodies
NH4Cl (A9434), E-64 (E3132), NAC (A9165), hydrogen peroxide solution (H2O2; H1009) and Z-VAD-FMK (V116) were purchased from Sigma-Aldrich. TUDCA was purchased from Millipore (580549). Cycloheximide (CHX; 2112) was purchased from Cell Signaling Technology. Antibodies were obtained from several sources. Anti-AKT1/2/3 (9272), anti-p-AKT1/2/3 (Ser473; 9271 for western blot), anti-ATG7 (8558), anti-ATG5 (12994), anti-ATG3 (3415), anti-BAX (2772), anti-BECN1 (3495), anti-BID (2002), anti-cleaved CASP3 (9664), anti-p-EIF2S1 (9721), anti-EIF2S1 (9722), anti-ERN1 (3294), anti-GAPDH (5174), anti-His (12698), anti-HSPA5 (3177, for western blot), anti-LAMP1 (9091), anti-MAP1LC3-II (3868, for western blot), anti-MTOR (2983), anti-p-MTOR (Ser2448; 5536), anti-MYC-tag (2276), anti-HA (3724) anti-PPKAA (5832), anti-p-PPKAA (Thr172; 2535), anti-p-RPS6 (Ser235/236; 4858), anti-p-RPS6 (Ser240/244; 5364), anti-RPS6KB1 (2708), anti-p-RPS6KB1 (Thr389; 9234), anti-SQSTM1 (8025), anti-ULK1 (8054), anti-ULK1 (Ser555; 5869), anti-ULK1 (Ser757; 6888), horseradish peroxidase (HRP)-conjugated anti-mouse IgG (7076), and anti-rabbit IgG (7074) were all from Cell Signaling Technology. Anti-TFEB (PA5-34360) was from Thermo Fisher. Anti-MUL1 (ab84067), anti-HSPA5 (ab21685, for immunohistochemistry and immunofluorescence; ab181499 for PLA and immunofluorescence), anti-green fluorescence protein (GFP, ab290, for immunoprecipitation), anti-p-ERN1 (ab124945), anti-CTSD (ab6313), anti-CTSL (ab133641), and anti-TOMM20 (ab56783) were from Abcam. Anti-GFP (B-2; sc-9996, for western blot), and anti-Ub (sc-166553) were from Santa Cruz Biotechnology. Anti-TUBA (CP06), and antipolyubiquitinated protein (FK2; 04–263) were from Millipore. Anti-MAP1LC3B-II (0231-100, for immunohistochemistry) was from Nanotools [Citation52]. Alexa Flour 488-conjugated goat anti-mouse (A11008), Alexa Flour 488-conjugaed goat anti-rabbit (A11034), Alexa Flour 546-conjugated goat anti-mouse (A11003), and Alexa Flour 546-conjugated goat anti-rabbit (A11010) were from Invitrogen.
NTS manufacture
NTS was manufactured as described previously [Citation14]. Briefly, we designed and manufactured a spray-type NTP system with a newly designed arc-free and antistatic plate that provides a uniform plasma jet for biomedical research applications [Citation14], [Citation20], [Citation21], [Citation53]. The plasma source is equipped with a pair of electrodes made of Al2O3 (high voltage and ground electrodes, 10 × 40-mm dimension, 2-mm gap between electrodes) isolated from direct contact with plasma by a ceramic barrier. The specifications of the power supply (PSM; Plasma Systems & Materials, Seongnam, Korea, model: APJ-10-NT) for this system are 2-kV minimum, 13-kV maximum (for NTS preparation, 4-kV voltage was loaded in order to avoid accidents from an electric shock), and a mean frequency of 20 to 30 kHz; these specifications can vary with the type and amount of gas used. In this study, helium (He) and oxygen (O2) were used as carrier gases because we previously found that the addition of O2 to a He plasma improves the efficiency of inducing cancer cell death. NTS was prepared followed by 15 min treatment of NTP in a volume of 15 ml culture media, in the absence of serum. We always used NTS freshly prepared in the same manner, prior to each experiment. For in vivo experiments, NTS was prepared using phosphate buffered saline (PBS; Thermo Fisher, 10010023) in the same manner.
Cell viability assay
HNC cells were seeded at 150 cells/mm2. The cells were washed with PBS the next day, and treated with NTS in the absence of serum. Cell viability was checked with a thiazolyl blue tetrazolium bromide (MTT) assay (Sigma-Aldrich, M5655) according to the manufacturer's instructions.
Western blot analysis
Cells or HNC patient frozen tissues were lysed with a radioimmunoprecipitation assay buffer containing phosphate and a protease inhibitor cocktail (Sigma-Aldrich, 11697498001) on ice for 30 min. Following centrifugation at 14,000 × g for 20 min at 4°C, the proteins in the supernatants were separated by SDS-PAGE and transferred to a polyvinylidene difluoride (PVDF) membrane. Each membrane was blocked with 5% skim milk for 1 h at room temperature and incubated overnight with primary antibody (1:1,000) at 4°C. After washing with 0.1% Tween-20 (Sigma-Aldrich, P1379) in Tris-buffered saline (Sigma-Aldrich, T8912), the membranes were incubated with an HRP-conjugated secondary antibody (1:5,000). Proteins were visualized using ECL reagents (GE Healthcare Life Sciences, RPN2235) and detected with ImageQuant™ LAS 4000 (FujiFilm, Tokyo, Japan). Image densities were quantified with ImageJ.
RNA interference analysis
Cells were transfected with 100 pmol siRNA using Lipofectamine® RNAiMAX Transfection Reagent (Thermo Fisher, 13778150). Scrambled RNA was used as negative control. The HSPA5 siRNA sequence used has been previously described [Citation6]. Duplexes of siRNA targeting HSPA5, MUL1 and ATG5 were synthesized by BIONEER (Daejeon, Korea). The siRNA sequences are as follows: human HSPA5, 5′- AGU GUU GGA AGA UUC UGA U-3′ and 5′-AUC AGA AUC UUC CAA CAC U-3′; human MUL1, 5′-GUA CAA CAG CUA AUA GUU U-3′ and 5′-A AAC UAU UAG CUG UUG UAC-3′; human ATG5, 5′- CCA UCA AUC GGA AAC UCA U-3′ and 5′-AUG AGU UUC CGA UUG AUG G-3′.
RT-PCR
TFEB, LAMP1, CSTD, CTSL, and RNA18S gene expression was estimated using RT-PCR (BIO-RAD, T100™ Thermal Cycler). The total RNA in FaDu was isolated by TRIzol® Reagent (Thermo Fisher, 15596018). cDNAs were synthesized with 5 μg of total RNAs and ReverTra Ace® qPCR RT Master Mix (TOYOBO, FSQ-201) according to the manufacturer's instructions. PCR primer sequences were as follows: human TFEB, 5′- GTC CGA GAC CTA TGG GAA C -3′ and 5′- GGC ATC TGC ATT TCA GGA TT -3′; human LAMP1, 5′- CTT CAG CAG GGG AGA GAC AC -3′ and 5′- TGT TGG GGT TGA TGT TGA G -3′; human CTSD, 5′- GCT GGT GGA CCA GAA CAT C -3′ and 5′- ATG AGG GAA GTG CCT GTG TC -3′; human CTSL, 5′- AGG AGA GCA GTG TGG GAG AAG -3′ and 5′- AAG CCC AAC AAG AAC CAC AC -3′; human RNA18S, 5′-CAC GGA CAG GAT TGA CAG AT-3′ and 5′-CGA ATG GGG TTC AAC GGG TT-3′. PCR products were separated by 1% agarose gel and observed using a ImageQuant™ LAS 4000 (FujiFilm).
Measurement of intracellular ROS production
FaDu cells were transfected with or without pcDNA3.1-HSPA5 and treated with NTS. After NTS treatment, cells were treated with 10 μM hydroethidine (Thermo Fisher, D-1168) for 30 min at 37°C. Fluorescence-stained cells (1 × 10⁴) were quantified using a BD FACSAria III cell sorter (BD Biosciences, San Diego, CA, USA).
Mitochondrial membrane potential assay (JC-1 staining)
The mitochondrial membrane potential (MMP) of intact cells was measured using the lipophilic cationic probe 5,5′,6,6′-tetrachloro-1,1′,3,3′-tetraethylbenzimidazolylcarbocyanine iodide (JC-1; Thermo Fisher, D-1168). The culture medium or medium with the NTS treatment was removed from the adherent FaDu cells, and the cells were rinsed with PBS. Cell monolayers were incubated with MEM and 5 μg/ml JC-1 at 37oC for 10 min. The cells were subsequently washed 2 times with medium and the live cells were imaged using a fluorescence microscope (EVOS FL Auto, Thermo Fisher, Waltham, MA, USA).
Lysosomal activity analysis
Lysosomal activity was determined with 3 kinds of methods such as LysoSensor™Green DND-189 (Thermo Fisher, L-7535), TFEB transcription factor activity assay (RayBiotech, TFEH-TFEB) or CTSD activity assay (abcam, ab65302). Briefly, for Lysosensor assay, FaDu cells were transfected with or without pcDNA3.1-HSPA5 for 24 h, treated with NTS, cultured with 1 μM LysoSensor probe for 1 h, and harvested. Lysosomal activity was quantified using a BD FACSAria III cell sorter (BD Biosciences). For TFEB transcription factor activity assay, FaDu cells were transfected with or without pcDNA3.1-HSPA5 for 24 h, treated with NTS for 24 h, and harvested. TFEB transcription factor activity was measured using an assay kit according to the manufacturer's instructions. For the CTSD activity assay, FaDu cells were transfected with or without pcDNA3.1-HSPA5 for 24 h, treated with NTS for 24 h, and harvested. CTSD activity was measured using an assay kit as described by the manufacturer's instructions.
Immunocytochemistry microscopy
The cells were grown to 80% confluence on coverslips. After treatment with NTS, FaDu cells were fixed with 4% paraformaldehyde for 10 min, permeabilized with 0.1% Triton X-100 (Sigma-Aldrich, 93443) in PBS for 5 min, incubated with 5% normal goat serum (abcam, ab7481) for 1 h. The cells were subsequently incubated with primary antibodies at 4°C overnight, followed by washing 4 times with 0.05% Tween-20 in PBS and staining with the secondary antibody for 2 h at room temperature. After nuclei were stained using Hoechest (Thermo Fisher, 33342), cells were observed with a confocal laser microscope (Nikon, Tokyo, Japan, Nikon A1R).
Subcellular fractionation
FaDu cells were treated with NTS for 4, 8 or 24 h in the absence of serum. After cell harvest, cytoplasmic, and mitochondrial fractionation was performed using the Mitochondria Isolation Kit for Mammalian Cells (Thermo Fisher, 89874), according to the manufacturer's instructions.
HSPA5 ubiquitination assays
HSPA5 ubiquitination assays were determined by Ni-NTA affinity isolation or in vitro ubiquitination assays. Ni-NTA affinity isolation ubiquitination assay was performed as described previously [Citation12], [Citation14]. Briefly, FaDu cells transfected with pcDNA3.1-HSPA5-MYC-His together with each of the indicated plasmids were washed with PBS, lysed in 200 μl of denaturing lysis buffer (50 mM Tris-HCl, pH 7.4, 0.5% SDS [Sigma-Aldrich, 05030], 70 mM β-meraptoethanol) by vortexing, and boiled for 20 min at 95oC. The lysates were diluted with 800 μl buffer A (50 mM NaH2PO4, 300 mM NaCl, 10 mM imidazole, pH 8.0, protease inhibitor cocktail, 10 μM MG132 [Sigma-Aldrich, M7449]) and incubated overnight with 40 μl Ni-NTA Agarose Beads (Invitrogen, R901-15) at 4oC. Beads were washed 5 times with buffer B (50 mM NaH2PO4, 300 mM NaCl, 20 mM imidazole, pH 8.0), and bound proteins were eluted by boiling in a mixture of 5X SDS-PAGE gel loading buffer and buffer C (50 mM NaH2PO4, 300 mM NaCl, 250 mM imidazole, pH 8.0) (1:4). Thereafter, ubiquitinated HSPA5 was identified with anti-MYC and anti-HA antibodies on a western blot. An in vitro ubiquitination assay was performed as previously described [Citation12]. Briefly, 1 μg of MUL1 (Novus Biologicals, H00079594-P01) was incubated with 500 ng of HSPA5 (OriGene Technologies, TP305859) in 30 μl of ubiquitination reaction buffer, containing 10X E3 Ligase Reaction Buffer (Boston Biochem, B-71), Mg-ATP Solution (Boston Biochem, B-20), 150 ng Ubiquitin Activating Enzyme (UBA1/UBE1; Boston Biochem, E-305), 250 ng UBE2D3/UbcH5c (Boston Biochem, E2-627), and 5 μg ubiquitin (Boston Biochem, U-100H). The reaction was incubated in a 37°C water bath. After 1 h, the reactions were terminated with addition of SDS Loading Buffer and 1μl DTT. Followed by an incubation at 100°C for 5 min. The reaction products were subsequently analyzed through western blotting with an anti-HSPA5 antibody.
Immunoprecipitation
Transfected and MG132-treated FaDu cells were washed with PBS and lysed in CHAPS buffer (1% CHAPS [Sigma-Aldrish, C3023], 10 mM Tris-HCl, pH 7.5, 1 mM MgCl2, 1 mM EGTA, 1 mM EDTA, 10% glycerol). The lysates were incubated with the indicated antibody under constant rotation overnight at 4°C. Protein G Agarose beads (Invitrogen, 15920-010) were added and the slurry was incubated for an additional 4 h followed by extensive washing. After boiling the samples, the protein interaction was determined by western blot.
In situ proximity ligation assay (PLA)
FaDu cells were seeded on glass cover slips at 70% confluence, cultured overnight in a 24-well plate, and transfected with or without pcDNA3.1-HSPA5-MYC-His for 24 h. Cells were then treated with NTS for 8 h. Thereafter, FaDu cells were fixed with 4% paraformaldehyde in PBS for 10 min, permeabilized with 0.1% Triton X-100 in PBS for 5 min, and incubated with 5% BSA (Millipore, 82-045-1) for 1 h at room temperature. Cells were incubated with rabbit anti-MUL1 (1:100) and mouse anti-MYC (1:100) antibodies at 4°C overnight. Cells were incubated with anti-rabbit PLUS and anti-mouse MINUS PLA probes in Duolink in situ PLA kit (Sigma-Aldrich, DUO92101), according to the manufacturers’ protocol. After nuclei were stained using Hoechest (Thermo Fisher, 33342), cells were observed with a confocal laser microscope (Nikon, Tokyo, Japan).
Transmission electron microscopy (TEM)
Samples were fixed for 12 h in 2% glutaraldehyde-paraformaldehyde in 0.1 M phosphate buffer (pH 7.4) and washed in 100 mM phosphate buffer. The samples were postfixed with 1% OsO4 dissolved in 100 mM phosphate buffer for 2 h and dehydrated in an ascending ethanol series (50 to 100%) and infiltrated with propylene oxide. The specimens were embedded with the Poly/Bed 812 kit (Polysciences, 21844-1). The specimens were embedded with pure fresh resin and polymerized at 65°C in an electron microscope oven (Dosaka, TD-700) for 24 h. Sections 200- to 250-nm thick were cut and stained with toluidine blue (Sigma-Aldrich, T3260) for light microscopy. The 70-nm sections were double-stained with 6% uranyl acetate (EMS, 22400) for 20 min and then with lead citrate for contrast staining. The sections were cut with a LEICA EM UC7 ultramicrotome (Leica Microsystems, Buffalo Grove, IL, USA) with a diamond knife and transferred to copper and nickel grids. All thin sections were observed with an electron microscope (JEOL, Tokyo, Japan, JEM-1011) at an acceleration voltage of 80 kV, and images were analyzed with the Camera-Megaview III Soft imaging system. A Formvar-carbon coated EM grid (EM Sciences, FCF100-Au) was placed Formvar side down on top of the (sample) drop for approximately 1 min to prepare a negative stain. The grid was removed, blotted with filter paper, and placed onto a drop of 2% uranyl acetate for 15 sec. The uranyl acetate was removed, and the EM grid was examined and photographed for TEM.
Collection of human HNC tissues
Human tissue samples were obtained from HNC patients who had undergone surgical resection. The mean age of the patients 68±5.7 years with 16 males and 4 females. Regarding clinical stage, all patients were in stage 3 to 4. The Institutional Review Board of Ajou University Medical Center (AUMC) approved the study protocol, and all patients provided written informed consent (AJIRB-BMR-KSP-15-490). HNC tissues were used for western blot or immunohistochemistry analysis.
Immunohistochemistry
Immunohistochemistry was performed on paraffin-embedded of HNC tissues or in vivo xenograft tumor sections [Citation54]. Briefly, the specimens were incubated in blocking solution with the indicated antibodies overnight at 4°C. The sections were thoroughly rinsed in PBS and incubated for 2 h at room temperature with the SPlink HRP Detection Kit (Golden Bridge International Labs, D03-110). Immunolabeling was performed after 3 washes in PBS and staining with Liquid DAB+ Substrate Kit (Golden Bridge International Labs, C09-100).
Generation of MUL1-depleted cells
To establish the MUL1-depleted FaDu cell line, an MUL1-targeted RNA-guided endonuclease (RGEN) system was generated using CRISPR/Cas9 (ToolGen, Seoul, Korea). The target MUL1 sequence in the RGEN plasmid was GTACTCCGTGTACCGGCAGAAGG. To enrich MUL1-depleted cells, the cells were transfected with the surrogate reporter plasmid pHRS-CMV, which encodes mRFP1-EGFP fusion fluorescent protein and a hygromycin selection marker. The EGFP-sorted cells were serially diluted to obtain a single cell-derived colony and grown for 2 wk in MEM containing 10% FBS, 1% penicillin-streptomycin. More than 50 single-cell colonies were collected, and the expression of MUL1 was examined by immunoblotting in the presence of MG132 condition. The frequencies of small insertions/deletions at the on-target site and putative off-target sites were measured using deep sequencing (ToolGen).
Xenograft in vivo tumor model
All animal-related experimental procedures and animal handling were conducted in accordance with the Committee for Ethics in Animal Experiments of the Ajou University School of Medicine (AUMC, IACUC No. 2015-0030). Human FaDu HNC cells containing MUL1 wild type or KO (5 × 10⁶) were inoculated subcutaneously into the lower right flank BALB/c nu/nu mice (Harlan Laboratories, Ltd., UK). The mice were divided randomly into PBS control and NTS groups 1 wk later when the tumors reached ∼50 mm in diameter, and the tumors were injected daily with 200 μl of PBS or NTS for 15 d. After the last injection of NTS, the tumors were excised from euthanized mice and used for western blot assays and immunohistochemistry. The tumors were measured using a sliding caliper twice daily, and the volumes (mm3) were calculated as described previously [Citation14].
Statistical analyses
Data are expressed as means ± standard deviations (SD). Data were analyzed by ANOVA, followed by the Student t test and the Tukey–Kramer multiple comparisons method. A P < 0.05 was considered statistically significant.
Disclosure of potential conflicts of interest
The authors declare that there are no conflicts of interest.
supp_data_1414126.zip
Download Zip (36.7 MB)Additional information
Funding
Related Research Data
References
- Walter P, Ron D. The unfolded protein response: from stress pathway to homeostatic regulation. Science. 2011;334:1081–1086; PMID: 22116877; http://dx.doi.org/10.1126/science.1209038
- Clarke HJ, Chambers JE, Liniker E, et al. Endoplasmic reticulum stress in malignancy. Cancer Cell. 2014;25:563–573; PMID: 24823636; http://dx.doi.org/10.1016/j.ccr.2014.03.015
- Rouschop KM, van den Beucken T, Dubois L, et al. The unfolded protein response protects human tumor cells during hypoxia through regulation of the autophagy genes MAP1LC3B and ATG5. J Clin Invest. 2010;120:127–141; PMID: 20038797; http://dx.doi.org/10.1172/JCI40027
- Shani G, Fischer WH, Justice NJ, et al. GRP78 and Cripto form a complex at the cell surface and collaborate to inhibit transforming growth factor beta signaling and enhance cell growth. Mol Cell Biol. 2008;28:666–677; PMID: 17991893; http://dx.doi.org/10.1128/MCB.01716-07
- Gomer CJ, Ferrario A, Rucker N, et al. Glucose regulated protein induction and cellular resistance to oxidative stress mediated by porphyrin photosensitization. Cancer Res. 1991;51:6574–6579; PMID: 1835901.
- Cha-Molstad H, Sung KS, Hwang J, et al. Amino-terminal arginylation targets endoplasmic reticulum chaperone BiP for autophagy through p62 binding. Nat Cell Biol. 2015;17:917–929; PMID: 26075355; http://dx.doi.org/10.1038/ncb3177
- Hayashi T, Su TP. Sigma-1 receptor chaperones at the ER-mitochondrion interface regulate Ca(2+) signaling and cell survival. Cell. 2007;131:596–610. PMID: 17981125; http://dx.doi.org/10.1016/j.cell.2007.08.036
- Zhang B, Huang J, Li HL, et al. GIDE is a mitochondrial E3 ubiquitin ligase that induces apoptosis and slows growth. Cell Res. 2008;18:900–910; PMID: 18591963; http://dx.doi.org/10.1038/cr.2008.75
- Braschi E, Zunino R, McBride HM. MAPL is a new mitochondrial SUMO E3 ligase that regulates mitochondrial fission. EMBO Rep. 2009; 10:748–754; PMID: 19407830; http://dx.doi.org/10.1038/embor.2009.86
- Scorrano L, Liu D. The SUMO arena goes mitochondrial with MAPL. EMBO Rep. 2009;10:694–696; PMID: 19525920; http://dx.doi.org/10.1038/embor.2009.141
- Li J, Qi W, Chen G, et al. Mitochondrial outer-membrane E3 ligase MUL1 ubiquitinates ULK1 and regulates selenite-induced mitophagy. Autophagy. 2015;11:1216–1229; PMID: 26018823; http://dx.doi.org/10.1080/15548627.2015.1017180
- Bae S, Kim SY, Jung JH, et al. Akt is negatively regulated by the MULAN E3 ligase. Cell Res. 2012;22:873–885; PMID: 22410793; http://dx.doi.org/10.1038/cr.2012.38
- Kim SY, Kim HJ, Park MK, et al. Mitochondrial E3 Ubiquitin Protein Ligase 1 Mediates Cigarette Smoke-Induced Endothelial Cell Death and Dysfunction. Am J Respir Cell Mol Biol. 2016;54:284–296; PMID: 26203915; http://dx.doi.org/10.1165/rcmb.2014-0377OC
- Kim SY, Kim HJ, Kang SU, et al. Non-thermal plasma induces AKT degradation through turn-on the MUL1 E3 ligase in head and neck cancer. Oncotarget. 2015;6:33382–33396; PMID: 26450902; http://dx.doi.org/10.18632/oncotarget.5407
- Moreau M, Orange N, Feuilloley MG. Non-thermal plasma technologies: new tools for bio-decontamination. Biotechnol Adv. 2008;26:610–617; PMID: 18775485; http://dx.doi.org/10.1016/j.biotechadv.2008.08.001
- Kim CH, Kwon S, Bahn JH, et al. Effects of atmospheric nonthermal plasma on invasion of colorectal cancer cells. Appl Phys Lett. 2010;96:243701; PMID: 20628488; http://dx.doi.org/10.1063/1.3449575
- Li W, Yu KN, Bao L, et al. Non-thermal plasma inhibits human cervical cancer HeLa cells invasiveness by suppressing the MAPK pathway and decreasing matrix metalloproteinase-9 expression. Sci Rep. 2016;6:19720; PMID: 26818472; http://dx.doi.org/10.1038/srep19720
- Kim CH, Bahn JH, Lee SH, et al. Induction of cell growth arrest by atmospheric non-thermal plasma in colorectal cancer cells. J Biotechnol. 2010;150:530–538; PMID: 20959125; http://dx.doi.org/10.1016/j.jbiotec.2010.10.003
- Chang JW, Kang SU, Shin YS, et al. Non-thermal atmospheric pressure plasma induces apoptosis in oral cavity squamous cell carcinoma: involvement of DNA-damage-triggering sub-G(1) arrest via the ATM/p53 pathway. Arch Biochem Biophys. 2014;545:133–140; PMID: 24486404; http://dx.doi.org/10.1016/j.abb.2014.01.022
- Kang SU, Cho JH, Chang JW, et al. Nonthermal plasma induces head and neck cancer cell death: the potential involvement of mitogen-activated protein kinase-dependent mitochondrial reactive oxygen species. Cell Death Dis. 2014;5:e1056; PMID: 24525732; http://dx.doi.org/10.1038/cddis.2014.33
- Adachi T, Nonomura S, Horiba M, et al. Iron stimulates plasma-activated medium-induced A549 cell injury. Sci Rep. 2016;6:20928; PMID: 26865334; http://dx.doi.org/10.1038/srep20928
- Settembre C, Zoncu R, Medina DL, et al. A lysosome-to-nucleus signaling mechanism senses and regulates the lysosome via mTOR and TFEB. EMBO J. 2012;31:1095–1108; PMID: 22343943; http://dx.doi.org/10.1038/emboj.2012.32
- Yorimitsu T, Klionsky DJ. Endoplasmic reticulum stress: a new pathway to induce autophagy. Autophagy. 2007;3:160–162; PMID: 17204854.
- Hershko A, Ciechanover A. The ubiquitin system. Annu Rev Biochem. 1998;67:425–479; PMID: 9759494; http://dx.doi.org/10.1146/annurev.biochem.67.1.425
- Mariño G, Niso-Santano M, Baehrecke EH, et al. Self-consumption: the interplay of autophagy and apoptosis. Nat Rev Mol Cell Biol. 2014;15:81–94; PMID: 24401948; http://dx.doi.org/10.1038/nrm3735
- Wang X, Terpstra EJ. Ubiquitin receptors and protein quality control. J Mol Cell Cardiol. 2013;55:73–84; PMID: 23046644; http://dx.doi.org/10.1016/j.yjmcc.2012.09.012
- Komatsu M, Waguri S, Koike M, et al. Homeostatic levels of p62 control cytoplasmic inclusion body formation in autophagy-deficient mice. Cell. 2007;14:1149–1163; PMID: 18083104; http://dx.doi.org/10.1016/j.cell.2007.10.035.
- Roczniak-Ferguson A, Petit CS, Froehlich F, et al. The transcription factor TFEB links mTORC1 signaling to transcriptional control of lysosome homeostasis. Sci Signal. 2012;5:ra42; PMID: 22692423; http://dx.doi.org/10.1126/scisignal.2002790
- Settembre C, Fraldi A, Medina DL, et al. Signals from the lysosome: a control centre for cellular clearance and energy metabolism. Nat Rev Mol Cell Biol. 2013;14:283–296; PMID: 23609508; http://dx.doi.org/10.1038/nrm3565
- Sardiello M, Palmieri M, di Ronza A, et al. A gene network regulating lysosomal biogenesis and function. Science. 2009;325:473–477; PMID: 19556463; http://dx.doi.org/10.1126/science.1174447
- Settembre C, Di Malta C, Polito VA, et al. TFEB links autophagy to lysosomal biogenesis. Science. 2011;332:1429–1433; PMID: 21617040; http://dx.doi.org/10.1126/science.1204592
- Martinez J, Malireddi RK, Lu Q, et al. Molecular characterization of LC3-associated phagocytosis reveals distinct roles for Rubicon, NOX2 and autophagy proteins. Nat Cell Biol. 2015;17:893–906; PMID: 26098576; http://dx.doi.org/10.1038/ncb3192
- Wiel C, Lallet-Daher H, Gitenay D, et al. Endoplasmic reticulum calcium release through ITPR2 channels leads to mitochondrial?calcium accumulation and senescence. Nat Commun. 2014;5:3792; PMID: 24797322; http://dx.doi.org/10.1038/ncomms4792
- Filomeni G, Desideri E, Cardaci S, et al. Under the ROS…thiol network is the principal suspect for autophagy commitment. Autophagy. 2010;6:999–1005; PMID: 20639698; http://dx.doi.org/10.4161/auto.6.7.12754
- Scherz-Shouval R, Shvets E, Elazar Z. Oxidation as a post-translational modification that regulates autophagy. Autophagy. 2007;3:371–373; PMID: 17438362; http://dx.doi.org/10.4161/auto.4214
- Yung HW, Charnock-Jones DS, Burton GJ. Regulation of AKT phosphorylation at Ser473 and Thr308 by endoplasmic reticulum stress modulates substrate specificity in a severity dependent manner. PloS One. 2011;6:e17894; PMID: 21445305; http://dx.doi.org/10.1371/journal.pone.0017894
- Lin Y, Wang Z, Chen L. Akt is the downstream target of GRP78 in mediating cisplatin resistance in ER stress-tolerant human lung cancer cells. Lung Cancer. 2011;71:291–297; PMID: 20599289; http://dx.doi.org/10.1016/j.lungcan.2010.06.004
- Shin S, Buel GR, Wolgamott L, et al. ERK2 mediates metabolic stress response to regulate cell fate. Mol Cell. 2015;59:382–398; PMID: 26190261; http://dx.doi.org/10.1016/j.molcel.2015.06.020
- Arias E, Koga H, Diaz A, et al. Lysosomal mTORC2/PHLPP1/Akt regulate chaperone-mediated autophagy. Mol Cell. 2015;59:270–284; PMID: 26118642; http://dx.doi.org/10.1016/j.molcel.2015.05.
- Li W, Bengtson MH, Ulbrich A, et al. Genome-wide and functional annotation of human E3 ubiquitin ligases identifies MULAN, a mitochondrial E3 that regulates the organelle's dynamics and signaling. PLoS One. 2008;3:e1487; PMID: 18213395; http://dx.doi.org/10.1371/journal.pone.0001487
- Chang YW, Tseng CF, Wang MY, et al. Deacetylation of HSPA5 by HDAC6 leads to GP78-mediated HSPA5 ubiquitination at K447 and suppresses metastasis of breast cancer. Oncogene. 2016;35:1527–1528; PMID: 26119938; http://dx.doi.org/10.1038/onc.2015.214
- Lee AS. GRP78 induction in cancer: therapeutic and prognostic implications. Cancer Res. 2007;67:3496–3499; PMID: 17440054; http://dx.doi.org/10.1158/0008-5472.CAN-07-0325
- Li J, Lee AS. Stress induction of GRP78/BiP and its role in cancer. Curr Mol Med. 2006;6:45–54; PMID: 16472112; http://dx.doi.org/10.2174/156652406775574523
- Dong D, Dubeau L, Bading J, et al. Spontaneous and controllable activation of suicide gene expression driven by the stress-inducible grp78 promoter resulting in eradication of sizable human tumors. Hum Gene Ther. 2004;15:553–561; PMID: 15212714; http://dx.doi.org/10.1089/104303404323142006
- Cerezo M, Lehraiki A, Millet A, et al. Compounds triggering ER stress exert anti-melanoma effects and overcome BRAF inhibitor resistance. Cancer Cell. 2016;29:805–819; PMID: 27238082; http://dx.doi.org/10.1016/j.ccell.2016.04.013
- Høyer-Hansen M, Jäättelä M. Connecting endoplasmic reticulum stress to autophagy by unfolded protein response and calcium. Cell Death Differ. 2007;14:1576–1582; PMID: 17612585; http://dx.doi.org/10.1038/sj.cdd.4402200
- He C, Klionsky DJ. Regulation mechanisms and signaling pathways of autophagy. Annu Rev Genet. 2009;43:67–93; PMID: 19653858; http://dx.doi.org/10.1146/annurev-genet-102808-114910
- Cang C, Aranda K, Seo YJ, et al. TMEM175 Is an Organelle K(+) Channel regulating lysosomal function. Cell. 2015;162:1101–1112; PMID: 26317472; http://dx.doi.org/10.1016/j.cell.2015.08.002
- Mani A, Gelmann EP. The ubiquitin-proteasome pathway and its role in cancer. J Clin Oncol. 2005;23:4776–4789; PMID: 16034054; http://dx.doi.org/10.1200/JCO.2005.05.081
- Luo S, Mao C, Lee B, et al. GRP78/BiP is required for cell proliferation and protecting the inner cell mass from apoptosis during early mouse embryonic development. Mol Cell Biol. 2006;26:5688–5697; PMID: 16847323; http://dx.doi.org/10.1128/MCB.00779-06
- Adachi T, Tanaka H, Nonormura S, et al. Plasma-activated medium induces A549 cell injury via a spiral apoptotic cascade involving the mitochondrial-nuclear network. Free Radic Biol Med. 2015;79:28–44; PMID: 25433364; http://dx.doi.org/10.1016/j.freeradbiomed.2014.11.014
- Ladoire S, Chaba K, Martins I, et al. Immunohistochemical detection of cytoplasmic LC3 puncta in human cancer specimens. Autophagy. 2012;8:1175–1184; PMID: 22647537; http://dx.doi.org/10.4161/auto.20353
- Chang JW, Kang SU, Shin YS, et al. Non-thermal atmospheric pressure plasma inhibits thyroid papillary cancer cell invasion via cytoskeletal modulation, altered MMP-2/-9/uPA activity. PLoS One. 2014;9:e92198; PMID: 24667444; http://dx.doi.org/10.1371/journal.pone.0092198
- Shin YS, Cha HY, Lee BS, et al. Anti-cancer effect of luminacin, a marine microbial extract, in head and neck squamous cell carcinoma progression via autophagic cell death. Cancer Res Treat. 2016;48:738–752; PMID: 26511816; http://dx.doi.org/10.4143/crt.2015.102