
ABSTRACT
TRIM37 gene mutations cause mulibrey (muscle-liver-brain-eye) nanism, a severe growth disorder with prenatal onset. Although TRIM37 depletion normally induces apoptosis, patients with TRIM37 mutations have a high risk of developing tumors, suggesting that there may be an alternative pro-survival mechanism for TRIM37-deficient tumor cells. We find that TRIM37 interacts with MTOR and RRAGB proteins, enhances the MTOR-RRAGB interaction and promotes lysosomal localization of MTOR, thereby activating amino acid-stimulated MTORC1 signaling. In response to loss of TRIM37 functions, phosphorylation of TFEB is significantly reduced, resulting in its translocation into the nucleus enabling its transcriptional activation of genes involved in lysosome biogenesis and macroautophagy/autophagy. The enhanced autophagy depends on the inhibition of MTORC1 signaling and may serve as an alternative mechanism to survive the loss of TRIM37 functions. Our study unveils a positive role of TRIM37 in regulating the MTORC1–TFEB axis and provides mechanistic insights into the pathogenesis of mulibrey nanism, as well as potential therapeutic treatment.
Abbreviations: ACTB: actin beta; ATG: autophagy related; CASP3: caspase3; CLEAR: coordinated lysosomal expression and regulation; CQ: chloroquine; CTS: cathepsin proteases; CTSL: cathepsin L; EIF4EBP1: eukaryotic translation initiation factor 4E binding protein 1; LAMP1: lysosomal associated membrane protein 1; LAMP2: lysosomal associated membrane protein 2; LMNB1: lamin B1; MAP1LC3B/LC3B: microtubule associated protein 1 light chain 3 beta; MTOR: mechanistic target of rapamycin kinase; MTORC1: MTOR complex 1; mulibrey: muscle–liver–brain–eye; NAC: N-acetyl-L-cysteine; PARP1: poly(ADP-ribose) polymerase 1; RAP2A: member of RAS oncogene family; RHEB: Ras homolog enriched in brain; ROS: reactive oxygen species; RPS6KB1: ribosomal protein S6 kinase B1; RRAGB: Ras related GTP binding B; SQSTM1: sequestosome 1; TFEB: transcription factor EB; TRIM37: tripartite motif containing 37.
Introduction
TRIM37 (tripartite motif containing 37) is a member of the tripartite motif (RING, B-Box, and coiled-coil domains) family [Citation1]. Its gene mutations result in mulibrey (muscle-liver-brain-eye) nanism, which is a rare, autosomal-recessive growth disorder of prenatal onset, with characteristic dysmorphic features, pericardial constriction, and hepatomegaly [Citation1,Citation2]. Additionally, patients have high risk of developing insulin resistance, type 2 diabetes, and tumors [Citation2–Citation8]. So far, 23 TRIM37 gene mutations have been identified in mulibrey nanism patients (the Leiden Open Variation Database, LOVD; http://databases.lovd.nl/shared/genes/TRIM37).
Recently, several new cellular functions of TRIM37 proteins have been revealed. TRIM37 is an E3 ligase with known oncogenic function, and it is overexpressed in a subset of breast cancers and promotes their transformation by mono-ubiquitinating histone H2A [Citation9]. Loss of TRIM37 enables ectopic centrosomal foci formation to bypass the detrimental consequences of acentrosomal mitosis [Citation10,Citation11]. We recently found that TRIM37 protein functions as an E3 ligase for PEX5 (peroxisomal biogenesis factor 5), the receptor for import of peroxisomal matrix proteins, and TRIM37 deficiency results in defective peroxisome biogenesis and induces cell apoptosis [Citation12]. These distinct functions may be attributed to the diversity of TRIM37 localizations or the respective substrates and shed significant insights into the pathogenesis of mulibrey nanism. However, they do not explain the high tumor incidence in patients. These TRIM37-deficient cells may have acquired certain cellular changes by integrating and modulating some signaling pathways in response to loss of these essential TRIM37 functions. These changes, that likely contribute to the tumor susceptibility of mulibrey nanism, are the subject of this study.
The MTOR (mechanistic target of rapamycin kinase) signaling pathway integrates a variety of inputs to maintain the balance between anabolic and catabolic cellular processes, and its deregulation is implicated in many human diseases [Citation13,Citation14]. MTOR is found in two multiprotein complexes: MTOR complex 1 (MTORC1) and MTORC2. The former senses growth factors through the TSC1/2 (TSC complex subunit 1/2)-RHEB (Ras homolog enriched in brain) axis [Citation15]. Growth factors activate PI3K-AKT signaling, which phosphorylates TSC1/2 and inhibits its GAP activity towards RHEB GTPase. The resulting higher level of GTP-bound RHEB activates MTORC1 kinase in response to growth factors [Citation16–Citation20].
Alternatively, amino acids also activate MTORC1 signaling through RRAG (Ras related GTP binding) proteins [Citation21,Citation22]. In the presence of amino acids, the GTPases RRAGA/B and RRAGC/D are loaded with GTP and GDP respectively, which promote their interaction with MTOR and recruit it to the lysosome surface. Once on the lysosomes, MTOR meets its upstream effector, RHEB, and gets activated [Citation23,Citation24]. A well-known process controlled by MTORC1 activation is the stimulation of protein synthesis by phosphorylation of MTORC1 substrates, the translational regulators EIF4EBP1 (eukaryotic translation initiation factor 4E binding protein 1) and RPS6KB1 (ribosomal protein S6 kinase B1) [Citation13].
Autophagy is a self-digestive process that provides nutrients in response to intra- and extracellular stresses [Citation25,Citation26]. These stresses include lack of nutrients or growth factors, hypoxia, oxidative stress, DNA damage, protein aggregation, damaged organelles, or intracellular pathogens [Citation27]. Autophagy is activated through multiple stress-sensing signaling pathways that allow cells to cope with these detrimental stresses. Nutrient or growth factor depletion for example, as addressed above, results in inhibition of MTORC1 signaling, which induces macroautopahgy/autophagy through de-phosphorylation of downstream effectors involved in autophagy [Citation15]. One of these is TFEB (transcription factor EB), a member of MiTF/TFE transcription factor family, which is phosphorylated by MTORC1 in nutrient-rich conditions, resulting its association with the cytosolic chaperone, YWHA/14–3-3, and its retention in the cytoplasm [Citation28,Citation29]. Similar to MTOR, TFEB is also recruited to the lysosome surface by RRAG proteins under nutrient-rich conditions to facilitate its phosphorylation by MTORC1 [Citation30]. Inhibition of MTOR by torin treatment, amino acid withdrawal, or mitochondrial or ER stresses leads to de-phosphorylation of TFEB, its dissociation from YWHA/14–3-3 proteins, and subsequent translocation into the nucleus [Citation31–Citation33]. Once in the nucleus, TFEB functions as a transcription factor to up-regulate expression of a variety of genes involved in lysosome biogenesis and autophagy. This role has been referred to as the CLEAR (Coordinated Lysosomal Expression and Regulation) gene network controlled by TFEB [Citation34–Citation36].
In this study, we report that loss of TRIM37 induces autophagy in a MTORC1-dependent manner, which may serve as a pro-survival mechanism following the loss of TRIM37.
Results
TRIM37 depletion increases basal autophagic flux
To explore how cells respond to the stresses caused by the loss of TRIM37 functions, we examined the autophagy status in shRNA-mediated TRIM37-knockdown (KD) cells. During autophagy, nascent MAP1LC3/LC3 (microtubule associated protein 1 light chain 3) is first processed into LC3-I and subsequently conjugated with phosphatidylethanolamine (PE) to become LC3-II, which associates with phagophore and autophagosome membranes. The protein SQSTM1 (sequestosome 1) is selectively incorporated into phagophores by direct binding to LC3, and is degraded by autophagy [Citation25]. Hence the cellular LC3-II level and SQSTM1 abundance are widely used as markers for autophagy detection [Citation37]. We found a remarkable increase of LC3B-II and a decrease of SQSTM1 proteins in TRIM37 KD HepG2 and HEK 293T cells (). Additionally, more autophagosome structures were formed by TRIM37 depletion, as indicated by punctate staining of endogenous LC3B, as well as exogenous mCherry-EGFP-LC3B proteins (,)). The increased mCherry-EGFP-LC3B puncta colocalized with the lysosome marker, LysoTracker Blue, suggesting that TRIM37 depletion promotes fusion of autophagosomes with lysosomes ()).
Figure 1. TRIM37 depletion induces autophagy. (a) HepG2, HEK 293T control, and TRIM37 KD cells grown in normal growth media were collected for detection of the proteins via western blotting using the indicated antibodies. Actin beta (ACTB) was used as a loading control. (b) HepG2 control and TRIM37 KD cells were immuno-stained with anti-LC3B antibody to detect the localization of endogenous LC3B proteins using regular immuno-fluorescence microscopy. (c) TRIM37 was depleted (TRIM37 KD) in HepG2 cells stably expressing mCherry-EGFP-LC3B. Cells grown in normal growth media were incubated with LysoTracker Blue (0.2 μM) for 30 min before fixation with 4% paraformaldehyde and subsequent confocal image acquisition. (d) HEK 293T control and TRIM37 KD cells were transfected with two siRNAs for ATG7 and ATG16L1. Cells were collected after 72 h for protein detection with the indicated antibodies. (e) HepG2 control and TRIM37 KD cells were treated with CQ (10 μM) for 6 h prior to western blot detection of proteins shown. s.e. short exposure; l.e. long exposure. (f) HepG2 control and TRIM37 KD cells stably expressing mCherry-EGFP-LC3B were treated with (+) or without (-) CQ (10 μM) for 6 h before confocal image acquisition. Scale bars: 10 μm. The intensities of LC3B-II were quantified and presented as the ratio of LC3B-II:ACTB below the LC3B blots as ± SEM (n = 3) from 3 independent experiments. The LC3B-II:ACTB value in control cells was set as 1
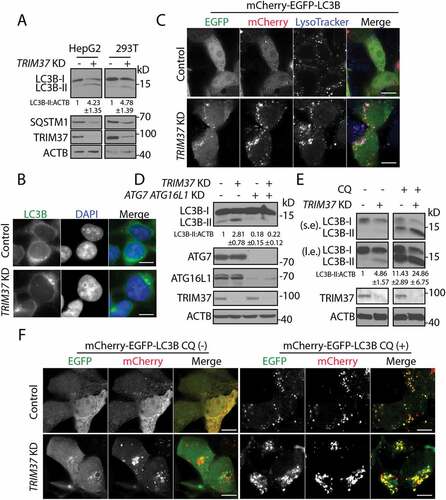
We examined if the enhanced autophagy mediated by TRIM37 KD depends on the canonical autophagy machinery, such as ATG7 and ATG16L1. A combination of siRNAs targeted to ATG7 and ATG16L1 resulted in maximum inhibition of autophagy, as indicated by reduction of LC3B-II protein levels (Fig. S1A). Silencing of ATG7 and ATG16L1 in TRIM37 KD cells reduced autophagy to the level comparable to that seen in control cells ()). These results suggested that TRIM37 depletion induces canonical autophagy, which depends on ATG7 and/or ATG16L1.
The increased LC3B-II protein and accumulation of LC3B puncta in TRIM37 KD cells might result either from bona fide autophagy induction or, alternatively, impaired autophagosome degradation. To address this issue, we treated cells with chloroquine (CQ), an autophagy inhibitor that raises lysosomal pH and inhibits lysosomal degradation. Further accumulation of autophagosomes and LC3B-II protein would indicate that loss of TRIM37 increases autophagic flux. Otherwise, TRIM37 depletion would inhibit autophagosome degradation. CQ treatment dramatically increased LC3B-II in TRIM37 KD cells (lane 4) compared to those seen in untreated TRIM37 KD cells (lane 2) and CQ-treated control cells (lane 3) ()), demonstrating that autophagic flux was significantly enhanced in TRIM37 KD cells due to enhanced autophagosome generation.
Additionally, we used the mCherry-EGFP-LC3B construct for autophagy flux analysis. This is based on the fact that the GFP signals are quenched in acidic lysosomes, while mCherry signals are relatively stable. CQ treatment recovers the GFP signals due to increase of lysosomal pH. Hence, we observed the appearance of yellow dots (colocalization of mCherry and EGFP signal) in control cells treated with CQ ()). These yellow dots were more abundant in CQ-treated TRIM37 KD cells ()), further demonstrating that autophagy flux was enhanced in TRIM37 KD cells.
TRIM37 depletion inhibits amino acid-stimulated MTORC1 signaling
To explore the mechanism underlying the enhanced autophagy in TRIM37-depleted cells, we investigated a couple of essential signaling pathways that might be affected. None of the MAPK1/3 (ERK2/1), AKT, and AMPK signaling pathways were affected in TRIM37 KD cells as indicated by their phosphorylation status (Fig. S1B). However, to our surprise, there was a substantial inhibition of MTORC1 activity as indicated by the decrease of phosphorylation of its two well-known downstream substrates, RPS6KB1 and EIF4EBP1, in TRIM37 KD HepG2 cells and HEK 293T cells (). These results indicate that TRIM37 positively regulates MTORC1 signaling in normal growth conditions.
MTORC1 signaling acts as a master regulator of diverse cellular processes by sensing and integrating the availability of various nutrients such as amino acids and growth factors (e.g. insulin). Amino acid withdrawal reduces phospho-RPS6KB1 and re-addition of amino acids activates MTORC1 signaling in a time-dependent manner in control cells ()). In contrast, the response to amino acids was significantly reduced by TRIM37 depletion ()).
Figure 2. TRIM37 depletion inhibits amino acid-stimulated MTORC1 signaling. (a) HepG2, HEK 293T control, and TRIM37 KD cells were cultured in normal growth media and collected for protein detection via western blotting with the indicated antibodies. T-RPS6KB1 and T-EIF4EBP1 indicate total RPS6KB1 and EIF4EBP1, respectively. ACTB was used as a loading control. (b) HepG2 control and TRIM37 KD cells were incubated in media depleted of amino acids (AA) [Citation38] for 2 h and stimulated with amino acid-containing media for the indicated times, before proteins were detected by western blots. GAPDH was used as a loading control
![Figure 2. TRIM37 depletion inhibits amino acid-stimulated MTORC1 signaling. (a) HepG2, HEK 293T control, and TRIM37 KD cells were cultured in normal growth media and collected for protein detection via western blotting with the indicated antibodies. T-RPS6KB1 and T-EIF4EBP1 indicate total RPS6KB1 and EIF4EBP1, respectively. ACTB was used as a loading control. (b) HepG2 control and TRIM37 KD cells were incubated in media depleted of amino acids (AA) [Citation38] for 2 h and stimulated with amino acid-containing media for the indicated times, before proteins were detected by western blots. GAPDH was used as a loading control](/cms/asset/4d3758fc-ecc3-47a7-99a6-cb852cbdeeae/kaup_a_1463120_f0002_b.gif)
We also observed a delay of MTORC1 activation in response to insulin stimulation in TRIM37 KD cells (Fig. S1C). However, this was due to the reduced basal MTORC1 activity at the initial time point, as the rate of MTORC1 activation was almost the same as that seen in control cells when the blots were compared at different exposure times (Fig. S1C). This suggests that TRIM37 mainly regulates amino acid-stimulated, but not growth factor-stimulated, MTORC1 signaling. Supporting this, we found no changes of phosphorylation of AKT and TSC2 proteins upon TRIM37 depletion (Fig. S1B), two readouts for growth factor-activated MTORC1 signaling [Citation17,Citation18].
TRIM37 interacts with MTOR and RRAGB and its depletion inhibits MTOR-RRAGB interaction and RRAGB-mediated MTORC1 activation
We sought to address how TRIM37 regulates amino acid stimulated MTORC1 pathway. We recently revealed an indispensable role of TRIM37 in peroxisome biogenesis and the defective import of peroxisomal matrix proteins in cells depleted of TRIM37 [Citation12]. As peroxisomes are involved in maintaining homeostasis of reactive oxygen species (ROS) [Citation39,Citation40] and recent papers show that oxidative stress modulates TFEB activation and MTORC1 activity via the lysosomal ROS sensor, MCOLN1/TRPML1 (mucolipin 1) [Citation41,Citation42], it seemed plausible that the potential disruption in ROS homeostasis mediates MTORC1 inhibition in TRIM37-deficient cells. To test this, we first examined ROS levels by using the DHR123 and CellRox dyes and found the ROS level in TRIM37 KD cells was comparable to those seen in control cells (Fig. S2A and B). Furthermore, ROS scavengers N-acetyl-L-cysteine (NAC) and TEMPO failed to rescue MTORC1 inhibition and autophagy induction caused by TRIM37 depletion (Fig. S2C). These results suggest that the effect of TRIM37 on MTORC1 does not depend on ROS.
TRIM37 may function directly as an E3 ligase by ubiquitinating some key protein(s) in the amino acid-stimulated MTORC1 pathway. This is unlikely since the E3 ligase-defective TRIM37 mutant (C35,36S) [Citation12,Citation43] behaved the same as the WT protein in rescuing the MTORC1 and autophagy phenotypes (Fig. S2D). This result suggested that TRIM37 might interact directly with and modulate the activities of some key proteins in this pathway.
To this end, we first tested if TRIM37 interacts with MTOR and RRAGB proteins. Co-immunoprecipitation results showed that TRIM37 was indeed associated with MTOR and RRAGB () and TRIM37-RRAGB interaction was independent of amino acid availability ()).
Figure 3. TRIM37 interacts with MTOR and RRAGB proteins and its depletion inhibits MTOR-RRAGB interaction and lysosomal distribution of MTOR. (a) HEK 293T cells were transfected with FLAG-MTOR and TRIM37-GFP constructs. After 24 h, equal amounts of cell lysates were collected for immunoprecipitation (IP) with control IgG (Ctrl) or FLAG antibody, followed by protein detection with GFP and MTOR antibodies. (b and c) HEK 293T cells were transfected with HA-GST-RRAGB and TRIM37-GFP constructs. After 24 h, cells lysates were collected (normal). Alternatively, cells were starved for amino acid for 2 h (AA-) and stimulated with amino acid-containing media for 1 h (AA+). Equal amounts of cell lysates were collected for immuno-precipitation (IP) with control IgG (Ctrl) or HA antibody. GFP and HA-HRP antibodies were used to detect TRIM37-GFP and HA-GST-RRAGB, respectively. (d and e) HepG2 control and TRIM37 KD cells were incubated in amino acid-depleted media [Citation38] for 2 h (AA-) and then stimulated with amino acid-containing media (AA+) for 15 min. Nuclei were stained with DAPI. (d) Cells were immuno-stained with MTOR antibody. (e) Cells stimulated with AA (15 min) were co-stained with MTOR and LAMP2 antibodies. The images were acquired by confocal microscopy. Scale bars: 10 μm. (F) HEK 293T control and TRIM37 KD cells were transfected with FLAG-MTOR and HA-GST-RRAGB constructs. After 24 h, equal amounts of cell lysates were collected for immuno-precipitation (IP) with control IgG (Ctrl) or HA antibody, followed by protein detection with the indicated antibodies. s.e. short exposure; l.e. long exposure
![Figure 3. TRIM37 interacts with MTOR and RRAGB proteins and its depletion inhibits MTOR-RRAGB interaction and lysosomal distribution of MTOR. (a) HEK 293T cells were transfected with FLAG-MTOR and TRIM37-GFP constructs. After 24 h, equal amounts of cell lysates were collected for immunoprecipitation (IP) with control IgG (Ctrl) or FLAG antibody, followed by protein detection with GFP and MTOR antibodies. (b and c) HEK 293T cells were transfected with HA-GST-RRAGB and TRIM37-GFP constructs. After 24 h, cells lysates were collected (normal). Alternatively, cells were starved for amino acid for 2 h (AA-) and stimulated with amino acid-containing media for 1 h (AA+). Equal amounts of cell lysates were collected for immuno-precipitation (IP) with control IgG (Ctrl) or HA antibody. GFP and HA-HRP antibodies were used to detect TRIM37-GFP and HA-GST-RRAGB, respectively. (d and e) HepG2 control and TRIM37 KD cells were incubated in amino acid-depleted media [Citation38] for 2 h (AA-) and then stimulated with amino acid-containing media (AA+) for 15 min. Nuclei were stained with DAPI. (d) Cells were immuno-stained with MTOR antibody. (e) Cells stimulated with AA (15 min) were co-stained with MTOR and LAMP2 antibodies. The images were acquired by confocal microscopy. Scale bars: 10 μm. (F) HEK 293T control and TRIM37 KD cells were transfected with FLAG-MTOR and HA-GST-RRAGB constructs. After 24 h, equal amounts of cell lysates were collected for immuno-precipitation (IP) with control IgG (Ctrl) or HA antibody, followed by protein detection with the indicated antibodies. s.e. short exposure; l.e. long exposure](/cms/asset/7755e382-070e-4473-8f65-b3ccb4e81eda/kaup_a_1463120_f0003_c.jpg)
Next, we analyzed the subcellular localization of MTOR because MTORC1 activity depends on its localization at lysosomes [Citation23,Citation24]. Amino acid depletion causes a cytoplasmic distribution of MTORC1, while addition of amino acids re-distributes MTORC1 to lysosomes, as indicated by the punctate staining of MTORC1 and its colocalization with the lysosomal marker protein, LAMP2 (lysosomal associated membrane protein 2) (). However, MTORC1 failed to localize at lysosomes upon TRIM37 depletion in response to amino acid stimulation (). These results suggest that TRIM37 enhances lysosomal distribution of MTORC1, hence promoting the signaling.
GTPases RRAGA/B and RRAGC/D are activated by binding GTP and GDP, respectively, in response to amino acids, which promotes their interaction with MTOR and recruits MTOR to the lysosome surface [Citation21,Citation22]. As TRIM37 silencing inhibited MTOR recruitment to the lysosomes, we tested whether the MTOR-RRAGB interaction was affected. As expected, TRIM37 depletion caused a striking reduction of MTOR-RRAGB interaction ()).
We then asked whether RRAG proteins mediated TRIM37-regulated MTORC1 signaling by overexpressing RRAGB (WT) or its constitutively-active forms, RRAGBGTP RRAGCGDP, in TRIM37 KD cells. Under normal growth conditions, RRAGBGTP RRAGCGDP but not RRAGB (WT) expression reversed the inhibition of MTORC1 activity by TRIM37 KD, comparable to that seen in control cells (Figure 4(a)). During amino acid stimulation, MTORC1 activity was constitutively activated by overexpressing RRAGBGTP RRAGCGDP in both control and TRIM37 KD cells, irrespective of amino acid availability ()). Furthermore, MTOR was re-distributed to lysosomes when RRAGBGTP was expressed in TRIM37 KD cells ()). These results suggest that TRIM37 activates MTORC1 following amino-acid stimulation through the RRAG proteins.
Figure 4. TRIM37 promotes MTOR signaling through RRAGB. (a) HepG2 control and TRIM37 KD cells were transfected with constructs encoding GFP only, RRAGBGTP (HA-GST-RRAGBQ99L) plus RRAGCGDP (HA-GST-RRAGCS75L), or HA-GST-RRAGB (WT). Cells were collected after 24 h of transfection, before proteins were detected by western blots. (b) HepG2 control and TRIM37 KD cells were transfected with constructs encoding myc-RPS6KB1, together with GFP or RRAGBGTP plus RRAGCGDP . After 24 h, cells were incubated with amino acid-depletion media for 2 h, followed by stimulation with amino acid-containing media for 15 min, before proteins were detected by western blots. (c) HepG2 control, TRIM37 KD cells and TRIM37 KD cells expressing FLAG-RRAGBGTP were immunostained with MTOR antibody. Nuclei were stained with DAPI. The images were acquired by confocal microscopy. Scale bars: 10 μm
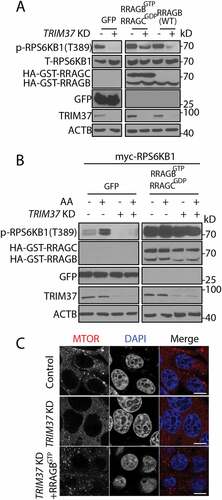
Hence our results show that TRIM37 interacts with MTOR and RRAGB, enhances MTOR-RRAGB interaction, and promotes lysosomal localization of MTOR proteins, thereby contributing directly to the activation of MTORC1 signaling in response to amino acids.
TRIM37 depletion activates TFEB signaling
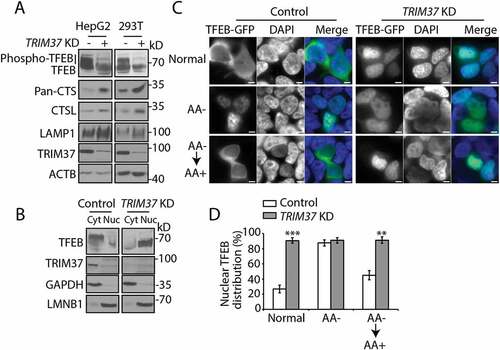
Two well-known MTORC1 substrates for autophagy regulation are ULK1 (unc-51 like autophagy activating kinase 1) and TFEB [Citation28,Citation29,Citation44]. We found that the phosphorylation of ULK1 at Ser757, which is directly phosphorylated by MTORC1 [Citation44], was barely altered by TRIM37 depletion (Fig. S1B). Hence we suspected that TRIM37 depletion might affect TFEB activity. As a transcription factor, TFEB was dephosphorylated as indicated by the disappearance of slowly migrating, smeared bands (Fig. S3A), and moved to nucleus (Fig. S3B), where it could activate genes involved in lysosome biogenesis and autophagy in response to MTORC1 inhibition by amino acid depletion or lysosome disruption [Citation28,Citation29,Citation36].
TFEB phosphorylation was dramatically reduced by TRIM37 depletion, as indicated by the decrease of the smeared bands, corresponding to phospho-TFEB (). Consistently, endogenous TFEB proteins were predominantly present in the nuclear fractions in TRIM37-depleted cells compared with the mostly cytosolic distribution in control cells ()). This was further confirmed by the almost exclusively nuclear distribution of TFEB-GFP in TRIM37 KD cells (). In contrast to that observed in control cells, addition of amino acids failed to re-translocate TFEB from the nucleus to the cytoplasm in TRIM37 KD cells following amino acid withdrawal (), consistent with the inhibition of MTORC1 signaling in response to amino acid stimulation in TRIM37 KD cells ()).
Figure 5. TRIM37 depletion reduces TFEB phosphorylation and induces TFEB nuclear translocation. (a) HepG2, HEK 293T control, and TRIM37 KD cells grown in normal growth media were collected for protein detection with the indicated antibodies. The smeared bands represent TFEB phosphorylation (phospho-TFEB). Pan-cathepsin (pan-CTS) antibody recognizes cathepsin family proteins. ACTB is used as a loading control. (b) HepG2 control and TRIM37 KD cells were fractionated into cytoplasm (Cyt) and nucleus (Nuc), followed by protein detection with the indicated antibodies. GAPDH and LMNB1 (lamin B1) were used as control proteins for cytoplasmic and nuclear fractions, respectively. (c and d) The TFEB-GFP expression construct was transfected into HepG2 control or TRIM37 KD cells. After 24 h, cells were incubated in amino acid-free media for 2 h (AA-), followed by incubation in amino acid-containing media (AA+) for 2 h. Normal, shows cells grown in normal growth media. Nuclei were stained with DAPI. Scale bars: 5 μm. (d) Quantification of cells shown in (c). Approximately 20–30 cells expressing TFEB-GFP were obtained and the percentages of cells with predominantly nuclear TFEB-GFP distributions were quantified. The results are presented as mean ± SEM (n = 3) based on 3 independent experiments. **, p < 0.01; ***, p < 0.001 (Student’s t test)
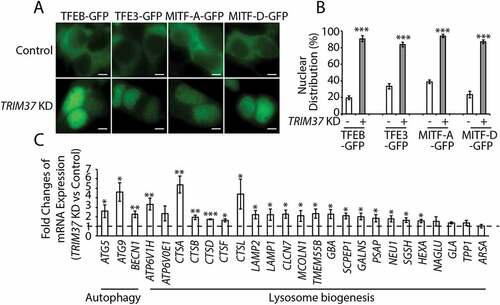
Besides TFEB, other members of MiTF/TFE family such as TFE3 (transcription factor binding to IGHM enhancer 3), MITF-A (melanogenesis associated transcription factor), and MITF-D have also been shown to move into the nucleus in response to MTORC1 inhibition [Citation29,Citation31]. Similar to TFEB, a predominantly nuclear distribution of these transcription factors (TFE3, MITF-A, and MITF-D) was observed in TRIM37 KD HepG2 () and HEK 293T cells (Fig. S4A and B), in contrast to their mainly cytoplasmic distributions in control cells. These results suggest that TRIM37 broadly controls the activity of MiTF/TFE transcription factors through MTORC1 signaling.
Upon moving into nucleus, MiTF/TFE family proteins activate transcription of numerous genes involved in lysosome biogenesis and autophagy. Consistent with this notion, mRNA levels of a substantial number of genes involved in lysosome biogenesis and autophagy were significantly upregulated upon TRIM37 depletion ()). More importantly, we also found that certain lysosomal proteins, such as cathepsin proteases and LAMP1 (lysosomal associated membrane protein 1), were increased in TRIM37 KD cells ()), consistent with the up-regulation of these mRNAs as well ()). These results suggested that TRIM37 depletion induces autophagy by activation of MiTF/TFE family proteins.
Figure 6. TRIM37 depletion induces nuclear translocation of MiTF/TFE family proteins and activates the CLEAR network. (a and b) HepG2 control and TRIM37 KD cells were transfected with constructs expressing TFEB-GFP, TFE3-GFP, MITF-A-GFP, or MITF-D-GFP. Images were taken after 24 h. Scale bars: 5 μm. (b) Quantification of cells in (a). Approximately 20–30 GFP-positive cells were obtained and the percentages of cells with predominantly nuclear distributions of these GFP fusion proteins were quantified. The results are presented as mean ± SEM (n = 3) based on 3 independent experiments. ***, P < 0.001 (Student’s t test). (c) Real-time PCR analysis of the autophagy genes and lysosome biogenesis genes in HepG2 control and TRIM37 KD cells. Data are shown as mean ± SEM, n = 3. *: p < 0.05, **: p < 0.01, ***: p < 0.001 (Student’s t-test)
We also observed a remarkable deregulation of the MTORC1-TFEB axis in patient fibroblasts with TRIM37 gene mutation [Citation12]. MTORC1 activity was significantly inhibited, accompanied by increase of TFEB nuclear distribution in these TRIM37-deficient fibroblasts (Fig. S5A-C), further supporting our conclusions and highlighting the significance of our studies.
The enhanced autophagy by TRIM37 depletion depends on the inhibition of MTORC1 signaling
The above results suggested that the enhanced autophagy in TRIM37-depleted cells might depend on the inhibition of MTORC1 and activation of TFEB. To further demonstrate this, we expressed RRAGBGTP (RRAGBQ99L) in TRIM37 KD cells. RRAGBGTP expression would constitutively activate MTORC1 signaling, irrespective of the availability of amino acids. As expected, expressing RRAGBGTP protein rescued MTORC1 inhibition by TRIM37 depletion (). More importantly, TFEB phosphorylation was restored ()), the protein re-distributed from the nucleus to the cytoplasm (), and autophagy activation was reversed in TRIM37 KD cells with RRAGBGTP expression ()). These results directly demonstrate that TRIM37 inhibits autophagy through MTORC1 activation.
Figure 7. RRAGBGTP expression rescues MTORC1 inhibition and compromises autophagy induction by TRIM37 depletion. (a–c) TRIM37 was silenced in HepG2 cells stably expressing FLAG-RAP2A or FLAG-RRAGBGTP (FLAG-RRAGBQ99L). (a) These cells in normal growth media were collected for protein detection with the indicated antibodies. ACTB is used as a loading control. (b) The cells were also transfected with the TFEB-GFP construct. After 24 h, the localization was analyzed by microscopy. Nuclei were stained with DAPI. Scale bars: 5 μm. (c) Quantification of cells shown in (b). Approximately 20–30 cells expressing TFEB-GFP were obtained and the percentages of cells with predominantly nuclear TFEB-GFP distributions were quantified. The results are presented as mean ± SEM (n = 3) based on 3 independent experiments. ***, p < 0.001 (Student’s t test). FLAG-RAP2A was used as a negative control protein, as described previously [Citation24]
![Figure 7. RRAGBGTP expression rescues MTORC1 inhibition and compromises autophagy induction by TRIM37 depletion. (a–c) TRIM37 was silenced in HepG2 cells stably expressing FLAG-RAP2A or FLAG-RRAGBGTP (FLAG-RRAGBQ99L). (a) These cells in normal growth media were collected for protein detection with the indicated antibodies. ACTB is used as a loading control. (b) The cells were also transfected with the TFEB-GFP construct. After 24 h, the localization was analyzed by microscopy. Nuclei were stained with DAPI. Scale bars: 5 μm. (c) Quantification of cells shown in (b). Approximately 20–30 cells expressing TFEB-GFP were obtained and the percentages of cells with predominantly nuclear TFEB-GFP distributions were quantified. The results are presented as mean ± SEM (n = 3) based on 3 independent experiments. ***, p < 0.001 (Student’s t test). FLAG-RAP2A was used as a negative control protein, as described previously [Citation24]](/cms/asset/03f2968b-ff55-41c2-b36d-75bca050d9cc/kaup_a_1463120_f0007_c.jpg)
To determine if the enhanced autophagy and increase in lysosomal proteins caused by TRIM37 depletion depends on TFEB activation, we silenced TFEB in TRIM37 KD cells. However, we still observed increases of autophagy, as well as cathepsin protease proteins, in the double TFEB TRIM37 KD cells (Fig. S4C). Since MiTF/TFE family members play redundant roles [Citation31,Citation32,Citation45,Citation46], the increased activities of other MiTF/TFE family members () may compensate for the loss of TFEB functions in TRIM37 KD cells.
The enhanced lysosomal functions may serve as an alternative mechanism to survive the loss of TRIM37 functions
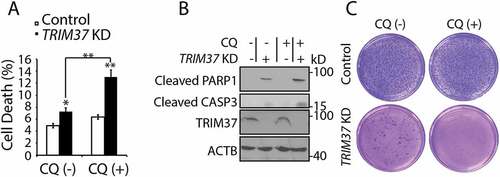
The above results suggested that the enhanced autophagy and lysosome functions by TRIM37 depletion might provide an alternative mechanism to survive the loss of TRIM37 functions. To demonstrate this, we used CQ to inhibit lysosome functions. CQ treatment had little effect on cell survival, as indicated by percentages of positive propidium iodide (PI)-staining cells () and cleaved PARP1 (poly[ADP-ribose] polymerase 1) and CASP3 (caspase 3) proteins (lane 1 and 3, )), and anchorage independent cell growth ()) in control cells. Consistent with previous observations [Citation12], TRIM37 depletion induced cell death as indicated by both PI staining (CQ [-], )) and detection with cleaved PARP1 and CASP3 (lane 1 and 2, )), and reduced anchorage-independent cell growth (CQ [-], )). However, CQ treatment resulted in further cell death and inhibition of anchorage-independent growth in TRIM37 KD cells (). Similarly, a further increase of cell death was observed in the double TRIM37 ATG7 KD cells as indicated by CASP3 cleavage (Fig. S6A). These results suggest that the survival of TRIM37-deficient cells may depend on enhanced lysosomal functions. On the other hand, the induced cell death in CQ-treated or untreated TRIM37 KD cells was abolished when cells were expressing MTORC1 constitutive proteins RRAGBGTP (RRAGBQ99L) (Fig. S6B), suggesting that TRIM37 depletion induces cell death through MTORC1 inhibition.
Figure 8. Survival of TRIM37 KD cells may depend on lysosomal functions. (a and b) HepG2 control and TRIM37 KD cells were treated without (-) or with (+) CQ (10 μM) for 16 h. (a) Cells were collected for PI staining to analyze the percentages of cell death. Data from triplicate samples in each group are presented as mean ± SEM and representative of 3 independent experiments; *: p < 0. 05; **: p < 0. 01; (Student’s t-test). (b) Cells were also collected for protein detection with the indicated antibodies. (c) HepG2 control and TRIM37 KD cells were grown in soft agar in the absence (-) or presence (+) of CQ (10 μM). The pictures were taken after 2 weeks
Discussion
Our studies present a molecular mechanism for how cells respond to, integrate, and adapt to intracellular changes in response to loss of TRIM37 functions. MTORC1 is a master regulator of basic cellular processes such as cell growth, survival, and metabolism, and its deregulation has been implicated in many human diseases including cancer, diabetes, and neurodegeneration, as well as in many human genetic diseases [Citation13,Citation14,Citation47,Citation48]. Our studies implicate MTORC1 as the major signaling pathway affected by TRIM37 deficiency in mulibrey nanism. The depletion of TRIM37 inhibits the cellular response to nutrients, such as amino acids but not growth factors, through MTORC1 inhibition and consequently, enhancing autophagy, which might contribute to the pathogenesis of mulibrey nanism.
Unlike the role of TRIM37 in peroxisome biogenesis [Citation12] and H2A-mediated transcriptional regulation [Citation9], TRIM37 promotes activation of MTORC1 independent of its E3 ligase activity. Interestingly, we find that TRIM37 interacts directly with the key components of MTORC1 pathway (MTOR and RRAGB). Our results also suggest that the presence of TRIM37 facilitates RRAGB-mediated recruitment of MTOR to lysosomes, which activates the signaling. TRIM37 may act as a bridge that brings together MTOR and RRAGB proteins since the MTOR-RRAGB interaction is remarkably reduced by TRIM37 depletion. Another possibility is that TRIM37 promotes GTPase RRAGB transition from the inactive GDP to the active GTP bound form, which then recruits MTOR to lysosomes for activation. These hypotheses need to be tested in the future.
In response to various environmental or intracellular stresses, TFEB activates the CLEAR network, which regulates lysosome biogenesis and autophagy [Citation31]. Our results show that the stresses caused by the loss of TRIM37 increase TFEB activity and autophagy in an MTORC1-dependent manner. Depending on the cellular context, autophagy can either promote or inhibit cell death [Citation49–Citation51]. Our study suggests that autophagy may facilitate a pro-survival function upon the loss of TRIM37. Patients with TRIM37 gene mutations have high risk of developing tumors, with kidneys being the organ that is affected most often [Citation2,Citation4–Citation8]. Consistently, TRIM37 protein is hardly detected in renal cancers, compared to its high level in normal tissues [Citation52]. It has been shown that progression of renal cell carcinomas requires autophagy [Citation53–Citation55]. Our results, in combination with these patient data, suggest that these TRIM37-deficient renal cancer cells may have adapted autophagy as an alternative survival mechanism to provide essential metabolites and/or nutrients to help these tumor cells overcome the loss of TRIM37.
Because chloroquine and its derivative hydroxychloroquine (HCQ) are well tolerated in humans and have been used therapeutically for several diseases, including malaria, rheumatoid arthritis, lupus erythematosus, and some human cancers [Citation56], it is worth exploring whether CQ, HCQ, and their derivatives may also have beneficial effects for treating tumors in mulibrey nanism patients. Indeed, small molecules related to HCQ, such as ROC-325, or its combination with other drugs, have proven to have therapeutic potential in renal cell carcinoma cells [Citation57–Citation59].
Materials and methods
Reagents
The following antibodies were purchased from Cell Signaling Technology: p-AKT (Ser473; 4060), p-PRKAA/AMPKα (Thr172; 2535), p-EIF4EBP1 (Thr37/46; 2855), EIF4EBP1 (9644), p-ULK1 (Ser757; 6888), p-MAPK1/ERK2-MAPK3/ERK1 (Thr202/Tyr204; 4376), TFEB (4240), p-RPS6KB1 (Thr389; 9234), cleaved CASP3 (Asp175; 9664); cleaved PARP1 (Asp214; 5625); GAPDH (2118), p-TSC2 (Thr1462; 3617), TSC2 (4308), MTOR (2983). The following antibodies were from Santa Cruz Biotechnology: TRIM37 (sc-515,044), ULK1 (sc-390,904), LAMP1 (sc-20,011), LAMP2 (sc-18,822), CTSL (sc-32,320), pan-CTS (sc-376,803), LMNB1 (sc-374,015), SQSTM1 (sc-28,359), ATG16L1 (sc-393,274). Other antibodies are as follows: ACTB (Sigma, A1978), FLAG (Sigma, F3165), LC3B (for WB, Novus Biologicals, NB100-2220), LC3B (for IF, Nanotools, 0231–100), ATG7 (Epitomics, 2054–1), HA-HRP (Abcam, ab1190), HA (Sigma, 11,583,816,001). Other reagents were as follows: chloroquine (Sigma, C6628), insulin (Sigma, I5500), LysoTracker Blue DND-22 (Invitrogen, L7525), N-acetyl-L-cysteine (NAC; Sigma, A9165), 4-hydroxy-TEMPO (Sigma, 176,141). The siRNAs used to silence ATG7 and ATG16L1 were as described previously [Citation60].
Plasmids
The following plasmids were purchased from Addgene. pBABE-puro mCherry-EGFP-LC3B (22,418; deposited by Jayanta Debnath lab), pEGFP-N1-TFEB (38,119; deposited by Shawn Ferguson lab), pEGFP-N1-MITF-A (38,132; deposited by Shawn Ferguson lab), pEGFP-N1-MITF-D (38,133; deposited by Shawn Ferguson lab), pEGFP-N1-TFE3 (38,120; deposited by Shawn Ferguson lab), Flag pLJM1 RAP2A (19,311; deposited by David Sabatini lab), Flag pLJM1 RRAGB 99L (19,315; deposited by David Sabatini lab), pRK5-HA GST RRAGB WT (19,301; deposited by David Sabatini lab), pRK5-HA GST RRAGB 99L (19,303; deposited by David Sabatini lab), pRK5-HA GST RRAGC 75L (19,305; deposited by David Sabatini lab), FLAG-MTOR (26,603; deposited by Jie Chen lab).
Cell culture and DNA transfection
HEK 293T and HepG2 cells (ATCC) were cultured in Dulbecco’s modified Eagle’s medium (DMEM; Thermo Fisher Scientific, 11,965,118) supplemented with 10% fetal bovine serum (Thermo Fisher Scientific, A3160601) and penicillin/streptomycin (1:100 dilution, Thermo Fisher Scientific, 15,140,122). Fibroblasts from a healthy donor (AG21802) and a mulibrey nanism patient (AG02122) were obtained from the Coriell Institute and cultured in minimum essential medium eagle (Sigma, M5650) supplemented with 15% fetal bovine serum (Thermo Fisher Scientific, A3160601) and penicillin/streptomycin (1:100 dilution, Thermo Fisher Scientific, 15,140,122). All cells were incubated at 37°C in a humidified 5% (v:v) CO2 incubator. Cell transfection was performed by using X-tremeGENE™ HP DNA Transfection Reagent (Sigma, 6,366,546,001) according to manufacturer’s instructions.
Western blot and co-immunoprecipitation
Cells were collected in lysis buffer (40 mM HEPES, pH 7.4, 120 mM NaCl, 1 mM EDTA, 1.0% CHAPS (Thermo Fisher Scientific, 28,299), 10 mM pyrophosphate (Sigma, P9146), 10 mM glycerophosphate (Sigma, G6251), and protease inhibitor cocktails (Sigma, 05892791001)). The lysates were centrifuged (12,000 xg, 5min) and supernatants were collected. The protein concentrations were measured using a BCA protein assay kit (Thermo Fisher Scientific, 23,225) and equal amounts of proteins were subjected to western blot analysis. To obtain better migration and separation of the phosphorylated and non-phosphorylated TFEB, we used commercial 4–15% gradient precast protein gels (Bio-Rad, 4,561,084) for detection of TFEB. Otherwise, we used homemade SDS-PAGE gels for protein migration. Image Studio Ver4.0 software was used to examine if the blots were oversaturated.
For co-immunoprecipitation, cells were transfected with constructs and collected in lysis buffer (50 mM Tris-HCl, pH 7.5, 150 mM NaCl, 0.2% Triton X-100 (Sigma, X100RS), 10% glycerol, and protease inhibitors). Protein lysates were incubated with the corresponding IP antibody followed by addition of protein G beads (Sigma, GE17-0618–01). The IP beads were washed 3 times with lysis buffer and boiled for 10 min in 40 µl of 2× SDS sample buffer (100 mM Tris-HCl, pH 6.8, 4% SDS, 20% glycerol, 0.2 M dithiothreitol [DTT], and 0.02% bromophenol blue). The IP lysates were subjected to western blot detection of the interacting proteins.
Immunofluorescence
Cells were grown on cover slides and fixed with 4% paraformaldehyde (Sigma, 158,127) for 10 min, followed by 5 min of 0.5% Triton X-100 permeabilization and 0.5 h of blocking with 1% BSA (Sigma, A7030) in Dulbecco’s phosphate-buffered saline (DPBS; Thermo Fisher Scientific, 14,190–250) at room temperature. To stain the endogenous LC3B proteins, cells were fixed with 100% methanol for 15 min at −20°C. The slides were then incubated with primary antibodies and the corresponding fluorescent dye-conjugated secondary antibodies for 2 h and 1 h, respectively. Nuclei were stained with DAPI (1 μg/ml; Sigma, D8417). The localizations were observed under a fluorescence microscope (Axioskop 2 MOT plus; Carl Zeiss) and the pictures were acquired and processed using the AxioVision software (Carl Zeiss). Alternatively, the slides were observed and images acquired by confocal microscopy (Zess LSM880 Laser Scanning Microscope with Airyscan).
RT-PCR
Total RNA was extracted with TRIzol reagent (Thermo Fisher Scientific, 15,596,026) and reverse transcribed according to manufacturer’s instructions using the High-Capacity cDNA Reverse Transcription Kit (Thermo Fisher Scientific, 4,374,966). The cDNA was used as template for real-time PCR analysis with Fast SYBR Green (Thermo Fisher Scientific, 4,385,612) of target gene expression with the specific primers as listed in Table S1 and as described previously [Citation36,Citation61]. The relative expressions of each gene were normalized to loading control gene GAPDH. The data are presented as the fold changes of gene expression in TRIM37 knockdown vs. control cells from 3 independent experiments.
Flow cytometry
To detect percentages of cell death, cells were either untreated or treated with lysosomal inhibitor chloroquine (10 μM) for 16 h, and digested to single cells using 0.25% trypsin (Thermo Fisher Scientific, 25,200,056). Cells were stained with propidium iodide (PI) (1 μg/ml; Sigma, P4170) in PBS. Channel FL3 (deep red fluorescence, Ex 488 nm, Em 670LP) was used to detect PI signal using a FACScalibur flow cytometer (Beckton‐Dickinson). To detect cellular ROS, cells were incubated with dihydrorhodamine 123 (DHR123, 10 μM; Thermo Fisher Scientific, D23806) or CellRox Green (5 μM; Thermo Fisher Scientific, C10444) dyes for 30 min. Then cells were digested to single cells and fluorescence was detected through channel FL1 (green fluorescence, excitation wavelength 488 nm, emission wavelength 535/530 nm), using a FACScalibur flow cytometer (Beckton‐Dickinson).
Generating stable knockdown cells
The shRNA sequence targeting TRIM37 is 5ʹ TTCGAGAATATGATGCTGTGG 3ʹ (Dharmacon, RHS4533-EG4591). The shRNA sequence targeting TFEB is 5ʹ TTGATGTTGAACCTTCGTCTC 3ʹ (Dharmacon, RHS4533-EG7942). The shRNA sequence targeting ATG7 is 5ʹ TACAGTGTTCCAATAGCTGGG 3ʹ (Sigma, TRCN0000007587). The lentivirus system was used to establish knockdown stable cell lines as follows. The shRNA construct was transfected together with the lentivirus packaging plasmids, psPAX2 (Addgene, 12,260, deposited by Didier Trono lab) and pMD2.G (Addgene, 12,259 deposited by Didier Trono lab) into HEK 293T cells. The virus supernatants were collected and filtered for target cell infection. Surviving cell populations following puromycin selection (2 μg/ml; Sigma, P9620) were subjected to knockdown analysis by western blot.
To make the double TRIM37 and TFEB knockdown or double TRIM37 and ATG7 knockdown cells, TFEB or ATG7 genes were first silenced by infecting HepG2 cells with virus expressing TFEB or ATG7 shRNA, respectively, followed by TRIM37 silencing with virus expressing TRIM37 shRNA. To confirm that the phenotype observed in the TRIM37 KD cells was caused by loss of the TRIM37 protein (WT or C35,36S mutant), we first made a stable, HepG2 cell line expressing shRNA-resistant TRIM37 (WT or C35,36S). Then endogenous TRIM37 was silenced with virus expressing TRIM37 shRNA as described [Citation12].
To rescue MTORC1 inhibition in TRIM37 KD cells, cell lines expressing FLAG-RAP2A (control cells) or FLAG-RRAGBQ99L were first established as follows: Flag pLJM1 RAP2A, or Flag pLJM1 RRAGBQ99L together with psPAX2 and pMD2.G were transfected into HEK 293T cells. The virus supernatants were collected and filtered for HepG2 cell infection. Surviving cell populations were selected with puromycin (1 μg/ml) and RAP2A or RRAGBQ99L expression was verified by FLAG antibody. HepG2 cells stably expressing FLAG-RAP2A were infected with virus expressing control or TRIM37 shRNA, while HepG2 cells stably expressing FLAG-RRAGBQ99L were infected with virus expressing TRIM37 shRNA as described above.
Soft agar assay
1 × 10⁴ HepG2 control and TRIM37 KD cells were suspended in 2 ml of 0.3% agarose (APEX, 20–102) and poured onto a 3 ml 0.7% agarose bed in 60-mm tissue culture dishes. The cells were incubated for around 2 weeks till visible colonies appeared. Cells were stained with 0.1% crystal violet in 10% ethanol for 30 min and de-stained with H2O.
Subcellular fractionation of cytoplasm and nucleus
Subcellular fractionation was done as previously described [Citation29]. Cells grown in 10-cm dishes were washed once in PBS and collected with 500 μl of ice-cold hypotonic buffer (10 mM HEPES, pH 7.9, 10 mM KCl, 0.1 mM EDTA, 0.1 mM EGTA, 1 mM DTT, 0.15% NP-40 [Fluka Biochemika, 74,385]), and homogenized with 20 strokes of a Dounce homogenizer (Thermo Fisher Scientific, K85300-0002). The homogenates were subjected to centrifugation at 18, 407 x g, 5 min. The supernatants were collected as cytoplasmic fraction and the pellet were collected as nuclear fraction by resuspending in 200 ml of high-salt buffer (20 mM HEPES, pH 8.0, 400 mM NaCl, 1 mM EDTA, 1 mM EGTA, 1 mM DTT, 0.5% NP-40, 1%, 25 U benzonase [Sigma, E1014]). GAPDH and LMNB1 (lamin B1) were used as the control proteins for cytoplasmic and nuclear fractions respectively.
Statistics
p values were calculated using 2-tailed unpaired Student’s t test. P values of less than 0.05 were considered statistically significant. * p < 0.05; ** p < 0.01; *** p < 0.001.
Supplemental Material
Download Zip (5.4 MB)Acknowledgments
We thank all Subramani lab members for discussions. This grant was supported by NIH grant (5RO1 DK41737) to SS.
Disclosure statement
No potential conflict of interest was reported by the authors.
Supplemental data
Supplemental data for this article can be accessed here.
Additional information
Funding
Related Research Data
References
- Avela K, Lipsanen-Nyman M, Idanheimo N, et al. Gene encoding a new RING-B-box-Coiled-coil protein is mutated in mulibrey nanism. Nat Genet. 2000 Jul;25(3):298–301. PubMed PMID: 10888877.
- Karlberg N, Jalanko H, Perheentupa J, et al. Mulibrey nanism: clinical features and diagnostic criteria. J Med Genet. 2004 Feb;41(2):92–98. PubMed PMID: 14757854; PubMed Central PMCID: PMC1735664.
- Karlberg N, Jalanko H, Kallijarvi J, et al. Insulin resistance syndrome in subjects with mutated RING finger protein TRIM37. Diabetes. 2005 Dec;54(12):3577–3581. PubMed PMID: 16306379.
- Karlberg N, Karlberg S, Karikoski R, et al. High frequency of tumours in mulibrey nanism. J Pathol. 2009 Jun;218(2):163–171. PubMed PMID: 19334051.
- Hamalainen RH, Mowat D, Gabbett MT, et al. Wilms’ tumor and novel TRIM37 mutations in an Australian patient with mulibrey nanism. Clin Genet. 2006 Dec;70(6):473–479. PubMed PMID: 17100991.
- Seemanova E, Bartsch O. Mulibrey nanism and Wilms tumor. Am J Med Genet. 1999 Jul 2;85(1):76–78. PubMed PMID: 10377015.
- Simila S, Timonen M, Heikkinen E. A case of mulibrey nanism with associated Wilms’ tumor. Clin Genet. 1980 Jan;17(1):29–30. PubMed PMID: 6248277.
- Sivunen J, Karlberg S, Lohi J, et al. Renal findings in patients with mulibrey nanism. Pediatr Nephrol. 2017 Apr 22;32:1531–1536. PubMed PMID: 28432469.
- Bhatnagar S, Gazin C, Chamberlain L, et al. TRIM37 is a new histone H2A ubiquitin ligase and breast cancer oncoprotein. Nature. 2014 Dec 4;516(7529):116–120. PubMed PMID: 25470042; PubMed Central PMCID: PMC4269325.
- Meitinger F, Anzola JV, Kaulich M, et al. 53BP1 and USP28 mediate p53 activation and G1 arrest after centrosome loss or extended mitotic duration. J Cell Biol. 2016 Jul 18;214(2):155–166. PubMed PMID: 27432897; PubMed Central PMCID: PMC4949453.
- Balestra FR, Strnad P, Fluckiger I, et al. Discovering regulators of centriole biogenesis through siRNA-based functional genomics in human cells. Dev Cell. 2013 Jun 24;25(6):555–571. PubMed PMID: 23769972.
- Wang W, Xia ZJ, Farre JC, et al. TRIM37, a novel E3 ligase for PEX5-mediated peroxisomal matrix protein import. J Cell Biol. 2017 Sep 04;216(9):2843–2858. PubMed PMID: 28724525; PubMed Central PMCID: PMC5584156.
- Laplante M, Sabatini DM. mTOR signaling in growth control and disease. Cell. 2012 Apr 13;149(2):274–293. PubMed PMID: 22500797; PubMed Central PMCID: PMC3331679.
- Bond P. Regulation of mTORC1 by growth factors, energy status, amino acids and mechanical stimuli at a glance. J Int Soc Sports Nutr. 2016;13:8. PubMed PMID: 26937223; PubMed Central PMCID: PMC4774173.
- Kim YC, Guan KL. mTOR: a pharmacologic target for autophagy regulation. J Clin Invest. 2015 Jan;125(1):25–32. PubMed PMID: 25654547; PubMed Central PMCID: PMC4382265.
- Inoki K, Li Y, Xu T, et al. Rheb GTPase is a direct target of TSC2 GAP activity and regulates mTOR signaling. Genes Dev. 2003 Aug 01;17(15):1829–1834. PubMed PMID: 12869586; PubMed Central PMCID: PMC196227.
- Inoki K, Li Y, Zhu T, et al. TSC2 is phosphorylated and inhibited by Akt and suppresses mTOR signalling. Nat Cell Biol. 2002 Sep;4(9):648–657. PubMed PMID: 12172553.
- Potter CJ, Pedraza LG, Xu T. Akt regulates growth by directly phosphorylating Tsc2. Nat Cell Biol. 2002 Sep;4(9):658–665. PubMed PMID: 12172554.
- Tee AR, Manning BD, Roux PP, et al. Tuberous sclerosis complex gene products, Tuberin and Hamartin, control mTOR signaling by acting as a GTPase-activating protein complex toward Rheb. Current Biol. 2003 Aug 05;13(15):1259–1268. PubMed PMID: 12906785.
- Manning BD, Tee AR, Logsdon MN, et al. Identification of the tuberous sclerosis complex-2 tumor suppressor gene product tuberin as a target of the phosphoinositide 3-kinase/akt pathway. Mol Cell. 2002 Jul;10(1):151–162. PubMed PMID: 12150915.
- Bar-Peled L, Sabatini DM. Regulation of mTORC1 by amino acids. Trends Cell Biol. 2014 Jul;24(7):400–406. PubMed PMID: 24698685; PubMed Central PMCID: PMC4074565.
- Jewell JL, Russell RC, Guan KL. Amino acid signalling upstream of mTOR. Nat Rev Mol Cell Biol. 2013 Mar;14(3):133–139. PubMed PMID: 23361334; PubMed Central PMCID: PMC3988467.
- Kim E, Goraksha-Hicks P, Li L, et al. Regulation of TORC1 by Rag GTPases in nutrient response. Nat Cell Biol. 2008 Aug;10(8):935–945. PubMed PMID: 18604198; PubMed Central PMCID: PMC2711503.
- Sancak Y, Peterson TR, Shaul YD, et al. The rag GTPases bind raptor and mediate amino acid signaling to mTORC1. Science. 2008 Jun 13;320(5882):1496–1501. PubMed PMID: 18497260; PubMed Central PMCID: PMC2475333.
- Mizushima N. Autophagy: process and function. Genes Dev. 2007 Nov 15;21(22):2861–2873. PubMed PMID: 18006683.
- Kaur J, Debnath J. Autophagy at the crossroads of catabolism and anabolism. Nat Rev Mol Cell Biol. 2015 Aug;16(8):461–472. PubMed PMID: 26177004.
- Kroemer G, Marino G, Levine B. Autophagy and the integrated stress response. Mol Cell. 2010 Oct 22;40(2):280–293. PubMed PMID: 20965422; PubMed Central PMCID: PMC3127250.
- Settembre C, Zoncu R, Medina DL, et al. A lysosome-to-nucleus signalling mechanism senses and regulates the lysosome via mTOR and TFEB. EMBO J. 2012 Mar 7;31(5):1095–1108. PubMed PMID: 22343943; PubMed Central PMCID: PMC3298007.
- Roczniak-Ferguson A, Petit CS, Froehlich F, et al. The transcription factor TFEB links mTORC1 signaling to transcriptional control of lysosome homeostasis. Sci Signal. 2012 Jun 12;5(228):ra42. PubMed PMID: 22692423; PubMed Central PMCID: PMC3437338.
- Martina JA, Puertollano R. Rag GTPases mediate amino acid-dependent recruitment of TFEB and MITF to lysosomes. J Cell Biol. 2013 Feb 18;200(4):475–491. PubMed PMID: 23401004; PubMed Central PMCID: PMC3575543.
- Raben N, Puertollano R. TFEB and TFE3: linking lysosomes to cellular adaptation to stress. Annu Rev Cell Dev Biol. 2016 Oct 06;32:255–278.
- Nezich CL, Wang C, Fogel AI, et al. MiT/TFE transcription factors are activated during mitophagy downstream of Parkin and Atg5. J Cell Biol. 2015 Aug 03;210(3):435–450. PubMed PMID: 26240184; PubMed Central PMCID: PMC4523611.
- Martina JA, Diab HI, Brady OA, et al. TFEB and TFE3 are novel components of the integrated stress response. EMBO J. 2016 Mar 01;35(5):479–495. PubMed PMID: 26813791; PubMed Central PMCID: PMC4772850.
- Sardiello M, Palmieri M, di Ronza A, et al. A gene network regulating lysosomal biogenesis and function. Science. 2009 Jul 24;325(5939):473–477. PubMed PMID: 19556463.
- Palmieri M, Impey S, Kang H, et al. Characterization of the CLEAR network reveals an integrated control of cellular clearance pathways. Hum Mol Genet. 2011 Oct 01;20(19):3852–3866. PubMed PMID: 21752829.
- Settembre C, Di Malta C, Polito VA, et al. TFEB links autophagy to lysosomal biogenesis. Science. 2011 Jun 17;332(6036):1429–1433. PubMed PMID: 21617040; PubMed Central PMCID: PMC3638014.
- Klionsky DJ, Abdelmohsen K, Abe A, et al. Guidelines for the use and interpretation of assays for monitoring autophagy (3rd edition). Autophagy. 2016;12(1):1–222. PubMed PMID: 26799652; PubMed Central PMCID: PMC4835977.
- Jewell JL, Kim YC, Russell RC, et al. Metabolism. Differential regulation of mTORC1 by leucine and glutamine. Science. 2015 Jan 09;347(6218):194–198. PubMed PMID: 25567907; PubMed Central PMCID: PMC4384888.
- Nordgren M, Fransen M. Peroxisomal metabolism and oxidative stress. Biochimie. 2014 Mar;98:56–62. PubMed PMID: 23933092.
- Wang W, Subramani S. Role of PEX5 ubiquitination in maintaining peroxisome dynamics and homeostasis. Cell Cycle. 2017 Sep 21:1–9. PubMed PMID: 28933989. DOI:10.1080/15384101.2017.1376149.
- Zhang X, Cheng X, Yu L, et al. MCOLN1 is a ROS sensor in lysosomes that regulates autophagy. Nat Commun. 2016 Jun 30;7:12109. PubMed PMID: 27357649; PubMed Central PMCID: PMC4931332.
- Li RJ, Xu J, Fu C, et al. Regulation of mTORC1 by lysosomal calcium and calmodulin. eLife. 2016 Oct 27;5. PubMed PMID: 27787197; PubMed Central PMCID: PMC5106211.
- Kallijarvi J, Lahtinen U, Hamalainen R, et al. TRIM37 defective in mulibrey nanism is a novel RING finger ubiquitin E3 ligase. Exp Cell Res. 2005 Aug 1;308(1):146–155. PubMed PMID: 15885686.
- Kim J, Kundu M, Viollet B, et al. AMPK and mTOR regulate autophagy through direct phosphorylation of Ulk1. Nat Cell Biol. 2011 Feb;13(2):132–141. PubMed PMID: 21258367; PubMed Central PMCID: PMC3987946.
- Pastore N, Brady OA, Diab HI, et al. TFEB and TFE3 cooperate in the regulation of the innate immune response in activated macrophages. Autophagy. 2016 Aug 02;12(8):1240–1258. PubMed PMID: 27171064; PubMed Central PMCID: PMC4968228.
- Huan C, Kelly ML, Steele R, et al. Transcription factors TFE3 and TFEB are critical for CD40 ligand expression and thymus-dependent humoral immunity. Nat Immunol. 2006 Oct;7(10):1082–1091. PubMed PMID: 16936731; PubMed Central PMCID: PMC2386253.
- Saxton RA, Sabatini DM. mTOR signaling in growth, metabolism, and disease. Cell. 2017 Mar 09;168(6):960–976. PubMed PMID: 28283069; PubMed Central PMCID: PMC5394987.
- Rosner M, Hanneder M, Siegel N, et al. The mTOR pathway and its role in human genetic diseases. Mutat Res. 2008 Sep-Oct;659(3):284–292. PubMed PMID: 18598780.
- Codogno P, Meijer AJ. Autophagy and signaling: their role in cell survival and cell death. Cell Death Differ. 2005 Nov;12 Suppl 2:1509–1518. PubMed PMID: 16247498.
- Das G, Shravage BV, Baehrecke EH. Regulation and function of autophagy during cell survival and cell death. Cold Spring Harb Perspect Biol. 2012 Jun 01;4(6):a008813–a008813. PubMed PMID: 22661635; PubMed Central PMCID: PMC3367545.
- Baehrecke EH. Autophagy: dual roles in life and death? Nat Rev Mol Cell Biol. 2005 Jun;6(6):505–510. PubMed PMID: 15928714.
- Uhlen M, Fagerberg L, Hallstrom BM, et al. Proteomics. Tissue-based map of the human proteome. Science. 2015 Jan 23;347(6220):1260419. PubMed PMID: 25613900.
- Mikhaylova O, Stratton Y, Hall D, et al. VHL-regulated MiR-204 suppresses tumor growth through inhibition of LC3B-mediated autophagy in renal clear cell carcinoma. Cancer Cell. 2012 Apr 17;21(4):532–546. PubMed PMID: 22516261; PubMed Central PMCID: PMC3331999.
- Liu XD, Zhu H, DePavia A, et al. Dysregulation of HIF2alpha and autophagy in renal cell carcinoma. Mol Cell Oncol. 2015 Apr–Jun;2(2):e965643. PubMed PMID: 27308417; PubMed Central PMCID: PMC4904964.
- Kang JH, Lee JS, Hong D, et al. Renal cell carcinoma escapes death by p53 depletion through transglutaminase 2-chaperoned autophagy. Cell Death Dis. 2016 Mar 31;7:e2163. PubMed PMID: 27031960; PubMed Central PMCID: PMC4823929.
- Pasquier B. Autophagy inhibitors. Cell Mol Life Sci. 2016 Mar;73(5):985–1001. PubMed PMID: 26658914.
- Carew JS, Espitia CM, Zhao W, et al. Disruption of autophagic degradation with ROC-325 antagonizes renal cell carcinoma pathogenesis. Clinical Cancer Res. 2017 Jun 1;23(11):2869–2879. PubMed PMID: 27881580.
- Yin P, Jia J, Li J, et al. ABT-737, a Bcl-2 elective inhibitor, and chloroquine synergistically kill renal cancer cells. Oncol Res. 2016;24(1):65–72. PubMed PMID: 27178823.
- Kimura T, Takabatake Y, Takahashi A, et al. Chloroquine in cancer therapy: a double-edged sword of autophagy. Cancer Res. 2013 Jan 01;73(1):3–7. PubMed PMID: 23288916.
- Nazarko TY, Ozeki K, Till A, et al. Peroxisomal Atg37 binds Atg30 or palmitoyl-CoA to regulate phagophore formation during pexophagy. J Cell Biol. 2014 Feb 17;204(4):541–557. PubMed PMID: 24535825; PubMed Central PMCID: PMC3926955.
- Xia Q, Wang H, Hao Z, et al. TDP-43 loss of function increases TFEB activity and blocks autophagosome-lysosome fusion. EMBO J. 2016 Jan 18;35(2):121–142. PubMed PMID: 26702100; PubMed Central PMCID: PMC4718457.