
 ?Mathematical formulae have been encoded as MathML and are displayed in this HTML version using MathJax in order to improve their display. Uncheck the box to turn MathJax off. This feature requires Javascript. Click on a formula to zoom.
ABSTRACT
TARDBP (TAR DNA binding protein) is one of the components of neuronal aggregates in sporadic amyotrophic lateral sclerosis (ALS) and frontotemporal lobar degeneration. We have developed a simple quantitative method to evaluate TARDBP splicing function that was applied to spinal cord, brainstem, motor cortex, and occipital cortex in ALS (n = 8) cases compared to age- and gender-matched control (n = 17). Then, we quantified the abundance of a TARDBP-spliced cryptic exon present in ATG4B (autophagy related 4B cysteine peptidase) mRNA. Results of these analyses demonstrated that the loss of this TARDBP function in spinal cord, brainstem, motor cortex, and occipital cortex differentiated ALS from controls (area under the curve of receiver operating characteristic: 0.85). Significant correlations were also observed between cryptic exon levels, age, disease duration, and aberrant mRNA levels. To test if TARDBP function in splicing is relevant in ATG4B major function (autophagy) we downregulated TARDBP expression in human neural tissue and in HeLa cells, demonstrating that TARDBP is required for maintaining the expression of ATG4B. Further, ATG4B overexpression alone is sufficient to completely prevent the increase of SQSTM1 induced by TARDBP downregulation in human neural tissue cells and in cell lines. In conclusion, the present findings demonstrate abnormal alternative splicing of ATG4B transcripts in ALS neural tissue in agreement with TARDBP loss of function, leading to impaired autophagy.
Abbreviations: ALS: amyotrophic lateral sclerosis; ATG4B: autophagy related 4B cysteine peptidase; AUC: area under the curve; FTLD: frontotemporal lobar degeneration; iPSC: induced pluripotent stem cells; ROC: receiver operating characteristic; TARDBP: TAR DNA binding protein; RT-qPCR: quantitative RT-PCR
Introduction
TARDBP (TAR DNA binding protein) is one of the components of neuronal aggregates in sporadic amyotrophic lateral sclerosis (ALS) and frontotemporal lobar degeneration (FTLD). Whether these aggregates are associated with TARDBP loss of function is not known. TARDBP is involved in the splicing of cryptic exons of selected mRNAs, such as of ATG4B (autophagy related 4B cysteine peptidase). Cryptic exons are considered splicing variants that may introduce frameshifts or stop codons, among other changes in the resulting mRNA. These aberrant mRNA have been demonstrated in motor cortex and middle temporal gyrus of ALS and FTLD patients [Citation1]. However, it was undetermined whether ALS target locations also presented cryptic exons. Further, whether these mRNA anomalies have any impact in translation of the corresponding proteins was unknown. In this brief report, we have developed a simple quantitative method to evaluate this TARDBP splicing function that was applied to samples of various central nervous system regions from ALS cases compared to age- and gender-matched control individuals. Further, we have characterized the effects of TARDBP loss in autophagy role of ATG4B.
Results and discussion
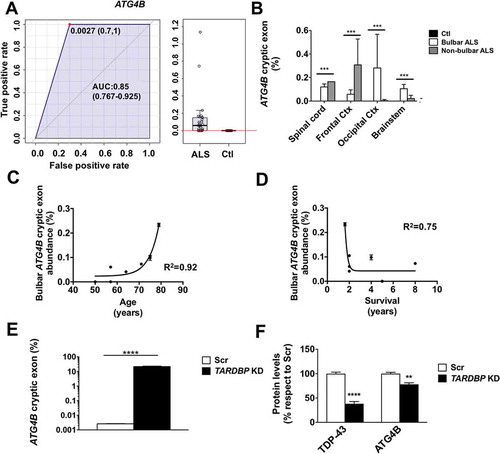
RNA was extracted from 50–100 mg homogenized nervous tissue. We quantified the abundance of TARDBP-spliced cryptic exons present in ATG4B mRNAs with RT-qPCR. RT-qPCR results agree with the loss of TARDBP function in spinal cord, brainstem, motor cortex, and occipital cortex differentiating ALS from controls (area under the curve of ROC: 0.85, )). Next, we observed that the abundance of cryptic exons in the ATGB transcript was mainly influenced by ALS status (p < 0.005 for ALS status, p = 0.69 for brain region and p = 0.1 for interaction in 2-way ANOVA) ()). Significant correlations were also observed between bulbar levels of cryptic exons and age ()). Indeed, a more severe phenotype of the disease (i.e., shorter duration of disease after diagnosis) was associated with higher level of aberrant mRNAs ()).
Figure 1. The abundance of TARDBP regulated cryptic exons in ATG4B mRNA is an ALS tissue biomarker and TARDBP knockdown leads to down regulation of ATG4B. (a) Values of ATG4B mRNA analyses (± standard error) indicate that ATG4B cryptic exon levels are higher in samples from ALS when compared with controls. (b) RT-qPCR of ATG4B cryptic exons show different expression levels in spinal cord, frontal cortex, occipital cortex, and brain stem; ATG4B aberrant mRNA levels depend on ALS type (bulbar vs non-bulbar cases). (c) ATG4B cryptic exon levels in brainstem of ALS patients have a positive correlation with age and (d) a negative correlation with disease duration. Further, TARDBP knockdown (KD) in human neural tissue cells differentiated from iPSC induced significant increase of the amount of ATG4B cryptic exon levels, as quantified by RT-qPCR (e), with a downregulation of ATG4B protein (f) evaluated by western blot and quantified by densitometry. Bars indicate mean values with standard error. For (g) *** p < 0.001 for disease type in a 2-way ANOVA accounting for disease type and region. In (e) and (f)**** p < 0.0001 and ** p < 0.001 after Student’s t test (e) or post hoc Bonferroni analyses (f). AUC, area under the curve.
To demonstrate if TARDBP function is relevant in maintenance of ATG4B mRNA we downregulated TARDB in human nervous tissue cells. The results demonstrate that TARDBP downregulation increased the amount of cryptic exons to up 20% of ATG4B mRNA ()) and causes a loss of 30% of ATG4B protein ()). Nonsense-mediated decay of aberrant ATG4B mRNA may explain the hereby observed loss of ATG4B in human cells. The fact that this mRNA anomaly would target mainly motor neurons – a quantitatively minor cell population in these tissues – could account for the low percentage of mRNA affected and the apparent lack of quantitative differences of ATG4B protein in nervous tissue samples observed (data not shown). Of note, sequence analyses suggest that loss of function of TARDBP on ATG4B cryptic exon introduces a premature stop codon leading to loss of residues 317–393 in the resulting protein. Because these residues contain 2 phosphorylation sites required for ATG4B protein activity [Citation2], their loss induced by cryptic exon inclusion may result in defective autophagy.
To test if TARDBP function in splicing is relevant in ATG4B major cellular function (macroautophagy/autophagy) we downregulated TARDBP expression in HeLa cells. Results showed that TARDBP is required for maintaining the expression of ATG4B, as loss of TARDBP leads to an approximately 50% loss of ATG4B mRNA ()) and protein ()) in HeLa cells, in association with the presence of cryptic exons in 38% of ATG4B mRNA ()). TARDBP is required to orchestrate a physiological autophagy response, as reinforced by the failure of TARDBP-deficient cells to increase ATG4B mRNA in cases of autophagy induction ()); TARDBP-deficient HeLa cells also exhibited increased baseline levels of SQSTM1 ()), a hallmark of autophagy disturbance [Citation3].
Figure 2. TARDBP is required for a homeostatic autophagy response. (a) TARDBP knockdown (KD) in HeLa cells leads to decreased ATG4B mRNA levels (left panel) linked to increased amounts of ATG4B mRNA with cryptic exons (right panel); this is associated with a failure to enhance ATG4B mRNA expression as a response to autophagy stimulation by nutrient deprivation. (b) TARDBP protein loss is associated with ATG4B decrease as shown by western blot (left panel) and densitometry (right panel). (c) Functional analyses reveal that loss of TARDBP in HeLa cells induces increased levels of SQSTM1 as shown by western blot (left panel) and immunofluorescence (right panel), suggesting a functional loss of autophagy flux. (d) The increase in SQSTM1 induced by TARDBP knockdown is rescued by ATG4B overexpression, as shown by densitometry analyses, either in HeLa cells (left panel) or in Human Neural Tissue primary cells (right panel). Blots are representative of different experiments (n = 3–5). Bars indicate mean values (± standard error). For (a), (b) and (c) **** p < 0.0001, ***p < 0.001 after 2-way ANOVA. For (d) *p < 0.05 and **p < 0.01 in Student’s t test.
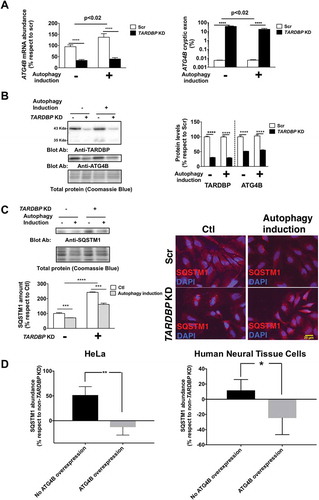
TARDBP deficiency might affect autophagy by other mechanisms, besides ATG4B downregulation, as it modifies the expression of transcripts of approximately 41 genes. However, ATG4B overexpression alone is sufficient to completely prevent the increase of SQSTM1 induced by TARDBP downregulation in HeLa and human neural tissue cells ()). Noteworthy, ATG4B loss was not compensated by increased expression of other ATG4B homologs (Figure S6, ESM). Previous data have shown that SQSTM1 interacts with TARDBP aggregates in ALS [Citation4]. Together, the present data point to a novel mechanism implicating autophagy as a relevant factor in the pathogenesis of sporadic ALS, in addition to the involvement of autophagy pathway components in familial ALS including ALS2, OPTN, and SIGMAR1 [Citation5].
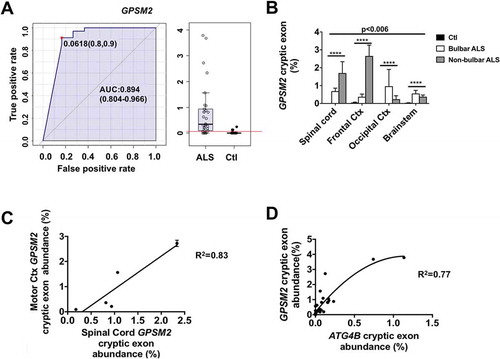
Besides ATG4B mRNA, other genes, such as GPSM2 (G protein signaling modulator 2) are also influenced by TARDBP dysfunction [Citation1]. We also designed a RT-qPCR method for analysis of cryptic exon inclusion in its mRNA. The results confirm that abundance of cryptic exons in GPSM2 mRNA could also be useful for ALS diagnosis (area under the curve of ROC for GPSM2 aberrant mRNA: 0.89, )). Levels of GPSM2 aberrant mRNA are significantly influenced both by brain region and ALS type (bulbar ALS vs non-bulbar ALS; 2-way ANOVA: p < 0.001 for interaction, p < 0.0001 for disease status and p = 0.0061 for brain region, )). Bulbar cases show higher levels of these mRNA in brain stem and occipital cortex, in comparison to spinal cord and frontal cortex, being opposite for non-bulbar cases. These results might be explained by spreading of the disease pathological traits (i.e., loss of TARDBP function) between adjacent anatomical locations, as indicated previously by neuroimaging techniques [Citation6]. Furthermore, levels of cryptic exons in GPSM2 in frontal cortex correlate with those in spinal cord ()). Interestingly, and supporting the involvement of the loss of this TARDBP function as a common mechanism for appearance of both cryptic exons, levels of aberrant mRNA in GPSM2 correlate with those in ATG4B mRNAs in every tissue evaluated ()).
Figure 3. GPSM2 cryptic exon abundance depends on disease type and region. Values of GPSM2 mRNA analyses (± standard error) indicate that (a) GPSM2 cryptic exon levels are higher in samples from ALS when compared with controls. (b) RT-qPCR of GPSM2 cryptic exons shows different expression levels in spinal cord, frontal cortex, occipital cortex, and brain stem. (c) Linear regression between the amount of cryptic exons in GPSM2 in lumbar spinal cord and motor cortex (Ctx). (d) Tissue concentrations of cryptic exons in ATG4B and GPSM2 correlate positively in a non-linear fashion. For (b), *** p < 0.001 and **** p < 0.0001 for disease type in a 2-way ANOVA accounting for disease type and anatomic region. AUC, area under the curve.
In conclusion, we show the usefulness of tissue RT-qPCR in searching for cryptic exons as a rapid method to analyze TARDBP function, with potential implications in ALS diagnosis. We recognize that the usefulness for ALS diagnoses, based on this preliminary study, should be further substantiated by employing a larger number of individuals. This is evidenced by the shape of the ROC curve indicated above, showing the impact of a relative low number of specimens analyzed. Nonetheless, the present findings demonstrate abnormal alternative splicing of ATG4B transcripts in ALS neural tissue in agreement with TARDBP loss of function, leading to impaired autophagy.
Materials and methods
Neuronal tissues
All samples were obtained from the Institute of Neuropathology and the University of Barcelona Brain Bank following the guidelines of the local ethics committees. Extensive pathological studies were done for ALS diagnosis as previously described [Citation7]. Samples from different anatomical locations were from 5 males and 3 females aged between 50 and 79 years affected with typical neurological and neuropathological characteristics of sporadic ALS. The post-mortem delay between death and tissue processing was between 3 and 16 h. Age- and gender-matched controls with no clinical evidence of neurological disease and with a normal neuropathological study were processed in parallel (see Table S1, Electronic Supplemental Material (ESM)).
Cell culture and treatments
HeLa cells were maintained in Dulbecco’s Modified Eagle’s Medium (Thermo Fisher Scientific, 11965), 10% FBS (Thermo Fisher Scientific, 10270), 100 U/ml penicillin-streptomycin (Thermo Fisher Scientific, 15140–122) at 37°C and 5% CO2. Human neural tissue cells were obtained from Axol (Axol Biosciences, ax0018). Briefly, iPSC-Derived Neural Stem Cells derived from integration-free, induced pluripotent stem cells under fully defined neural induction condition were expanded and differentiated following System A of the manufacturer’s protocol (version 5.0).
TARDBP knockdown cells were obtained by transducing cells with a TARDBP shRNA lentivirus (see below for further details). Cell media were changed the day after the transduction and the cells were cultured for further 96 h to allow TARDBP silencing.
For inducing autophagy by nutrient deprivation, cells were infected with scrambled or TARDBP shRNA as indicated above, and for the last 16 h after transduction the medium was replaced with complete fresh medium, as control, or HBSS (Thermo Fisher Scientific, 14025), for nutrient starvation.
ShRNA design
Primer was designed against the sequence 5′-GACGATGGTGTGACTGCAAAC-3′ for human TARDBP and cloned in the pSUPER (Oligoengine, pSUPER). Then, an EcoRI-ClaI fragment containing the H1 promoter for RNA polymerase III and the shRNA sequence was cut from pSUPER and subcloned into the pLVTHM plasmid, a gift from Didier Trono (Addgene, 12247) [Citation8]. shRNA vector, the plasmids psPAX2 (Addgene, 12260) and pMD2.G (Addgene, 12259) (both a gift from Dr. Trono) were transfected together using the polyethyleneimine transfection method (Sigma-Aldrich, 408727) into HEK293T cells. The HEK293T medium was collected after 48 h of transfection and centrifuged at 50,000 × g for 3 h. The final viral pellet was diluted in sterile phosphate-buffered saline (Thermo Fisher Scientific, 10010015) plus 2% bovine serum albumin (Sigma-Aldrich, A4503). The efficacy of the shRNA was demonstrated by western blot.
RNA extraction, cDNA synthesis, conventional PCR and quantitative RT-PCR (RT-qPCR)
RNA was extracted from cells and tissue samples using TRI Reagent (Thermo Fisher Scientific, AM9738) following the manufacturer’s instructions. RNA concentrations were measured using a NanoDrop ND-1000 (Thermo Fisher Scientific). One microgram of RNA was used for retrotranscription employing TaqMan Reverse Transcription Reagent using random hexamers (Thermo Fisher Scientific, N8080234).
Primers used to perform conventional PCR reaction were those previously described [Citation1], purchased from Roche Oligo synthesis service (Roche Diagnostics, Barcelona, Spain). For ATG4B forward: 5ʹ-TGTGTCTGGATGTGAGCGTG-3ʹ, reverse 5ʹ-TCTAGGGACAGGTTCAGGACG-3ʹ; for GPSM2 forward: 5ʹ-AGTGGACATGTGGTGGTAAGAA-3ʹ, reverse: 5ʹ-GCTTCAAAGAATGACACGCCA-3ʹ; for GAPDH (PCR control) forward: 5ʹ-ATCCCATCACCATCTTCCAG-3ʹ, reverse: 5ʹ-CCATCACGCCACAGTTTCC-3ʹ. PCR conditions were as follows: initial denaturation at 98ºC for 30 sec, followed by 40 cycles of 98ºC for 30 sec, 63ºC for 12 sec and 72ºC for 30 sec. Gel analyses demonstrated the presence of potential ATG4B and GPSM2 cryptic exons in samples from ALS patients (Figure S1, ESM), whose identity was ensured by Sanger sequencing (> 99% sequence homology, E value ranging between 1 and 3e-40) as shown in Figure S2 and Figure S3 (ESM).
In order to quantify the level of cryptic exons we developed a RT-qPCR method. Briefly, RT-qPCR experiments were performed using a CFX96 instrument (Bio-Rad) with SYBR Select Master Mix (Thermo Fisher Scientific, 4472908). Each 20 µL of reaction contained 4 µL cDNA, 10 µL SYBR Select Master Mix, 0.2 nM of forward primer and 0.2 nM of reverse primer solutions and 4 µL PCR grade water. Primers developed for mRNAs quantification by RT-qPCR are listed in Table S2 (ESM). Oligonucleotides for human GPSM2 and human ATG4B were designed with Primer3 [Citation9] (http://primer3.ut.ee). GAPDH oligo and ATG4B homologs have been previously described [Citation10,Citation11]. All oligonucleotides were purchased from Sigma-Aldrich. Three technical replicates for all RT-qPCR reactions were conducted. For all RT-qPCR primers, quality control was performed for their specificity, sensitivity, melting curves and standard curves as shown in Figure S4 and Figure S5 (ESM). The RT-qPCR run protocol was as follows: 50°C for 2 min and 95°C for 2 min, with the 95°C for 15 sec and 60°C for 1 min steps repeated for 40 cycles; and a melting curve test from 65°C to 95°C at a 0.1°C/sec measuring rate. Cryptic exon abundances were normalized by total mRNA for each gene with the following formula [Citation12]:
For total ATG4b mRNA relative expression, we used the formula as follows:
Western blot analysis
Protein from cells was extracted using radioimmunoprecipitation buffer with 1X Halt Protease Inhibitor Cocktail (Thermo Fisher Scientific, 1861278). After sonication, protein quantification was performed with the Bradford assay [Citation13] using a commercial reagent (Bio-Rad, 5000006). Fifteen micrograms of protein were loaded onto a 12% acrylamide SDS-PAGE gel. Membranes were blocked with I-Block (Thermo Fisher Scientific, T2015) for 1 h and incubated overnight with the antibodies and conditions listed in .
Table 1. Antibodies and conditions employed.
After primary antibody incubation, membranes were washed 3 times with TBS-T 0.05% (20 mM Tris, 125 mM NaCl, 0.05% TWEEN 20 [Sigma-Aldrich, P7949], pH 7.6) and incubated with secondary antibody for 1 h. Immobilon™ Western Chemiluminiscent HRP Substrate (Merck Millipore, WBKLS0500) was used for immunodetection. Membranes were stained with Coomassie Brilliant Blue G (Sigma-Aldrich, 27815) for normalization. Specific bands were quantified with ImageLab v5.2.1 (Bio-Rad).
ATG4B overexpression
HeLa or human neural tissue primary cells derived from iPSC were transfected after 72 h of transduction with shRNA or scrambled with Lipofectamine 2000 (Thermo Fisher, 11668) according to the manufacturer’s protocol. Briefly, 0.5 μl of Lipofectamine were used per 0.5 μg of ATG4B overexpression plasmid (Sino Biological Inc., HG20407-UT). Complexes were formed in 500 μl of Opti-MEM (Thermo Fisher, 31985070). The mixture was added to the cells grown in complete medium and collected after 24 h post-transfection.
Immunofluorescence
HeLa cells (10,000) were seeded in a 24-well plate onto glass coverslips. After 3 h of seeding, cells were transduced and treated as described above. Cells were washed twice with sterile PBS pH 7.4 (Thermo Fisher Scientific, 10010015) and fixed with 4% formaldehyde (Sigma-Aldrich, 252549) solution in PBS for 10 min at room temperature. After fixation, cells were washed twice with PBS, permeabilized and blocked with PBS containing 0.5% Triton X-100 (Sigma-Aldrich, X100) 10% normal goat serum (Abcam, ab7481) for 15 min followed by primary antibody incubation overnight at 4ºC. Cells thereafter were washed 2 times with PBS and incubated with secondary antibody and DAPI (Sigma-Aldrich, D9542) at 1 µg/ml for 1 h at room temperature and mounted with Fluoromount-G (Southern Biotech, 0100–01). Immunofluorescence controls, performed by omitting the primary antibodies, resulted in the abolition of the immunostaining in all cases.
Statistical analysis
All statistics and figures were performed with GraphPad Prism (GraphPad Software), unless indicated otherwise. For receiver operating characteristic (ROC) analyses, we employed the Metaboanalyst platform [Citation14]. Student’s t or 2-way ANOVA tests were used to analyze the differences between groups. Associations between variables were studied with non-linear and linear regression analyses. The 0.05 level was selected as the point of minimal statistical significance in every comparison.
1474311_SUPPLEMENTARY.zip
Download Zip (3.3 MB)Disclosure statement
No potential conflict of interest was reported by the authors.
Supplementary material
Supplemental data for this article can be accessed here.
Additional information
Funding
Related Research Data
References
- Ling JP, Pletnikova O, Troncoso JC, et al. TDP-43 repression of nonconserved cryptic exons is compromised in ALS-FTD. Science. 2015;80(349):650–655.
- Yang Z, Wilkie-Grantham RP, Yanagi T, et al. ATG4B (Autophagin-1) phosphorylation modulates autophagy. J Biol Chem. 2015;290:26549–26561.
- Bjørkøy G, Lamark T, Pankiv S, et al. Monitoring autophagic degradation of p62/SQSTM1. Methods Enzymol. 2009;452:191–197.
- Teyssou E, Takeda T, Lebon V, et al. Mutations in SQSTM1 encoding p62 in amyotrophic lateral sclerosis: genetics and neuropathology. Acta Neuropathol. 2013;125(4):511–522.
- Menzies FM, Fleming A, Rubinsztein DC. Compromised autophagy and neurodegenerative diseases. Nat Rev Neurosci. 2015;16:345–357.
- Van Weehaeghe D, Ceccarini J, Willekens SM, et al. Is there a glucose metabolic signature of spreading TDP-43 pathology in Amyotrophic Lateral Sclerosis? Q J Nucl Med Mol Imaging. 2017. DOI:10.23736/S1824-4785.17.03009-6
- Ilieva EV, Ayala V, Jové M, et al. Oxidative and endoplasmic reticulum stress interplay in sporadic amyotrophic lateral sclerosis. Brain. 2007;130(Pt 12):3111–3123.
- Wiznerowicz M, Trono D. Conditional suppression of cellular genes: lentivirus vector-mediated drug-inducible RNA interference. J Virol. 2003;77(16):8957–8961.
- Untergasser A, Cutcutache I, Koressaar T, et al. Primer3 - new capabilities and interfaces. Nucleic Acids Res. 2012;40(15):e115.
- Romani C, Calza S, Todeschini P, et al. Identification of optimal reference genes for gene expression normalization in a wide cohort of endometrioid endometrial carcinoma tissues. PLoS ONE. 2014;9(12):e113781.
- Pan B, Chen Y, Song H, et al. Mir-24-3p downregulation contributes to VP16-DDP resistance in small-cell lung cancer by targeting ATG4A. Oncotarget. 2015;6(1):317–331.
- Pfaffl MW. A new mathematical model for relative quantification in real-time RT-PCR. Nucleic Acids Res. 2001;29(9):e45.
- Bradford MM. A rapid and sensitive method for the quantitation of microgram quantities of protein utilizing the principle of protein-dye binding. Anal Biochem. 1976;72:248–254.
- Xia J, Wishart DS. Using metaboanalyst 3.0 for comprehensive metabolomics data analysis. Curr Protoc Bioinform. 2016;55:14.10.1–14.10.91.