
ABSTRACT
Macroautophagy/autophagy is a conserved transport pathway where targeted structures are sequestered by phagophores, which mature into autophagosomes, and then delivered into lysosomes for degradation. Autophagy is involved in the pathophysiology of numerous diseases and its modulation is beneficial for the outcome of numerous specific diseases. Several lysosomal inhibitors such as bafilomycin A1 (BafA1), protease inhibitors and chloroquine (CQ), have been used interchangeably to block autophagy in in vitro experiments assuming that they all primarily block lysosomal degradation. Among them, only CQ and its derivate hydroxychloroquine (HCQ) are FDA-approved drugs and are thus currently the principal compounds used in clinical trials aimed to treat tumors through autophagy inhibition. However, the precise mechanism of how CQ blocks autophagy remains to be firmly demonstrated. In this study, we focus on how CQ inhibits autophagy and directly compare its effects to those of BafA1. We show that CQ mainly inhibits autophagy by impairing autophagosome fusion with lysosomes rather than by affecting the acidity and/or degradative activity of this organelle. Furthermore, CQ induces an autophagy-independent severe disorganization of the Golgi and endo-lysosomal systems, which might contribute to the fusion impairment. Strikingly, HCQ-treated mice also show a Golgi disorganization in kidney and intestinal tissues. Altogether, our data reveal that CQ and HCQ are not bona fide surrogates for other types of late stage lysosomal inhibitors for in vivo experiments. Moreover, the multiple cellular alterations caused by CQ and HCQ call for caution when interpreting results obtained by blocking autophagy with this drug.
Introduction
Autophagy is an evolutionarily conserved transport pathway crucial to maintain cellular homeostasis through the sequestration, delivery and degradation of unwanted proteins, macromolecular complexes and organelles into lysosomes [Citation1–Citation3]. This process has been implicated in several pathologies, including cancer, lysosomal disorders, muscle dystrophies, neurodegeneration, and inflammatory diseases [Citation1,Citation4]. Autophagy is characterized by the formation of transient sequestering structures termed phagophores, which enwrap the cytoplasmic components destined for turnover and mature into double-membrane vesicles called autophagosomes that fuse with lysosomes, allowing cargo degradation [Citation3,Citation5]. The biogenesis of an autophagosome is orchestrated by the so-called autophagy-related (ATG) proteins, which act in a hierarchical order to first generate the phagophore, and then expand it into an autophagosome [Citation6]. ATG proteins are divided in 5 functional clusters based on their molecular roles and interactions. The ULK complex, the ATG9A cycling system and the autophagy-specific class III phosphatidylinositol 3-kinase (PtdIns3K) complex are key in generating the phagophore upon induction of autophagy [Citation7]. PtdIns3K, in particular, generates the PtdIns3P (phosphatiylinositol-3-phosphate) on phagophore membranes, which is required to promote the binding of other ATG factors such as the WIPI proteins and ZFYVE1/DFCP1 [Citation8], but also some of the components of the 2 ubiquitin-like conjugation systems composing the 2 other functional clusters that are essential for expanding and closing the phagophore [Citation7]. Complete autophagosomes fuse with lysosomes to form autolysosomes through a process that is tightly regulated by SNARE proteins such as STX17 (syntaxin 17) and SNAP29, RAB GTPases, tethering complexes such as the HOPS, and other factors [Citation9,Citation10].
Autophagy is a highly dynamic pathway and therefore steady-state measurements, such as assessment of expression levels of autophagy marker proteins including MAP1LC3/LC3 (microtubule associated protein 1 light chain 3) and SQSTM1/p62 are inconclusive [Citation11]. The turnover of these proteins has to be artificially blocked in order to accurately quantify the amplitude of the autophagic flux [Citation11]. Although the knockdown of proteins involved in the fusion between autophagosomes and lysosomes such as STX17 could be used at least in cell culture experiments, pharmacological inhibition is more kinetically controllable, and is the most frequently employed strategy for both in vitro and in vivo studies. The most widely employed chemicals that inhibit the last stage of autophagy are chloroquine (CQ), bafilomycin A1 (BafA1), and lysosomal protease inhibitor cocktails [Citation11]. Whereas the mode of action of both BafA1 and lysosomal protease inhibitors is well established, that of CQ remains largely unknown. CQ was originally discovered and used to treat malaria, and subsequently inflammatory diseases [Citation12,Citation13]. CQ is a weak base and therefore it can raise the pH of cellular compartments. This has led to the assumption that CQ blocks the autophagic flux through the same mechanism as BafA1, which increases lysosomal pH and thus inhibits the activity of resident hydrolases [Citation14–Citation16]. It remains unclear, however, whether CQ is indeed interchangeable with BafA1 and protease inhibitors to block the last stage of autophagy.
The discovery that modulation of autophagy has the potential of delaying the onset of several pathologies, has led to the necessity to pharmacologically interfere with this pathway [Citation17]. Inhibition of autophagy in particular, appears to be beneficial to treat specific types of tumors, chronic obstructive pulmonary diseases, neonatal asphyxia and defined inflammatory diseases [Citation17]. Although novel compounds have been recently developed to specifically inhibit ATG components such as ULK1 and PIK3C3/VPS34 [Citation18–Citation21], these drugs do not exclusively affect autophagy and, more importantly, they are not yet licensed for clinical trials. As a result, CQ and hydroxychloroquine (HCQ), a derivative of CQ, remain the only autophagy inhibitors that are approved by the Food and Drug Administration (FDA) [Citation22]. Successful clinical trials have shown that CQ and especially HCQ, enhance the potential of combinatorial anti-cancer therapies by sensitizing the tumor cells (NCT00969306, https://clinicaltrials.gov/ct2/results?term=autophagy+and+cancer&Search=Apply&recrs=e&age_v=&gndr=&type=&rslt=), although it remains unclear whether this is due to autophagy inhibition [Citation23–Citation25].
In this study, we investigated whether CQ inhibits autophagy through the same mechanism as other lysosomal inhibitors, in particular BafA1, by using high-content immunofluorescence microscopy, electron microscopy and functional autophagy assays. Although highly upregulated by nutrient deprivation, autophagy proceeds at basal levels in almost all tissues, carrying out numerous housekeeping functions [Citation1]. Modulation of basal autophagy is especially relevant for clinical studies and therefore we investigated the effects of CQ and BafA1 under normal growth conditions. We found that CQ severely affects the endo-lysosomal system and the Golgi complex in vitro and in vivo, thereby probably impairing the basal autophagic flux by decreasing autophagosome-lysosome fusion, and not by inhibiting lysosomal degradation capacity as BafA1 does. Although treatments with both CQ and BafA1 ultimately cause a block of the autophagic flux, we show that the intracellular changes that are caused by these 2 compounds are profoundly different. As a result, the consequences for cells and tissues in in vitro and in in vivo studies as well, are greatly different. Our investigation thus shows that CQ is not a bona fide surrogate for BafA1 (or protease inhibitors), and this must be borne in mind when interpreting results and evaluating possible side effects in both in vivo studies and clinical trials.
Results
CQ affects the morphology of degradative compartments differently than other lysosomal inhibitors
Autophagy terminates with the degradation of the autophagosomal content in the lysosomes. In order to get more insight on the effect of CQ on these organelles, we analyzed the subcellular distribution of LAMP1, a marker protein for late endosomal compartments and lysosomes [Citation26,Citation27], by immunofluorescence microscopy. This analysis was performed under basal growing conditions in 2 different cell lines, i.e. U2OS (Figure 1, Figure S1) and HeLa (Figure S1) cells, to exclude cell-specific effects. We chose commonly used concentrations of CQ and BafA1, i.e. 100 µM and 100 nM, respectively, and exposed U2OS and HeLa cells to these compounds for 5 h before processing them for immunofluorescence microscopy () and S1(A)). Automated high-content quantification of the LAMP1 staining showed a slight increase in the area of LAMP1-positive structures in BafA1-treated U2OS and the same tendency in HeLa cells () and S1(A)). CQ treatment also tended to increase the area of LAMP1-positive structures, and this increase was more pronounced in both cell lines () and S1(A)).
Figure 1. Quantitative automated fluorescence microscopy analysis revealed significant major differences between BafA1 and CQ treatments on DGCs. U2OS cells were treated with the vector (ctrl/0 h), 100 µM CQ or 100 nM BafA1 for 5 h, or in a time course manner between 0 and 5 h, before processing for immunofluorescence microscopy. Images were acquired and analyzed automatically using the Cellomics Arrayscan. (A) Staining of the preparations with anti-LAMP1 antibodies. (B) Quantification of the LAMP1 puncta area per cell (arbitrary units) from the immunofluorescence images such as for the examples shown in panel A. (C) Cells treated for the indicated times, were incubated with LysoTracker Red for 1 h before being processed for fluorescence microscopy. (D) Quantification of the LAMP1 puncta area per cell (arbitrary units) from images such as the examples depicted in panel C. All data are presented relative to the control at 0 h (fold). Error bars represent standard deviations (SD) of 3 independent experiments. * or ** symbols indicate significant differences of p < 0.05 and p < 0.01, respectively. Scale bars: 20 µm.
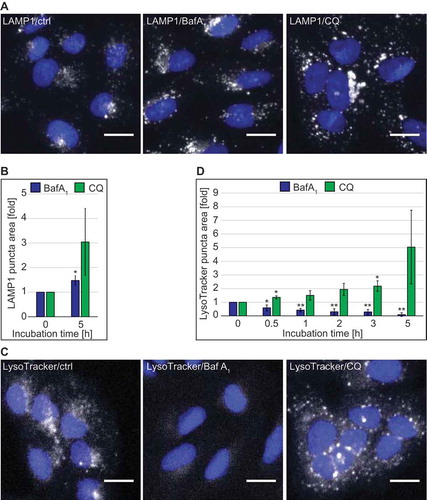
As both BafA1 and CQ are supposed to alter the lysosomal pH, we qualitatively assessed the acidity of lysosomes over time by fluorescence microscopy using the pH-sensitive lysosomal dye LysoTracker Red. As expected from an inhibitor of the vacuolar proton pump [Citation28], BafA1 treatment decreased the acidity of lysosomes as it led to a rapid decrease of LysoTracker Red puncta staining in both cell lines () and S1(B)). CQ, in contrast, did not decrease LysoTracker Red puncta staining over time in U2OS cells or after 5 h of treatment in HeLa cells. On the contrary and in agreement with the LAMP1 analysis () and S1(A)), the measured area of LysoTracker Red-positive structures tended to be much larger at the 5 h time point after CQ treatment compared to control or BafA1-treated cells () and S1(B)). The progressive increase of the puncta area over time indicates that the enlargement of LysoTracker Red-positive compartments emerges from a prolonged treatment with CQ ()).
Because there are discrepancies in the literature about whether or not CQ raises the lysosomal pH [Citation29,Citation30], and our data indicated that a concentration of 100 µM had no major effect () and S1(B)), we assessed the lysosomal acidity in U2OS cells exposed to increasing concentrations of CQ using the LysoTracker Red dye (Figure S1(C)). Surprisingly, LysoTracker Red-positive puncta were present in cells treated with CQ at concentrations ranging from 25 to 200 µM (Figure S1(C)), but also at concentrations of 400 and 800 µM when cells started to display clear signs of stress (data not shown). In contrast, BafA1 caused a decrease in the area of LysoTracker Red-positive puncta per cell at concentrations between 25 nM and 1.6 µM (data not shown, Figure S1(C)).
To determine whether these 2 compounds have the same effects on cellular degradative compartments (DGCs), we examined the morphology of cells treated with 100 µM CQ or 100 nM BafA1 for 5 h by electron microscopy (EM). Because CQ and BafA1 alter the autophagic flux, we first inspected autophagosomes in our electron microscopy preparations. We found that HeLa and U2OS cells exposed to these 2 compounds displayed an increased number of autophagosomes per cell section (Figure 2(A,B) and S2(A,B)). Next, we examined the DGCs, e.g. lysosomes, autolysosomes and amphisomes, which are all characterized by an amorphous electron-dense content. We decided to group these organelles in a single category because it is difficult to distinguish them, especially upon treatment with compounds interfering with lysosomal degradation [Citation31,Citation32]. Although late endosomes also have degradative activity, we did not group them within DGCs because they are morphologically distinguishable.
We observed a major morphological difference between the 2 treatments. In BafA1-treated cells, cytoplasmic components could still be detected in the lumen of DGCs () and S2(C)), which indicates that BafA1 inhibits degradation within these organelles as expected. Furthermore, DGCs also increased in size especially in the U2OS cells compared to the control cells () and S3(A,E)). The DGCs of cells exposed to CQ, however, looked different. First, we did not observe intact cytoplasmic material within the DGCs in either U2OS or HeLa cells, but rather a condensed amorphous content similar to untreated cells () and S2(C,E)). Second, in 39% of U2OS cells and 65% of HeLa cells, we observed the additional presence of large vacuolar DGCs (i.e., vDGCs), which are characterized by a clear content and the presence of limited lumenal material () and S2(C,D), S3(A,B)). vDGCs were less frequently observed in HeLa cells exposed to shorter CQ treatment, i.e. 1 h or 2 h, compared to cells treated for 5 h with the same drug (data not shown). Furthermore, immuno-electron microscopy (IEM) analysis of cells exposed to CQ for 2 h showed that the content of LAMP2-labeled DGCs was condensed, confirming the result obtained with conventional EM. Moreover, IEM revealed that the larger structures positive for LAMP proteins that we observed by immunofluorescence microscopy, were clusters of DGCs and not the vDGCs that we observed after prolonged treatments (Figure S2(E)). This observation is in line with the LysoTracker Red analysis ()), which suggests the formation of large organelles was due to a gradual effect caused by prolonged CQ treatment and that vDGCs are not present at earlier time points.
Figure 2. Quantitative EM analysis highlights the morphological differences in the DGCs induced by CQ and BafA1. U2OS cells were treated with the vector (water; ctrl), 100 µM CQ or 100 nM BafA1 for 5 h, before processing for EM as described in Materials and Methods. (A) Representative images of the observed autophagosomes (AP). Scale bars: 250 nm. (B) Quantification of the number of AP per cell section. (C) Representative image of DGCs detected in the preparations. Enlargements of the insets highlighted with a white square in the image on left row, are shown in the right row. Arrow highlights DGCs. Scale bar: 1 µm. (D) Statistical evaluation of the number of DGCs per cell section, which were subdivided in regular (DGCs, i.e. lysosomes, amphisomes and autolysosomes) and large vacuolar DGCs (vDGCs). EM preparations were quantified as described in Materials and Methods. M, mitochondria; ER, endoplasmic reticulum; N, nucleus; PM, plasma membrane; DGCs, regular degradative compartments; vDGCs, vacuolar degradative compartments.
Because of this major difference in the impact of these 2 compounds on DGCs, we repeated the ultrastructural analysis in cells exposed to another lysosomal inhibitor, i.e. a cocktail of lysosomal protease inhibitors composed of E64, pepstatin and leupeptin [11]. DGCs in U2OS and HeLa cells treated with this mixture looked very similar to the ones treated with BafA1 (Figure S2(C,D), S3(A–D)). We concluded that CQ has a completely different impact on DGCs when comparing it to compounds known for direct inhibition of the degradative capacity of these organelles.
Altogether, these data revealed that BafA1 and CQ have profoundly different effects on the morphology and the acidity of DGCs.
CQ disorganizes the Golgi complex and the endo-lysosomal system in vitro and in vivo
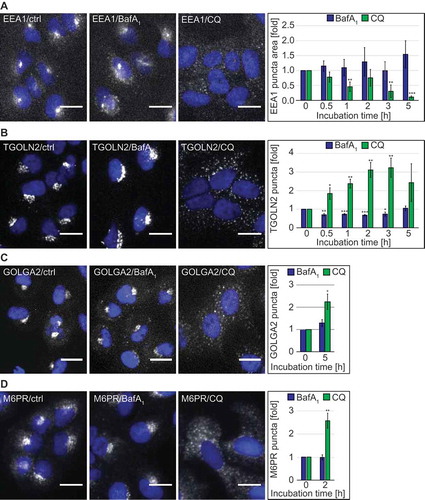
CQ can affect functions of the endo-lysosomal system [Citation13,Citation33]. We thus explored the distribution of selected endo-lysosomal protein markers upon treatment with either 100 µM CQ or 100 nM BafA1 by immunofluorescence microscopy. Although its localization remained unaltered in the presence of BafA1, the early endosome peripheral membrane protein EEA1 [Citation34] changed its distribution, and its signals became fainter over time when cells were exposed to CQ (Figure 3(A) and S1(D)). TGOLN2/TGN46, a trans-Golgi network (TGN) marker protein [Citation35], also changed distribution over time in the presence of CQ, unlike that which was observed in untreated and BafA1-treated cells ()). In particular, CQ caused a redistribution of TGOLN2 puncta from perinuclear concentrations [Citation36] to puncta dispersed throughout the cytoplasm, resulting in an increase in the number of TGOLN2 puncta per cell ()). A similar change in the Golgi complex organization in CQ-treated cells was also observed when either the cis-Golgi marker protein GOLGA2/GM130 [Citation37] ()) or the ARCN1/delta subunit of the COPI coat complex involved in retrograde transport at the Golgi [Citation38] were analyzed (Figure S4(A)). Consistently, we found at the ultrastructural level that the Golgi complexes in CQ-treated cells were disorganized and many more vesicles could be observed in the proximal surrounding area (Figure S5(A,B), CQ panels). In contrast, BafA1 did not alter the Golgi stack organization but rather the morphology of the stacks themselves. The Golgi lumens were swollen in HeLa cells and less pronouncedly in U2OS cells compared to those in the control cells, something also observed to a lesser extent in CQ-treated cells. Therefore, we also examined the distribution of M6PR (mannose-6-phosphate receptor, cation dependent), a protein cycling between the TGN and endosomes [Citation39,Citation40]. In agreement with the other observations, M6PR changed distribution in the presence of CQ, becoming more dispersed in punctate structures, whereas BafA1 had no effect on the subcellular localization of this protein ()).
Figure 3. CQ but not BafA1, has a significant impact on the endolysosomal system and the Golgi complex. U2OS cells were exposed to the vector (ctrl/0 h), 100 µM CQ or 100 nM BafA1 for 5 h or in a time-course manner between 0 and 5 h, before processing for immunofluorescence microcopy, and being automatically imaged and analyzed. Subcellular distribution of EEA1 (A), TGOLN2 (B), GOLGA2 (C) and M6PR (D), which was quantified by determining either the puncta area per cell (arbitrary units) (A) or the number of puncta per cell (B-D). All data are presented relative to the control at 0 h (fold). Error bars represent SD of 3 (A and D), 5 (B) or 4 (C) independent experiments. Images of panels A, B and D were acquired using the Cellomics Arrayscan and those of panel C using the TissueFAXS. Symbols *, ** and *** indicate significant differences of p < 0.05, p < 0.01 and p < 0.001. Scale bars: 20 µm.
Because both drugs interfere with the autophagic flux, we were wondering whether the phenotypes observed in CQ-treated cells were due to an impairment of canonical autophagy. Thus, we depleted either ATG7 or ATG13 in U2OS cells (Figure S4(B)) before treating the cells with CQ or BafA1 and quantitatively assessing LAMP2-positive DGCs or the Golgi using TGOLN2 and GOLGA2 as marker proteins (Figure S4(C–E)). ATG7 or ATG13 depletion did not influence the alterations caused by CQ on LAMP2-positive DGCs or the Golgi organization. In fact, we still observed an enlargement of LAMP2-positive DGCs (Figure S4(C)) and the redistribution of GOLGA2 and TGOLN2 puncta from perinuclear concentrations to puncta dispersed throughout the cytoplasm, resulting in an increased number of TGOLN2 (Figure S4(D)) or GOLGA2 (Figure S4(E)) puncta per cell. This indicates that the effects of CQ on the endo-lysosomal system and the Golgi are independent from its effects on canonical autophagy.
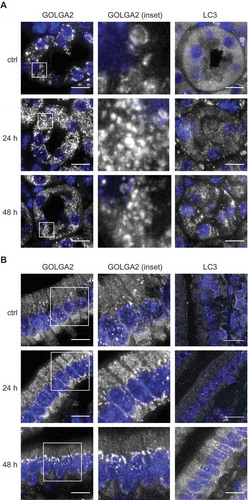
CQ and its derivate HCQ are frequently used in in vivo experiments to block autophagy and are currently being tested in clinical trials to treat specific cancers. Therefore, we explored whether the effects of CQ on the Golgi organization that we were observing in vitro could also be detected in vivo, in HCQ-treated mice. We first tested whether CQ and HCQ had the same capacity of blocking autophagy in mouse cells in vitro. To determine this, we treated mouse embryonic fibroblasts (MEFs) with different concentration of CQ and HCQ and measured SQSTM1 puncta accumulation. This experiment confirmed that both compounds block autophagy similarly in a concentration-dependent manner (Figure S6(A)). For the in vivo study, we therefore opted to use HCQ because it is predominantly used in clinical trials. To test the in vivo effect of HCQ on Golgi organization, we injected C57BL/6JOlaHsd mice daily with 60 mg/kg HCQ [Citation41] intraperitoneally and sacrificed 3 animals 24 h after the first injection (24 h) or 24 h after the second injection (48 h). The control group (ctrl) was injected with a saline solution. Subsequently, we stained sections obtained from the kidneys (Figure 4(A) and S6(B)) and the intestine () and S6(C)) with antibodies against GOLGA2 or LC3. Interestingly, we observed a change in the Golgi organization in kidney cells from a more tubular/ring-like conformation in control animals to a very punctate phenotype in all the HCQ-treated animals () and S6(B)). The Golgi staining of the intestinal cells in the control animals was predominantly perinuclear, with a triangular shape in the basal part of the cells (), ctrl). In the HCQ-treated animals we uncovered a change in this distinct Golgi organization, i.e. after 24 h we observed a shift in the Golgi staining towards the apical part of the cells and after 48 h of HCQ treatment, the perinuclear staining of the basal part of the cells almost completely disappeared () and S6(C)). Importantly, we could observe LC3 puncta accumulation in both kidney and intestinal tissues only after 48 h, which indicated that the effect of HCQ on the Golgi organization is more rapid than its effect on autophagy. These results confirm the effects of CQ/HCQ on the Golgi organization in vivo at least in intestine and kidneys. However, future studies are needed to determine the functional consequences of the ultrastructural alterations.
Figure 4. HCQ alters the Golgi organization in kidney and intestinal cells of treated mice. C57BL/6JOlaHsd mice were injected daily with 60 mg/kg HCQ or with saline solution (ctrl) and sacrificed 24 h after the first injection (24 h) or 24 h after the second injection (48 h). Representative images of kidney cells (A) and intestinal cells (B) stained for GOLGA2 and LC3 from one mouse are shown (images from the second and third mouse of the same groups are displayed in Figure S6). Scale bars: 10 µm.
Altogether, these results show that CQ and its derivate HCQ severely alter the organization of the Golgi and the endo-lysosomal system in vitro and in vivo in an autophagy-independent manner.
CQ affects endosomal trafficking differentially depending on the endocytosis pathway
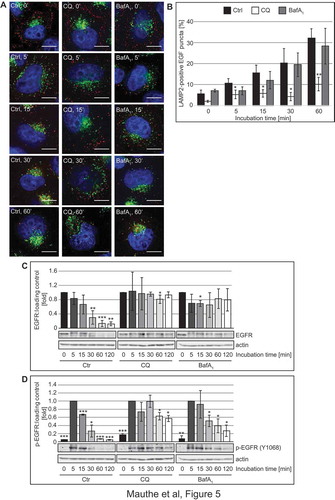
These observations prompted us to explore whether, in addition to altering its organization, CQ also affects the functionality of the endo-lysosomal system. In particular, we examined 2 forms of endocytosis: receptor-mediated endocytosis by measuring the trafficking and degradation of EGFR (epidermal growth factor receptor), and fluid phase endocytosis by visualizing and quantifying the uptake of BSA-TRITC (TRITC-conjugated bovine serum albumin) [Citation42]. To assess effects on receptor-mediated endocytosis, Hela cells were pre-treated with CQ or BafA1 for 2 h before we stimulated the cells with 50 ng/ml of Alexa Fluor 555-conjugated EGF for 0 to 60 min, and labeled DGCs with a LAMP2 antibody to visually examine the delivery of internalized EGFR to DGCs (Figure 5(A,B)). The LAMP2 and labeled EGF showed an increased degree of colocalization over time in control and BafA1-treated cells. Interestingly, the colocalization in CQ-treated cells remained significantly lower, indicating a reduction in the endocytic transfer of EGF to DGCs ()). To determine whether this results in an impairment of receptor degradation, we stimulated the cells with 50 ng/ml EGF for 0 to 120 min after 2 h of pre-treatment with CQ and BafA1, and examined EGFR levels by western blot ()). As expected, EGFR levels decreased over time in control cells. In CQ- and BafA1-treated cells, in contrast, EGFR degradation was blocked. In the same samples, we also observed that in all treatment conditions EGFR became phosphorylated at position Y1068, a major autophosphorylation site of activated EGFR [Citation43], upon EGF addition ()). Although autophosphorylated EGFR disappeared over time in control cells, the turnover of phosphorylated EGFR was slightly delayed in BafA1-treated cells and even more retarded in cells exposed to CQ ()), indicating that CQ treatment reduces EGFR degradation by impairing receptor-mediated endocytic transfer of this receptor to the DGCs and might thereby misregulate EGFR signaling.
Figure 5. CQ impairs endocytosis-mediated degradation of EGFR. (A-B) Hela cells were exposed to 100 µM CQ or 100 nM BafA1 for 2 h, or left untreated, before being incubated with 50 ng/ml of Alexa Fluor 555-conjugated EGF from 0 to 60 min. Cells were finally processed for immunofluorescence microscopy and stained with anti-LAMP2 antibodies (A). (B) Quantification of the colocalization between EGF-labeled EGFR and LAMP2 puncta in the experiment shown in panel A. (C-D) Hela cells were exposed to 100 µM CQ or 100 nM BafA1 for 2 h, or left untreated, before being incubated with 50 ng/ml EGF from 0 to 120 min. Cells were finally lysed and protein resolved by western blot and membranes were probed with anti- EGFR (C) or anti-phospho EGFR (Y1068) (D) and anti-tubulin or anti-actin antibodies. Signals were quantified and normalized to TUBA4A/tubulin or actin (arbitrary units). Samples in C and D were probed on the same gel, and therefore the actin bands in C and D are identical. Data in panel C are presented relative to the control at 0 min (fold) and data in panel D are presented relative to the control at 5 min (fold). Error bars represent the SD of 3 independent experiments. Symbols *, ** and *** indicate significant differences of p < 0.05, p < 0.01 and p < 0.001, with control cells at the same time point. Scale bars: 10 µm.
Next, we measured the cellular uptake of BSA-TRITC. Briefly, U2OS and HeLa cells were incubated with CQ or BafA1 for 2 h before adding BSA-TRITC for 30 min. After this initial pulse, cells were chased for 90 min in a medium without this fluorescent conjugate and processed for immunofluorescence microscopy using antibodies against the DGCs marker protein LAMP2 (Figures 6(A–C) and S7(A–C)) [Citation26,Citation27]. Quantifications revealed that endocytosed BSA-TRITC colocalized with LAMP2 in CQ- and BafA1-treated cells to the same extent as in control cells (), and S7(A,B)). Importantly, the enlarged LAMP2-positive structures observed in cells exposed to CQ were also positive for BSA-TRITC () and S7(A,C), arrows). These results revealed that CQ treatment influences endocytosis in a cargo- and endocytic route-dependent manner.
Figure 6. CQ does not impair endocytosis and endo-lysosomal trafficking of BSA but causes vacuolization of lysosomes. (A) U2OS cells were exposed to 100 µM CQ or 100 nM BafA1 for 2 h or left untreated, before being incubated with 375 nM BSA-TRITC (BSA-T) for 30 min. The cells were then washed and further incubated in the same medium with 100 µM CQ or 100 nM BafA1 and without BSA-TRITC for 90 min. Finally, cells were processed for immunofluorescence microscopy and stained with anti-LAMP2 antibodies. The white arrow indicates large BSA-TRITC-positive LAMP2 puncta. (B) Quantification of the colocalization between BSA-TRITC (BSA-T) and LAMP2 puncta in the experiment shown in panel A. (C) Determination of the average size of the BSA-TRITC (BSA-T)-, LAMP2- and BSA-TRITC/LAMP2 (coloc)-positive puncta (arbitrary units) in the experiment shown in panel A. (D) U2OS cells were incubated with 375 nM BSA-TRITC (BSA-T) for 30 min, washed and further incubated in medium without BSA-TRITC for 90 min before being exposed to 100 µM CQ or 100 nM BafA1 for 5 h, or left untreated. Cells were subsequently prepared for immunofluorescence microscopy and labeled with anti-LAMP2 antibodies. The white arrow indicates large BSA-TRITC-positive LAMP2 puncta. (E) Quantification of the colocalization between BSA-TRITC (BSA-T) and LAMP2 puncta in the experiment shown in panel D. (F) Determination of the average size of the BSA-TRITC (BSA-T)-, LAMP2- and BSA-TRITC/LAMP2 (coloc)-positive puncta (arbitrary units) in the experiment shown in panel D. All images were acquired using the DeltaVision microscope. Data in panels C and F are presented relative to the control (folds). Error bars represent SD of 3 independent experiments. Symbols * and ** indicate significant differences of p < 0.05 and p < 0.01, respectively. Scale bars: 10 µm.
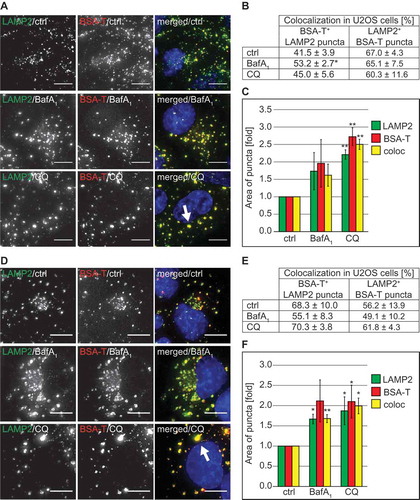
The result obtained from the BSA uptake experiment raised the question as to whether the large LAMP1- and LAMP2-positive DGCs that we observed forming upon CQ treatment are derived from either lysosomes or other compartments. To address this question, we pre-labeled lysosomes with BSA-TRITC in both U2OS () and HeLa (Figure S7(D–F)) cells by incubating them with this fluorescent conjugate for 30 min and then chasing it for 90 min. Subsequently, cells were exposed to CQ or BafA1 for 5 h, or left untreated before processing them for immunofluorescence microscopy with anti-LAMP2 antibodies. Untreated and BafA1-treated cells showed similar percentages of colocalization between BSA-TRITC and LAMP2 in both U2OS and HeLa cells (). An identical result was also obtained in cells exposed to CQ. Importantly, the measurement of the area of individual LAMP2- and BSA-TRITC-positive puncta, demonstrated that the large DGCs detected in CQ-treated cells are also positive for these 2 marker proteins (), arrow, 6(F), Figure S7(D), arrow, 7(F)).
Altogether, these results highlight that the large LAMP1- and LAMP2-positive DGC organelles are derived from lysosomes. Moreover, CQ does not impair all forms of endocytosis despite the prominent alterations that it is causing to the organization of the endo-lysosomal system.
CQ inhibits autophagosomal bulk degradation without affecting the lysosomal acidity
BafA1 and CQ are frequently used as lysosomal inhibitors to measure the autophagic flux [Citation11]. Because of the differences in lysosomal acidity and endo-lysosomal organization in CQ- and BafA1-treated cells, we wondered whether these 2 compounds block the autophagic flux through the same mechanism. Therefore, we analyzed basal autophagy progression for 5 and 24 h in the presence of CQ or BafA1 by first assessing LC3 conjugation to phosphatidylethanolamine (Figure 7(A)). The levels of this lipidated form of LC3, also known as LC3-II, are commonly used to monitor the amount of autophagosomes forming in the cell [Citation44]. Increased amounts of LC3-II, however, can correlate with either an induction of autophagy or a block at the late steps of this pathway, i.e. autophagosome fusion with lysosomes and/or lysosomal degradation [Citation11]. In our experiment, we also treated U2OS cells simultaneously with CQ and BafA1. The rationale behind this double treatment was that if these 2 compounds inhibit the autophagic flux through the same mechanisms, they would not have an additive effect. As shown in ) and as expected, CQ and BafA1 led to significantly higher levels of LC3-II compared to control cells and those levels increased over time. Importantly, BafA1 increased LC3-II levels more pronouncedly than CQ and the co-treatment with both compounds increased LC3-II cellular amounts similarly to those of cells exclusively exposed to BafA1.
Figure 7. CQ treatment inhibits the autophagic flux. U2OS cells were treated with 100 µM CQ or 100 nM BafA1 for 5 h or with 50 µM CQ and 100 nM BafA1, for 24 h (A), or with 100 µM CQ or 100 nM BafA1 for 2 h (B), individually or in combination; controls were untreated cells. Cells were finally lysed and protein resolved by western blot and membranes were probed with anti-LC3 and anti-TUBA4A/tubulin antibodies. Signals were quantified and normalized to TUBA4A/tubulin (a.u., arbitrary units). (C) U2OS cells were exposed to 100 nM BafA1, 100 µM CQ, 100 nM torin1 or 10 µM SAR-405 (SAR) for 2 h or 5 h, or to 20 nM BafA1, 50 µM CQ, 4 µM SAR-405 for 24 h, as indicated, before the LDH sequestration assay was performed as described in Materials and Methods. (D) The long-lived protein turnover assay was carried out in U2OS cells treated with 100 nM BafA1 and/or 100 µM CQ for 2 h and 5 h, or to 20 nM BafA1 and/or 50 µM CQ for 24 h, as indicated, and following the protocol described in Materials and Methods. Error bars represent SD of 3 (A, C and D) or 5 (B) independent experiments. When not otherwise indicated, the statistical significances were calculated to the controls for each time point in panel C and D. The symbols *, ** and *** indicate significant differences of p < 0.05, p < 0.01 and p < 0.001, respectively.
We also assessed the autophagic flux by examining the distribution of endogenous SQSTM1 (Figure S8(A,B)), a specific cargo protein of autophagosomes, which forms aggregates prior to transport [Citation11]. As observed for LC3-II, BafA1 treatment led to a pronounced accumulation of SQSTM1-positive aggregates that appeared as distinct puncta, in both U2OS and HeLa cells already after 5 h of treatment, whereas CQ only had a less pronounced effect after 5 h (Figure S8(A,B)). Upon prolonged treatment in U2OS cells for 24 h, the number of SQSTM1 puncta per cell increased significantly in CQ-treated cells to a level identical to the one of those exposed to BafA1. Co-treatment with both chemicals increased SQSTM1 accumulation further upon 5 h of treatment, whereas 24 h co-treatment did not further enhance SQSTM1 puncta accumulation (Figure S8(A)). In parallel, we also tested whether the acidity of DGCs changed in CQ-treated cells after 24 h, which could explain the significant increase in LC3 lipidation and SQSTM1 accumulation after prolonged treatments. However, we could still detect LysoTracker Red puncta after 24 h of CQ exposure (Figure S8(C)), indicating that the acidity of the DGCs did not substantially change over the course of this treatment.
Because we observed some differences in the autophagy marker response between CQ- and BafA1- treated cells that were more pronounced after 5 h compared to 24 h (), Figure S8(A)), we decided to examine the effects of both drugs on LC3 lipidation upon a shorter treatment (2 h). In this analysis, we also observed higher levels of LC3-II in cells exposed to either CQ or BafA1, and that the combination of the 2 drugs had an additive effect ()) Altogether, this set of experiments showed that BafA1 and CQ impair autophagy, but their effects on conventional autophagy protein markers are different, especially at the 2-h and 5-h time points, indicating that the primary inhibition mechanism on the autophagic flux may be different.
We thus decided to measure more directly the autophagic activity in cells treated with CQ and BafA1. LDH (lactate dehydrogenase) is a non-selective autophagosomal cargo and its sequestration by phagophores can be employed to measure autophagosome formation [Citation45–Citation47]. As expected, LDH sequestration strongly increased when cells were incubated with torin1 ()), a strong autophagy inducer [Citation48]. Importantly, the LDH sequestration assay revealed that BafA1 as well as CQ treatments for 5 and 24 h comparably increase LDH sequestration over time ()). Surprisingly, however, CQ led to a higher LDH sequestration compared to the control and BafA1-treated cells shortly upon addition ( and )), suggesting that brief CQ treatments could stimulate autophagosome formation. Data that we obtained by analyzing the subcellular distribution of early autophagy protein markers such as ZFYVE1 and WIPI1 (data not shown), confirmed that CQ can stimulate an autophagic response shortly upon addition to cells as previously suggested [Citation29,Citation49]. Co-treatment with the PIK3C3 inhibitor SAR405 [Citation18] completely abolished LDH sequestration, showing that the measured sequestration was indeed mediated by autophagy ()). We also conducted a direct measurement for the autophagic flux, i.e. the long-lived protein degradation assay [Citation11,Citation47] ()). Importantly, this assay confirmed that CQ and BafA1 directly or indirectly inhibit autophagy-mediated lysosomal protein degradation because the long-lived proteins did not undergo substantial degradation in the presence of these drugs after both 5 and 24 h ()) [Citation47,Citation50] and no additional effect was observed when these 2 compounds were combined. Interestingly, the degree of inhibition of protein degradation by CQ was comparable to that of BafA1 also at the 2 h time point, showing that CQ impairs the autophagic flux even though it stimulates autophagosome biogenesis.
Altogether, our results revealed that although cell treatment with CQ or BafA1 leads to a complete block of the autophagic flux, CQ does not abolish lysosomal acidity and it affects autophagy marker proteins differently than BafA1, indicating that the autophagy inhibition mechanism of CQ is not identical with that of BafA1.
CQ blocks the autophagic flux by impairing autophagosome-lysosome fusion
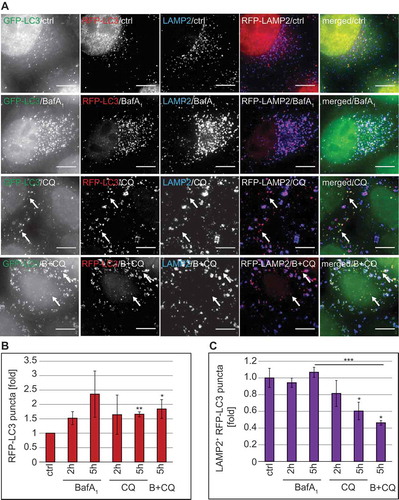
Because our data were indicating that the autophagy inhibition mechanism of CQ is not analogous to that of BafA1, we designed a series of specific experiments to identify which step of autophagy is inhibited by CQ. First, we exploited a HeLa cell line that stably expresses the mRFP-GFP-LC3 reporter construct, i.e. HeLa mRFP-GFP-LC3, which allows measuring the autophagic flux [Citation44,Citation51]. In particular, this probe makes it possible to distinguish autophagosomes (GFP- and RFP-positive LC3 puncta, which are thus yellow) from the more acidic autolysosomes (GFP-negative and RFP-positive LC3 puncta, which are thus red) (Figure S8(D)). As a result, fluorescence microscopy allows discriminating between blocks in the biogenesis of autophagosomes versus blocks in the fusion of these vesicles with acidic compartments such as lysosomes [Citation11]. We additionally stained cells for LAMP2 because BafA1 changes the acidity of lysosomes making it impossible to distinguish autophagosomes from autolysosomes as both are RFP- and GFP-positive in BafA1-treated cells (Figure 8(A) and S8(D)). Thus, inclusion of LAMP2 labeling allowed us to study the fusion events of autophagosomes and lysosomes even when the acidity of the lysosomes is altered.
As expected, CQ and also BafA1 treatment led to an increase in overall RFP-LC3 puncta ()). This pool of RFP-LC3 puncta comprises cytosolic autophagosomes as well as autolysosomes. To distinguish the population that is cytosolic from the one that is fused with lysosomes, we examined the colocalization of RFP-LC3 with LAMP2 ()). In BafA1-treated cells, we observed a percentage of RFP-LC3-positive autophagosomes fused with LAMP2-positive lysosomes similar to that of the control cells at both analyzed time points. In contrast, the percentage of RFP-LC3-positive autophagosomes that colocalized with LAMP2-positive lysosomes decreased over time in cells exposed to CQ ()), leading to a concomitant augmentation of the cytosolic amount of RFP-LC3-positive autophagosomes (), arrows). Moreover, the percentage of RFP-LC3-positive puncta colocalizing with LAMP2-positive lysosomes was significantly decreased by the addition of CQ to BafA1-treated cells ()), further underlining that CQ blocks the fusion of LC3-positive autophagosomes with lysosomes. Of note, we did not observe a GFP signal in the LAMP2-positive lysosomes of CQ-treated cells ()), confirming that the acidity of this organelle was not altered, as the GFP-signal of the fraction of autophagosomes that were still able to fuse with lysosomes was quenched. Together, these data show that CQ gradually impairs the fusion of LC3-positive autophagosomes with LAMP2-positive lysosomes without affecting the acidity of the latter.
Figure 8. CQ treatment inhibits autophagosome-lysosome fusion without losing lysosomal acidity. RFP-GFP-LC3 HeLa cells were treated with 100 µM CQ, 100 nM BafA1, or a combination of BafA1 and CQ (B+ CQ) for 5 h or left untreated (ctrl). Cells were subsequently prepared for immunofluorescence microscopy and stained with an anti-LAMP2 antibody. (A) Representative images are shown. Image stacks acquired with the DeltaVision microscope were analyzed using the Icy software and the number of all RFP-positive puncta (the LC3 populations in the cytoplasm and in the lysosomes) (B) and the percentage of LAMP2-positive RFP-LC3 puncta (i.e., the population of LC3 in the lysosomes) (C) was determined. Data in panels B and C are presented relative to the control (folds). Error bars represent SD of 3 independent experiments. The symbols *, ** and *** indicate significant differences of p < 0.05, p < 0.01 and p < 0.001, respectively. Scale bars: 10 µm.
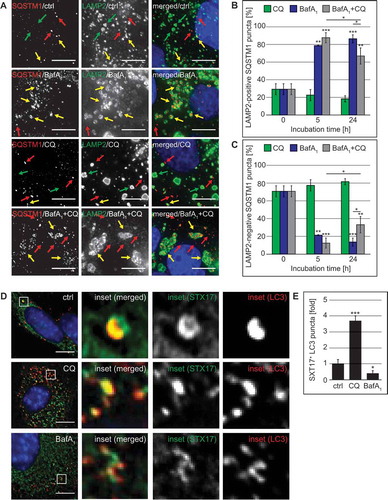
Because it has been shown that CQ promotes LC3 conjugation on endosomes [Citation29,Citation49] and we indeed observed that this compound severely affects and disorganizes components of the endo-lysosomal system (), 3(A), S1(D), 2(C–E)), we used SQSTM1 as an alternative autophagy marker protein to study the effects of CQ on the autophagic flux. We examined the subcellular distribution of SQSTM1 in U2OS cells also labeled for LAMP2, to determine whether the SQSTM1 puncta were accumulating either in the LAMP2-decorated lysosomes (Figure 9(A), yellow arrows) or in the cytoplasm and autophagosomes, where they are not positive for LAMP2 (), red arrows). This analysis revealed that CQ did not increase the percentage of SQSTM1 puncta positive for LAMP2 ()). Consequently, most of the SQSTM1 puncta were negative for LAMP2 (), red arrows) and their percentage did not decrease over time ()), confirming that CQ impairs the fusion of autophagosomes (LAMP2-negative SQSTM1 puncta) with lysosomes.
Figure 9. CQ treatment blocks fusion of SQSTM1-positive autophagosomes with lysosomes and leads to the accumulation of STX17 puncta. (A-C) U2OS cells were treated with 100 µM CQ and 100 nM BafA1 for 5 h, or with 50 µM CQ and 100 nM BafA1 for 24 h, individually or in combination, or left untreated (ctrl/0 h). Cells were finally processed for fluorescence microscopy and simultaneously labeled with antibodies against SQSTM1 and LAMP2, and images were acquired using the DeltaVision microscope. (A) Representative images of the 24-h time point are shown. Green, red and yellow arrows highlight SQSTM1-negative LAMP2 puncta, LAMP2-negative SQSTM1 puncta and SQSTM1-positive LAMP2 puncta, respectively. (B) The percentage of SQSTM1 puncta that colocalize with LAMP2 puncta was determined. (C) The percentage of SQSTM1 puncta that do not colocalize with LAMP2 puncta was determined. (D-F) GFP-STX17 MEFs were treated with 100 µM CQ or 100 nM BafA1 for 5 h, or left untreated (ctrl). Cells were finally processed for fluorescence microscopy and labeled with antibodies against LC3, before acquiring images using the DeltaVision microscope. (D) Representative images and insets with a magnified area are shown. (E) The percentage of STX17 puncta that colocalize with LC3 puncta was determined and expressed relative to the control (fold). Error bars represent SD of 3 independent experiments. The symbols *, ** and *** indicate significant differences of p < 0.05, p < 0.01 and p < 0.001, respectively. Scale bars: 10 µm.
In contrast to CQ, BafA1 caused an almost complete colocalization between SQSTM1 and LAMP2 ()), highlighting again that this compound principally blocks the degradation in lysosomes. Interestingly, addition of CQ to the BafA1 treatment reduced the colocalization between SQSTM1 and LAMP2 at the 24-h time point (), 24 h) and therefore increased the cytoplasmic SQSTM1 significantly (), 24 h). To show that the SQSTM1 puncta that we observed in CQ-treated cells represented bona fide incorporations into LC3-positive autophagosomes, we determined the colocalization degree between LC3 and SQSTM1 puncta (Figure S8(E)). This analysis revealed that the majority of the SQSTM1 puncta (approximately 76%) in CQ-treated cells, were positive for LC3 and that this percentage of colocalization was not significantly different from control cells (Figure S8(E)). This result confirms that the SQSTM1 puncta that we observed in CQ-treated cells represent autophagosomes and also shows that CQ can act partially epistatically to BafA1 during long-term treatments.
Next, we looked at potential candidate proteins that, if misregulated, could lead to the fusion impairment observed in CQ-treated cells. First, we examined the localization of ATG9A because this transmembrane protein is transported through part of the secretory pathway, including the Golgi, and requires glycosylation for correct functioning [Citation52]. We observed that both CQ and BafA1 lead to an increase in the number of ATG9A puncta compared to control cells (Figure S9(A,B)), possibly due to the accumulation of autophagosomes. However, we did not observe a defect in the delivery of ATG9A to LC3-positive autophagosomes (Figure S9©).
Next, we investigated the 2 known autophagosomal SNARE proteins, STX17 and SNAP29 [Citation53], which are required for autophagosome-lysosome fusion and exclusively localize to complete autophagosomes but not autolysosomes [Citation54]. In addition to the increased number of autophagosomes in CQ-treated cells (, , , ), we observed a significant increase in the proportion of STX17-positive LC3 puncta in CQ-treated cells compared to control or BafA1-treated cells (). As expected, colocalization of STX17 and LC3 was significantly reduced in BafA1-treated cells because STX17 disengages from autophagosomes after fusion with lysosomes [Citation54]. In contrast, when we analyzed the localization of SNAP29, which forms a complex with STX17 [Citation53], we did not observe an increase in SNAP29 puncta nor an enhancement in its recruitment onto SQSTM1-positive autophagosomes (Figure S9(D–F)). These results indicate that CQ does not inhibit autophagosome-lysosome fusion by blocking the incorporation of STX17 onto LC3-positive structures, but instead may interfere with proper SNAP29 recruitment. Altogether, our results have revealed that CQ inhibits the fusion between autophagosomes and lysosomes progressively without substantially changing the lysosomal acidity.
Discussion
CQ, BafA1 and protease inhibitors are interchangeably used to block the late stages of autophagy in in vitro studies. Although the autophagy inhibition mechanism of both BafA1 and protease inhibitors is known, it is still unclear precisely how CQ blocks autophagy [Citation11]. Here, we compared the effects of CQ and BafA1 treatments on cellular morphology, autophagy progression and endo-lysosomal trafficking. We observed major differences in the acidity and morphological appearance of the content of the DGCs in cells exposed to BafA1 and CQ. While BafA1-treated cells displayed clear phenotypes associated with an inhibition of the degradation capacity of lysosomes such as the presence of intact cytoplasm in the lysosomal lumen and a loss of acidity, CQ-treated cells did not present a similar profile. In particular, the content of their DGCs looked very condensed, similar to the one observed in non-treated cells, suggesting that these DGCs still have the capacity of degrading the delivered material.
In line with these observations, we did not find a decrease in LysoTracker Red-positive puncta upon CQ treatment as previously shown [Citation29,Citation55–Citation57]. Our results and other recent studies [Citation30,Citation58,Citation59], indicate that CQ does not substantially decrease lysosomal acidity, and the lysosomes retain their capacity to degrade delivered material. Although we cannot exclude that CQ treatment has a different effect on lysosomal pH depending on the cell type, one has to be careful in interpreting signal intensities of LysoTracker Red. This dye has often been used to estimate lysosomal pH, but LysoTracker Red is not a pH sensor and the intensity of its fluorescence signal does not correlate with the lysosomal pH (https://tools.thermofisher.com/content/sfs/manuals/mp07525.pdf); it rather gives an estimation of the acidity by losing its fluorescence when the pH is > 6.5 [Citation60]. Therefore, part of the discrepancy on CQ effects on lysosomal pH might be attributed to how the pH was estimated. Moreover, CQ may induce a temporal elevation of lysosomal pH [Citation30,Citation61], which is of a transient nature and is followed by a stable, lasting re-acidification of the lysosomes [Citation30]. The kinetics of this transient phase may also differ from cell type to cell type.
Treatment with CQ and other lysosomotropic cationic drugs leads to the formation of large vacuole-like structures that are formed due to osmotic imbalance [Citation62]. We also observed these vacuolar structures, i.e. vDGCs, in cells exposed to CQ and our data suggest that they are derived from lysosomes. Furthermore, our EM analyses indicate that these vDGCs are not formed instantly upon CQ treatment but are rather a consequence of prolonged exposure to this compound that eventually leads to an imbalance of ion homeostasis, possibly causing water influx and swelling of the lysosomes [Citation62]. This water influx probably dilutes the lysosomal content and enzymes, i.e. the lumens appear to be deprived of proteins, but presumably their degradative capacity remains intact. In fact, early studies on the effect of CQ on the autophagy pathway showed that the proteolytic activity in isolated autophagic vesicles from cells treated with this compound, is even higher than in the control cells, underlying that the degradative capacity of the cells still remains intact especially upon short exposure times to CQ [Citation63,Citation64]. It is worth noting that our IEM analysis also indicate that part of the large lysosomal structures observed by fluorescence microscopy may represent clusters of DGCs suggesting that CQ could also influence the subcellular distribution of these organelles.
Although accumulation of autophagic vesicles in CQ-treated cells has already been observed in numerous early studies [Citation63–Citation68], it has remained unclear whether this phenomenon was due to an inhibition of fusion or a block in lysosomal degradation. Our detailed examination on the step of autophagy that is inhibited by CQ revealed that this compound blocks autophagosome-lysosome fusion and not degradation capacity of lysosomes as previously assumed [Citation11]. BafA1, in contrast, inhibits the degradation capacity of lysosomes by decreasing their acidity, but it can also impair fusion between autophagosomes and lysosomes [Citation69,Citation70] possibly by inhibiting the ATP2A/SERCA (ATPase sarcoplasmic/endoplasmic reticulum Ca2+ transporting) pump [Citation71]. Investigation of the 2 known autophagosomal SNARE proteins, STX17 and SNAP29 [Citation53], revealed that CQ allowed recruitment of STX17, but not SNAP29, onto autophagosomes. Alternatively, it might also be that CQ treatment leads to the accumulation of autophagosome recognition particles, which are distinct from autophagosomes and thereby could prevent proper delivery of STX17 onto these double-membrane vesicles [Citation72]. Such a scenario could explain the missing recruitment of SNAP29 to autophagosomes in CQ-treated cells. On the one hand, our observations confirm that CQ impairs autophagosome fusion with lysosomes. On the other hand, they also indicate that STX17 targeting might be dysregulated and this could, at least in part, be the cause of the autophagosome-lysosome fusion impairment detected in CQ-treated cells.
Another possible and not mutually exclusive scenario could be that the defect in this step of autophagy is indirectly due to the Golgi disorganization provoked by CQ, which we and others have observed [Citation73–Citation75]. The Golgi is crucial for example for glycosylation and therefore the proper activation of numerous proteins [Citation75–Citation78]. Although a direct functional link between Golgi and autophagosome-lysosome fusion has not been demonstrated so far, a few lines of evidence connect this organelle with the autophagy pathway. Therefore, we have examined the subcellular distribution of ATG9A, a core ATG protein that is glycosylated and is transported through part of the secretory pathway [Citation52]. Although we cannot rule out an alteration of its molecular function, we could not detect a defect of ATG9A transport to phagophore membranes. We did find, however, a redistribution of ARCN1/delta subunit of the COPI coat in CQ-treated cells. It has been shown that depletion of COPI coat subunits leads to defects in endosomal function and Golgi fragmentation, which in turn impairs the fusion between autophagosomes and compartments of the endo-lysosomal system [Citation79]. Therefore, it is plausible that the impact of CQ on some of the Golgi and the endosomal functions contribute to the impairment of the fusion between autophagosomes and lysosomes (Figure S10).
The difference in how BafA1 and CQ block the autophagic flux is also very likely leading to different side effects when applying these compounds for long periods because they will influence different cellular processes. On the one hand, BafA1 inhibits lysosomal degradation capacity and thereby negatively affects the amino acid efflux from the lysosomes, possibly disturbing MTOR signaling from this organelle [Citation80,Citation81], which in turn could affect a multitude of cellular pathways. On the other hand, CQ causes an accumulation of autophagosomes, which could lead to an enhanced signaling output from autophagosomal structures [Citation82,Citation83]. In this regard, it has recently been shown that the accumulation of autophagosomes in tumor cells can compromise cell viability [Citation84]. Interestingly, although CQ blocks the fusion of autophagosomes with lysosomes, it appears that it differentially affects endocytic routes. More specifically, we found that CQ impairs receptor-mediated endocytosis and consequently the lysosomal degradation of EGFR [Citation85] but it does not impair fluid phase endocytosis and endo-lysosomal routing of BSA [Citation86]. Therefore, CQ is not a general inhibitor of the endo-lysosomal pathway per se.
Based on our data and those from various other laboratories, it is evident that CQ blocks autophagic degradation and more precisely, the delivery of sequestered cargo to the lysosomes. Unlike BafA1 or protease inhibitors, however, this compound causes more pronounced cellular alterations in vitro [Citation65] and in vivo that cannot exclusively be attributed to lysosomal and/or autophagy inhibition (Figure S10). On the contrary, these cellular insults may for example be the cause of the initial autophagy stimulation ()).
CQ was recently shown to induce LC3 conjugation onto endosomal membranes [Citation49] and subsequently this event was attributed to the induction of a non-canonical form of autophagy upon short-term treatment. This non-canonical form of autophagy does not involve ATG13, ATG9A and PIK3C3/VPS34 [Citation29,Citation87]. We also found that CQ indeed stimulates a mild autophagic sequestration response for a short period, which is in line with early studies that showed a peak in autophagic vesicle appearance within the first 3 h of exposure to CQ [Citation9,Citation64,Citation67]. The initial autophagic response that we observed, however, is probably a canonical form of autophagy as it is SAR405-sensitive ()) and induces ATG9A puncta formation (Figure S9), rather than being the result of a non-canonical LC3 conjugation on endosomes [Citation29,Citation49]. We cannot exclude, however, that part of the cytoplasmic LC3 puncta that we detect might represent endosomes. Importantly, the measurement of long-lived protein turnover showed that the autophagic flux is also inhibited under the same conditions. The fact that CQ did not stimulate autophagic degradation at any time point over the course of the treatments makes it different from the other inducers of non-canonical autophagic pathways such as resveratrol or gossypol, which enhance autophagic turnover [Citation88]. Therefore, the initial autophagy induction triggered by CQ that we and others observed [Citation29,Citation49], could also be due to cellular stress that is caused by exposure to CQ rather than stimulating a specific non-canonical autophagic pathway [Citation89]. However, we cannot exclude differences between cell types used in the experiments, and additional studies are needed to decipher in detail the plethora of effects caused to cells by CQ.
The current clinical studies are aiming to determine whether autophagy inhibition has a beneficial role in tumor treatments [Citation13,Citation17,Citation23–Citation25]. Because CQ and HCQ are the only FDA-approved drugs inhibiting autophagy, these compounds have extensively been used to test whether the block of this pathway improves tumor treatments. Our study, however, underlines that although CQ and HCQ are indisputably impairing the autophagic flux, their use entails multiple side effects in vitro and in vivo, which include the disorganization of the Golgi and endo-lysosomal networks, and even a temporary induction of autophagic sequestration activity. Therefore, positive effects on tumor regression by treatments with CQ alone or in combination with other drugs that have been observed in some clinical trials (NCT00969306) [Citation24], might not always be associated with a block in autophagy [Citation23,Citation25]. Moreover, our data highlight that the interpretation of results from clinical trials but also from in vivo and in vitro studies in which CQ or HCQ has been used as an autophagy inhibitor, have to consider that this compound leads to an accumulation of autophagosomes rather than non-functional autolysosomes, and this has a different impact on cell physiology.
Materials and methods
Antibodies and reagents
The following primary antibodies were used: rabbit anti-LC3 (Novus Biologicals, NB600-1384), mouse anti-LC3 (Nanotools, 0231S0104), rabbit anti-LC3 (MBL international, PM036), rabbit COPI delta (a kind gift from Catherine Rabouille, Hubrecht Institute, Utrecht, The Netherlands), mouse anti-TUBA4A/tubulin (Sigma, T5168), rabbit anti-ATG13 (Sigma Aldrich, Sab4200100), rabbit anti-ATG7 (Cell Signaling Technology, 2631), rabbit anti-phospho-EGFR (Y1068; Cell Signaling Technology, 2234), mouse anti-actin (Merck, MAB1501), rabbit anti-EGFR (Santa Cruz Biotechnology, sc-03-G), guinea pig anti-SQSTM1/p62 (Progen, GP62-C) mouse anti-LAMP1 (BP Biosciences, 555798), mouse anti-LAMP2 (BD biosciences, 555803), mouse anti-EEA1 (BD biosciences, 610456), mouse anti-GOLGA2/GM130 (Abcam, ab52649), Armenian hamster anti-ATG9L1 (Abcam, ab71795), mouse anti-TGOLN2/TGN46 (SeroTec, AHP500) and mouse anti-M6PR (SeroTec, MCA4333). The following secondary antibodies from Invitrogen/Thermo Fisher Scientific were used for the visualization of the primary antibodies: Alexa Fluor 488-conjugated goat anti-mouse (A-11001) or chicken anti-rabbit (A-21441), Alexa Fluor 568-conjugated goat anti-mouse (A-11031) or goat anti-rabbit (A-11011), Alexa Fluor 647-conjugated goat anti-mouse (A-21235), Alexa Fluor 680-conjugated goat anti-mouse (A-21058) or goat anti-rabbit (A-21109). IRDYE 800-conjugated goat anti-mouse (Rockland, 610-132-121) and goat anti-Armenian hamster, FITC-conjugated (Jackson ImmunoResearch Laboratories, 127-095-099). Prolong with DAPI (P36931), LysoTracker Red (L7528) and BSA-TRITC (A23016) were from Invitrogen/Thermo Fisher Scientific. Hoechst33342 (B2261), pepstatin (P5318), leupeptin (L2884), E64d (E3132), chloroquine (C6628) and hydroxychloroquine (H0915) were from Sigma Aldrich, and bafilomycin A1 was from BioAustralis (BIA-B1012). Torin 1 was from RnD Systems (4247).
Cell lines and cell culture
U2OS (a kind gift from Ger Strous, University Medical Center Utrecht, The Netherlands), HeLa cells (a kind gift from Peter van der Sluijs, Utrecht University, The Netherlands), HeLa-RFP-GFP-LC3 cells (a kind gift from David C. Rubinsztein and Tamotsu Yoshimori, Osaka University, Japan) [Citation51], GFP-SNAP29- and GFP-STX17-expressing MEFs (a kind gift from N. Mizushima, University of Tokyo, Japan) [Citation53], and MEFs (a kind gift from I. Dikic, Goethe-Universität Frankfurt am Main, Germany) were cultured in Dulbecco’s Modified Eagle Medium (DMEM, Gibco, 31966-021) supplemented with 100 U/ml penicillin, 100 μg/ml streptomycin (Gibco, 15140-122) and 10% fetal calf serum, at 37°C in a 5% CO2 humidified atmosphere. The culture medium of the HeLa-RFP-GFP-LC3 cells was additionally supplemented with 0.6 µg/ml G418 (Gibco, 11811-031).
Mice
Four- to 8-week-old female C57BL/6JOlaHsd mice were purchased from Harlan Sprague Dawley Inc. (Indianapolis, IN, USA). The mice were maintained under conventional conditions and fed ad libitum with food pellets (RMH-B; Hope Farms, Woerden, The Netherlands) and water. 60 mg/kg HCQ (Sigma-Aldrich, H0915) [Citation41] was administered by daily intraperitoneal injections. The control group was injected with a saline solution. The mice were sacrificed 24 h after the first or the second HCQ injection. All experiments were approved and conducted in accordance with the Ethics Committee on animal testing of the University of Groningen.
Western-blot analyses
Cells grown in 6-well or 24-well plates were washed with phosphate-buffered saline (PBS; 0.137 M NaCl, 0.027 M KCl, 0.01 M Na2HPO4, 0.0018 M KH2PO4, pH 7.2)] and harvested in 100 µl of lysis buffer (50 mM Tris, pH 7.6, 150 mM NaCl, 1% Triton-X100 [Sigma-Aldrich, 93443], Complete protease inhibitor [Roche, 11836145001]). The lysates were incubated on ice for 30 min, vortexed and centrifuged at 14,000 g for 10 min at 4°C. The supernatants were collected and mixed with Laemmli loading buffer [Citation90]. Alternatively, cells were directly lysed in Laemmli loading buffer and sonicated for 1 min. Equal protein amounts were separated by SDS-PAGE and after standard western blot, proteins were detected using specific antibodies and the Odyssey Imaging System (LI-COR Biosciences, Lincoln, NE, USA). Densitometric values were determined and quantified on western blots at non-saturating exposures using the ImageJ software [Citation91], and normalized against the one of the tubulin loading control.
Long-lived protein degradation assay
The assay was carried out as previously described [Citation47] with minor modifications. U2OS cells were seeded in a 24-well plate in 0.5 ml culture medium supplemented with 0.1 µCi/ml [14C]-L-valine (Vitrax, VC 308) for 2 days. Unincorporated radioactivity was removed by washing each well with culture medium supplemented with 10 mM L-valine (Sigma Aldrich, V0500), and subsequently chased for 18–19 h in the absence or presence of the indicated treatments in culture medium supplemented with 10 mM L-valine. After washing, cells were incubated for an additional 2 or 5 h with the indicated compounds. Plates were cooled down on ice for 2 min before adding sequentially 50 µl of ice-cold PBS containing 2% BSA (Sigma-Aldrich, A9418), and 200 µl of ice-cold 25% trichloroacetic acid (TCA; Sigma Aldrich, T0699). After overnight shaking at 4°C, mixtures from each well were transferred into 1.5-ml microcentrifuge tubes and centrifuged at 5,000 g for 10 min at 4°C. The TCA-soluble fractions (i.e., supernatants) were transferred to scintillation tubes and mixed with 4 ml of Opti-Fluor (Perkin Elmer, 6013199) by rigorous vortexing. The TCA-insoluble fractions in the microcentrifuge tubes (i.e., pellets) and in the wells both were dissolved in 250 µl of 0.2 M KOH and combined, prior to being transferred into scintillation tubes and mixed with 4 ml Opti-Fluor by rigorous vortexing. Radioactivity in the TCA-soluble and -insoluble fractions was measured by liquid scintillation counting. The degradation rate for long-lived proteins was calculated as the percentage of radioactivity in the TCA-soluble fraction relative to the total radioactivity (i.e., TCA-soluble and -insoluble fractions), divided by the incubation time.
LDH sequestration assay
The assay was performed as previously described [Citation45,Citation47] with minor modifications. U2OS cells were harvested by trypsinization and resuspended in complete medium. After centrifugation, the supernatant was aspirated, and the cells were resuspended in 400 µl of 10% sucrose (Sigma-Aldrich, S9378). The plasma membrane of the cells was selectively disrupted using a custom-made electroporator (2000 V and 1.2 μF in a 1x1x5 cm electrode chamber), and then transferred to new microcentrifuge tubes containing 400 μl of ice-cold phosphate buffered sucrose (100 mM sodium monophosphate, 2 mM dithiothreitol [DTT], 2 mM EDTA, 1.75% sucrose, pH 7.5). Aliquots of these mixtures (100 µl) were transferred to new microcentrifuge tubes and stored overnight at −80°C to be used to measure the total amount of LDH in the individual samples. In parallel, 500 µl of the same mixture were also transferred to new microcentrifuge tubes and mixed with 900 μl ice-cold resuspension buffer (50 mM sodium monophosphate, pH 7.5, 1 mM EDTA, 1 mM DTT) supplemented with 0.5% BSA and 0.01% Tween 20 (Sigma-Aldrich, 93733), before centrifugation at 18,000 g for 45 min at 4°C. The supernatant was subsequently aspirated and pellets stored overnight at −80°C. The following day, the stored samples were resuspended in 400 µl of ice-cold resuspension buffer supplemented with Triton X-405 (Sigma Aldrich, X405) to a final concentration of 1% (vol:vol). The amount of LDH in each sample was quantified as the decline in NADH absorbance at 340 nM, using a multianalyzer (MaxMat PL-II, Erba Diagnostics, Mannheim, Germany). The enzymatic reaction was carried out in a buffer consisting of 65 mM imidazole, 0.6 mM pyruvate, 0.36 mM NADH, pH 7.5. LDH sequestration activity was calculated as percent of sedimentable LDH in experimentally treated cells minus percent sedimentable LDH in untreated control cells (background).
BSA uptake
U2OS or HeLa cells were seeded on glass coverslips in 24-well plates before being pulsed with 375 nM BSA-TRITC for 30 min, thoroughly washed and incubated with medium without BSA-TRITC for an additional 90 min. After this chasing time, cells were treated with 100 µM CQ or 100 nM BafA1 for 5 h before being prepared for LAMP2 detection by immunofluorescence. Alternatively, U2OS or HeLa cells were treated with 100 µM CQ or 100 nM BafA1 for 2 h before incubation with BSA-TRITC for 30 min. Again, the cells were thoroughly washed and chased in the presence of 100 µM CQ or 100 nM BafA1 for an additional 90 min before being prepared for LAMP2 detection by immunofluorescence.
EGFR degradation and trafficking
HeLa cells were seeded in 24-wells plates on glass coverslips for the EGFR trafficking or without coverslips for the EGFR degradation assay. The cells were treated with 100 µM CQ or 100 nM BafA1 for 2 h before being incubated for 0, 5, 15, 30, 60, or 120 min with 50 ng/ml EGF (Thermo Fisher scientific, E3477) or biotinylated EGF (Thermo Fisher scientific, E35350), complexed to Alexa Fluor 555 Streptavidin (Invitrogen/Thermo Fisher Scientific, S32355) for EGFR degradation and trafficking, respectively. After the incubation, cells were either lysed and analyzed by western-blot analysis to determine EGFR and phosphorylated EGFR levels or fixed, stained with anti-LAMP2 and analyzed for colocalization with labeled EGF.
Immunofluorescence and fluorescence microscopy
Cells were fixed with 3.7% paraformaldehyde (PFA; Sigma Aldrich, 441244) or 3.7% formaldehyde (Merck, 1040031000) or 100% methanol, washed and blocked with blocking buffer (PBS, 1% bovine serum albumin, 0.1% saponin [Sigma-Aldrich, S4521]). Primary and secondary antibodies were diluted in the blocking buffer and incubated for 1 h. Nuclei were stained with Hoechst33342 and DAPI during the incubation with the secondary antibody for automated image acquisition and fluorescence microscopy, respectively. Mouse kidneys and intestines were isolated and fixed with 4% formaldehyde and PFA, respectively, at room temperature overnight. The tissues were processed using a tissue processing machine (Leica TP 1200) before paraffin embedding. Paraffin sections (3 µm) were cut, deparaffinized, rehydrated and further heated in antigen retrieval buffer (10 mM citric acid monohydrate [Sigma-Aldrich, C7129], pH 6.0, 10 mM sodium citrate tribasic [Sigma-Aldrich, S4641]). The samples were blocked in PBS, 1% goat serum (Jackson Immuno Research Laboratories, 005–000-121), 0.4% Triton-X100 for 1 h prior to the primary antibody incubation in PBS, 0.1% Tween 20 overnight at 4°C. Nuclei were stained with Hoechst33342 during the incubation with the secondary antibody in the same buffer for 1 h. Fluorescence microscopy was performed at room temperature using the DeltaVision RT fluorescence microscope (Applied Precision Ltd., Issaquah, WA, USA) equipped with a CoolSNAP HQ camera (Photometrix, Kew, Australia). Images were generated by collecting a stack of 6 to 16 images with focal planes 0.30-μm apart, and subsequently deconvolved using the SoftWoRx software (Applied Precision Ltd.). Quantification of puncta number and size, and colocalization events of the acquired images was performed using the Icy software (http://icy.bioimageanalysis.org) using spot detector plugin or the ImageJ software.
siRna transfections
U2OS cells were transfected for 48 h with 20 nM of control siRNA (D-001810-01-05) or of siRNA targeting ATG13 (J-020765-12) or ATG7 (J-020112–08; all from Dharmacon) using 0.1 µl or 2 µl of Lipofectamine RNAiMAX (Thermo Fisher scientific, 13778150) for 96- or 6-well plate cultures, respectively, according to the manufacturer’s protocol.
Automated image acquisition
A Cellomics Arrayscan VTI HCS Reader (Thermo Fisher Scientific, Waltham, MA, USA) was used to acquire cell images in the Hoechst, FITC, TRITC and Texas Red filters using a the 20x lens for automated fluorescence signal acquisition. The Cellomics SpotDetector V4 algorithm was used to quantify the number and area of the detected puncta in cells stained for SQSTM1, LAMP1, LysoTracker Red, TGOLN2, M6PR and/or EEA1. The Hoechst channel was used to set the autofocus. LAMP1, SQSTM1, M6PR, TGOLN2 and EEA1 puncta were detected using the FITC filter and LysoTracker Red puncta were detected using the TexasRed filter. An equal fixed exposure time was automatically set for all the samples. The numbers of nuclei (valid object count), puncta per cell (spot per cell) and puncta area per cell (spot area per cell) were counted using this approach in each experiment. Alternatively, fluorescence images of cells were automatically acquired using a TissueFAXS (TissueGnostics, Vienna, Austria) that is based on a high-end fully motorized Zeiss AxioObserver Z1 microscope with a Zeiss-LD ‘Plan-Neofluar’ 20x/0.4 Corr Dry objective (Zeiss, Oberkochen, Germany). The following filters were used: DAPI for the imaging of the nuclei, GFP for the acquisition of the GOLGA2 and LAMP2 signals, Cy3 for the acquisition of the SQSTM1 signals and TexasRed for the imaging of the LysoTracker Red. The acquired images were analyzed using the TissueQuest fluorescence analysis software (TissueGnostics GmbH, Vienna, Austria) to determine the cell count (based on the nuclei staining). Quantification of the number of the imaged puncta, and the colocalization degree of LAMP2 with SQSTM1 was determined using the Icy software spot detector plugin.
Electron microscopy
For conventional EM analyses, U2OS and HeLa cell lines were treated for 1, 2 or 5 h with the indicated compounds before being fixed in 2% PFA and 2.5% glutaraldehyde in 0.1 M sodium cacodylate buffer (Sigma Aldrich, 20840-100G-F; pH 7.4) for 2 h at room temperature. Cells were subsequently embedded in Epon resin (for 25 ml: 12 g glycid ether [Serva, 21045.02], 8 g 2-dodecenysuccinic- acid anhydride [Serva, 20755.02], 5 g methylnadic anhydride [Serva, 29452.02], 560 µl N-Benzyldimethylamine [EMS 11400-25]) as previously described [Citation92]. Subsequently, 70-nm sections were obtained using an UC7 ultramicrotome (Leica Microsystems, Vienna, Austria) and stained with uranyl acetate and lead citrate [Citation92]. Cell sections were finally analyzed using an 80 kV CM100 transmission electron microscope (FEI, Eindhoven, The Netherlands). Statistical analysis of the number of structures of interest per cell profile was performed by randomly selecting and screening 100 cell sections from 2 independent grids.
For immuno-EM analyses, RFP-GFP-LC3 HeLa cells were treated for 2 h with 100 µM CQ and then fixed by adding an equal volume as the culture medium of 4% PFA and 0.4% glutaraldehyde (Merck, 1042390250) in 0.1 M phosphate buffer (19 mM NaH2PO4, 81 mM Na2HPO4, pH 7.4) for 20 min at room temperature. Cells were then post-fixed in 2% PFA:0.2% glutaraldehyde for 3 h also at room temperature before being embedded following the Tokuyasu procedure [Citation93]. Ultrathin cryo-sections were cut, labeled for LAMP2 and subsequently with 10 nm immuno-gold as previously described [Citation93]. Cell sections were also examined using the 80 kV CM100 transmission electron microscope.
Statistical analyses
Statistical significance was evaluated using the two-tailed heteroscedastic t-test before calculating the p-values. Individual data points from each independent experiment were used for the calculation of the significance. The number of independent experiments is indicated in each figure legend.
Abbreviation
| BafA1 | = | bafilomycin A1 |
| CQ: | = | chloroquine |
| DAPI: | = | 4ʹ,6-diamidino-2-phenylindole |
| EEA1: | = | early endosome antigen 1 |
| GOLGA2: | = | golgin A2 |
| HCQ: | = | hydroxychloroquine |
| LAMP: | = | lysosomal associated membrane protein; |
| M6PR: | = | mannose-6-phosphate receptor, cation dependent |
| MAP1LC3/LC3: | = | microtubule associated protein 1 light chain 3 |
| PI: | = | protease inhibitors |
| SQSTM1: | = | sequestosome 1 |
| TGOLN2: | = | trans-golgi network protein 2 |
Supplemental Material
Download Zip (167.2 MB)Acknowledgments
The authors are greatful to Per Seglen for his critical reading of the manuscript. The authors thank David Rubinsztein, Tamotsu Yoshimori, Noboru Mizushima, Ivan Dikic, Ger Strous and Peter van der Sluijs for cell lines and Ody Sibon, Sven van Ijzerdoorn and Catherine Rabouille for antibodies. The authors also thank Klaas Sjollema for assisting with the TissueFAXS microscope, Francesco Pinto and Wondwossen Yeshaw for discussing EGFR results and Lara Barazzuol for assisting with the mouse experiments. Microscopy analyses were performed at the Cell Screening Core of the University Medical Centre Utrecht and at the Microscopy & Imaging Centre of the University Medical Centre Groningen. F.R. is supported by ALW Open Program (822.02.014), DFG-NWO cooperation (DN82-303), SNF Sinergia (CRSII3_154421), ZonMW VICI (016.130.606) and Marie Skłodowska-Curie Cofund (713660) grants. X.Z. is supported by a Chinese Scholarship Council fellowship. N.E. is supported by the Norwegian Research Council (Grant 230686/F20), The Nansen foundation, and the Anders Jahre foundation. I.O. is a recipient of a FEBS long-term postdoctoral fellowship. F.R. and N.E. are part of Transautophagy COST Action CA15138. C. R. and R.C. are supported by the Dutch Cancer Society (RUG2013-5792). The authors declare no competing financial interests.
Disclosure statement
No potential conflict of interest was reported by the authors.
Supplementary material
Supplemental data for this article can be accessed here.
Additional information
Funding
Related Research Data
References
- Mizushima N, Levine B, Cuervo AM, et al. Autophagy fights disease through cellular self-digestion. Nature. 2008 Feb 28;451(7182):1069–1075. PubMed PMID: 18305538.
- Shintani T, Klionsky DJ. Autophagy in health and disease: a double-edged sword. Science. 2004 Nov 5;306(5698):990–995. PubMed PMID: 15528435.
- Levine B, Klionsky DJ. Development by self-digestion: molecular mechanisms and biological functions of autophagy. Dev Cell. 2004 Apr;6(4):463–477. PubMed PMID: 15068787.
- Levine B, Mizushima N, Virgin HW. Autophagy in immunity and inflammation. Nature. 2011 Jan 20;469(7330):323–335. PubMed PMID: 21248839.
- Kawamata T, Kamada Y, Kabeya Y, et al. Organization of the pre-autophagosomal structure responsible for autophagosome formation. Mol Biol Cell. 2008 May;19(5):2039–2050. PubMed PMID: 18287526.
- He C, Klionsky DJ. Regulation mechanisms and signaling pathways of autophagy. Annu Rev Genet. 2009;43:67–93. PubMed PMID: 19653858. .
- Yang Z, Klionsky DJ. Mammalian autophagy: core molecular machinery and signaling regulation. Curr Opin Cell Biol. 2010 Apr;22(2):124–131. PubMed PMID: 20034776. .
- Mari M, Tooze SA, Reggiori F. The puzzling origin of the autophagosomal membrane. F1000 Biol Rep. 2011;3:25. PubMed PMID: 22162728. .
- Reggiori F, Ungermann C. Autophagosome maturation and fusion. J Mol Biol. 2017 Feb 17;429(4):486–496. PubMed PMID: 28077293.
- Nakamura S, Yoshimori T. New insights into autophagosome-lysosome fusion. J Cell Sci. 2017 Apr 1;130(7):1209–1216. PubMed PMID: 28302910.
- Klionsky DJ, Abdelmohsen K, Abe A, et al. Guidelines for the use and interpretation of assays for monitoring autophagy (3rd edition). Autophagy. 2016;12(1):1–222. PubMed PMID: 26799652. .
- O’Neill PM, Bray PG, Hawley SR, et al. 4-Aminoquinolines–past, present, and future: a chemical perspective. Pharmacol Ther. 1998 Jan;77(1):29–58. PubMed PMID: 9500158.
- Al-Bari MA. Chloroquine analogues in drug discovery: new directions of uses, mechanisms of actions and toxic manifestations from malaria to multifarious diseases. J Antimicrob Chemother. 2015;70(6):1608–1621. PubMed PMID: 25693996. .
- Poole B, Ohkuma S. Effect of weak bases on the intralysosomal pH in mouse peritoneal macrophages. J Cell Biol. 1981 Sep;90(3):665–669. PubMed PMID: 6169733.
- Seglen PO, Grinde B, Solheim AE. Inhibition of the lysosomal pathway of protein degradation in isolated rat hepatocytes by ammonia, methylamine, chloroquine and leupeptin. Eur J Biochem. 1979 Apr 2;95(2):215–225. PubMed PMID: 456353.
- Mizushima N, Yoshimori T, Levine B. Methods in mammalian autophagy research. Cell. 2010 Feb 5;140(3):313–326. PubMed PMID: 20144757.
- Galluzzi L, Bravo-San Pedro JM, Levine B, et al. Pharmacological modulation of autophagy: therapeutic potential and persisting obstacles. Nat Rev Drug Discov. 2017 Jul;16(7):487–511. PubMed PMID: 28529316.
- Ronan B, Flamand O, Vescovi L, et al. A highly potent and selective Vps34 inhibitor alters vesicle trafficking and autophagy. Nat Chem Biol. 2014 Dec;10(12):1013–1019. PubMed PMID: 25326666.
- Bago R, Malik N, Munson MJ, et al. Characterization of VPS34-IN1, a selective inhibitor of Vps34, reveals that the phosphatidylinositol 3-phosphate-binding SGK3 protein kinase is a downstream target of class III phosphoinositide 3-kinase. Biochem J. 2014 Nov 1;463(3):413–427. PubMed PMID: 25177796.
- Egan DF, Chun MG, Vamos M, et al. Small molecule inhibition of the autophagy kinase ULK1 and identification of ULK1 substrates. Mol Cell. 2015 Jul 16;59(2):285–297. PubMed PMID: 26118643.
- Petherick KJ, Conway OJ, Mpamhanga C, et al. Pharmacological inhibition of ULK1 kinase blocks mammalian target of rapamycin (mTOR)-dependent autophagy. J Biol Chem. 2015 May 1;290(18):11376–11383. PubMed PMID: 25833948.
- Manic G, Obrist F, Kroemer G, et al. Chloroquine and hydroxychloroquine for cancer therapy. Mol Cell Oncol. 2014;1(1):e29911. PubMed PMID: 27308318. .
- Maycotte P, Aryal S, Cummings CT, et al. Chloroquine sensitizes breast cancer cells to chemotherapy independent of autophagy. Autophagy. 2012 Feb 1;8(2):200–212. PubMed PMID: 22252008.
- Cufi S, Vazquez-Martin A, Oliveras-Ferraros C, et al. The anti-malarial chloroquine overcomes primary resistance and restores sensitivity to trastuzumab in HER2-positive breast cancer. Sci Rep. 2013;3:2469. PubMed PMID: 23965851. .
- Eng CH, Wang Z, Tkach D, et al. Macroautophagy is dispensable for growth of KRAS mutant tumors and chloroquine efficacy. Proc Natl Acad Sci U S A. 2016 Jan 5;113(1):182–187. PubMed PMID: 26677873.
- Lewis V, Green SA, Marsh M, et al. Glycoproteins of the lysosomal membrane. J Cell Biol. 1985 Jun;100(6):1839–1847. PubMed PMID: 3922993.
- Chen JW, Murphy TL, Willingham MC, et al. Identification of two lysosomal membrane glycoproteins. J Cell Biol. 1985 Jul;101(1):85–95. PubMed PMID: 2409098.
- Bowman EJ, Siebers A, Altendorf K. Bafilomycins: a class of inhibitors of membrane ATPases from microorganisms, animal cells, and plant cells. Proc Natl Acad Sci U S A. 1988 Nov;85(21):7972–7976. PubMed PMID: 2973058.
- Jacquin E, Leclerc-Mercier S, Judon C, et al. Pharmacological modulators of autophagy activate a parallel noncanonical pathway driving unconventional LC3 lipidation. Autophagy. 2017 May 4;13(5):854–867. PubMed PMID: 28296541.
- Lu S, Sung T, Lin N, et al. Lysosomal adaptation: how cells respond to lysosomotropic compounds. PloS One. 2017;12(3):e0173771. PubMed PMID: 28301521. .
- Eskelinen EL. To be or not to be? Examples of incorrect identification of autophagic compartments in conventional transmission electron microscopy of mammalian cells. Autophagy. 2008 Feb;4(2):257–260. PubMed PMID: 17986849.
- Eskelinen EL, Kovacs AL. Double membranes vs. lipid bilayers, and their significance for correct identification of macroautophagic structures. Autophagy. 2011 Sep;7(9):931–932. PubMed PMID: 21642767.
- Brown WJ, Constantinescu E, Farquhar MG. Redistribution of mannose-6-phosphate receptors induced by tunicamycin and chloroquine. J Cell Biol. 1984 Jul;99(1 Pt 1):320–326. PubMed PMID: 6330128.
- Mu FT, Callaghan JM, Steele-Mortimer O, et al. EEA1, an early endosome-associated protein. EEA1 is a conserved alpha-helical peripheral membrane protein flanked by cysteine “fingers” and contains a calmodulin-binding IQ motif. J Biol Chem. 1995 Jun 2;270(22):13503–13511. PubMed PMID: 7768953.
- Luzio JP, Brake B, Banting G, et al. Identification, sequencing and expression of an integral membrane protein of the trans-Golgi network (TGN38). Biochem J. 1990 Aug 15;270(1):97–102. PubMed PMID: 2204342.
- Reaves B, Banting G. Perturbation of the morphology of the trans-Golgi network following Brefeldin A treatment: redistribution of a TGN-specific integral membrane protein, TGN38. J Cell Biol. 1992 Jan;116(1):85–94. PubMed PMID: 1730751.
- Nakamura N, Rabouille C, Watson R, et al. Characterization of a cis-Golgi matrix protein, GM130. J Cell Biol. 1995 Dec;131(6 Pt 2):1715–1726. PubMed PMID: 8557739.
- Serafini T, Stenbeck G, Brecht A, et al. A coat subunit of Golgi-derived non-clathrin-coated vesicles with homology to the clathrin-coated vesicle coat protein beta-adaptin. Nature. 1991 Jan 17;349(6306):215–220. PubMed PMID: 1898984.
- Dahms NM, Lobel P, Breitmeyer J, et al. 46 kd mannose 6-phosphate receptor: cloning, expression, and homology to the 215 kd mannose 6-phosphate receptor. Cell. 1987 Jul 17;50(2):181–192. PubMed PMID: 2954652.
- Klier HJ, von Figura K, Pohlmann R. Isolation and analysis of the human 46-kDa mannose 6-phosphate receptor gene. Eur J Biochem. 1991 Apr 10;197(1):23–28. PubMed PMID: 1849818.
- McAfee Q, Zhang Z, Samanta A, et al. Autophagy inhibitor Lys05 has single-agent antitumor activity and reproduces the phenotype of a genetic autophagy deficiency. Proc Natl Acad Sci U S A. 2012 May 22;109(21):8253–8258. PubMed PMID: 22566612.
- Rabinowitz S, Horstmann H, Gordon S, et al. Immunocytochemical characterization of the endocytic and phagolysosomal compartments in peritoneal macrophages. J Cell Biol. 1992 Jan;116(1):95–112. PubMed PMID: 1730752.
- Sorkin A, Helin K, Waters CM, et al. Multiple autophosphorylation sites of the epidermal growth factor receptor are essential for receptor kinase activity and internalization. Contrasting significance of tyrosine 992 in the native and truncated receptors. J Biol Chem. 1992 Apr 25;267(12):8672–8678. PubMed PMID: 1314835.
- Kabeya Y, Mizushima N, Ueno T, et al. LC3, a mammalian homologue of yeast Apg8p, is localized in autophagosome membranes after processing. EMBO J. 2000 Nov 1;19(21):5720–5728. PubMed PMID: 11060023.
- Luhr M, Szalai P, Saetre F, et al. A simple cargo sequestration assay for quantitative measurement of nonselective autophagy in cultured cells. Methods Enzymol. 2017;587:351–364. PubMed PMID: 28253965. .
- Kopitz J, Kisen GO, Gordon PB, et al. Nonselective autophagy of cytosolic enzymes by isolated rat hepatocytes. J Cell Biol. 1990 Sep;111(3):941–953. PubMed PMID: 2391370.
- Engedal N, Torgersen ML, Guldvik IJ, et al. Modulation of intracellular calcium homeostasis blocks autophagosome formation. Autophagy. 2013 Oct;9(10):1475–1490. PubMed PMID: 23970164.
- Thoreen CC, Kang SA, Chang JW, et al. An ATP-competitive mammalian target of rapamycin inhibitor reveals rapamycin-resistant functions of mTORC1. J Biol Chem. 2009 Mar 20;284(12):8023–8032. PubMed PMID: 19150980.
- Florey O, Gammoh N, Kim SE, et al. V-ATPase and osmotic imbalances activate endolysosomal LC3 lipidation. Autophagy. 2015;11(1):88–99. PubMed PMID: 25484071. .
- Kjos I, Borg Distefano M, Saetre F, et al. Rab7b modulates autophagic flux by interacting with Atg4B. EMBO Rep. 2017 Aug 23;18:1727–1739. PubMed PMID: 28835545.
- Kimura S, Noda T, Yoshimori T. Dissection of the autophagosome maturation process by a novel reporter protein, tandem fluorescent-tagged LC3. Autophagy. 2007 Sep-Oct;3(5):452–460. PubMed PMID: 17534139.
- Young AR, Chan EY, Hu XW, et al. Starvation and ULK1-dependent cycling of mammalian Atg9 between the TGN and endosomes. J Cell Sci. 2006 Sep 15;119(Pt 18):3888–3900. PubMed PMID: 16940348.
- Itakura E, Kishi-Itakura C, Mizushima N. The hairpin-type tail-anchored SNARE syntaxin 17 targets to autophagosomes for fusion with endosomes/lysosomes. Cell. 2012 Dec 7;151(6):1256–1269. PubMed PMID: 23217709.
- Tsuboyama K, Koyama-Honda I, Sakamaki Y, et al. The ATG conjugation systems are important for degradation of the inner autophagosomal membrane. Science. 2016 Nov 25;354(6315):1036–1041. PubMed PMID: 27885029.
- Zhou J, Tan SH, Nicolas V, et al. Activation of lysosomal function in the course of autophagy via mTORC1 suppression and autophagosome-lysosome fusion. Cell Res. 2013 Apr;23(4):508–523. PubMed PMID: 23337583.
- Baltazar GC, Guha S, Lu W, et al. Acidic nanoparticles are trafficked to lysosomes and restore an acidic lysosomal pH and degradative function to compromised ARPE-19 cells. PLoS One. 2012;7(12):e49635. PubMed PMID: 23272048. .
- Nadanaciva S, Lu S, Gebhard DF, et al. A high content screening assay for identifying lysosomotropic compounds. Toxicol In Vitro. 2011 Apr;25(3):715–723. PubMed PMID: 21184822.
- Yoon YH, Cho KS, Hwang JJ, et al. Induction of lysosomal dilatation, arrested autophagy, and cell death by chloroquine in cultured ARPE-19 cells. Invest Ophthalmol Vis Sci. 2010 Nov;51(11):6030–6037. PubMed PMID: 20574031.
- Chikte S, Panchal N, Warnes G. Use of LysoTracker dyes: a flow cytometric study of autophagy. Cytometry A. 2014 Feb;85(2):169–178. PubMed PMID: 23847175. .
- Duvvuri M, Gong Y, Chatterji D, et al. Weak base permeability characteristics influence the intracellular sequestration site in the multidrug-resistant human leukemic cell line HL-60. J Biol Chem. 2004 Jul 30;279(31):32367–32372. PubMed PMID: 15181006.
- Ohkuma S, Poole B. Fluorescence probe measurement of the intralysosomal pH in living cells and the perturbation of pH by various agents. Proc Natl Acad Sci U S A. 1978 Jul;75(7):3327–3331. PubMed PMID: 28524.
- Marceau F, Bawolak MT, Lodge R, et al. Cation trapping by cellular acidic compartments: beyond the concept of lysosomotropic drugs. Toxicol Appl Pharmacol. 2012 Feb 15;259(1):1–12. PubMed PMID: 22198553.
- Yucel-Lindberg T, Jansson H, Glaumann H. Proteolysis in isolated autophagic vacuoles from the rat pancreas. Effects of chloroquine administration. Virchows Arch B Cell Pathol Incl Mol Pathol. 1991;61(2):141–145. PubMed PMID: 1683722.
- Glaumann H, Ahlberg J, Berkenstam A, et al. Rapid isolation of rat liver secondary lysosomes–autophagic vacuoles–following chloroquine administration. Exp Cell Res. 1986 Mar;163(1):151–158. PubMed PMID: 3943558.
- Wisner-Gebhart AM, Brabec RK, Gray RH. Morphometric studies of chloroquine-induced changes in hepatocytic organelles in the rat. Exp Mol Pathol. 1980 Oct;33(2):144–152. PubMed PMID: 7418864.
- Kovacs J, Rez G. Quantitative aspects of cellular autophagocytosis. Morphometric and cell fractionation studies. Revis Biol Celular. 1989;20:63–78. PubMed PMID: 2700098.
- Kovacs J, Karpati AP. Regression of autophagic vacuoles in mouse pancreatic cells: a morphometric study of the effect of methylamine and chloroquine followed by cycloheximide treatment. Cell Biol Int Rep. 1989 Sep;13(9):805–811. PubMed PMID: 2805089.
- Kovacs AL, Seglen PO. Inhibition of hepatocytic protein degradation by inducers of autophagosome accumulation. Acta Biol Med Ger. 1982;41(1):125–130. PubMed PMID: 7113543.
- Yamamoto A, Tagawa Y, Yoshimori T, et al. Bafilomycin A1 prevents maturation of autophagic vacuoles by inhibiting fusion between autophagosomes and lysosomes in rat hepatoma cell line, H-4-II-E cells. Cell Struct Funct. 1998 Feb;23(1):33–42. PubMed PMID: 9639028.
- Jahreiss L, Menzies FM, Rubinsztein DC. The itinerary of autophagosomes: from peripheral formation to kiss-and-run fusion with lysosomes. Traffic. 2008 Apr;9(4):574–587. PubMed PMID: 18182013. .
- Mauvezin C, Nagy P, Juhasz G, et al. Autophagosome-lysosome fusion is independent of V-ATPase-mediated acidification. Nat Commun. 2015 May 11;6:7007. PubMed PMID: 25959678.
- Kumar S, Jain A, Farzam F, et al. Mechanism of Stx17 recruitment to autophagosomes via IRGM and mammalian Atg8 proteins. J Cell Biol. 2018 Mar;217(3):997–1013. PubMed PMID: 29420192.
- Rivinoja A, Hassinen A, Kokkonen N, et al. Elevated Golgi pH impairs terminal N-glycosylation by inducing mislocalization of Golgi glycosyltransferases. J Cell Physiol. 2009 Jul;220(1):144–154. PubMed PMID: 19277980.
- Chen PM, Gombart ZJ, Chen JW. Chloroquine treatment of ARPE-19 cells leads to lysosome dilation and intracellular lipid accumulation: possible implications of lysosomal dysfunction in macular degeneration. Cell Biosci. 2011 Mar 8;1(1):10. PubMed PMID: 21711726.
- Kellokumpu S, Sormunen R, Kellokumpu I. Abnormal glycosylation and altered Golgi structure in colorectal cancer: dependence on intra-Golgi pH. FEBS Lett. 2002 Apr 10;516(1–3):217–224. PubMed PMID: 11959136.
- Thorens B, Vassalli P. Chloroquine and ammonium chloride prevent terminal glycosylation of immunoglobulins in plasma cells without affecting secretion. Nature. 1986 Jun 5–11;321(6070):618–620. PubMed PMID: 3086747.
- Zhang X, Wang Y. Glycosylation quality control by the golgi structure. J Mol Biol. 2016 Aug 14;428(16):3183–3193. PubMed PMID: 26956395.
- Hassinen A, Pujol FM, Kokkonen N, et al. Functional organization of Golgi N- and O-glycosylation pathways involves pH-dependent complex formation that is impaired in cancer cells. J Biol Chem. 2011 Nov 4;286(44):38329–38340. PubMed PMID: 21911486.
- Razi M, Chan EY, Tooze SA. Early endosomes and endosomal coatomer are required for autophagy. J Cell Biol. 2009 Apr 20;185(2):305–321. PubMed PMID: 19364919.
- Zoncu R, Bar-Peled L, Efeyan A, et al. mTORC1 senses lysosomal amino acids through an inside-out mechanism that requires the vacuolar H(+)-ATPase. Science. 2011 Nov 4;334(6056):678–683. PubMed PMID: 22053050.
- Li M, Khambu B, Zhang H, et al. Suppression of lysosome function induces autophagy via a feedback down-regulation of MTOR complex 1 (MTORC1) activity. J Biol Chem. 2013 Dec 13;288(50):35769–35780. PubMed PMID: 24174532.
- Barrow-McGee R, Kishi N, Joffre C, et al. Beta 1-integrin-c-Met cooperation reveals an inside-in survival signalling on autophagy-related endomembranes. Nat Commun. 2016 Jun 23;7:11942. PubMed PMID: 27336951.
- Martinez-Lopez N, Athonvarangkul D, Mishall P, et al. Autophagy proteins regulate ERK phosphorylation. Nat Commun. 2013;4:2799. PubMed PMID: 24240988. .
- Button RW, Roberts SL, Willis TL, et al. Accumulation of autophagosomes confers cytotoxicity. J Biol Chem. 2017 Jul 3;292:13599–13614. PubMed PMID: 28673965.
- Carter RE, Sorkin A. Endocytosis of functional epidermal growth factor receptor-green fluorescent protein chimera. J Biol Chem. 1998 Dec 25;273(52):35000–35007. PubMed PMID: 9857032.
- Rote KV, Rechsteiner M. Degradation of microinjected proteins: effects of lysosomotropic agents and inhibitors of autophagy. J Cell Physiol. 1983 Jul;116(1):103–110. PubMed PMID: 6853609. .
- Martinez-Martin N, Maldonado P, Gasparrini F, et al. A switch from canonical to noncanonical autophagy shapes B cell responses. Science. 2017 Feb 10;355(6325):641–647. PubMed PMID: 28183981.
- Codogno P, Mehrpour M, Proikas-Cezanne T. Canonical and non-canonical autophagy: variations on a common theme of self-eating? Nat Rev Mol Cell Biol. 2011 Dec 14;13(1):7–12. PubMed PMID: 22166994.
- Galluzzi L, Baehrecke EH, Ballabio A, et al. Molecular definitions of autophagy and related processes. EMBO J. 2017 Jul 3;36(13):1811–1836. PubMed PMID: 28596378.
- Laemmli UK. Cleavage of structural proteins during the assembly of the head of bacteriophage T4. Nature. 1970 Aug 15;227(5259):680–685. PubMed PMID: 5432063.
- Schneider CA, Rasband WS, Eliceiri KW. NIH Image to ImageJ: 25 years of image analysis. Nat Methods. 2012 Jul;9(7):671–675. PubMed PMID: 22930834.
- Verheije MH, Raaben M, Mari M, et al. Mouse hepatitis coronavirus RNA replication depends on GBF1-mediated ARF1 activation. PLoS Pathog. 2008 Jun;4(6):e1000088. PubMed PMID: 18551169.
- Slot JW, Geuze HJ. Cryosectioning and immunolabeling. Nature Protoc. 2007;2(10):2480–2491. PubMed PMID: 17947990. .