
ABSTRACT
Macroautophagy/autophagy is an important catabolic process mediating cellular homeostasis and plays critical roles in cancer development. Whereas autophagy has been widely studied in various pathological models, little is known about the distribution, clinical significance and regulatory mechanism of this process in human hepatocellular carcinoma (HCC). In the present study, we found that tumor tissues exhibited significantly increased levels of autophagy compared with non-tumor tissues, and cancer cells with higher levels of autophagy were predominantly enriched in the invading edge regions of human HCC. Increased MAP1LC3B/LC3B expression in the invading edge regions was significantly correlated with a higher density of closely located monocytes, and TNF and IL1B derived from tumor-activated monocytes synergistically induced cancer cell autophagy in the invading edge regions of HCC. Monocyte-elicited autophagy induced the epithelial-mesenchymal transition (EMT) of cancer cells and promoted tumor metastasis by activating the NFKB-SNAI1 signaling pathway. Moreover, the increase of LC3B+ cancer cells in the invading edge areas was associated with high mortality and reduced survival of patients with HCC. These findings indicated that cancer cell autophagy is regulated by a collaborative interaction between tumor and immune cell components in distinct HCC microenvironments, thus allowing the inflammatory monocytes to be rerouted in a tumor-promoting direction.
Introduction
Autophagy is an intracellular degradative pathway that targets cytosolic components to lysosomes for degradation to maintain cellular homeostasis and supply metabolic substrates [Citation1–Citation4]. Autophagy cellular events follow distinct stages, and MAP1LC3/LC3 (microtubule associated protein 1 light chain 3) expression, or the LC3-II level, represents a principle autophagy marker [Citation5]. Induced by fasting, hypoxia, and various ‘stress’ conditions, the autophagy self-digestion process has emerged to serve adaptive roles in protecting organisms against diverse pathologies and thus represents a novel therapeutic target in different pathological models [Citation6–Citation9].
Autophagy is upregulated in various types of tumors but plays an opposite role in tumor progression [Citation10,Citation11]. On the one hand, autophagy maintains physiological homeostasis by ridding cells of superfluous or damaged organelles, misfolded proteins, and invading microorganisms, sustaining genome stability, and preventing chronic tissue damage and inflammation, thus prohibiting tumor initiation [Citation12,Citation13]. On the other hand, autophagy adapts cancer cells to metabolic stress and promotes their growth, survival, invasion, and metastasis [Citation14–Citation18]. Micro-environmental tissue contexts have been suggested to determine the outcome of tumor autophagy [Citation19], but the mechanisms underlying this phenomenon, especially in human tumors, have not been fully elucidated.
Human hepatocellular carcinoma (HCC) is the product of long-term co-evolution between cancer cells and their environmental components [Citation20–Citation28], and can often be anatomically classified into areas of cancer nest, invading edge, and peritumoral stroma [Citation29,Citation30]. While the invading edge area is highly angiogenic and facilitates invasion and metastasis of regional cancer cells [Citation31], the peritumoral stroma is enriched with inflammatory cells, especially monocytes [Citation32,Citation33]. Our previous study showed that monocytes in the peritumoral region of HCC mainly exhibit activated phenotypes [Citation32]. These activated monocytes attenuate the T-cell response by expressing CD274/B7-H1 but retain their proinflammatory properties to induce angiogenesis and tissue remodeling via inducing IL17A-producing cell expansion and neutrophil recruitment [Citation31,Citation34], thus rerouting the inflammatory response in a tumor-promoting direction [Citation33,Citation35,Citation36]. At present, it remains unclear as to if and how the inflammatory cells at the peritumoral stroma regulate the metastasis of cancer cells at the invading edge of human HCCs.
The present study showed that levels of autophagy were preferentially increased in cancer cells populating the invading edge of human HCC. Such an increase of autophagy was induced by TNF and IL1B derived from tumor-activated monocytes in the peritumoral stroma, and regulated the epithelial-mesenchymal transition (EMT) and cancer cell metastasis via the NFKB-SNAI1 signaling pathway.
Results
Preferential upregulation of autophagy in cancer cells at the invading edge facilitates disease progression of human HCC
To examine the levels of autophagy in human HCC tissues, we stained sections of tumor samples with an anti-LC3B (a marker for autophagy) antibody (Ab). Interestingly, the results showed that while the autophagy levels were indeed increased in tumors compared with non-tumor tissues, LC3B+ cancer cells were predominantly enriched at the invading edge areas of HCC (n = 5; p < 0.05; , Figure S1A and B). IHC staining results showed that, compared to those of the tumor nest, levels of the autophagy substrate SQSTM1/p62 were relatively weak at the invading edge region, where levels of LC3B expression were significantly upregulated (). Consistent with this finding, cancer cells positive for LC3B showed markedly lower expression of SQSTM1 at the invading edge region compared to their LC3B− counterparts in the tumor nest (n = 5; Figure S1C). To confirm the distinct pattern of autophagy on different tumor areas, we analyzed the expression of autophagy-related molecules from freshly isolated tumor tissues. As shown in , mRNA levels of ATG5, ATG7, LC3B, and protein levels of LC3B-II were significantly upregulated at the invading edge region compared to those in the tumor nest (n = 30 for ). In contrast, the protein levels of SQSTM1 were markedly lower in tissues from the invading edge than those from the tumor nest areas, while the mRNA levels showed no significant difference between these 2 groups (n = 30 for ).
Figure 1. Upregulated autophagy in cancer cells in the invading edge area facilitates the disease progression of human HCC. (a-b) Sections of paraffin-embedded hepatoma samples were stained with anti-human LC3B Ab or anti-human SQSTM1 Ab. The distribution of LC3B+ or SQSTM1+ cells in the peritumor, invading edge, and tumor nest regions of human HCC was determined by confocal microscopy (a) or IHC (b). The micrographs at higher magnification in A show the stained peritumor (1) and tumor nest (2). The proportion of LC3B+ cancer cells was also included in A (n = 5). (c) The mRNA levels of LC3B, SQSTM1, ATG5, and ATG7 from different areas of fresh human HCC tissues were analyzed by Q-PCR (n = 30). (d) The protein levels of LC3B and SQSTM1 from different areas of fresh human HCC tissues were analyzed by western blotting (n = 3). (e) Cumulative overall survival (OS) and recurrence (TR) curves of patients. Patients were divided into 2 groups according to median value of LC3B+ cell density in the invading edge or tumor nest regions (n = 95). Cumulative OS and TR were calculated using the Kaplan–Meier method and analyzed by the log-rank test. Red lines, high density; black lines, low density. The results shown in C are plotted against the mean value of LC3B expression in non-tumor regions of HCC and expressed as the means ± SEM. * P < 0.05, *** P < 0.001.
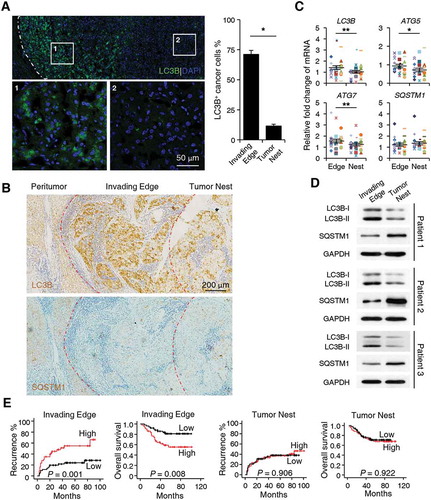
To explore the potential role of LC3B+ cancer cells in disease progression, we divided HCC patients who had received curative resection with follow-up data into 2 groups according to the median value of LC3B+ cell density at the invading edge or the tumor nest region. Whereas more LC3B+ cancer cells at the invading edge indicated worse patient survival (n = 95; p = 0.008 for overall survival [OS]; p = 0.001 for recurrence [TR]), the density of LC3B+ cancer cells in the tumor nest showed no correlation with either the OS or TR of HCC patients (). Moreover, the density of LC3B+ cancer cells at the invading edge was associated with intrahepatic metastasis (p = 0.006; ) and served as an independent prognostic factor for both the OS (p < 0.001) and TR (p = 0.001) of HCC patients (). The above results suggested that preferentially elevated autophagy in cancer cells located in the invading edge region facilitates the disease progression of human HCC.
Table 1. Association of peritumoral LC3B+ cells with clinicopathological characteristics.
Table 2. Univariate and multivariate analysis of factors associated with survival and recurrence.
Peritumoral monocytes elicit the upregulation of autophagy in cancer cells
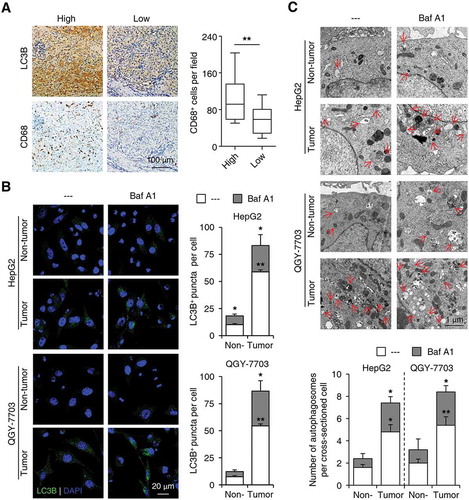
The invading edge region of human HCC is adjacent to peritumoral tissue, which contains abundant immune components, especially monocytes/macrophages [Citation32]. To investigate whether the preferentially elevated autophagy in cancer cells in the invading edge region was associated with nearby monocytes/macrophages, we stained human HCC sample sections with an anti-CD68 Ab (a marker for monocytes/macrophages) or an anti-LC3B Ab. Increased LC3B expression at the invading edge was significantly correlated with a higher density of CD68+ cells in the peritumoral regions of HCC (n = 30; p < 0.01; )). Such correlation was further confirmed by immunofluorescence double staining showing that a high density of CD68+ cells in the peritumoral regions were in close proximity to cancer cells with increased LC3B expression at the invading edge of HCC (Figure S2).
To examine the effect of monocytes/macrophages on cancer cell autophagy, we purified CD14+ cells from fresh human HCC tissues and incubated them with established hepatoma cells, HepG2 or QGY-7703. As shown in , compared with paired peripheral blood, CD14+ cells isolated from tumor tissues significantly upregulated the number of LC3B+ puncta in HepG2 and QGY-7703 cells, and treatment with bafilomycin A1 (Baf A1, a molecule that abolishes lysosome function and inhibits autophagosome degradation) further increased the LC3B puncta in both cell lines (n = 5; p < 0.05). Transmission electron microscopy analysis confirmed the induction of autophagosome formation in hepatoma cell lines treated with tumor-isolated CD14+ cells, as well as the enhancing effects of Baf A1 treatment (; n = 5; p < 0.05). These data indicated an increase of autophagy flux in monocyte-exposed cancer cells.
Figure 2. Peritumoral monocytes elicit the upregulation of autophagy in invading-edge-infiltrating cancer cells. (a) Sections of paraffin-embedded hepatoma samples were stained with the anti-CD68 or anti-LC3B Abs. Correlations between the densities of CD68+ and LC3B+ cells in the invading edge regions of HCC tissues were analyzed (n = 30). (b-c) CD14+ cells were purified from peripheral blood (non-tumor) or HCC tumor tissues and then incubated with established HepG2 or QGY-7703 hepatoma cells for 20 h, with or without a following treatment of Baf A1 (5 nM). The number of LC3B+ puncta in hepatoma cells was determined by immunofluorescence (b, n = 5), and autophagosomes in hepatoma cells were analyzed by transmission electron microscopy (c, n = 5). One out of 5 representative micrographs is shown in C, and the arrows indicate autophagosomes. The results shown in A-C are expressed as the means ± SEM. * P < 0.05, ** P < 0.01.
Soluble factors derived from tumor-activated monocytes induce cancer cell autophagy
To explore the mechanisms mediating the effects of monocytes/macrophages on cancer cell autophagy, we incubated normal blood monocytes with supernatants from HepG2 or QGY-7703 cells (TSN) to obtain tumor-associated monocytes with phenotypes similar to those isolated from fresh HCC tumor tissues [Citation34]. Consistent with the above results, incubation with TSN-treated monocytes resulted in an increase in LC3B+ puncta number in hepatoma cells compared with that seen in hepatoma cells incubated with control monocytes. The accumulation of LC3B+ puncta was further upregulated in monocyte-exposed hepatoma cells treated with Baf A1, and such effects could not be abrogated by the physical separation of the monocytes and cancer cells (n = 7; p < 0.01; )). Moreover, compared with supernatants from control monocytes (CCM), supernatants from the co-culture of monocytes and hepatoma cells (Co-CM) or monocytes pre-treated with TSN (TCM) induced an upregulation of LC3B+ puncta number in HepG2 and QGY-7703 cells, and Baf A1 treatment further enhanced such an increase in both hepatoma cells (). Consistently, a significant increase of LC3B-II and decrease of SQSTM1 expression were observed in hepatoma cells treated with Co-CM or TCM ().
Figure 3. Soluble factors derived from tumor-activated monocytes mediate the induction of cancer cell autophagy. Monocytes were purified from the blood of healthy donors. (a-b) Monocytes were pre-treated with HepG2 or QGY-7703 TSN for 2 h, washed, and then incubated for 20 h with HepG2 or QGY-7703 cells, respectively, in the presence or absence of Baf A1 (5 nM), and with or without physical separation of the monocytes and cancer cells. Numbers of LC3B+ puncta in hepatoma cells were determined by immunofluorescence; n = 7 and * for the Med group stands for significant difference in LC3+ puncta number between the BafA1-treated and untreated hepatoma cells. (c-e) HepG2 or QGY-7703 cells were left untreated (Med) or treated with supernatants from control monocytes (CCM), supernatants from the co-culture of monocytes and hepatoma cells (Co-CM), or supernatants from monocytes pre-treated with TSN (TCM), with or without a following treatment of Baf A1. The levels of LC3B and SQSTM1 in HepG2 or QGY-7703 cells after 20 h of incubation were determined by immunofluorescence (c) and western blotting (d, e). One out of 5 representative graphs is shown in C, D and E. The results shown in B are expressed as the means ± SEM. * P < 0.05, ** P < 0.01, *** P < 0.001.
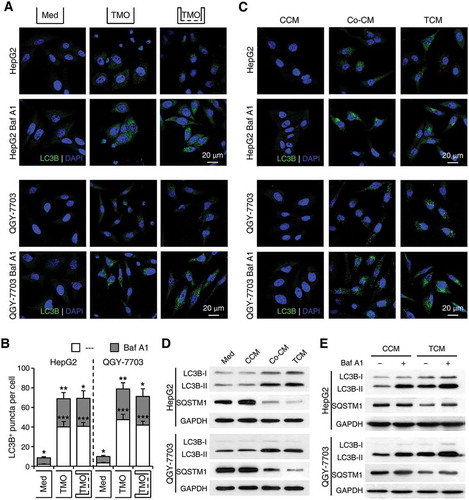
To further elucidate whether the formation or degradation of autophagosomes in cancer cells was affected by tumor-associated monocytes, we treated cancer cells with 3-methyladenine (3-MA), an inhibitor that abrogates autophagosome formation, or Baf A1, a lysosomal inhibitor, prior to or after their incubation with monocyte supernatants, respectively. While 3-MA effectively abolished the upregulation of cancer cell autophagy by HepG2 TCM (Figure S3), Baf A1 treatment further enhanced the effect of LC3B-II upregulation in TCM-exposed cancer cells (). Moreover, whereas Baf A1 showed a marginal effect on levels of SQSTM1 expression in CCM-exposed hepatoma cells, the lysosomal inhibitor could induce a significant increase of SQSTM1 in both HepG2 and QGY-7703 cells treated with TCM (). Together, these results indicated that soluble factors derived from tumor-associated monocytes induced the formation of autophagosomes and increased the levels of autophagy in cancer cells.
TNF and IL1B derived from tumor-activated monocytes synergistically induce cancer cell autophagy
To define the soluble factors accounting for the effects of tumor-associated monocytes on cancer cell autophagy, we examined the levels of various cytokines produced by normal blood monocytes treated with medium or TSN. While containing low cytokine levels themselves (data not shown), TSNs from both HepG2 and QGY-7703 cells triggered rapid upregulation of TNF, IL1B, IL6, IL10, and CXCL8 production in monocytes compared with that in the medium control (Figure 4(a) and Figure S4A). Whereas blocking IL6, IL10, and CXCL8 showed no effects on the upregulation of cancer cell LC3B-II expression by TCM, blocking TNF and IL1B effectively antagonized the effects of TCM on LC3B-II induction and SQSTM1 reduction in cancer cells. Blockage of both TNF and IL1B showed stronger antagonizing effects compared to that of TNF or IL1B alone, indicating a synergistic relationship between these 2 cytokines (; Figure S4B). Similarly, TNF and IL1B could synergistically induce the increase of LC3B-II and decrease of SQSTM1 in both HepG2 and QGY-7703 cells, whereas IL6, IL10, and CXCL8 showed no obvious effects (; Figure S4C).
Figure 4. TNF and IL1B derived from tumor-activated monocytes synergistically induce cancer cell autophagy. (a-c) Monocytes were purified from the blood of healthy donors. (a) Monocytes were left untreated or treated with TSN for 20 h. The production of different cytokines was determined by ELISA; n = 10. (b) HepG2 or QGY-7703 cells were left untreated or treated with TCM with a control IgG1 (40 μg/mL), a TNF blocking mAb (10 μg/mL), an IL6 blocking mAb (40 μg/mL), or an IL1B blocking mAb (10 μg/mL) for 20 h. The levels of LC3B and SQSTM1 expression in hepatoma cells were determined by western blotting. (c) HepG2 or QGY-7703 cells were left untreated or treated with TNF (20 ng/mL), IL1B (10 ng/mL), or IL6 (20 ng/mL) for 20 h. The levels of LC3B and SQSTM1 expression in hepatoma cells were determined by western blotting. (d) CD14+ cells were isolated from patient blood and paired HCC tumor tissues. The production of TNF and IL1B in these cells was determined by ELISA; n = 5. (e) HepG2 or QGY-7703 cells were cultured with CD14+ cells isolated from patient blood or paired HCC tumor tissues for 20 h in the presence or absence of TNF and IL1B blocking mAbs. The levels of LC3 expression in hepatoma cells were determined by western blotting. One out of 5 representative graphs is shown in B, C, and E. The results shown in A and D are expressed as the means ± SEM. * P < 0.05, ** P < 0.01.
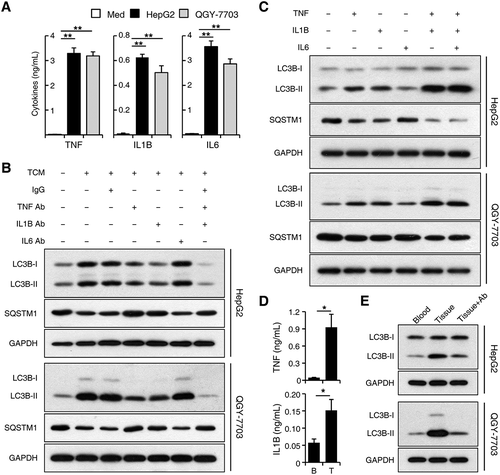
To further confirm the above results, we purified CD14+ cells from HCC patients and found that, compared with cells isolated from patient blood, CD14+ cells from paired tumor tissues produced significantly more TNF and IL1B, and induced a higher expression of LC3B-II protein in HepG2 and QGY-7703 cells. Blockage of TNF and IL1B markedly attenuated the increase of cancer cell LC3B-II expression induced by tumor tissue-isolated monocytes (n = 5; p < 0.05; ).
Autophagy increases EMT of cancer cells at the invading edge of human HCC
Since cancer cells with upregulated autophagy were preferentially enriched at the invading edge region where EMT was also frequently observed [Citation37,Citation38], we next set out to determine whether the upregulation of autophagy in cancer cells was associated with increased EMT and migration of these cells. As shown in Figure 5(a), LC3B+ cancer cells were predominantly enriched in the invading edge regions of HCC tissues, and these cells exhibited markedly decreased CDH1 (cadherin 1) expression and increased VIM (vimentin) expression compared to cancer cells located in tumor nest areas. Moreover, a negative correlation between the mRNA levels of LC3B and CDH1 (n = 10; linear regression, r = −0.6499; p = 0.0419) and a positive correlation between the mRNA levels of LC3B and VIM (n = 10; linear regression, r = 0.9259; p = 0.0001) were found in the invading edge tissues of human HCCs ().
Figure 5. Autophagy increases EMT of cancer cells at the invading edge of human HCC. (a) Sections of paraffin-embedded hepatoma samples were double-stained with anti-human LC3B (green) and anti-human CDH1 (red) Abs or anti-human LC3B (green) and anti-human VIM (red) Abs. The expression levels of CDH1 and VIM in LC3B+ cancer cells were determined by confocal microscopy. The enlarged micrographs show the stained invading edge or tumor nest regions. Blue, DAPI; n = 5. (b) The mRNA levels of LC3B, CDH1 and VIM from the invading edge region of HCC tissues were determined by Q-PCR (n = 10). (c) HepG2 cells were pre-treated with DMSO or 3-MA (5 mM) before being exposed to CCM or TCM for 20 h. The migration of HepG2 cells was analyzed; n = 5. (d-e) HepG2 cells were transfected with shNC, shATG5, or shATG7 lentiviral vectors and then treated with CCM or TCM for 20 h. The levels of ATG5, ATG7, LC3B, CDH1 and VIM expression in HepG2 cells were determined by western blotting (d). The migration of HepG2 cells was evaluated in E (n = 6). One out of 6 representative graphs is shown in C, D, and E. The results shown in E are expressed as the means ± SEM.*** P < 0.001.
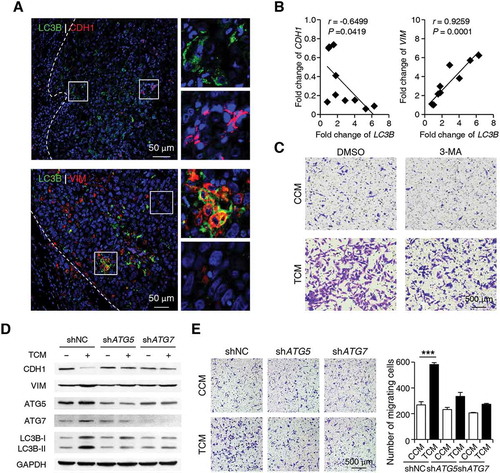
To further examine the role of monocyte-induced autophagy in cancer cell migration, we blocked the formation of autophagy with 3-MA or short hairpin RNAs (shRNAs) targeting the genes encoding the ATG5 or ATG7 proteins in HepG2 cells. As shown in , 3-MA significantly antagonized the upregulation of cancer cell migration induced by TCM. In agreement, shATG5 and shATG7, which abolished LC3B-II induction by TCM, markedly abrogated the upregulation of VIM, downregulation of CDH1, and increased migration of cancer cells treated with TCM (). Similar results were observed in QGY-7703 cells treated with shATG5 or shATG7 (Figure S5). These data suggested that the selectively enhanced cancer cell autophagy induced by tumor-associated monocytes at the invading edge might be responsible for the upregulation of EMT and tumor metastasis in these specific regions of human HCC.
The NFKB-SNAI1 pathway mediates the autophagy-enhanced migration of cancer cells
A series of transcription factors or signaling molecules, including SNAI1, SNAI2, TWIST1, TWIST2, PIK3CA-AKT, MAPK, and NFKB, have been indicated in the regulation of cancer cell EMT and migration [Citation39–Citation41]. Therefore, we aimed to analyze the levels of these factors in TCM-treated cancer cells. TCM induced a significant increase in SNAI1 expression and a transient upregulation of RELA, AKT, MAPK14, MAPK1/3, and MAPK8/9 phosphorylation in HepG2 cells. In contrast, the expression levels of SNAI2, TWIST1, and TWIST2 in HepG2 cells were marginally affected by TCM treatment (Figure 6(a-c)). Both shATG5 and shATG7, which abolished autophagy induction, effectively antagonized the induction of SNAI1 and the upregulation of phosphorylated RELA expression in cancer cells exposed to TCM while not affecting the activation of AKT, MAPK14, MAPK1/3, or MAPK8/9 (). In agreement, translocation of the RELA protein from the cytoplasm to the nucleus in TCM-treated HepG2 cells was markedly abrogated by treatment with both shATG5 and shATG7 (n = 5; p < 0.01; ).
Figure 6. The NFKB-SNAI1 pathway mediates the autophagy-enhanced migration of cancer cells. (a) HepG2 cells were stimulated with CCM or TCM for 20 h. The expression levels of SNAI1, SNAI2, TWIST1, and TWIST2 were measured by western blotting. (b-d) HepG2 cells were transfected with shNC, shATG5, or shATG7 lentiviral vectors and then treated with CCM or TCM for 20 h (b), 30 min (d), or other time intervals (c). The levels of SNAI1, ATG5, ATG7, p-RELA, RELA, p-AKT, AKT, p-MAPK14, MAPK14, p-MAPK1/3, MAPK1/3, p-MAPK8/9, and MAPK8/9 were determined by western blotting (b and c). Translocation of the RELA protein was analyzed by confocal microscopy (n = 5) (d). (e) HepG2 cells were transfected with control, si-RELA, or si-SNAI1 RNAs before being exposed to CCM or TCM for 20 h, and then their migration abilities were analyzed (n = 6). (f) Sections of hepatoma samples were double stained with anti-human LC3B (green) and anti-human SNAI1 (red) Abs or anti-human LC3B (green) and anti-human RELA (red) Abs. The levels of SNAI1 and nuclear-located RELA expression at the invading edge of human HCCs with high or low LC3B expression were determined by confocal microscopy. Blue, DAPI; n = 5. One out of 5 representative graphs is shown in A-F. The results shown in D, E and F are expressed as the means ± SEM. ** P < 0.01, *** P < 0.001.
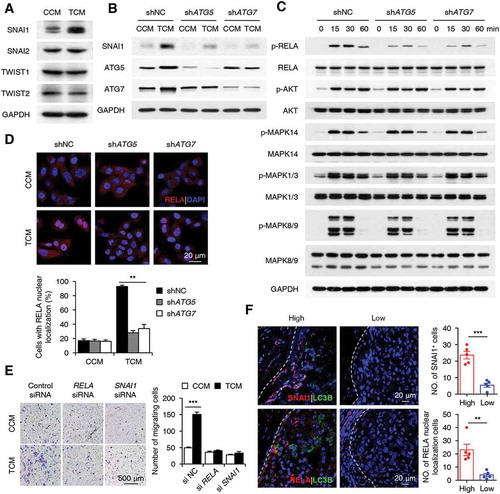
To confirm the role of NFKB and SNAI1 in monocyte-mediated cancer cell migration, we treated cancer cells with si-RELA or si-SNAI1 before their exposure to CCM or TCM. The results showed that si-RELA could antagonize the induction of SNAI1 in TCM-treated HepG2 cells, and both si-RELA and si-SNAI1 efficiently abrogated the enhancement of cancer cell migration when exposed to TCM (; Figure S6). In agreement with the in vitro data, the immunofluorescence staining of fresh tissue sections showed that cancer cells with high expression of LC3B at the invading edge also upregulated their expression of SNAI1 (n = 5; p < 0.001) and nuclear-located RELA proteins (n = 5; p < 0.01; ). Together, the above results suggested that the NFKB-SNAI1 pathway was involved in the regulation of cancer cell migration by monocyte-elicited autophagy at the invading edge of human HCC.
Discussion
Autophagy plays complex and context-dependent roles in normal cells and tissues and has been reported to either inhibit or promote cancer cell proliferation or tumorigenesis in various model systems [Citation42,Citation43]. However, the distribution, regulation, and significance of autophagy in human HCC have not been fully understood. The present study showed that levels of autophagy were significantly upregulated in cancer cells at the invading edge region of HCC. TNF and IL1B derived from tumor activated monocytes in the peritumoral stroma induced the upregulation of cancer cell autophagy, which subsequently led to the increased EMT and migration of these cells at the invading edge areas, and ultimately facilitated disease progression.
Human HCC tumor tissue can often be anatomically classified into areas of cancer nest, invading edge, and peritumoral stroma, each with distinct composition and structure [Citation27,Citation31,Citation44]. For example, the invading edge area is highly angiogenic and full of immature vessels that might facilitate tumor metastasis [Citation31,Citation33,Citation45], and the peritumoral stroma is enriched in inflammatory components with monocytes/macrophages being the most abundant [Citation34]. Our present study found that levels of autophagy were upregulated in human HCC tumor tissues compared to that in remote non-tumor tissues. Interestingly, cancer cells with increased autophagy levels were predominantly enriched at the invading edge region of HCC rather than the cancer nest, which was in contrast to a previous hypothesis that autophagy was mainly induced in hypoxic regions where this process could grant cancer cells with survival advantages [Citation14,Citation18,Citation46].
Different from those in the cancer nest, cancer cells at the invading edge region were in close contact with inflammatory cells infiltrating the peritumoral stroma [Citation27,Citation34]. The current study provides several lines of evidence that peritumoral monocytes induced the upregulation of autophagy in cancer cells at the invading edge of HCC. First, positive correlation was found between levels of peritumoral CD68+ cells and LC3B expression at the invading edge regions of HCC. Second, peritumoral stroma-purified monocytes can upregulate the autophagy levels in hepatoma cell lines compared to their non-tumor-derived counterparts. Third, TNF and IL1B could synergistically mimic the effects of peritumoral monocytes in inducing cancer cell autophagy, and blockage of these cytokines alone or together could antagonize the cancer cell autophagy-inducing effects of peritumoral monocytes or in vitro TSN-stimulated monocytes. In accordance, monocytes from tumor tissues were found to produce significantly more TNF and IL1B compared with those isolated from paired patient blood.
The invading edge of human HCC was abundant in immature vessels that might facilitate cancer metastasis [Citation31], and our previous studies have found that peritumoral monocytes could promote tumor angiogenesis by inducing the differentiation of Th17/Th22 cells [Citation33]. However, the relationship or mechanistic link between peritumoral-stroma-infiltrating monocytes and cancer cell metastasis at the invading edge region has not been fully discovered. The present study unveiled a novel mechanism through which autophagy might serve as a bridge linking inflammatory components to cancer cell metastasis in specific tumor areas. In agreement, the density of autophagic cancer cells in the invading edge region was associated with intrahepatic metastasis and could serve as an independent prognostic factor for both OS and TR of HCC patients.
Notably, the network regulating the EMT process in cancer cells is much more complex than we have explored thus far [Citation47–Citation49], as blocking autophagy induction only partially attenuated the TCM-mediated migration of cancer cells, suggesting that the effect involves additional factors/pathways. Moreover, the intracellular mechanisms mediating the upregulation of autophagy in cancer cells by TCM also require further exploration. It has been reported that various signaling molecules such as MTOR, Hippo Kinases STK3-STK4, PIK3C3, SMAD, JUN, AMPK, and HIF1A, were involved in the intracellular regulation of autophagosome formation in different study models. Many of these signaling molecules are also subjected to the regulation of cytokines such as TNF and IL1B [Citation50–Citation53]. Therefore, monocyte-derived cytokines-induced autophagy in cancer cells might be mediated through not only one, but a combination of several inter-connected signaling pathways.
In conclusion, our study unveiled a mechanism by which tumors utilized the activation of monocytes to upregulate levels of autophagy in cancer cells, which subsequently promoted cancer cell migration and facilitated disease progression. The induction of autophagy by tumor-activated monocytes might represent a novel tumor-immune editing strategy and indicate efficient targets for future immune-based anticancer therapies.
Materials and methods
Patients and specimens
Liver tissues were obtained from 151 untreated patients with pathologically confirmed HCC from the Cancer Center of Sun Yat-sen University (Table S1). Among these patients, 95 patients (cohort 1) who had complete follow-up data were enrolled for overall survival (OS) and recurrence (TR) analysis. Another 30 patients (cohort 2) were used for immunohistochemistry analysis, and the last group of 40 patients (cohort 3) was used for the isolation of fresh blood-, tumor- and non-tumor-infiltrating leukocytes. Non-tumor sites were defined as areas at least 2 cm away from the tumor site, and the invading edge was defined as areas 0.2–0.5 cm (according to the size of the tumor) from the edge to the nest of the tumor tissues [Citation31,Citation54]. Blood samples were obtained from 30 healthy donors at the Guangzhou Blood Center. All samples were anonymously coded in accord with local ethics guidelines (as stipulated by the Declaration of Helsinki). Written informed consent was obtained from the patients, and the study protocol was approved by the Review Board of Sun Yat-Sen University Cancer Center. Heparin tubes (BD Biosciences, 367884) were used to collect blood samples; all blood assays were performed using fresh cells.
Immunohistochemistry and immunofluorescence staining
Paraffin-embedded and formalin-fixed samples were cut into 5-μm sections, followed by procedures for immunohistochemistry as described [Citation32]. After incubation with primary antibody against human LC3B (MBL, PM036) or CD68 (Dako, 0876), sections were stained with corresponding secondary antibodies and visualized with diaminobenzidine or 3-amino-9-ethylcarbazole contained in an Envision System (Dako, K5007).
For immunofluorescence analysis of patient samples, frozen sections were processed as previously described [Citation26]. Primary antibodies against LC3B, CDH1/CADHERIN1 (BD Biosciences, 610181) and VIM/VIMENTIN (BD Biosciences, 550513), RELA (Cell Signaling Technology, 8242), and SNAI1 (ThermoFisher Scientific, PA5-23482) were used for staining. Primary antibodies were detected with Alexa Fluor 488-conjugated donkey anti-rabbit IgG (A21206) or Alexa Fluor 555-conjugated anti-mouse IgG (A31570) from Molecular Probes.
For immunofluorescence staining of cultured cells, cells growing on a coverslip were fixed with 4% paraformaldehyde for 15 min at room temperature, rinsed with phosphate-buffered saline (PBS; ThermoFisher Scientific, 10010023), permeabilized and blocked with PBS containing 5% BSA (BioFroxx, 4240GR100) and 0.3% Triton X-100 (Sigma, T9284) for 1 h at room temperature. Cells were incubated with primary antibodies against LC3B overnight at 4°C, followed by incubation of Alex Fluor 488-conjugated donkey anti-rabbit IgG. Nuclei were counterstained with DAPI. Immunofluorescence staining images were taken by ZEISS microscope (Germany, LSM780). Positive cells were quantified using ImagePro Plus software (Media Cybernetics) and expressed as mean ± SEM in high-powered fields detected by confocal microscopy.
Evaluation of immunohistochemical variables
Levels of LC3B expression were scored semi-quantitatively based on staining intensity and distribution using immunoreactive score (IRS) as described elsewhere [Citation37,Citation55]. Briefly, IRS = PP (percentage of positive cells) × SI (staining intensity). PP was defined as 1 = 0−25%; 2 = 25−50%; 3 = 50−75%; 4 = 75−100%. SI was assigned as: 0 = negative; 1 = weak; 2 = moderate; 3 = strong. For categorization of the continuous LC3B values into low and high, we chose a commonly used cutoff point for the measurements (range 0−12, cut point < 6 versus ≥ 6), which resulted in 45.7% patients with high LC3B expression.
Quantitative real-time PCR
Total RNA was extracted using Trizol reagent (ThermoFisher Scientific, AM9738) and was used to synthesize cDNA with MMLV reverse transcriptase (Progmega, M1708). Sequences of the primers used for the PCR analysis were as follows: LC3B: forward, 5ʹ−GAAGGCGCTTACAGCTCAAT−3ʹ; reverse, 5ʹ−ACGTCTCCTGGGAGGCATAG−3ʹ; SQSTM1: forward, 5ʹ−CTACAGATGCCAGAATCCGAAG−3ʹ; reverse, 5ʹ−CCTTCATCAGAGAAGCCCATG−3ʹ; ATG5: forward, 5ʹ−TTGACGTTGGTAACTGACAAAGTG−3ʹ; reverse, 5ʹ−CTGTGATGTTCCAAGGAAGAGC−3ʹ; ATG7: forward, 5ʹ−TCGAAAGCCATGATGTCGTC−3ʹ; reverse, 5ʹ−CAAAGCAGCATTGATGACCAG−3ʹ; CDH1: forward, 5ʹ−CCGCTGGCGTCTGTAGGAAGG−3ʹ; reverse, 5ʹ−GGCTCTTTGACCACCGCTCTCC−3ʹ; VIM: forward, 5ʹ−GAGAACTTTGCCGTTGAAGC−3ʹ; reverse, 5ʹ−TCCAGCAGCTTCCTGTAGGT−3ʹ. GAPDH: forward, 5ʹ−GAGTCAACGGATTTGGTCGT−3ʹ; reverse, 5ʹ−GACAAGCTTCCCGTTCTCAG−3ʹ. Quantitative PCR was performed according to a standard protocol using the SYBR Green Real-Time PCR MasterMix (TOYOBO, QPS-201) in a Roche LightCycler 480 System. To determine the relative fold change of the expression of different genes, the expression level of each gene was normalized to that of GAPDH.
Immunoblotting
The immunoblotting was performed as previously described [Citation34]. The primary antibodies were as follows: anti-GAPDH (OriGene, TA802519); anti-MAPK1/3 (4695), MAPK14 (8690), MAPK8/9 (9252), AKT (4691), RELA (8242), phospho-RELA (3033), phospho-MAPK1/3 (4370), phospho-MAPK14 (4511), phospho-MAPK8/9 (4668), phospho-AKT (4060), and MAP1LC3B (3868) all from Cell Signaling Technology. HRP-conjugated goat anti-rabbit/mouse IgG (7074/7076) antibodies were also purchased from Cell Signaling Technology.
Isolation of monocytes from peripheral blood and tissues
Leukocytes were isolated from the blood or tissues from healthy donors or HCC patients using Ficoll density gradient centrifugation as previously described [Citation33]. CD14+ monocytes were purified using magnetic beads (Miltenyi Biotec, 130050201) for use in subsequent in vitro experiments.
Transmission electron microscopy
Transmission electron microscopy analysis of cancer cells with different treatments was performed as previously described [Citation45].
Preparation of culture supernatants from hepatoma cells (TSN) or tumor-conditioned monocytes
Human hepatoma HepG2 cells were obtained from the American Type Culture Collection (HB-8065). Human HCC QGY−7703 cells were obtained from the Institute of Biochemistry and Cell Biology at the Chinese Academy of Sciences. All cells were maintained in DMEM medium supplemented with 10% FBS (Gibco, 10099–141). TSN was prepared by plating 5 × 10⁶ tumor cells in 10 mL of complete DMEM medium in 100-mm dishes for 24 h and thereafter changing the medium to complete medium supplemented with 10% FBS (Gibco, 10099–141). After 2 days, the supernatant was centrifuged and stored in aliquots at −80°C.
To generate conditioned medium, monocytes (4 × 10⁶) were seeded in 6-well plates overnight, then cultured with HCC tumor cells (8 × 10⁵), or treated with medium or 30% TSN for 20 h. Thereafter, the supernatants were harvested, centrifuged (10,000 g, 15 min), and stored in aliquots at −80°C.
In vitro coculture of monocytes and cancer cells
HepG2 or QGY-7703 tumor cells (2 × 10⁴) were transfected with shNC, shATG5, or shATG7 lentiviral vectors, or pretreated with medium, DMSO (Merck, 317275), Baf A1 (5 nM; Sigma, B1793), or 3-MA (5 mM; Sigma, M9281), and then cultured with CD14+ cells (1 × 10⁵) isolated from peripheral blood or fresh HCC tissues, or exposed to supernatants from monocytes untreated (CCM), co-cultured with hepatoma cells (Co-CM), or pre-treated with TSN (TCM). In some experiments, transwell chambers with a 3-μm pore membrane (Corning-Costar, 3415) were introduced to separate the contact between monocytes and cancer cells. In other experiments, control IgG1 (40 μg/mL; MAB002), TNF blocking monoclonal antibody (mAb) (10 μg/mL; MAB610), IL6 blocking mAb (40 μg/mL; MAB206), or IL1B blocking mAb (10 μg/mL; MAB201), and TNF (20 ng/mL; 210-TA), IL1B (10 ng/mL; 201-LB), or IL6 (20 ng/mL; 206-IL), all from R&D Systems, were used in the culture system.
Enzyme-linked immunosorbent assay (ELISA)
Cytokine concentrations were determined using ELISA kits according to the manufacturer’s instructions (eBioscience, 88–7346; 88–7066; 88–7106; 88–7261; 88–8086).
Cell migration assay
The migration assay was performed in a 24-well Boyden chamber with an 8-µm polycarbonate membrane (Corning, 3422). HepG2 cells were left untreated or stimulated with CCM or TCM for 24 h. Thereafter, these cells (3 × 10⁴) in 100 µl of serum-free DMEM were added to the upper compartment of the chamber, whereas the lower compartment was filled with 600 µl of DMEM containing 10% FBS. After 10 h of incubation, the cells remaining on the upper surface of the membrane were removed. The migrated tumor cells on the lower surface of the membrane were rinsed with PBS and subsequently stained with crystal violet after fixation and then counted under a light microscope (Nikon, Ni-U).
Lentiviral ATG5 and ATG7 shRNA construction
The following small hairpin RNAs (shRNA) for a scrambled sequence (5ʹ-TTCTCCGAACGTGTCACGT-3ʹ), ATG5 (5ʹ−CTTTGGCCTAAGAAGAAA−3ʹ) and ATG7 (5ʹ−CTGAACGAGTATCGGCTG−3ʹ) were cloned between the BamHI and EcoRI sites of pSIF-H1-copGFP (System Biosciences, SI100C-1). Lentivirus were produced in HEK-293T cells transfected with shRNA-expressing vector, packaging vectors pFIV-34N and pVSV−G (System Biosciences, SI101B-1). Supernatants of transfected HEK-293T cells were collected over 36 to 48 h and titered by plaque assay before being used to infect HepG2 cells.
RNA interference
HepG2 cells were left untreated or transfected with 50 nM of a negative control siRNA (sense: 5ʹ−UUCUCCGAACGUGUCACGUTT−3ʹ; antisense: 5ʹ−CAACUGAGCCCAUGCUGAUdTdT−3ʹ; or RELA−specific siRNA (sense: 5ʹ−CAACUGAGCCCAUGCUGAUdTdT−3ʹ; antisense: 5ʹ−AUCAGCAUGGGCUCAGUUGUG−3ʹ); or SNAI1−specific siRNA (sense: 5ʹ−GGACAAAGGCUGACAGACUdTdT−3ʹ; antisense: 5ʹ−AGUCUGUCAGCCUUUGUCCdCdU−3ʹ) using Lipofectamine-RNAi MAX (Invitrogen, 13778150). Thirty-six h after transfection, the cells were exposed to conditioned media derived from monocytes for 18 h. All siRNA duplexes were purchased from GenePharma (Shanghai, P.R. China).
Statistical analysis
Results are expressed as means ± SEM. The statistical significance of differences between groups was determined by Student’s t-test. Correlations between parameters were ascertained by Pearson correlation and linear regression analysis, as appropriate. All data were analyzed using two-tailed tests unless otherwise specified, and p < 0.05 was considered statistically significant.
Abbreviations
| 3-MA | = | 3-methyladenine |
| AKT | = | AKT serine/threonine kinase |
| ATG5 | = | autophagy related 5 |
| ATG7 | = | autophagy related 7 |
| Baf A1 | = | bafilomycin A1 |
| CCM | = | conditioned medium from control (untreated) monocytes |
| EMT | = | epithelial-mesenchymal transition |
| GAPDH | = | glyceraldehyde-3-phosphate dehydrogenase |
| HCC | = | hepatocellular carcinoma |
| IL | = | interleukin |
| MAP1LC3B/LC3B | = | microtubule associated protein 1 light chain 3 beta |
| MAPK | = | mitogen-activated protein kinase |
| MAPK1/3 | = | mitogen-activated protein kinase 1/3 |
| MAPK8/9 | = | mitogen-activated protein kinase 8/9 |
| MAPK14 | = | mitogen-activated protein kinase 14 |
| NFKB | = | nuclear factor kappa B subunit |
| PIK3CA | = | phosphatidylinositol-4,5-bisphosphate 3-kinase catalytic subunit alpha |
| RELA | = | RELA proto-oncogene, NF-kB subunit |
| SQSTM1/p62 | = | sequestosome 1 |
| TCM | = | conditioned medium from TSN-exposed monocytes |
| TNF | = | tumor necrosis factor |
| TSN | = | culture supernatants from HepG2 or QGY-7703 |
Supplemental Material
Download Zip (20.5 MB)Disclosure statement
No potential conflict of interest was reported by the authors.
Supplementary material
Supplemental data for this article can be accessed here.
Additional information
Funding
Related Research Data
References
- Perera RM, Stoykova S, Nicolay BN, et al. Transcriptional control of autophagy-lysosome function drives pancreatic cancer metabolism. Nature. 2015 Aug 20;524(7565):361–365. PubMed PMID: 26168401; PubMed Central PMCID: PMC5086585.
- Zhong Z, Sanchez-Lopez E, Karin M. Autophagy, inflammation, and immunity: a troika governing cancer and its treatment. Cell. 2016 Jul 14;166(2):288–298. PubMed PMID: 27419869; PubMed Central PMCID: PMC4947210.
- Jiang X, Overholtzer M, Thompson CB. Autophagy in cellular metabolism and cancer. J Clin Invest. 2015 Jan;125(1):47–54. PubMed PMID: 25654550; PubMed Central PMCID: PMC4382242.
- Strohecker AM, White E. Targeting mitochondrial metabolism by inhibiting autophagy in BRAF-driven cancers. Cancer Discov. 2014 Jul;4(7):766–772. PubMed PMID: 24860158; PubMed Central PMCID: PMC4090279.
- Klionsky DJ, Abdelmohsen K, Abe A, et al. Guidelines for the use and interpretation of assays for monitoring autophagy (3rd edition). Autophagy. 2016;12(1):1–222. PubMed PMID: 26799652; PubMed Central PMCID: PMC4835977.
- Jin S, White E. Role of autophagy in cancer: management of metabolic stress. Autophagy. 2007 Jan-Feb;3(1):28–31. PubMed PMID: 16969128; PubMed Central PMCID: PMC2770734.
- Ding ZB, Hui B, Shi YH, et al. Autophagy activation in hepatocellular carcinoma contributes to the tolerance of oxaliplatin via reactive oxygen species modulation. Clin Cancer Res. 2011 Oct 1;17(19):6229–6238. PubMed PMID: 21825039.
- Rubinsztein DC, Codogno P, Levine B. Autophagy modulation as a potential therapeutic target for diverse diseases. Nat Rev Drug Discov. 2012 Sep;11(9):709–730. PubMed PMID: 22935804; PubMed Central PMCID: PMC3518431.
- Yu T, Guo F, Yu Y, et al. Fusobacterium nucleatum promotes chemoresistance to colorectal cancer by modulating autophagy. Cell. 2017 Jul 2;170(3):548–563 e16. PubMed PMID: 28753429; PubMed Central PMCID: PMC5767127.
- Kenific CM, Debnath J. Cellular and metabolic functions for autophagy in cancer cells. Trends Cell Biol. 2015 Jan;25(1):37–45. PubMed PMID: 25278333; PubMed Central PMCID: PMC4275311.
- Ueno T, Komatsu M. Autophagy in the liver: functions in health and disease. Nat Rev Gastroenterol Hepatol. 2017 Mar;14(3):170–184. PubMed PMID: 28053338.
- Takamura A, Komatsu M, Hara T, et al. Autophagy-deficient mice develop multiple liver tumors. Genes Dev. 2011 Apr 15;25(8):795–800. PubMed PMID: 21498569; PubMed Central PMCID: PMC3078705.
- Guo JY, Xia B, White E. Autophagy-mediated tumor promotion. Cell. 2013 Dec 5;155(6):1216–1219. PubMed PMID: 24315093; PubMed Central PMCID: PMC3987898.
- Kaminskyy VO, Piskunova T, Zborovskaya IB, et al. Suppression of basal autophagy reduces lung cancer cell proliferation and enhances caspase-dependent and -independent apoptosis by stimulating ROS formation. Autophagy. 2012 Jul 1;8(7):1032–1044. PubMed PMID: 22562073; PubMed Central PMCID: PMC3429541.
- Peng YF, Shi YH, Ding ZB, et al. Autophagy inhibition suppresses pulmonary metastasis of HCC in mice via impairing anoikis resistance and colonization of HCC cells. Autophagy. 2013 Dec;9(12):2056–2068. PubMed PMID: 24157892.
- Zhan Z, Xie X, Cao H, et al. Autophagy facilitates TLR4- and TLR3-triggered migration and invasion of lung cancer cells through the promotion of TRAF6 ubiquitination. Autophagy. 2014 Feb;10(2):257–268. PubMed PMID: 24321786; PubMed Central PMCID: PMC5396095.
- Xie X, Koh JY, Price S, et al. Atg7 overcomes senescence and promotes growth of brafV600E-driven melanoma. Cancer Discov. 2015 Apr;5(4):410–423. PubMed PMID: 25673642; PubMed Central PMCID: PMC4390491.
- Karantza-Wadsworth V, Patel S, Kravchuk O, et al. Autophagy mitigates metabolic stress and genome damage in mammary tumorigenesis. Genes Dev. 2007 Jul 1;21(13):1621–1635. PubMed PMID: 17606641; PubMed Central PMCID: PMC1899472.
- Ladoire S, Enot D, Senovilla L, et al. The presence of LC3B puncta and HMGB1 expression in malignant cells correlate with the immune infiltrate in breast cancer. Autophagy. 2016 May 3;12(5):864–875. PubMed PMID: 26979828; PubMed Central PMCID: PMC4854557.
- Llovet JM, Zucman-Rossi J, Pikarsky E, et al. Hepatocellular carcinoma. Nat Rev Dis Primers. 2016 Apr 14;2:16018. PubMed PMID: 27158749.
- Liu Y, Cao X. The origin and function of tumor-associated macrophages. Cell Mol Immunol. 2015 Jan;12(1):1–4. PubMed PMID: 25220733; PubMed Central PMCID: PMC4654376.
- Zhu H, Cao X. NLR members in inflammation-associated carcinogenesis. Cell Mol Immunol. 2017 May;14(5):403–405. PubMed PMID: 28366939; PubMed Central PMCID: PMC5423091.
- Chittezhath M, Dhillon MK, Lim JY, et al. Molecular profiling reveals a tumor-promoting phenotype of monocytes and macrophages in human cancer progression. Immunity. 2014 Nov 20;41(5):815–829. PubMed PMID: 25453823.
- Han Y, Chen Z, Yang Y, et al. Human CD14+ CTLA-4+ regulatory dendritic cells suppress T-cell response by cytotoxic T-lymphocyte antigen-4-dependent IL-10 and indoleamine-2,3-dioxygenase production in hepatocellular carcinoma. Hepatology. 2014 Feb;59(2):567–579. PubMed PMID: 23960017.
- Makarova-Rusher OV, Medina-Echeverz J, Duffy AG, et al. The yin and yang of evasion and immune activation in HCC. J Hepatol. 2015 Jun;62(6):1420–1429. PubMed PMID: 25733155.
- Xiao X, Lao XM, Chen MM, et al. PD-1hi identifies a novel regulatory B-cell population in human hepatoma that promotes disease progression. Cancer Discov. 2016 May;6(5):546–559. PubMed PMID: 26928313.
- Chen MM, Xiao X, Lao XM, et al. Polarization of tissue-tesident TFH-like cells in human hepatoma bridges innate monocyte inflammation and M2b macrophage polarization. Cancer Discov. 2016 Oct;6(10):1182–1195. PubMed PMID: 27531854.
- Zhou SL, Zhou ZJ, Hu ZQ, et al. Tumor-associated neutrophils recruit macrophages and T-regulatory cells to promote progression of hepatocellular carcinoma and resistance to sorafenib. Gastroenterology. 2016 Jun;150(7):1646–1658 e17. PubMed PMID: 26924089.
- Kuang DM, Peng C, Zhao Q, et al. Tumor-activated monocytes promote expansion of IL-17-producing CD8+ T cells in hepatocellular carcinoma patients. J Immunol. 2010 Aug 1;185(3):1544–1549. PubMed PMID: 20581151.
- Liu Y, Gu Y, Han Y, et al. Tumor exosomal RNAs promote lung pre-metastatic niche formation by activating alveolar epithelial TLR3 to recruit neutrophils. Cancer Cell. 2016 Aug 8;30(2):243–256. PubMed PMID: 27505671.
- Kuang DM, Zhao Q, Wu Y, et al. Peritumoral neutrophils link inflammatory response to disease progression by fostering angiogenesis in hepatocellular carcinoma. J Hepatol. 2011 May;54(5):948–955. PubMed PMID: 21145847.
- Kuang DM, Zhao Q, Peng C, et al. Activated monocytes in peritumoral stroma of hepatocellular carcinoma foster immune privilege and disease progression through PD-L1. J Exp Med. 2009 Jun 8;206(6):1327–1337. PubMed PMID: 19451266; PubMed Central PMCID: PMC2715058.
- Kuang DM, Xiao X, Zhao Q, et al. B7-H1-expressing antigen-presenting cells mediate polarization of protumorigenic Th22 subsets. J Clin Invest. 2014 Oct;124(10):4657–4667. PubMed PMID: 25244097; PubMed Central PMCID: PMC4191045.
- Kuang DM, Peng C, Zhao Q, et al. Activated monocytes in peritumoral stroma of hepatocellular carcinoma promote expansion of memory T helper 17 cells. Hepatology. 2010 Jan;51(1):154–164. PubMed PMID: 19902483.
- Liu RX, Wei Y, Zeng QH, et al. Chemokine (C‐X‐C motif) receptor 3–positive B cells link interleukin‐17 inflammation to protumorigenic macrophage polarization in human hepatocellular carcinoma. Hepatology. 2015 Dec;62:1779–1790. PubMed PMID: 26235097.
- Zhang JP, Yan J, Xu J, et al. Increased intratumoral IL-17-producing cells correlate with poor survival in hepatocellular carcinoma patients. J Hepatol. 2009 May;50(5):980–989. PubMed PMID: 19329213.
- Su S, Liu Q, Chen J, et al. A positive feedback loop between mesenchymal-like cancer cells and macrophages is essential to breast cancer metastasis. Cancer Cell. 2014 May 12;25(5):605–620. PubMed PMID: 24823638.
- Grassi G, Di Caprio G, Santangelo L, et al. Autophagy regulates hepatocyte identity and epithelial-to-mesenchymal and mesenchymal-to-epithelial transitions promoting snail degradation. Cell Death Dis. 2015 Sep 10;6:e1880. PubMed PMID: 26355343; PubMed Central PMCID: PMC4650445.
- Wu Y, Deng J, Rychahou PG, et al. Stabilization of snail by NF-kappaB is required for inflammation-induced cell migration and invasion. Cancer Cell. 2009 May 5;15(5):416–428. PubMed PMID: 19411070; PubMed Central PMCID: PMC2881229.
- Okada T, Sinha S, Esposito I, et al. The Rho GTPase Rnd1 suppresses mammary tumorigenesis and EMT by restraining Ras-MAPK signalling. Nat Cell Biol. 2015 Jan;17(1):81–94. PubMed PMID: 25531777; PubMed Central PMCID: PMC4374353.
- Li S, Lu J, Chen Y, et al. MCP-1-induced ERK/GSK-3beta/snail signaling facilitates the epithelial-mesenchymal transition and promotes the migration of MCF-7 human breast carcinoma cells. Cell Mol Immunol. 2017 Jul;14(7):621–630. PubMed PMID: 26996066.
- Cianfanelli V, Fuoco C, Lorente M, et al. AMBRA1 links autophagy to cell proliferation and tumorigenesis by promoting c-Myc dephosphorylation and degradation. Nat Cell Biol. 2015 Jan;17(1):20–30. PubMed PMID: 25438055; PubMed Central PMCID: PMC4976803.
- Maiuri MC, Zalckvar E, Kimchi A, et al. Self-eating and self-killing: crosstalk between autophagy and apoptosis. Nat Rev Mol Biol. 2007 Sep;8(9):741–752. PubMed PMID: 17717517.
- Wu Y, Kuang DM, Pan WD, et al. Monocyte/macrophage-elicited natural killer cell dysfunction in hepatocellular carcinoma is mediated by CD48/2B4 interactions. Hepatology. 2013 Mar;57(3):1107–1116. PubMed PMID: 23225218.
- Li XF, Chen DP, Ouyang FZ, et al. Increased autophagy sustains the survival and pro-tumourigenic effects of neutrophils in human hepatocellular carcinoma. J Hepatol. 2015 Jan;62(1):131–139. PubMed PMID: 25152203.
- Hu YL, DeLay M, Jahangiri A, et al. Hypoxia-induced autophagy promotes tumor cell survival and adaptation to antiangiogenic treatment in glioblastoma. Cancer Res. 2012 Apr 1;72(7):1773–1783. PubMed PMID: 22447568; PubMed Central PMCID: PMC3319869.
- Gao D, Vahdat LT, Wong S, et al. Microenvironmental regulation of epithelial-mesenchymal transitions in cancer. Cancer Res. 2012 Oct 1;72(19):4883–4889. PubMed PMID: 23002209; PubMed Central PMCID: PMC3649848.
- Zhou ZJ, Dai Z, Zhou SL, et al. HNRNPAB induces epithelial-mesenchymal transition and promotes metastasis of hepatocellular carcinoma by transcriptionally activating snail. Cancer Res. 2014 May 15;74(10):2750–2762. PubMed PMID: 24638979.
- Wang Z, Gao Q, Shi J, et al. Protein tyrosine phosphatase receptor S acts as a metastatic suppressor in hepatocellular carcinoma by control of epithermal growth factor receptor-induced epithelial-mesenchymal transition. Hepatology. 2015 Oct;62:1201–1214. PubMed PMID: 25998839.
- Day EA, Ford RJ, Steinberg GR. AMPK as a therapeutic target for treating metabolic diseases. Trends Endocrinol Metab. 2017 Aug;28(8):545–560. PubMed PMID: 28647324.
- Linares JF, Duran A, Yajima T, et al. K63 polyubiquitination and activation of mTOR by the p62-TRAF6 complex in nutrient-activated cells. Molecular Cell. 2013 Aug 8;51(3):283–296. PubMed PMID: 23911927; PubMed Central PMCID: PMC3971544.
- Riesenberg S, Groetchen A, Siddaway R, et al. MITF and c-Jun antagonism interconnects melanoma dedifferentiation with pro-inflammatory cytokine responsiveness and myeloid cell recruitment. Nat Commun. 2015 Nov 4;6:8755. PubMed PMID: 26530832; PubMed Central PMCID: PMC4659938.
- Mao CY, Wang YG, Zhang X, et al. Double-edged-sword effect of IL-1beta on the osteogenesis of periodontal ligament stem cells via crosstalk between the NF-kappaB, MAPK and BMP/Smad signaling pathways. Cell Death Dis. 2016 Jul 14;7:e2296. PubMed PMID: 27415426; PubMed Central PMCID: PMC4973347.
- Giatromanolaki A, Koukourakis MI, Sivridis E, et al. Invading edge vs. inner (edvin) patterns of vascularization: an interplay between angiogenic and vascular survival factors defines the clinical behaviour of non‐small cell lung cancer. J Pathol. 2000;192:140–149. PubMed PMID: 11004689.
- Lee YJ, Hah YJ, Kang YN, et al. The autophagy-related marker LC3 can predict prognosis in human hepatocellular carcinoma. Plos One. 2013;8(11):e81540. PubMed PMID: 24282606; PubMed Central PMCID: PMC3839913.