
ABSTRACT
Glucocorticoids are widely used to treat inflammatory disorders; however, prolonged use of glucocorticoids results in side effects including osteoporosis, diabetes and obesity. Compound A (CpdA), identified as a selective NR3C1/glucocorticoid receptor (nuclear receptor subfamily 3, group C, member 1) modulator, exhibits an inflammation-suppressive effect, largely in the absence of detrimental side effects. To understand the mechanistic differences between the classic glucocorticoid dexamethasone (DEX) and CpdA, we looked for proteins oppositely regulated in bone marrow-derived macrophages using an unbiased proteomics approach. We found that the autophagy receptor SQSTM1 but not NR3C1 mediates the anti-inflammatory action of CpdA. CpdA drives SQSTM1 upregulation by recruiting the NFE2L2 transcription factor to its promoter. In contrast, the classic NR3C1 ligand dexamethasone recruits NR3C1 to the Sqstm1 promoter and other NFE2L2-controlled gene promoters, resulting in gene downregulation. Both DEX and CpdA induce autophagy, with marked different autophagy characteristics and morphology. Suppression of LPS-induced Il6 and Ccl2 genes by CpdA in macrophages is hampered upon Sqstm1 silencing, confirming that SQSTM1 is essential for the anti-inflammatory capacity of CpdA, at least in this cell type. Together, these results demonstrate how off-target mechanisms of selective NR3C1 ligands may contribute to a more efficient anti-inflammatory therapy.
Introduction
Glucocorticoids (GCs) are widely used to treat different inflammatory diseases including rheumatoid arthritis and asthma [Citation1–Citation3]. The natural (cortisol) and synthetic (e.g., dexamethasone) glucocorticoids are known ligands of NR3C1/glucocorticoid receptor (nuclear receptor subfamily 3, group C, member 1). These glucocorticoids bind NR3C1 in the cytoplasm leading to its translocation to the nucleus where it functions as a transcription factor. Activated NR3C1 can upregulate the transcription of different genes involved in metabolism such as PCK1, TAT, G6PC and some anti-inflammatory genes such as TSC22D3/GILZ and DUSP1 by binding to NR3C1 response elements (GRE), a process known as transactivation [Citation4,Citation5]. Also, NR3C1 can transrepress pro-inflammatory genes such as IL6, CCL2, and TNF via tethering to NFKB and AP-1 (FOS/JUN) complexes, or via direct binding to negative GREs [Citation6,Citation7].
GCs remain the most common prescribed anti-inflammatory drugs despite their possible severe side effects. Prolonged systemic treatment with GCs is associated with acquired resistance to treatment, hypertension, osteoporosis and increased glucose levels leading to diabetes. Selective NR3C1 modulators are studied as potential tools to solve this problem [Citation8]. Using in vitro and in vivo models, the dissociative nonsteroidal selective NR3C1 modulator compound A (CpdA) was shown to exhibit an inflammation-suppressive effect, largely in the absence of the aforementioned side effects [Citation9–Citation13]. CpdA is a synthetic analog of the plant-derived hydroxy phenyl aziridine precursor [Citation14]. Recently, it was reported that CpdA can target the NFKB pathway via a NR3C1-independent mechanism [Citation13,Citation15]. However, how a CpdA-mediated NR3C1-independent mechanism may work and which proteins are necessary for the anti-inflammatory action of CpdA remain largely unknown.
NFE2L2 (nuclear factor, erythroid derived 2, like 2) is a transcription factor responsible for the regulation of cellular redox balances and for the protective antioxidant and phase II detoxification response [Citation16,Citation17]. NFE2L2 is tethered to KEAP1, which is highly enriched in cysteine residues and gets continuously ubiquitinated and degraded by the proteasome. Upon oxidative stress or treatment with NFE2L2 inducers, NFE2L2 escapes from KEAP1 retention and translocates to the nucleus where it heterodimerizes with small MAF proteins to transactivate genes with antioxidant response elements (AREs) in their promoters, such as HMOX1, NQO1 and TXNRD1. Autophagy receptors SQSTM1 and CALCOCO2/NDP52 also have AREs in their promoters and can be regulated by NFE2L2 [Citation17,Citation18]. Moreover, SQSTM1 can act as an activator of NFE2L2 via the inactivation of KEAP1 [Citation19,Citation20]. As an autophagy receptor, SQSTM1 binds to ubiquitinated cargo substrates and, by interaction with the phagophore-bound MAP1LC3/LC3 protein, targets them for degradation in a process known as autophagy [Citation21,Citation22].
The search for factors that underlie the anti-inflammatory properties of CpdA will not only help to clarify the debated NR3C1 transrepression/transactivation paradigm [Citation23], but might also contribute to the discovery of alternative and safer anti-inflammatory drugs. By using a shotgun mass spectrometry analysis, we identified SQSTM1 and HMOX1 as significantly upregulated proteins following CpdA treatment of murine bone marrow-derived macrophages (BMDMs) under inflamed cellular conditions (LPS). We hypothesized that SQSTM1 and/or other members of an NFE2L2-dependent pathway might be involved in NR3C1-independent CpdA-induced suppression of inflammation in macrophages. Although SQSTM1 was shown to be involved in the regulation of inflammation in macrophages [Citation24], very little is known about the transcriptional regulation of SQSTM1 by NR3C1 ligands and modulators, and how this can affect gene transcription of inflammatory markers.
Here, we show that the selective NR3C1 modulator CpdA upregulates, while dexamethasone (DEX) downregulates, SQSTM1, HMOX1 and TXNRD1 in BMDM via different mechanisms at the level of gene transcription. CpdA recruits NFE2L2, while DEX recruits NR3C1 to the promoters of the Sqstm1, Hmox1 and Il6 genes. CpdA-mediated suppression of LPS-induced Il6 and Ccl2 in BMDM appeared to be NR3C1 independent and was hampered only upon silencing of Sqstm1. Remarkably, regardless of the opposite regulation of SQSTM1, both DEX and CpdA are able to ultimately induce autophagy in BMDM, suggesting that a staged uncoupling between SQSTM1 regulation and autophagy is possible.
Results
SQSTM1 is identified as a protein that behaves in an opposite manner following CpdA versus DEX treatment in LPS-induced macrophages
Because of the very different chemical structures between dexamethasone (DEX) and CpdA (Fig. S1A), we reasoned that the action mechanism of CpdA might also involve other target proteins besides NR3C1, and we were specifically interested in those proteins differentially regulated by CpdA compared to DEX in an inflammatory context. To find this differential protein profile, we compared combinations of CpdA and LPS versus LPS alone, and of DEX and LPS versus LPS alone using mass spectrometry-based shotgun proteomics in BMDMs (). These cells serve as a good model for inflammation-related studies because they are key components of the innate immune system [Citation25]. The higher dose of CpdA (10 μM) compared to DEX (1 μM) is in accord with the effective in vitro anti-inflammatory dose of this nonsteroidal compound, as established previously [Citation14].
As a validation of the inflammatory stimuli and the accuracy of this method, many classic inflammatory proteins, including among others IL1B, NOS2, ICAM1, and NFKB2 were found to be significantly upregulated in LPS-treated cells compared to solvent (non-induced [NI]) (Fig. S1B). In total, over 2,760 proteins were quantified by shotgun proteomics, and a statistical analysis comparing cells treated with CpdA + LPS versus LPS alone revealed 4 significantly (p < 0.01) upregulated and 12 significantly downregulated proteins (). Ingenuity Pathway Analysis (IPA®) of these 16 proteins assigned 13 hereof to the ‘Infectious Diseases, Cell-To-Cell Signaling and Interaction, Hematological Disease’ network (). Among these proteins, SQSTM1 and HMOX1 caught our attention because of a common transcription regulator, NFE2L2 [Citation26]. Because these proteins were not upregulated in the DEX+ LPS vs LPS set-up (), we considered them as potential candidates to explain the ability of CpdA to suppress inflammation, possibly independently from NR3C1, in a LPS-induced BMDM model. SQSTM1 was rather downregulated (p = 0.006 and 0.59-fold change) in the DEX + LPS vs LPS set-up (). DEX-regulated proteins in the inflamed macrophages were also assigned by IPA to an inflammation-related network ().
Figure 1. LC-MS/MS analysis reveals differentially expressed proteins in BMD macrophages treated with DEX or CpdA under the inflammatory condition. (A) Schematic overview of the mass spectrometry-based shotgun proteomics experiment. (B) Volcano plot with significantly up- (red) or downregulated (green) proteins in CpdA + LPS versus LPS alone. CpdA (10 μM) and 100 ng/ml LPS treatments were used. Statistics by multiple two-sample t-tests, each with a permutation-based FDR of 0.05 and S0 value of 0.1 for truncation. (N = 3). (C) Ingenuity pathway analysis (www.qiagenbioinformatics.com) of significantly regulated proteins from CpdA+ LPS versus LPS comparison. (D) Volcano plot with significantly up- (red) or downregulated (green) proteins in DEX + LPS versus LPS. DEX (1 μM) and 100 ng/ml LPS treatments were used. Statistics by multiple two-sample t-tests, each with a permutation-based FDR of 0.05 and S0 value of 0.1 for truncation. (N = 3). (E) Ingenuity pathway analysis of significantly regulated proteins from DEX+ LPS versus LPS comparison.
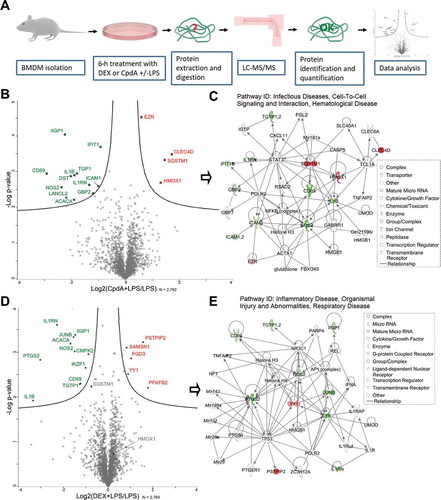
In support, SQSTM1 was detected by mass spectrometry analysis also in human lung epithelial A549 cells as a differentially regulated protein, when comparing CpdA versus DEX treatment in combination with TNF as an alternative inflammatory stimulus (Fig. S2C, S2D).
DEX and CpdA differentially regulate NFE2L2-dependent genes in murine and human macrophages
To validate the mass spectrometry results and reveal further mechanistic details of regulation, we compared the effect of DEX versus CpdA on the regulation of Sqstm1, and by extension of other typical NFE2L2-dependent genes, Hmox1 and Txnrd1, in primary BMDMs. Hereto, we measured mRNA expression after 6-h treatment with DEX or CpdA in the absence or presence of LPS. DEX mostly suppressed these genes, while CpdA upregulated them (more than 2 fold). This regulation was largely similar in the presence of LPS (). The regulation of HMOX1 at the protein level followed the pattern of mRNA regulation (). The observed Sqstm1 upregulation by CpdA at the mRNA level was much stronger than at the protein level, whereas the DEX-induced suppression of the SQSTM1 protein was much more prominent in comparison to the observed decrease in Sqstm1 mRNA. LPS treatment by itself upregulated both SQSTM1 and HMOX1 (). As a positive control, treatment with the NFE2L2 activator sulforaphane resulted in an increase of the Sqstm1 gene expression level comparable to the level obtained with CpdA. Sulforaphane did lead to a much stronger upregulation of HMOX1 both at the mRNA and protein level (Fig. S3A, S3B). As expected from an NR3C1-activating steroid, the DEX-induced downregulation of Sqstm1 was completely abolished upon Nr3c1 silencing (). To our surprise, the CpdA-activated gene expression of Sqstm1 was largely retained upon silencing of Nr3c1, indicating a role for another transcriptional regulator. Upon Nfe2l2 silencing, the potential of DEX to mediate Sqstm1 gene downregulation was unaffected, whereas the capacity of CpdA to upregulate Sqstm1 was strongly attenuated (). The efficiency of Nr3c1 and Nfe2l2 silencing is depicted in Figure S3C.
Figure 2. CpdA induces while DEX suppresses a subset of NRF2-dependent genes in macrophages. (A) qPCR analysis of BMDMs treated with vehicle, 1 μM DEX, 10 μM CpdA and 100 ng/ml LPS for 6 h. Gene expression levels were normalized to Ppia/cyclophilin and Rn18s using qbase+ . Statistical analysis was done using two-way ANOVA and Dunnett’s test (*p < 0.05, **p < 0.01, ***p < 0.001, ****p < 0.0001, N = 4). NI, non-induced. (B) Immunoblotting of BMDMs treated with 1 μM DEX, 10 μM CpdA and 100 ng/ml LPS for 6 h. Densitometry was done using ImageJ. The SQSTM1 signal is normalized to ACTA1/actin. kDa, kilodaltons. (C) qPCR analysis of BMDMs treated with 1 μM DEX, 10 μM CpdA and 100 ng/ml LPS for 6 h after Nr3c1 and Nfe2l2 were knocked down for 50 h. Statistics by two-way ANOVA and Dunnett’s test (*p < 0.05, **p < 0.01, ***p < 0.001, ****p < 0.0001, N = 4, bars represent mean+ SEM). (D) qPCR analysis of BMDMs treated with 1 μM DEX, 10 μM CpdA and 10 μg/ml of the transcriptional inhibitor actinomycin D for 6 h. Statistics by two-way ANOVA and Dunnett’s test (**p < 0.01, ****p < 0.0001, N = 4). (E) Representative NFE2L2 (green) and NR3C1 (red) staining in BMDM cells after 1 h treatment with vehicle, 1 μM DEX, 10 μM CpdA and 100 ng/ml LPS (scale bar: 10 μm).
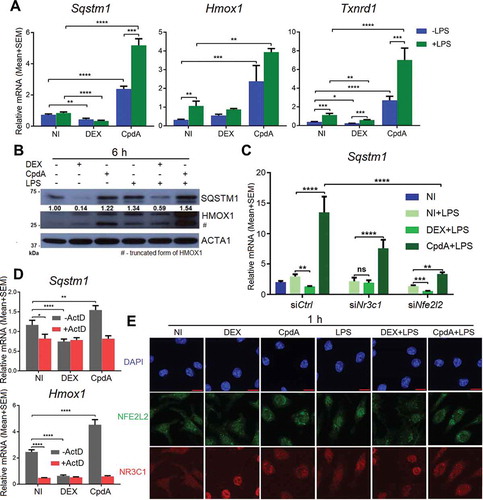
To evaluate the significance of novel mRNA synthesis to potentially explain the above-described differential gene regulation, we co-treated BMDM with the transcription inhibitor actinomycin D (ActD) and measured Sqstm1 and Hmox1 mRNA levels. shows that both for Sqstm1 and Hmox1, de novo mRNA synthesis was required to maintain mRNA levels under solvent only-treated conditions. In the presence of ActD, no additional changes in the amount of mRNA across treatments were observed, suggesting at least for CpdA the need for gene transcription and de novo mRNA synthesis to mediate the increase in Sqstm1 and Hmox1 mRNA levels ().
Using indirect immunofluorescence, we determined the subcellular localization of NR3C1 and NFE2L2 in response to CpdA and DEX treatment in BMDM. Only DEX induced complete nuclear accumulation of NR3C1 to the nucleus. DEX or CpdA treatment left the subcellular localization of NFE2L2 largely unhampered (). However, both CpdA and DEX did counteract the LPS-induced nuclear accumulation of NFE2L2 ().
We next asked whether the regulation by DEX and CpdA of Sqstm1 and typical NFE2L2-dependent genes would be similar for human macrophages. CpdA upregulated mRNA levels of SQSTM1, HMOX1, TXNRD1and NQO1 at least 2 fold in human THP-1 macrophages following a 6-h treatment under normal and inflammatory conditions. Again, DEX mainly decreased mRNA levels of these genes (Fig. S3E).
Together these findings suggest that in BMDM, DEX suppresses a subset of NFE2L2-dependent genes via a transcriptional mechanism in an NR3C1-dependent manner, while CpdA induces the same genes at least partially via an NFE2L2-dependent mechanism.
Glucocorticoids recruit NR3C1, whereas CpdA recruits NFE2L2 to the Sqstm1, Il6 and Il1b promoters in macrophages
To understand the mechanism behind the differential transcriptional regulation of Sqstm1 in response to classic GCs versus CpdA, we performed NR3C1, NFE2L2 and JUNB chromatin immunoprecipitation (ChIP) with subsequent qPCR analysis of the Sqstm1 promoter region in macrophages. Sqstm1 was recently shown to be a direct target of the transcription factor JUNB [Citation27]. Treatment with DEX resulted in NR3C1 recruitment concomitant with a partial release of NFE2L2 and JUNB from the Sqstm1 promoter in BMDM (, left panel). CpdA treatment did not recruit NR3C1, but substantially increased NFE2L2 binding (, left panel). As with DEX, CpdA also caused a partial release of JUNB binding. Taking into account a large divergence of NR3C1 binding events between human and murine macrophages [Citation28], to observe a quite similar above-described regulation at SQSTM1 and HMOX1 promoters also in human THP-1 macrophages is suggestive of conserved TF binding mechanisms (Fig. S4A, S4B). CpdA treatment resulted in increased occupancy of phospho-Ser2 POLR2/RNA polymerase II (p-POLR2) at SQSTM1 and HMOX1 genes in these cells, in line with increased transcriptional activity. In contrast, DEX treatment rather exhibited decreased p-POLR2 binding to these genes (Fig. S4C). In support of these findings, in silico analysis of human and murine TF binding sites present in ChIP-qPCR fragments, by using the JASPAR database, revealed strong and highly conserved JUNB- and NFE2L2-binding motifs both in human and murine Sqstm1 promoters (). Interestingly, the NFE2L2 motif resembles the JUNB motif, extended with 4 base pairs. Despite the presence of a NR3C1/GR binding event to the promoter region, the GRE motif was not retrieved, suggesting the possibility of a NR3C1 tethering mechanism. Strikingly, the above described transcription factor binding profile of NR3C1, NFE2L2 and JUNB at the Sqstm1 promoter in BMDMs remains the same even upon triggering inflammation with LPS (, right panel). Even more, the binding profiles are very similar at the promoters of the 2 studied inflammatory genes, Il6 and Il1b, with DEX treatment leading to NR3C1 recruitment and CpdA leading to NFE2L2 recruitment (). Both compounds behave similarly in terms of a decreased binding of JUNB. Despite the similar pattern of NFE2L2 recruitment upon CpdA treatment, the transcriptional output is different: at the Sqstm1 promoter this recruitment results in the induction of mRNA, whereas at Il6 and Il1b promoters it leads to the suppression of mRNA transcription ().
Figure 3. DEX recruits NR3C1 whereas CpdA recruits NFE2L2 to Sqstm1, Il6 and Il1b promoters. BMDMs were treated with vehicle, 1 μM DEX, 10 μM CpdA and 100 ng/ml LPS for 1 h. Recruitment of NR3C1, JUNB and NFE2L2 to (A) Sqstm1 or (C) Il6 and Il1b promoters was measured using qPCR after immunoprecipitation with the respective antibodies. Normal rabbit IgG (pool of chromatin from NI, DEX and CpdA treatments) served as a negative control. Statistical analysis was done using two-way ANOVA and Dunnett’s test (*p < 0.05, **p < 0.01, ***p < 0.001, ****p < 0.0001, N = 3 or 4, bars represent mean+ SEM). NI, non-induced. (B) in silico analysis of murine and human Sqstm1 promoter binding sites from ChIP-qPCR using JASPAR database (jaspar.genereg.net). (D) qPCR analysis of BMDMs treated with vehicle, 1 μM DEX, 10 μM CpdA and 100 ng/ml LPS for 6 h. Gene expression levels were normalized to Ppia/cyclophilin and Gapdh using qbase+ . Statistical analysis was done using one-way ANOVA and Dunnett’s test (**p < 0.01, ***p < 0.001, ****p < 0.0001, N = 5) .
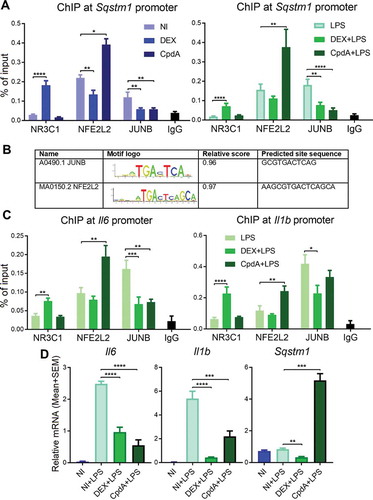
Taken together, DEX and CpdA recruit NR3C1 and NFE2L2 respectively, to the Sqstm1, Il6 and Il1b promoters, there replacing JUNB. These transcriptional events result in the suppression of Il6 and Il1b by both compounds, but lead to the induction of Sqstm1 upon CpdA, or its suppression upon DEX, treatment.
Both DEX and CpdA induce autophagy in BMDMs
Because the main known role of SQSTM1 in cells is its involvement in autophagy as a cargo receptor, we studied the regulation of autophagy by DEX and CpdA in macrophages. First, we determined mRNA expression of different autophagy-related genes (). Becn1 and Atg10 were not regulated by any treatment. According to the mass spectrometry analysis, the ATG5 protein was significantly suppressed by DEX in the non-LPS condition (Fig. S2A). This was confirmed both at the mRNA level () and protein level ( lane 5). Strikingly, at the protein but not at the mRNA level () CpdA treatment decreased ATG5 in basal and inflamed conditions (, lane 6 and 9 vs lane 4). Map1lc3b mRNA was modestly upregulated by both DEX and CpdA treatments (). Intriguingly, LPS treatment suppressed overall mRNA levels of Map1lc3b and Atg7, regardless of additional treatments. LPS enhanced mRNA levels of the mitophagy receptor Optn [Citation29], whereas DEX and CpdA both suppressed this enhancement back to basal levels ().
Figure 4. DEX and CpdA induce autophagy in macrophages. (A) qPCR analysis of BMDM treated with vehicle, 1 μM DEX, 10 μM CpdA and 100 ng/ml LPS for 6 h. Gene expression levels were normalized to Ppia/cyclophilin and Gapdh using qbase+ . Statistical analysis was done using two-way ANOVA and Dunnett’s test (*p < 0.05, **p < 0.01, ***p < 0.001, ****p < 0.0001, N = 4). NI, non-induced. (B, C) Immunoblotting of BMDM treated with 1 μM DEX, 10 μM CpdA and 100 ng/ml LPS for 15 min, 1 h, 2 h and 6 h. ACTA1/actin served as a loading control. kDa, kilodaltons. (D) Representative SQSTM1 (red) imaging in BMDM cells after 6-h treatment with vehicle, 1 μM DEX, 10 μM CpdA and 100 ng/ml LPS (scale bar: 10 μm). (E) Ultrastructural investigation of BMDM by TEM after 2-h treatment with 1 μM DEX, 10 μM CpdA and 100 ng/ml LPS. Autophagic phenotypes upon DEX treatment were characterized by the presence of myelin-like structures and autophagosomes. Autophagic phenotypes upon CpdA treatment were characterized by a strong vacuolization and presence of autophagosomes. V, vacuoles; MLS, myelin-like structures; AP, autophagosomes. (F) qPCR analysis of BMDMs treated with 1 μM DEX, 10 μM CpdA and 100 ng/ml LPS for 6 h after Sqstm1 was knocked down for 50 h. Statistical analysis was done using two-way ANOVA and Dunnett’s test (*p < 0.05, **p < 0.01, ***p < 0.001, ****p < 0.0001, N = 6). .
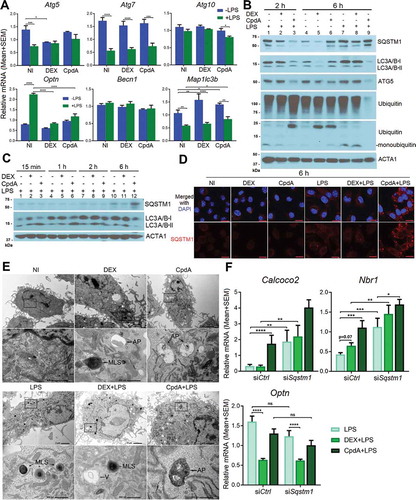
Western blot analysis demonstrated that already upon 15 min of CpdA administration combined with LPS, the levels of the lipidated form of MAP1LC3A/B (LC3A/B-II) were increased (, lane 3 versus 1). Depletion of the cytoplasmic form of LC3A/B (LC3A/B-I) was observed after 1 h and 2 h treatment (, lanes 6 and 9) leading to the decrease of both LC3A/B bands at 6 h (, lane 12). Ubiquitination of all proteins and depletion of monoubiquitin was further apparent at 2 h of CpdA plus LPS treatment (, lane 3), followed by depletion of ubiquitinated proteins at 6 h (, lane 9). SQSTM1 protein upregulation by CpdA with LPS was less prominent as compared to the fold changes detected at the mRNA level () possibly because of an additional elimination process by ongoing autophagy (, lane 9). In line herewith, immunofluorescence analysis revealed that LPS enhanced formation of SQSTM1-associated puncta, which were even more pronounced upon adding CpdA (). DEX treatment combined with LPS was also consistent with an autophagy-supporting pattern (, lane 8) at 2 h. At 6 h of DEX treatment, a depletion of LC3A/B was clearly observed, yet only in the absence of LPS (, lane 5 and lane 8).
Ultrastructural investigation of BMDM by transmission electron microscopy (TEM) revealed autophagic phenotypes [Citation30] upon 2-h DEX treatment, characterized by the presence of myelin-like structures and autophagosomes (, upper panels). Autophagic subcellular phenotypes upon 2-h CpdA treatment were rather characterized by a strong vacuolization additional to the presence of autophagosomes. Adding LPS led to a strong increase in the amount of myelin-like structures, but was less prominent when combined with CpdA (, lower panels). Strikingly, in human THP-1 macrophages we failed to consistently pick up autophagy induction by CpdA, in contrast to DEX treatment, which was able to induce autophagy (Fig. S5, S6). One explanation may be that for THP-1 differentiation PMA was used, which is a known regulator of autophagy [Citation31] that might thus interfere with the regulation of particular compound-induced autophagy processes in our experimental conditions.
In conclusion, we showed that DEX and CpdA induce autophagy in both basal and LPS-treated BMDMs.
Knockdown of SQSTM1 selectively enhances the expression of LPS-stimulated autophagy receptors in BMDM
As shown above, DEX induces autophagy (, , ) while decreasing the autophagy receptors Sqstm1 and Optn at the transcriptional level, in the presence of LPS (, ). This led us to hypothesize that a conserved mechanism of maintaining autophagy receptor balance might exist. To compare the impact of DEX-downregulated versus CpdA-induced SQSTM1 protein levels on the autophagy receptor balance in inflamed macrophages, the effect of CpdA or DEX on the expression of other autophagy receptors was studied following Sqstm1 knockdown.
demonstrates that knockdown of SQSTM1 in LPS-treated BMDM increased mRNA levels of the Nbr1 and Calcoco2/Ndp52 genes, but not of Optn. In analogy with the findings for Sqstm1 (), addition of CpdA, but not of DEX coincided with a further enhancement of Nbr1 and Calcoco2/Ndp52 autophagy receptor mRNA levels in LPS-induced BMDM, but not of Optn, which was rather suppressed by both compounds (). This result may point to a conserved but selective compensatory mechanism of autophagy receptor expression upon loss of SQSTM1 and emphasizes the ability of CpdA to stimulate, and DEX to downregulate, expression of particular autophagy receptors during LPS-triggered inflammation in BMDMs.
SQSTM1 is involved in CpdA-induced suppression of inflammation in macrophages
Anti-inflammatory properties of CpdA have extensively been demonstrated in in vitro and in vivo experiments, and CpdA has been shown to target NFKB, in analogy to GCs [Citation9–Citation13]. Because CpdA did not support NR3C1 translocation to the nuclei of BMDMs to the same extent as DEX, we wondered what potential alternative mechanism might be involved in the CpdA-mediated suppression of inflammation in BMDMs. Inhibition of the late stage of autophagy by chloroquine (CQ), i.e. inhibition of autolysosome degradation, did not impair the ability of DEX or CpdA to suppress these LPS-induced inflammatory markers (). Interestingly, CQ pretreatment rather increased overall CCL2 but decreased overall IL6 protein levels in the medium of BMDM cells, suggestive of an activating or inhibitory step of CQ on CCL2 or IL6 secretion, respectively.
Besides GR-mediated transrepression, also GR-mediated transactivation can contribute to resolve inflammatory processes. Hence, we measured the levels of typical GC-induced and trans-activated genes with anti-inflammatory properties, i.e. Tsc22d3 and Dusp1 [Citation32,Citation33]. Combinations with DEX, as expected, yielded the stronger response (). Dusp1 mRNA was enhanced with LPS (), in line with earlier described effects of pro-inflammatory stimuli on Dusp1 gene transcription [Citation34]. DEX-induced Tsc22d3 levels on the other hand, were suppressed by LPS (), an effect described before by the pro-inflammatory stimulus TNF as part of a glucocorticoid-resistance mechanism [Citation35]. Next, we determined to what extent DEX or CpdA was able to inhibit LPS-induced activated p-MAPK/ERK and p-MAPK/p38, as parts of upstream inflammatory signaling pathways (control of LPS-induced phosphorylation depicted in Figure S7C). Both DEX and CpdA were able to dephosphorylate LPS-activated MAPK/ERK but not MAPK/p38 (). In some cell types, induction of the NFKBIA/IκBα protein, the inhibitor of NFKB, was described as a potential anti-inflammatory mechanism of DEX [Citation36]. In the absence and presence of LPS, only DEX, but not CpdA, showed a slight upregulation of NFKBIA at 6 h ().
Figure 5. Sqstm1 knockdown partially abolishes CpdA-induced suppression of Ccl2 and Il6 genes. (A) CCL2 and IL6 ELISA from the medium of BMDMs after 30 min 10 μM chloroquine (CQ) pretreatment and then 6 h treatment with 1 μM DEX, 10 μM CpdA, 100 ng/ml LPS and 10 μM CQ for 6 h. (N = 3). NI, non-induced. (B) qPCR analysis of BMDMs treated with 1 μM DEX, 10 μM CpdA and 100 ng/ml LPS for 6 h. (C, D) Immunoblotting of BMDM treated with 1 μM DEX, 10 μM CpdA and 100 ng/ml LPS for 15 min, 30 min or 6 h. ACTA1/actin served as a loading control. kDa, kilodaltons. (E) qPCR analysis of BMDMs treated with 1 μM DEX, 10 μM CpdA and 100 ng/ml LPS for 6 h after Sqstm1 and Nr3c1 were knocked down for 50 h. Gene expression levels were normalized to Ppia/cyclophilin and Gapdh using qbase+ . Statistical analysis was done using one two-way ANOVA and Dunnett’s test (A, B, E) (*p < 0.05, **p < 0.01, ***p < 0.001, ****p < 0.0001, N = 4 or 5) .
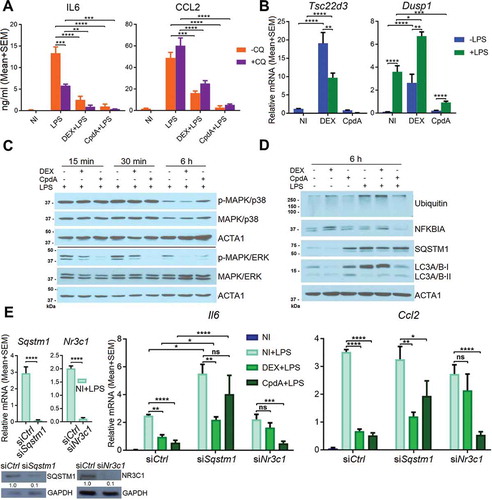
We wondered whether the possible cyclic events of a SQSTM1 up- or downregulation could contribute or not to the anti-inflammatory effects of CpdA as compared to DEX. Hence, we studied to what extent SQSTM1, NR3C1 and HMOX1 are involved in either DEX- or CpdA-induced repression of inflammatory gene expression, using siRNA silencing. As expected, Nr3c1 silencing diminished the anti-inflammatory properties of DEX. In contrast to earlier findings in A549 cells [Citation37], but in line with data in dendritic cells [Citation15], NR3C1 silencing did not affect the ability of CpdA to suppress Il6 and Ccl2 mRNA. In contrast, Sqstm1 silencing did impair the ability of CpdA to suppress LPS-induced Il6 and Ccl2 in BMDMs (). Knockdown of Hmox1 affected neither DEX- nor CpdA-induced suppression of inflammatory marker expression in BMDMs (Fig. S7D).
In summary, DEX-triggered suppression of LPS-induced inflammation in BMDMs was disrupted upon silencing of Nr3c1, while the anti-inflammatory abilities of CpdA were substantially ablated only when Sqstm1 was silenced.
CpdA induces a subset of stress response genes in vivo
To verify whether CpdA and DEX regulate mRNA expression in macrophages similarly in vivo as in vitro, mice were injected intraperitoneally (i.p.) with vehicle, DEX or CpdA in combination with LPS for 6 h. Peritoneal macrophages were isolated and sorted via FACS, followed by mRNA isolation. Upregulation of Hsp1a1 mRNA served as a positive control for CpdA [Citation38] (). Just as in primary BMDMs, also in peritoneal macrophages DEX, but not CpdA, enhanced the anti-inflammatory gene Tsc22d3. In contrast to the basal condition, in which both compounds increased Map1lc3b mRNA (Fig. S8), in LPS-treated mice only CpdA upregulated this gene. In vivo CpdA treatment induced, whereas DEX treatment decreased, levels of Sqstm1 and Hmox1 genes, completely in line with the in vitro results in BMDMs (). Both compounds significantly suppressed LPS-induced Il6 and Ccl2 mRNA in peritoneal macrophages, confirming their anti-inflammatory potential on this cell type in vivo.
Figure 6. The regulation of a subset of stress response genes by CpdA and DEX in acutely inflamed peritoneal macrophages in vivo. qPCR analysis of FACS-sorted peritoneal macrophages. Mice were treated i.p. with vehicle, 2 mg/kg DEX, 15 mg/kg CpdA and 1 mg/kg LPS for 6 h. Gene expression levels were normalized to Ppia/cyclophilin and Gapdh using qbase+ . Statistical analysis was done using a Mann-Whitney test (*p < 0.05, **p < 0.01, N = 5–7). NI, non-induced.
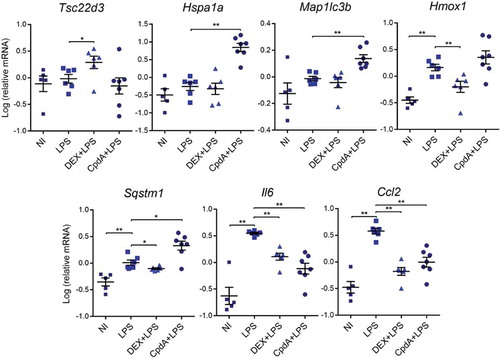
Figure 7. The model of NFE2L2- and NR3C1-dependent transcriptional regulation of SQSTM1 following CpdA and DEX and its link to autophagy and inflammation in macrophages. CpdA supports recruitment of NFE2L2 and a transcriptional, NR3C1-independent, upregulation of a subset of NFE2L2 pathway genes. One of those, encoding SQSTM1, is involved in CpdA-mediated suppression of inflammation. Oppositely, NFE2L2 recruitment at Il6 and Il1b promoters results in the downregulation of these genes. DEX mediates NR3C1-dependent transcriptional suppression of Il6 and Il1b genes as a main driver of its potent anti-inflammatory properties, yet is assisted by the upregulation of anti-inflammatory genes and the stabilization of NFKBIA/IκBα. The above-described transcriptional events result in a release of the transcription factor JUNB. Both compounds are able to induce autophagy with slightly different characteristics. CpdA leads to stronger ubiquitination of proteins at early time points, linking to aggregate-autophagy receptor binding [Citation52]. Ub. cargo, ubiquitinated cargo; yellow lines depict activation or suppression by CpdA; red lines depict activation or suppression by DEX; black and gray arrows depict movement and sequence of events.
![Figure 7. The model of NFE2L2- and NR3C1-dependent transcriptional regulation of SQSTM1 following CpdA and DEX and its link to autophagy and inflammation in macrophages. CpdA supports recruitment of NFE2L2 and a transcriptional, NR3C1-independent, upregulation of a subset of NFE2L2 pathway genes. One of those, encoding SQSTM1, is involved in CpdA-mediated suppression of inflammation. Oppositely, NFE2L2 recruitment at Il6 and Il1b promoters results in the downregulation of these genes. DEX mediates NR3C1-dependent transcriptional suppression of Il6 and Il1b genes as a main driver of its potent anti-inflammatory properties, yet is assisted by the upregulation of anti-inflammatory genes and the stabilization of NFKBIA/IκBα. The above-described transcriptional events result in a release of the transcription factor JUNB. Both compounds are able to induce autophagy with slightly different characteristics. CpdA leads to stronger ubiquitination of proteins at early time points, linking to aggregate-autophagy receptor binding [Citation52]. Ub. cargo, ubiquitinated cargo; yellow lines depict activation or suppression by CpdA; red lines depict activation or suppression by DEX; black and gray arrows depict movement and sequence of events.](/cms/asset/b36cf1a1-b3fd-4fa3-89f3-a8923fadbc35/kaup_a_1495681_f0007_oc.jpg)
Discussion
Our findings add new insights to the current paradigm of NR3C1 functioning regarding classic and selective NR3C1 ligands and support the idea that mechanisms should be revised or extended [Citation23], depending on the cell types studied. We observed in BMDM that only GCs (DEX) but not CpdA, efficiently translocate NR3C1 to nuclei and consistently, that only GCs suppress LPS-induced inflammatory markers in a NR3C1-dependent manner. We demonstrate here for the first time that the selective NR3C1 modulator CpdA, characterized as such in other cell models, can activate a subset of NFE2L2-dependent genes, including Sqstm1, Hmox1, Nqo1 and Txnrd1, both in basal and inflammatory states in human and murine macrophages. In contrast, DEX treatment mainly supports suppression of NFE2L2-dependent genes, which is in line with recent findings in other cell types [Citation39,Citation40]. We confirmed that knockdown of Nr3c1 indeed abolished DEX-induced repression of the ARE-containing Sqstm1 gene. Although Nfe2l2 depletion lowered basal Sqstm1 mRNA expression, a further DEX-mediated suppression was still apparent. In contrast, Nfe2l2 knockdown substantially affected the capacity of CpdA to induce Sqstm1 mRNA, indicating a mechanism at least partially involving NFE2L2, rather than an NR3C1-controlled mechanism.
In line with our novel findings of a predominant NFE2L2-SQSTM1 involvement in CpdA’s action mechanism in macrophages, ChIP analysis demonstrated that only DEX treatment recruits NR3C1, whereas CpdA treatment supports NFE2L2 recruitment to the Sqstm1 promoter. Still, mechanistic parallels were also noted. For example, both DEX and CpdA treatment decreased the binding of JUNB to the Sqstm1 promoter. These data, together with an in silico analysis showing that NFE2L2 and JUNB share the same motif, propose that CpdA treatment may favor NFE2L2 over JUNB recruitment, at least in BMDM.
CpdA was demonstrated previously to suppress inflammatory markers both at the mRNA and the protein level in vitro and in vivo [Citation9–Citation13]. Anti-inflammatory properties of CpdA were further found to be also NR3C1-independent in bone marrow-derived dendritic cells (BMDCs) [Citation15]. In BMDCs, CpdA was shown to impair TLR4 signaling. Also in BMDMs, we confirm that CpdA may impair TLR4 signaling, at least at the level of MAPK/ERK. In the current study, we reveal that CpdA recruits NFE2L2 to transcriptionally upregulate the Sqstm1 gene and subsequently relies on the presence of functional SQSTM1 protein to mediate anti-inflammatory gene expression at least in BMDMs. We demonstrated that Sqstm1 silencing was indeed sufficient to increase Il6 gene expression and to efficiently counteract the anti-inflammatory properties of CpdA. This is in line with the findings that SQSTM1 is a broad negative regulator of cytokine expression in stimulated macrophages [Citation41]. Our data also complement a recent study showing that the upstream regulator NFE2L2 itself can repress Il6 and Il1b genes by direct binding to their promoters [Citation42]. The involvement of SQSTM1 in the regulation of different inflammatory proteins may be explained by its role in autophagy as a cargo receptor. In support hereof, Sqstm1 ablation prevents mitophagy and enhances NLRP3-inflammasome activation [Citation24] via a mechanism operating at the protein level. In contrast and in addition, we discovered that SQSTM1 is necessary for CpdA-mediated suppression of Il6 and Ccl2 at the transcriptional level, and not dependent on later stages of the autophagy process, because pharmacological blocking with chloroquine failed to impair CpdA-induced proinflammatory gene suppression. The fact that CpdA strongly induced SQSTM1 and increased overall protein ubiquitination, could point to a role for the early stages of SQSTM1-ubiquitinated protein aggregate formation in suppression of inflammation upon CpdA treatment. In support of this, Sergin et al. demonstrated that in macrophages the sequestration of ubiquitinated proteins by SQSTM1 appears to be a protective response in minimizing inflammation [Citation43]. Paradoxically, the accumulation of SQSTM1 can also activate NFKB via its TRAF6 binding motif [Citation44] and positively regulate chemokine expression in keratinocytes [Citation45], suggesting that the role of SQSTM1 is not always purely anti-inflammatory but may depend on other contextual factors and/or the cell type.
Although DEX treatment led to a decrease in SQSTM1 at the protein and mRNA levels, it still possessed potent anti-inflammatory properties in BMDMs. Contributing DEX-triggered NR3C1-dependent anti-inflammatory mechanisms included NR3C1 binding to the promoters of Il6 and Il1b, upregulation of anti-inflammatory genes (Dusp1, Tsc22d3) and stabilization of NFKBIA/IκBα. In contrast, CpdA did not exhibit these features. Instead it strongly induced SQSTM1 as an alternative mechanism towards its anti-inflammatory properties. Despite this differential regulation of SQSTM1 by DEX and CpdA, both compounds were able to induce autophagy in BMDMs. However, CpdA-triggered autophagy occurred earlier in time (LC3A/B-II upregulation) and with a slightly different morphology (stronger vacuolization). Intriguingly, except for the prominent transcriptional upregulation of the autophagy receptor Sqstm1 by CpdA treatment, the above-mentioned autophagy induction by neither DEX nor CpdA was supported by a strong transcriptional upregulation of key autophagy genes – Becn1, Atg5, Atg7 and Atg10. Oppositely, CpdA rather decreased the level of one of the upstream regulators of the autophagy machinery at the protein level, ATG5. Perhaps an earlier described physical interaction between SQSTM1 and ATG5 [Citation46] could explain degradation of ATG5 together with SQSTM1. The interaction with upstream autophagy activators brings the importance of autophagy receptor regulation to another level. In addition to the observation that CpdA transcriptionally induced autophagy receptors Sqstm1, Nbr1 and Calcoco2 in the inflamed BMDMs, we also showed that ablation of SQSTM1 increased levels of Nbr1 and Calcoco2, but not of Optn. This result may point to the existence of a possible selective mechanism maintaining autophagy receptor balance in macrophages.
Despite a vast interest in SQSTM1 due to its role in autophagy and its association with a number of pathologies [Citation47] there is little information about the nuclear localization of SQSTM1 and its role in the nuclear compartment. It was reported that SQSTM1 shuttles between the nucleus and cytoplasm and can be found in nuclear promyelocytic leukemia bodies [Citation48]. Using ChIP, we tested the hypothesis that SQSTM1 might be present at the promoters of the Il6 and Il1b genes in LPS-treated BMDM; however, we failed to detect such recruitment to the transcriptional machinery (data not shown), where NR3C1 and NFE2L2 recruitments were detected ().
In summary, we here reported on a novel mechanism by which CpdA mitigates macrophage inflammation; i.e. not via NR3C1 but via the transcriptional upregulation of the SQSTM1 protein (). Our data imply that the search for safer anti-inflammatory compounds might benefit from compounds that contain inflammatory processes not only via selective triggering of NR3C1, but also via a direct transcriptional upregulation of the autophagy receptor SQSTM1.
Materials and methods
Materials
Poly-L-lysine (P4832), dexamethasone/DEX (D4902-25MG), rabbit anti-ACTA1 (A2066) and rabbit anti-SQSTM1 (P0067) were purchased from Sigma. CpdA was synthesized according to the protocol described previously [Citation49]. Chloroquine (sc-205,629), rabbit anti-NR3C1 (sc-8992x), mouse anti-LC3A/B (sc-398,822), rabbit anti-NFE2L2 (sc-13,032), rabbit anti-NFKBIA (C-21) and normal rabbit IgG (sc-2027) were from Santa Cruz Biotechnology. Horseradish peroxidase (HRP)-coupled secondary anti-rabbit (111–035-144) and anti-mouse (115–035-146) antibodies were purchased from Jackson ImmunoResearch. Rabbit anti-JUNB (C37F9), rabbit anti-ATG5 (2630), rabbit anti-p-MAPK/ERK (9101), mouse anti-MAPK/ERK (L34F12), mouse anti-p-MAPK/p38 (L28B10) and rabbit anti-MAPK/p38 (9212) were purchased from Cell Signalling Technology. Rabbit anti-HMOX1 (SPA-896) antibodies were from StressGen. Mouse anti-ubiquitin (VU-0101) antibodies were purchased from LifeSensors. Protein A Sepharose beads (17–5138-01) were from GE Healthcare Life Sciences. RNAse A (740,505) was from Macherey-Nagel. Proteinase K (19,131) was from Qiagen. LPS (tlrl-eklps) was purchased from Invivogen.
Cell culture
Mouse bone marrow-derived macrophages were isolated from 8- to 12-week-old male wild-type C57BL/6 mice. Leg bones were washed with 70% ethanol and twice with ice-cold, sterile phosphate-buffered saline (PBS; Gibco, 14,190–094). After washing, bones were gently smashed using a pestle in a mortar containing 10 ml ice-cold, sterile PBS. Bone marrow was filtered through a 70-μm cell strainer and centrifuged (400 g, 7 min, 4°C). Cells were resuspended in 2 ml of RBC osmotic lysis buffer (155 mM NH4Cl, 10 mM KHCO3, 0.1 mM EDTA, pH 7.3) for 2 min followed by washing with PBS. After centrifugation under the same condition (400 g, 7 min, 4°C), cells were filtered again and seeded for 7 days differentiation in DMEM (Gibco, 41,966–029) supplemented with 10% fetal calf serum, 0.55% gentamycin and 50 ng/ml recombinant CSF1/M-CSF (VIB Protein Service Facility, L00810). The medium was refreshed every 2–3 days. Cells were maintained in a 5% CO2 humidified atmosphere at 37°C.
Sample preparation and LC-MS/MS
Approximately 600,000 BMDM cells from each treatment were pelleted by centrifugation (400 g, 5 min, 4°C) and washed with cold PBS. The cell pellets were resuspended in lysis buffer (8 M urea [Sigma, U5378] in 20 mM HEPES, pH 8.0) and lysed using a microtip sonicator (15 W output, 3 bursts of 15 sec, cooling on ice in between bursts). The lysates were cleared by centrifugation (20,000 g, 15 min at room temperature [RT]). S-reduction and S-alkylation of the Cys residues was performed by adding DTT (Sigma, D0632; final concentration 15 mM, 30 min at 55°C) and IAA (Sigma, 57,670; final concentration 30 mM, 15 min at RT in the dark), respectively. The protein concentration was determined by the Bradford assay and 250 µg of protein material was isolated from each sample, which was then diluted 2-fold (to 4 M urea) and pre-digested with 2.5 µg endoproteinase Lys-C (WAKO, 129–02541; 1:100 [w:w] ratio, 2 h at 37°C) before diluting further to 2 M urea for overnight digestion with 5 µg trypsin (Promega, V5111; 1:50 [w:w] ratio, 37°C). The resulting peptide mixtures were purified on Sampli-Q C18 columns (Agilent, 5982–1111), dried completely and then resuspended in 20 µL of loading solvent A (0.1% TFA in water:acetonitrile, 2:98 [v:v]), from which 2 µL was used to determine the peptide concentration (Lunatic, Unchained Labs). An aliquot of the peptide material (3 µg) from each sample was introduced into an LC-MS/MS system through a tandem configured Ultimate 3000 RSLC nano LC (Thermo Scientific, Germany) in-line connected to an LTQ-Orbitrap Elite (Thermo Fisher Scientific, Germany). The sample mixture was first loaded on a trapping column (made in-house, 100-µm internal diameter x 20-mm length, 5-µm beads C18 Reprosil-HD, Dr. Maisch). After flushing from the trapping column, the sample was loaded on a reverse-phase column (made in-house, 75-μm internal diameter x 400-mm length, 1.9-µm beads C18 Reprosil-HD, Dr. Maisch). Peptides were loaded with loading solvent A and were separated with a non-linear gradient from 98% solvent A (0.1% formic acid in water) to 56% solvent B (0.1% formic acid in water:ACN 20:80 [v:v]) at a flow rate of 250 nl/min followed by a 10 min wash reaching 99% solvent B. The mass spectrometer was operated in a data-dependent mode, positive ionization mode, automatically switching between MS and MS/MS acquisition for the 20 most abundant peaks in a given MS spectrum. The source voltage was 3.5 kV, and the capillary temperature was 275°C. In the LTQ-Orbitrap Elite, full scan MS spectra were acquired in the Orbitrap (m/z 300−2 000, AGC target 3,000,000 ions, maximum ion injection time 100 ms) with a resolution of 60,000 (at 400 m/z). The 20 most intense ions fulfilling predefined selection criteria (AGC target 5,000 ions, maximum ion injection time 20 ms, spectrum data type: centroid, exclusion of unassigned and 1 positively charged precursors, dynamic exclusion time 20 sec) were then isolated in the linear ion trap and fragmented in the high-pressure cell of the ion trap. The CID collision energy was set to 35 V and the polydimethylcyclosiloxane background ion at 445.120028 Da was used for internal calibration (lock mass). Column temperature was kept constant at 50°C.
LC-MS/MS data analysis
Data searching was done with the MaxQuant software (v 1.6.0.16) using the Andromeda search engine with default search settings including a false-discovery rate (FDR) set at 1% on both the peptide and protein level. Spectra were searched against the mouse proteins in the UniProt database (September 2017 database release, www.uniprot.org). The mass tolerance for precursor and fragment ions was set to 20 ppm and 4.5 ppm, respectively, during the main search. Enzyme specificity was set to C-terminal of Arg and Lys residues, even when they were followed by a Pro residue, with a maximum of 2 missed cleavages. Variable modifications were set to oxidation of methionine residues and protein N-terminal acetylation. A minimum of 1 peptide was required for identification, and matching between runs was allowed using a 2-min time window and a 20-min alignment window. Proteins were quantified by the MaxLFQ algorithm integrated in the software and a minimum ratio count of 2 unique or razor peptides was required for quantification. Downstream data analysis was performed with the Perseus software (v.1.6.0.7) using the ProteinGroup.txt file from a MaxQuant database search. Proteins that were only identified by site and reversed database hits were removed as well as potential contaminants. The protein LFQ intensities were log2 transformed to obtain a normal distribution, and the replicate samples were grouped by their treatment. For each comparison the concerning groups were isolated and filtered for at least 3 valid values in at least 1 group. The missing values were input with values from the lower part of the normal log2 transformed LFQ distribution, representing the detection limit. Multiple 2-sample t-tests were performed, each with a permutation-based FDR of 0.05 and S0 of 0.1 for truncation with a total of 1,000 randomizations. The results were visualized as volcano plots.
In vivo experiments and FACS analysis
Experiments were approved by the animal ethics committee of the Faculty of Medicine and Health Sciences at the University of Ghent (code dossiers 14/84 and 17/13). Mice were purchased at Charles River. Male 8- to 12-week-old wild-type C57BL/6 mice were intraperitoneally injected with vehicle, 2 mg/kg dexamethasone (DEX) or 15 mg/kg CpdA in combination with 1 mg/kg LPS. Six h later, mice were sacrificed and peritoneal cavities were lavaged with 5 mL PBS containing 0.1 mM EDTA. All samples contaminated with an exaggerated number of erythrocytes were excluded from the analysis. To determine the cellular composition of peritoneal lavage fluids, cells were stained with antibodies against ADGRE1/F4/80 (eBioscience, 13–4801-85), MHC class II (eBioscience, 47–5321-82), CD19 (eBioscience, 15–0193-83), CD3 (eBioscience, 15–0031-83), LY76/Ter119 (eBioscience, 15–5921-82), FCGR1/CD64 (Biolegend, 139,311), SIGLECF (BD Biosciences, 552,126), LY6G (BD Biosciences, 551,460), ITGAM/CD11b (BD Biosciences, 560,455) and streptavidin (BD Biosciences, 563,260). Dead cells were always excluded from the analysis using the fixable viability dye eFluor506 (eBioscience, 65–0866-18). Acquisition of multicolor samples and cell sorting was done on an Aria II flow cytometer (BD Biosciences). Analysis and graphic output were performed with FlowJo software (Tree Star).
ChIP
ChIP assays were performed as described previously [Citation50]. In brief, BMDM were plated on 15-cm dishes. Stimulation was done for 1 h with ethanol, 1 μM DEX or 10 μM CpdA. Proteins were cross-linked to DNA for 10 min using 1% formaldehyde and the cross-linking reaction was stopped by adding glycine to a final concentration of 0.125 mM. Cells were scraped in ice-cold PBS, washed twice and lysed with 500 μl of lysis buffer (0.1% SDS [Merck, 8,170,341,000], 1% Triton X-100 [Sigma, X100], 0.15 M NaCl, 1 mM EDTA, 20 mM Tris-HCl pH 8) supplemented with protease inhibitor cocktail (Pierce, 88,265) and sonicated 30x (30s on/30s off, high intensity) using a Bioruptor sonicator (Diagenode) at 4°C. Insoluble material was removed by centrifugation (20 min, 20,000 g, 4°C). For each immunoprecipitation, 100 μl of chromatin was diluted 4 times with incubation buffer (0.15% SDS, 1% Triton X-100, 0.15 M NaCl, 1 mM EDTA, 20 mM HEPES pH 7.4), mixed with 5 µg of antibodies to NR3C1, NFE2L2, JUNB or normal IgG antibodies and incubated for 2 h at 4°C with rotation. Protein A Sepharose beads slurry (40 µl per each immunoprecipitation; GE Healthcare Life Sciences, 17–5138-01) were washed twice and blocked in incubation buffer with 1 μg/μl BSA (Sigma, A8806; 2 h, 4°C with rotation). Diluted chromatin samples were mixed with a protein A Sepharose solution and incubated overnight at 4°C with rotation. The next day, beads were washed twice in wash buffer 1 (0.1% SDS, 0.1% NaDOC [Sigma, D6750], 1% Triton X-100, 0.15 M NaCl, 1 mM EDTA, 20 mM HEPES pH 7,4), once in wash buffer 2 (0.1% SDS, 0.1% NaDOC, 1% Triton X-100, 0.5 M NaCl, 1 mM EDTA, 20 mM HEPES pH 7.4), once in buffer 3 (0.25 M LiCl, 0.5% NaDOC, 0.5% NP-40 [Calbiochem, 492,016], 1 mM EDTA, 20 mM HEPES pH 7.4) and twice in wash buffer 4 (1 mM EDTA, 20 mM HEPES pH 7.4). Protein-DNA complexes were eluted in 200 μl (1% SDS + 0.1 M NaHCO3) at room temperature and cross-links were reversed at 65°C overnight by adding 8 μl of 5 M NaCl, together with 8 μl of 0.5 mg/ml RNAse A and 10 μl of 20 mg/ml Proteinase K. DNA was purified with a QIAquick PCR purification kit (Qiagen, 28,106) according to the user’s manual. Precipitated DNA was analyzed by qPCR. Primer sequences used for ChIP-qPCR analysis are listed in Table S1.
Gene silencing
siCtrl (D-001810–10-05), mouse ON-TARGET siSqstm1 (M-047628–01-0005), siNfe2l2 (J-040766–05-0005) and siNr3c1 (L-045970–01-0005) were ordered from Dharmacon and used at 28 nM final concentration. Genes were silenced for 50 h using the VIROMER Green kit (Lipocalyx, VG-01LB) according to the manual.
qPCR and ChIP-qPCR
RNA was isolated with the RNeasy purification kit (Qiagen, 74,106) according to the user’s manual. cDNA was synthesized with a PrimeScript kit (Takara, 6110B). qPCR was performed using Light Cycler 480 SYBR Green I Master Mix (Roche, 04887352001). The full primer list is provided in Table S1. qPCR data were normalized and quantified relative to the 2 most stable reference genes with qbase+ [Citation51].
Immunofluorescence
BMDM cells were seeded on poly-L-lysine coated µ-Slide 8 Well chambers (Ibidi, 80,826) and treated with EtOH, 1 μM DEX, 10 μM CpdA and 100 ng/ml LPS. Cells were washed with PBS and fixed with 4% paraformaldehyde for 15 min at room temperature. After 3 washes with PBS (5 min each), cells were permeabilized with ice-cold methanol for 20 min followed by incubation with blocking buffer (4.5 mM Na2HPO4, 15.5 mM NaH2PO4, 100 mM NaCl, 0.23% TX-100, 10% donkey serum [Jackson ImmunoResearch, 017–000-121]). Cells were incubated overnight at 4°C with rabbit anti-SQSTM1 (1:500), mouse anti-NR3C1 (1:500; Santa Cruz Biotechnology, G-5) or rabbit anti-NFE2L2 (1:300). After 3 washes with PBS, cells were stained with rabbit Alexa Fluor 568 (Invitrogen, A10042) and mouse Alexa Fluor 488 (Invitrogen, A21202) antibodies together with 260 nM DAPI for 45 min at room temperature. Cells were washed 3 times in washing buffer (blocking buffer without serum) and once with PBS. Mounting solution was added and slides were analyzed on an Olympus microscope (IX81) with Fluoview 1000 version 4.2 software.
Transmission electron microscopy
Cell cultures of mouse BMD macrophages were grown on glass cover slips and fixed in 4% paraformaldehyde and 2.5% glutaraldehyde in 0.1 M NaCacodylate buffer, pH 7.2 for 4 h at room temperature followed by fixation overnight at 4°C. After washing, cells were subsequently dehydrated through a graded ethanol series, including a bulk staining with 1% uranyl acetate at the 50% ethanol step followed by embedding in Spurr’s resin (EMS/Aurion, 14,300). Ultrathin sections of a gold interference color were cut using an ultra-microtome (Leica EM UC6), followed by a post-staining in a Leica EM AC20 for 40 min in uranyl acetate at 20°C, and for 10 min in lead stain at 20°C. Sections were collected on formvar-coated copper slot grids (Agar Scientific, AGG2500C). Grids were viewed with a JEM 1400plus transmission electron microscope (JEOL, Japan) operating at 60 kV.
Immunoblot analysis
Cells cultured in 6-well plates were solubilized in mRIPA buffer (50 mM Tris, pH 8, 200 mM NaCl, 0.5% NaDOC, 0.05% SDS, 1% NP-40, 2 mM EDTA) together with protease inhibitor cocktail (Roche, 11,873,580,001), 2 mM NaF and 1 mM Na3VO4. Total lysates were boiled 5 min at 95°C with 5x Laemmli buffer (0.156 M Tris, pH 6.8, 5% SDS, 25% glycerol, 5% β-mercaptoethanol) and resolved by 10% or 15% SDS-PAGE. Then transferred onto 0.45-µm nitrocellulose membranes (GE Healthcare, 10,600,016) and incubated with Blocking buffer (Thermo Scientific, 37,538), diluted with TBS (50 mM Tris, pH 7.5, 150 mM NaCl) in a 1:1 ratio. Subsequently, membranes were incubated with antibodies to SQSTM1 (1:2000), LC3A/B (1:1000), ACTA1 (1:4000), ATG5 (1:1000), HMOX1 (1:1000), p-MAPK/ERK and p-MAPK/p38 (1:1000), MAPK/ERK and MAPK/p38 (1:2000), NFKBIA (1:1000), and ubiquitin (1:2000) diluted in Blocking buffer-TBS containing 0.1% Tween 20 (Sigma, P7949; TBS-T). After washing in TBS-T, chemiluminescent detection was performed using HRP secondary antibodies (1:10,000; Jackson ImmunoResearch, 111–035-144, 115–035-146) and a chemiluminescent substrate kit (Thermo Scientific, 34,078). Densitometric analysis of western blot results was performed using ImageJ.
mRNA stability assay
BMDM cells were plated and treated with ethanol, 1 μM DEX and 10 μM CpdA for 6 h, with or without the transcription inhibitor actinomycin D (10 μg/ml; Life Technologies, 11,805,017). mRNA levels of Sqstm1 and Hmox1 were detected by qPCR.
ELISA
CCL2 and IL6 ELISA was performed on media from BMDM cells after 6 h induction with ethanol, 1 μM DEX or 10 μM CpdA in combination with 100 ng/ml LPS and 10 μM chloroquine (added 30 min prior to the induction with compounds) by using the ELISA MAXTM Standard (BioLegend, 432,702, 430,502), according to the manual.
Statistical analysis
Statistical analysis was performed using the GraphPad Prism software (version 7.02). Significant differences between groups were evaluated using one-way (1 factor with more than 2 groups) or two-way (2 factors) ANOVA with Dunnett’s test for multiple comparison (recommended for comparison treatments to solvent controls, marked as NI), which was found to be appropriate as groups displayed a normal distribution. Normality was tested with the D’Agostino-Pearson normality test. For comparison of 2 groups, a two-tailed t-test was used. When variances across groups were not equal, logarithmic transformation was applied prior to statistical analysis with the following back-transformation. In vivo experiments were analyzed using the Mann-Whitney test. Values are expressed as mean + SEM, and error bars were derived from biological replicates rather than technical replicates. p < 0.05 was considered statistically significant.
Abbreviations
| BMDM | = | bone marrow-derived macrophage |
| CCL2/MCP1 | = | chemokine (C-C motif) ligand 2 |
| CpdA | = | compound A |
| DEX | = | dexamethasone |
| DUSP1 | = | dual specificity phosphatase 1 |
| HMOX1 | = | heme oxygenase 1 |
| IL6 | = | interleukin 6 |
| MAP1LC3/LC3 | = | microtubule-associated protein 1 light chain 3 |
| NFE2L2/NRF2 | = | nuclear factor, erythroid derived 2, like 2 |
| NR3C1/GR | = | nuclear receptor subfamily 3, group C, member 1 |
| SQSTM1/p62 | = | sequestosome 1 |
| TSC22D3/GILZ | = | TSC22 domain family, member 3 |
Acknowledgments
We thank Michiel De Bruyne and Femke Baeke from VIB-UGent for the TEM samples preparation and Karima Bakkali for the work with the mice. Jarne Pauwels and Evy Timmerman from the VIB Proteomics Core for the MS analysis. Also, we thank Rudi Beyaert and Marie Lork (VIB-UGent, Inflammation Research center) for sharing antibodies, as well as Biserka Relic (GIGA institute, University of Liège) for useful discussions and for providing autophagy tools. This work was supported by UGent BOF grants B/13741/01, B/13453/01, FWO-Vlaanderen grant 1509718N and a grant from Les Amis des Instituts Pasteur à Bruxelles, asbl (scholarship V.M.).
Disclosure statement
No potential conflict of interest was reported by the authors.
Additional information
Funding
References
- Chatzidionysiou K, Emamikia S, Nam J, et al. Efficacy of glucocorticoids, conventional and targeted synthetic disease-modifying antirheumatic drugs: A systematic literature review informing the 2016 update of the EULAR recommendations for the management of rheumatoid arthritis. Ann Rheum Dis. 2017;76:1102–1107.
- Fardet L, Petersen I, Nazareth I. Monitoring of patients on long-term glucocorticoid therapy. Medicine (Baltimore). 2015;94:e647.
- Barnes PJ. Glucocorticosteroids. Handb Exp Pharmacol. 2016;237:93–115.
- Ratman D, Vanden Berghe W, Dejager L, et al. How glucocorticoid receptors modulate the activity of other transcription factors: A scope beyond tethering. Mol Cell Endocrinol. 2013;380:41–54.
- Desmet SJ, De Bosscher K. Glucocorticoid receptors: finding the middle ground. J Clin Invest. 2017;127:1136–1145.
- Meijsing SH. Mechanisms of glucocorticoid-regulated gene transcription. Adv Exp Med Biol. 2015;872:59–81.
- Hua G, Ganti KP, Chambon P. Glucocorticoid-induced tethered transrepression requires SUMOylation of GR and formation of a SUMO-SMRT/NCoR1-HDAC3 repressing complex. Proc Natl Acad Sci. 2016;113:E635–E643.
- Sundahl N, Bridelance J, Libert C, et al. Selective glucocorticoid receptor modulation: new directions with non-steroidal scaffolds. Pharmacol Ther. 2015;152:28–41.
- Gossye V, Elewaut D, Van Beneden K, et al. A plant-derived glucocorticoid receptor modulator attenuates inflammation without provoking ligand-induced resistance. Ann Rheum Dis. 2010;69:291–296.
- Dewint P, Gossye V, De Bosscher K, et al. A plant-derived ligand favoring monomeric Glucocorticoid receptor conformation with impaired transactivation potential attenuates collagen-induced arthritis. J Immunol. 2008;180:2608–2615.
- Lesovaya E, Yemelyanov A, Swart AC, et al. Discovery of Compound A - a selective activator of the glucocorticoid receptor with anti-inflammatory and anti-cancer activity. Oncotarget. 2015;6:30730–30744.
- Saksida T, Vujicic M, Nikolic I, et al. Compound A, a selective glucocorticoid receptor agonist, inhibits immunoinflammatory diabetes, induced by multiple low doses of streptozotocin in mice. Br J Pharmacol. 2014;171:5898–5909.
- Gavrila A, Chachi L, Tliba O, et al. Effect of the plant derivative Compound A on the production of corticosteroid-resistant chemokines in airway smooth muscle cells. Am J Respir Cell Mol Biol. 2015;53:728–737.
- De Bosscher K, Vanden Berghe W, Beck IME, et al. A fully dissociated compound of plant origin for inflammatory gene repression. Proc Natl Acad Sci USA. 2005;102:15827–15832.
- Barcala Tabarrozzi AE, Andreone L, Deckers J, et al. GR-independent down-modulation on GM-CSF bone marrow-derived dendritic cells by the selective glucocorticoid receptor modulator Compound A. Sci Rep. 2016;6:36646.
- Lu M-C, Ji J-A, Jiang Z-Y, et al. The Keap1-Nrf2-ARE pathway as a potential preventive and therapeutic target: an update. Med Res Rev. 2016;36:924–963.
- Dodson M, Redmann M, Rajasekaran NS, et al. KEAP1–NRF2 signalling and autophagy in protection against oxidative and reductive proteotoxicity. Biochem J. 2015;469:347–355.
- Jo C, Gundemir S, Pritchard S, et al. Nrf2 reduces levels of phosphorylated tau protein by inducing autophagy adaptor protein NDP52. Nat Commun. 2014;5:3496.
- Komatsu M, Kurokawa H, Waguri S, et al. The selective autophagy substrate p62 activates the stress responsive transcription factor Nrf2 through inactivation of Keap1. Nat Cell Biol. 2010;12:213–223.
- Jain A, Lamark T, Sjøttem E, et al. p62/SQSTM1 is a target gene for transcription factor NRF2 and creates a positive feedback loop by inducing antioxidant response element-driven gene transcription. J Biol Chem. 2010;285:22576–22591.
- Levine B, Mizushima N, Virgin HW. Autophagy in immunity and inflammation. Nature. 2011;469:323–335.
- He C, Klionsky DJ. Regulation mechanisms and signaling pathways of autophagy. Annu Rev Genet. 2009;43:67–93.
- Clark AR, Belvisi MG. Maps and legends: the quest for dissociated ligands of the glucocorticoid receptor. Pharmacol Ther. 2012;134:54–67.
- Zhong Z, Umemura A, Sanchez-Lopez E, et al. NF-κB restricts inflammasome activation via elimination of damaged mitochondria. Cell. 2016;164:896–910.
- Lavin Y, Mortha A, Rahman A, et al. Regulation of macrophage development and function in peripheral tissues. Nat Rev Immunol. 2015;15:731–744.
- Menegon S, Columbano A, Giordano S. The dual roles of NRF2 in cancer. Trends Mol Med. 2016;22:578–593.
- Sun X, Ou Z, Chen R, et al. Activation of the p62-Keap1-NRF2 pathway protects against ferroptosis in hepatocellular carcinoma cells. Hepatology. 2016;63:173–184.
- Jubb AW, Young RS, Hume DA, et al. Enhancer turnover is associated with a divergent transcriptional response to glucocorticoid in mouse and human macrophages. J Immunol. 2016;196:813–822.
- Lazarou M, Sliter DA, Kane LA, et al. The ubiquitin kinase PINK1 recruits autophagy receptors to induce mitophagy. Nature. 2015;524:309–314.
- Frank B, Marcu A, De Oliveira Almeida Petersen AL, et al. Autophagic digestion of Leishmania major by host macrophages is associated with differential expression of BNIP3, CTSE, and the miRNAs miR-101c, miR-129, and miR-210. Parasites and Vectors. 2015;8:404.
- Jiang H, Cheng D, Liu W, et al. Protein kinase C inhibits autophagy and phosphorylates LC3. Biochem Biophys Res Commun. 2010;395:471–476.
- Riccardi C. GILZ as a mediator of the anti-inflammatory effects of glucocorticoids. Front Endocrinol (Lausanne). 2015;6:1–6.
- Smallie T, Ross EA, Ammit AJ, et al. Dual-specificity phosphatase 1 and tristetraprolin cooperate to regulate macrophage responses to lipopolysaccharide. J Immunol. 2015;195:277–288.
- Lasa M, Abraham SM, Boucheron C, et al. Dexamethasone causes sustained expression of mitogen-activated protein kinase (MAPK) phosphatase 1 and phosphatase-mediated inhibition of MAPK p38. Mol Cell Biol. 2002;22:7802–7811.
- Van Bogaert T, Vandevyver S, Dejager L, et al. Tumor necrosis factor inhibits glucocorticoid receptor function in mice: a strong signal toward lethal shock. J Biol Chem. 2011;286:26555–26567.
- Auphan N, DiDonato JA, Rosette C, et al. Immunosuppression by glucocorticoids: inhibition of NF-kappaB activity through induction of IkappaB synthesis. Science. 1995;270:286–290.
- Reber LL, Daubeuf F, Plantinga M, et al. A dissociated glucocorticoid receptor modulator reduces airway hyperresponsiveness and inflammation in a mouse model of asthma. J Immunol. 2012;188:3478–3487.
- Beck IM, Drebert ZJ, Hoya-Arias R, et al. Compound A, a selective Glucocorticoid receptor modulator, enhances heat shock protein Hsp70 gene promoter activation. PLoS One. 2013;8:e69115.
- Ki SH, Cho IJ, Choi DW, et al. Glucocorticoid receptor (GR) -associated SMRT binding to C/EBPβ TAD and Nrf2 Neh4/5 : role of SMRT recruited to GR in GSTA2 gene repression. Mol Cell Biol. 2005;25:4150–4165.
- Alam MM, Okazaki K, Nguyen LTT, et al. Glucocorticoid receptor signaling represses the antioxidant response by inhibiting histone acetylation mediated by the transcriptional activator NRF2. J Biol Chem. 2017;292:7519–7530.
- Kim JY, Ozato K. The sequestosome 1/p62 attenuates cytokine gene expression in activated macrophages by inhibiting IFN regulatory factor 8 and TNF receptor-associated factor 6/NF-kappaB activity. J Immunol. 2009;182:2131–2140.
- Kobayashi EH, Suzuki T, Funayama R, et al. Nrf2 suppresses macrophage inflammatory response by blocking proinflammatory cytokine transcription. Nat Commun. 2016;7:11624.
- Sergin I, Bhattacharya S, Emanuel R, et al. Inclusion bodies enriched for p62 and polyubiquitinated proteins in macrophages protect against atherosclerosis. Sci Signal. 2016;9:1–14.
- Moscat J, Diaz-Meco MT. p62 at the crossroads of autophagy, apoptosis, and cancer. Cell. 2009;137:1001–1004.
- Zhang X, Jin JY, Wu J, et al. RNA-Seq and ChIP-Seq reveal SQSTM1/p62 as a key mediator of JunB suppression of NF-κB-dependent inflammation. J Invest Dermatol. 2015;135:1016–1024.
- Fracchiolla D, Sawa-Makarska J, Zens B, et al. Mechanism of cargo-directed Atg8 conjugation during selective autophagy. Elife. 2016;5:e18544.
- Katsuragi Y, Ichimura Y, Komatsu M. p62/SQSTM1 functions as a signaling hub and an autophagy adaptor. FEBS J. 2015;282:4672–4678.
- Pankiv S, Lamark T, Bruun JA, et al. Nucleocytoplasmic shuttling of p62/SQSTM1 and its role in recruitment of nuclear polyubiquitinated proteins to promyelocytic leukemia bodies. J Biol Chem. 2010;285:5941–5953.
- Louw A, Swart P, De KSS, et al. Mechanism for the stabilization in vivo of the aziridine precursor 2-(4-Acetoxyphenyl)-2-chloro-N-methyl-ethylammonium chloride by serum proteins. Biochem Pharmacol. 1997;53:189–197.
- Ratman D, Mylka V, Bougarne N, et al. Chromatin recruitment of activated AMPK drives fasting response genes co-controlled by GR and PPARα. Nucleic Acids Res. 2016;44:10539–10553.
- Hellemans J, Vandesompele J. Selection of reliable reference genes for RT-qPCR analysis. Methods Mol Biol. 2014;1160:19–26.
- Shaid S, Brandts CH, Serve H, et al. Ubiquitination and selective autophagy. Cell Death Differ. 2013;20:21–30.