
ABSTRACT
Missorting of MAPT/Tau represents one of the early signs of neurodegeneration in Alzheimer disease. The triggers for this are still a matter of debate. Here we investigated the sorting mechanisms of endogenous MAPT in mature primary neurons using microfluidic chambers (MFCs) where cell compartments can be observed separately. Blocking protein degradation pathways with proteasomal or autophagy inhibitors dramatically increased the missorting of MAPT in dendrites on the neuritic side, suggesting that degradation of MAPT in dendrites is a major determinant for the physiological axonal distribution of MAPT. Such missorted dendritic MAPT differed in its phosphorylation pattern from axonal MAPT. By contrast, enhancing autophagy or proteasomal pathways strongly reduced MAPT missorting, thereby confirming the role of protein degradation pathways in the polar distribution of MAPT. Dendritic missorting of MAPT by blocking protein degradation resulted in the loss of spines but not in overall cell toxicity. Inhibition of local protein synthesis in dendrites eliminated the missorting of MAPT, indicating that the accumulation of dendritic MAPT is locally generated. In support of this, a substantial fraction of Mapt/Tau mRNA was detected in dendrites. Taken together, our results indicate that the autophagy and proteasomal pathways play important roles in fine-tuning dendritic MAPT levels and thereby prevent synaptic toxicity caused by MAPT accumulation.
Abbreviations Ani: anisomycin; Baf: bafilomycin A1; BSA: bovine serum albumin; cAMP: cyclic adenosine monophosphate; CHX: cycloheximide; DMSO: dimethyl sulfoxide; DIV: days in vitro; Epo: epoxomicin; E18: embryonic day 18; FISH: fluorescence in situ hybridization; IgG: immunoglobulin; kDa: kilodalton; Lac: lactacystin; LDH: lactate dehydrogenase; MFC: microfluidic chambers; MAPs: microtubule-associated proteins; MAPT/Tau: microtubule-associated protein tau; PVDF: polyvinylidene difluoride; PBS: phosphate-buffered saline; PRKA: protein kinase AMP-activated; RD150: round device 150; RT: room temperature; SDS: sodium dodecyl sulfate; SEM: standard error of the mean; Wor: wortmannin.
Introduction
MAPT/Tau is a microtubule-associated protein that plays an important role in stabilizing microtubules [Citation1,Citation2]. Under physiological conditions, MAPT is mainly restricted to axons in mature neurons [Citation3,Citation4]. In Alzheimer disease, MAPT mislocates to somatodendritic compartments, which represents one of the early signs of neurodegeneration [Citation5]. Recent studies showed that the missorting of MAPT causes loss of dendritic spines and thus a decay of neuronal communication [Citation6–Citation8]. Remarkably, the accumulation of MAPT in dendrites represents a crucial step in Aβ-induced neurotoxicity [Citation6,Citation9–Citation11]. It is therefore important to explore how physiological sorting and pathological missorting of MAPT occurs.
The polarized distribution of MAPT in neurons has been proposed to be regulated at both the mRNA and protein level. At the mRNA level, Mapt/Tau mRNA was proposed to migrate into proximal axons, thus contributing to the axonal localization of MAPT [Citation12]. However, this view was controversial because Mapt/Tau mRNA was found in proximal dendrites as well [Citation13]. On the protein level, mechanisms suggested for the axonal localization of MAPT included: (1) differential turnover of MAPT in axons and in somatodendritic compartments; (2) tighter binding of MAPT to microtubules in axons than in dendrites [Citation14,Citation15]; (3) preferential axonal transport of MAPT soon after its synthesis in the cell body [Citation13]; (4) local translation of Mapt/Tau mRNA in the axons by an MTOR (mechanistic target of rapamycin kinase)-driven pathway [Citation16]; and (5) a retrograde diffusion barrier for MAPT at the axon initial segment [Citation17]. However, some of these proposals were based on observations of exogenous MAPT introduced into cultured neurons via microinjection or transfection, rather than observations of endogenous MAPT. Thus it remains uncertain whether the sorting of endogenous MAPT in neurons follows the same mechanisms as that of exogenous MAPT, given that the transfection and overexpression of exogenous MAPT itself results in missorting of both exogenous and endogenous MAPT via an unknown mechanism [Citation17]. In addition, the protein degradation systems (proteasome and autophagy) play important roles in preventing the abnormal accumulation of proteins in different cellular compartments, and both degradation systems are compromised in AD [Citation18]. However, to date, their influence on the distribution of MAPT has not been addressed systematically.
In this study, we investigated the sorting mechanisms of endogenous MAPT in cultured neurons using the MFC culture system which allows one to treat neuronal compartments separately, for example only at the distal parts of dendrites or axons [Citation19]. We found that the protein degradation systems – the proteasome and autophagy – play a pivotal role in endogenous MAPT distribution. Suppression of protein degradation led to missorting of MAPT whereas enhancing the pathways reduced MAPT missorting below basal levels. Such missorted dendritic MAPT was toxic to dendritic spines. Missorted MAPT was found to originate mainly from local protein synthesis in dendrites. Consistent with this, Mapt/Tau mRNA was detected in different neuronal compartments, with the majority in the soma, a smaller fraction in dendrites up to their distal regions. MAPT synthesized in different compartments was also differentially phosphorylated, suggesting distinct functional states.
Results
Reduction of dendritic MAPT leads to dominant distribution of axonal MAPT in developing neurons
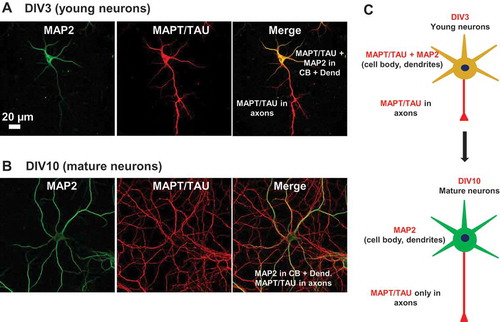
MAPT is mainly an axonal protein in mature neurons, but during different stages of neuronal polarization, MAPT displays a distinct distribution pattern. MAPT assumes a polarized axonal distribution after 7 to 10 days in culture [Citation3,Citation13]. In order to confirm this for our experimental conditions, we examined the distribution of MAPT in neurons at different stages of development. In young neurons (a representative image at 3 days in vitro [DIV3] is shown in ), schematic in ), top), MAPT protein is ubiquitously expressed in all cellular compartments. Starting from DIV7, the staining of MAPT becomes progressively weaker in the somatodendritic compartment. Axonal localization becomes prominent at approximately DIV10 (, schematic in ), bottom). At more mature ages (DIV14 – DIV21), MAPT localization is mainly found in the axons with only basal levels in the somatodendritic compartment, consistent with earlier findings [Citation20]. Taken together, these results highlight that the polarized distribution of MAPT actually results from its increase in the axon plus its decrease in dendrites. Thus, to understand the polarized distribution of MAPT, one has to consider not only the axonal enrichment (by slow axonal transport,~ 0.3 mm/day [Citation21]), but also the dendritic depletion of MAPT.
Figure 1. Expression and localization of MAPT in developing neurons. (a) Distribution of MAPT in developing neurons determined by immunofluorescence. Rat hippocampal neurons cultured on coverglasses in 24-well plates were fixed and double stained for MAP2 (green) and MAPT (red). MAPT is distributed abundantly in the somata and processes of neurons at DIV3. (b) At DIV10, MAPT immunoreactivity disappears from the somatodendritic compartment and MAPT is sorted mainly to the axons. Scale bar: 20 µm. (c) Cartoon illustrating the transition in MAP2 and MAPT distribution from immature to mature neurons.
Inhibition of protein degradation in dendrites induces MAPT missorting
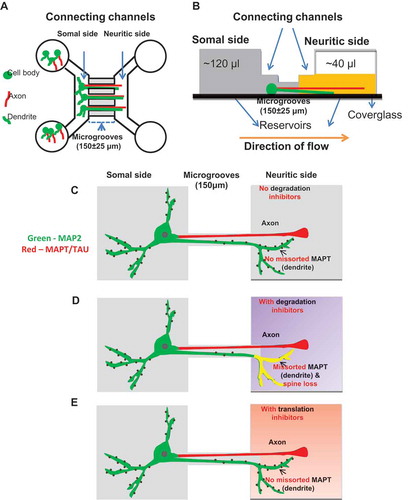
The depletion of somatodendritic MAPT could be in principle explained by an efficient axonal transport system. However, axonal transport of MAPT is slow, and MAPT is a highly diffusible molecule [Citation22]. One alternative explanation would be that the dendritic MAPT is preferentially degraded. Indeed, a faster turnover of MAPT in the dendrites than in axons has been proposed to contribute to the dominant axonal distribution [Citation14], but direct evidence for this hypothesis has been difficult to obtain. Our previous work showed that inhibition of either the proteasome or autophagy in primary neurons induces pronounced neurotoxicity [Citation23,Citation24], making it impossible to address this issue in conventional neuron cultures. Therefore, to test this hypothesis, we sought to employ ‘local’ instead of ‘overall’ treatments of neurons by using MFCs, aiming to reduce treatment-induced neurotoxicity. The MFCs allow neuronal cell bodies to grow on one side (somal side, left in )) while neurites project through the microgrooves to the other side (neuritic side, right in )). Neurons can be treated locally either on the neuritic side or on the somal side, and diffusion of reagents across the channels can be prevented by fluidic isolation achieved by a flow of medium ()). We chose chambers with short microgrooves (~ 150 µm) ()), which allows some dendrites together with axons to reach the neuritic side [Citation19]. We focused on dendrites growing into the neuritic side where treatments could be applied without affecting the cell bodies on the somal side.
Figure 2. Separation of dendrites and axons from soma using microfluidic chambers (MFC). (a) Diagram of an MFC showing the somal (left) and neuritic sides (right) connected by microgrooves with a length of 150 ± 25 µm and a width of 10 µm. The somal side contains cell bodies, dendrites (green) and axons (red). The neuritic side contains only axons and dendrites. The microgrooves do not allow the entry of the cell bodies so that only the neurites can pass through from the somal to the neuritic side. (b) Schematic of the side view of an MFC showing fluidic isolation. The somal side is shaded in dark gray and the neuritic side in yellow. Fluidic isolation is achieved by removing a small volume of medium (~ 80 µl) from the neuritic side, generating a flow of liquid from the somal to the neuritic side (orange arrow). This prevents back diffusion of molecules from the neuritic to the somal side. (c-e) Schematics of the treatments and its effects in a neuron cultured in an MFC. In the absence of protein degradation inhibitors of autophagy and the proteasome, MAPT (red) sorts mainly into the axons and MAP2 (green) into the somatodendritic compartment (c). When protein degradation inhibitors are applied on the neuritic side, there is an increased fraction of dendrites on the neuritic side with MAPT accumulation (yellow) accompanied by loss of spines (d). In the presence of translation inhibitors on the neuritic side, no MAPT missorting into the dendrites is observed (e).
The fluidic integrity of the cultures was tested by applying Alexa Fluor 488 IgG on the neuritic side with a reduced liquid volume in a MFC for over 24 h (Figure S1A). A strong fluorescence signal was detected on the side of IgG application, but no label was found on the opposite untreated side against the flow of the medium. We further validated the fluidic integrity using Alexa Fluor 488 fluorescent dye (0.7 kDa, 100 µM) to ensure that low molecular mass reagents (< 1 kDa) would not diffuse to the opposite side. The dye was added to the side of lower volume in an MFC and imaged after 20 h (Figure S1B). No leakage of the dye was observed to the side of higher liquid volume against the flow of the medium. Thus, the fluidic isolation was intact for long time periods, both for proteins and small dyes.
In order to determine the impact of protein degradation systems on the sorting of MAPT, we sought to suppress their activity by treating neurons on the neuritic side of the MFCs with either autophagy inhibitors, wortmannin [Citation25] and bafilomycin A1 [Citation26], or with proteasomal inhibitors, epoxomicin and lactacystin [Citation27,Citation28]. First of all, we assessed the potential neurotoxicity induced by these treatments using an LDH release assay. The local application of these inhibitors did not cause cytotoxicity, either on the somal or on the neuritic side, as the control and the treated neurons showed similar levels of LDH release at both the somal and neuritic sides (Figure S2). This is in contrast to the dramatic cell death induced by overall treatment of neurons as previously reported [Citation23]. Note that the LDH release was higher on the somal side than on the neuritic side, presumably because of the presence of cell bodies and more dendrites and axons on the somal side.
To examine the missorting of MAPT in the MFCs, axons and dendrites were monitored with MAPT antibody K9JA to stain the axons, and with MAP2 antibody to stain the dendrites. In controls, the fraction of MAPT-containing dendrites on the neuritic side was low (~ 14%), but local treatment with inhibitors of either autophagy (wortmannin [)], bafilomycin A1 [Figure S3A]) or the proteasome (epoxomicin [)], lactacystin [Figure S3B]) caused a pronounced 4-to 5-fold increase of MAPT-containing dendrites (to levels of ~ 50–76%) ()). Genetic knockdown of autophagy factors ATG5 and ATG7 caused a 4- to 5-fold increase of MAPT-containing dendrites similar to chemical inhibition (Figure S3C). This indicates that both degradation systems were involved in keeping dendritic MAPT at a low level (schematics in ). Dendrites in the grooves do not contain missorted MAPT, confirmed by orthogonal views of the z-slice of the processes in the grooves (Figure S1C) which also confirms that the fluidic isolation is intact.
Figure 3. Inhibition of protein degradation (autophagy, proteasome) leads to MAPT missorting. Rat hippocampal neurons (DIV 21–25) cultured in microfluidic chambers were treated on the neuritic side for 24 h either with DMSO (control, a) or with the autophagy inhibitor (wortmannin [Wor], b) or the proteasomal inhibitor (epoxomicin [Epo], c). Dendrites were stained with MAP2 antibody (green) and total MAPT with K9JA antibody (red). Magnified images of the insets are shown on the right with a pair of eye-guiding dotted lines highlighting a dendrite with or without MAPT. (a) In the vehicle-treated control (DMSO, < 0.1%), MAPT is predominantly localized to the axons (see merged images at the bottom in a). Only a small fraction of dendrites colocalizes with MAPT. (b and c) In cultures treated with wortmannin (b, 1 µM, 24 h) or with epoxomicin (c, 0.2 µM, 24 h), the fraction of dendrites with MAPT increases strongly (see quantification in D) where a clear colocalization of MAPT with MAP2 (merged images at the bottom in b and c) becomes visible. Scale bars in all overview images on left: 20 µm; in all magnifications of insets on right: 5 µm. (d) Quantification of dendrites on the neuritic side showing colocalization of MAPT with MAP2 following treatment with DMSO (ctr, bar 1) or with the autophagy (bars 2 and 3) or proteasomal (bars 4 and 5) inhibitors. (n > 180 dendrites/dendritic branches from 3–6 experiments; one-way ANOVA with Tukey’s post hoc test; F [Citation4,Citation17] = 30.09; *p < 0.05; ***p < 0.001; ****p < 0.0001).
![Figure 3. Inhibition of protein degradation (autophagy, proteasome) leads to MAPT missorting. Rat hippocampal neurons (DIV 21–25) cultured in microfluidic chambers were treated on the neuritic side for 24 h either with DMSO (control, a) or with the autophagy inhibitor (wortmannin [Wor], b) or the proteasomal inhibitor (epoxomicin [Epo], c). Dendrites were stained with MAP2 antibody (green) and total MAPT with K9JA antibody (red). Magnified images of the insets are shown on the right with a pair of eye-guiding dotted lines highlighting a dendrite with or without MAPT. (a) In the vehicle-treated control (DMSO, < 0.1%), MAPT is predominantly localized to the axons (see merged images at the bottom in a). Only a small fraction of dendrites colocalizes with MAPT. (b and c) In cultures treated with wortmannin (b, 1 µM, 24 h) or with epoxomicin (c, 0.2 µM, 24 h), the fraction of dendrites with MAPT increases strongly (see quantification in D) where a clear colocalization of MAPT with MAP2 (merged images at the bottom in b and c) becomes visible. Scale bars in all overview images on left: 20 µm; in all magnifications of insets on right: 5 µm. (d) Quantification of dendrites on the neuritic side showing colocalization of MAPT with MAP2 following treatment with DMSO (ctr, bar 1) or with the autophagy (bars 2 and 3) or proteasomal (bars 4 and 5) inhibitors. (n > 180 dendrites/dendritic branches from 3–6 experiments; one-way ANOVA with Tukey’s post hoc test; F [Citation4,Citation17] = 30.09; *p < 0.05; ***p < 0.001; ****p < 0.0001).](/cms/asset/a1b3e0ff-c0c2-43d4-b611-42a0e0ec55f1/kaup_a_1509607_f0003_oc.jpg)
In order to visualize the correlation between the dendritic appearance of MAPT after treatment with inhibitors of protein degradation, the substrates of autophagy (SQSTM1/p62) or the proteasome (ubiquitinated proteins) were monitored directly. Compared with the MAPT-free dendrites of control neurons (Figure S4A, 1.8 ± 0.1), a substantial increase of SQSTM1 level (21.1 ± 0.9) was observed in MAPT-containing dendrites upon wortmannin treatment (Figure S4B). Similarly, a dramatic elevation of ubiquitinated substrates (from 4.2 ± 0.1 to 37 ± 1) upon epoxomicin treatment was detected in dendrites containing MAPT (compare Figure S4E and S4F). On the contrary, there was no elevation of MAPT and respective substrates in the cell bodies on the somal side that had no access to inhibitors (quantification in Figure S4C and G). These results confirm that the inhibition of protein degradation causes the missorting of MAPT in parallel to the elevation of the respective substrates only on the neuritic side (quantification in Figure S4D and H).
Differential phosphorylation states of dendritic and axonal MAPT
MAPT in AD and other tauopathies is hyperphosphorylated [Citation29] and the hyperphosphorylation has been proposed to drive the missorting of MAPT. Indeed, the diffusion barrier at the axonal initial segment cannot restrain hyperphosphorylated MAPT within the axons [Citation17]. In addition, it has been reported that in cultured neurons, Aβ oligomers induce MAPT missorting into the somatodendritic compartment, and the missorted MAPT is phosphorylated mainly at the 12E8 (p-S262/p-S356) and AT8 (p-S202/p-T205) sites [Citation6]. These observations prompted us to examine the phosphorylation status of the dendritic MAPT induced by inhibition of protein degradation. We analyzed the phosphorylation state of MAPT protein accumulating in the dendrites after inhibition of protein degradation, with phosphorylation-dependent antibodies (12E8, PHF1 and AT8). Missorted dendritic MAPT showed phosphorylation mainly at the 12E8 sites upon treatment with either the autophagy inhibitor wortmannin (; 57.2 ± 9.4% dendrites) or the proteasomal inhibitor epoxomicin (, 62.9 ± 7.4% dendrites) (, quantification in )), but not at the AT8 and the PHF1 (p-S396/p-S404) sites (Figure S5, )). Conversely, the axonal MAPT exhibited phosphorylation at all these sites. Thus, the dendritic and axonal MAPT are differentially phosphorylated. Based on this observation, we can conclude that the dendritic MAPT degraded by autophagy or proteasomal pathways is phosphorylated mainly at the 12E8 site.
Figure 4. Missorting of MAPT into dendrites coincides with elevated phosphorylation at the 12E8 epitope, but not at the AT8 or PHF1 sites. Rat hippocampal neurons (DIV 21–25) cultured in microfluidic chambers treated on the neuritic side for 24 h either with DMSO (control, a), or with the autophagy inhibitor wortmannin (b) or proteasomal inhibitor epoxomicin (c). Phosphorylation-dependent MAPT antibody 12E8 was used to probe the phosphorylation state of MAPT at S262/S356 residues and MAP2 antibody was used to highlight dendrites. Images of the dendrites on the neuritic side are shown highlighting a dendrite with or without phospho-MAPT. (a-c) In vehicle-treated control (DMSO, < 0.1%) MAPT sorts mainly to the axons (a). Treatment with wortmannin (1 µM, 24 h) or epoxomicin (0.2 µM, 24 h) on the neuritic side causes an increase of MAPT, in the dendrites, which is phosphorylated at the 12E8 site (b and c). Scale bar: 5 µm. (d) Quantification of dendrites on the neuritic side showing colocalization of MAP2 with the phospho-MAPT antibodies 12E8 (n > 700 dendrites/dendritic branches from 5 experiments; one-way ANOVA with Tukey’s post hoc test; F [Citation2,Citation12] = 12; **p < 0.01), AT8 (n = > 70 dendrites/dendritic branches from 3 experiments; one-way ANOVA with Tukey’s post hoc test; F [Citation2,Citation6] = 0.05; p = 0.09) or PHF1 (n = > 30 dendrites/dendritic branches 3 experiments; one-way ANOVA with Tukey’s post hoc test; F [Citation2,Citation6] = 0.31; p = 0.74). ns, not significant.
![Figure 4. Missorting of MAPT into dendrites coincides with elevated phosphorylation at the 12E8 epitope, but not at the AT8 or PHF1 sites. Rat hippocampal neurons (DIV 21–25) cultured in microfluidic chambers treated on the neuritic side for 24 h either with DMSO (control, a), or with the autophagy inhibitor wortmannin (b) or proteasomal inhibitor epoxomicin (c). Phosphorylation-dependent MAPT antibody 12E8 was used to probe the phosphorylation state of MAPT at S262/S356 residues and MAP2 antibody was used to highlight dendrites. Images of the dendrites on the neuritic side are shown highlighting a dendrite with or without phospho-MAPT. (a-c) In vehicle-treated control (DMSO, < 0.1%) MAPT sorts mainly to the axons (a). Treatment with wortmannin (1 µM, 24 h) or epoxomicin (0.2 µM, 24 h) on the neuritic side causes an increase of MAPT, in the dendrites, which is phosphorylated at the 12E8 site (b and c). Scale bar: 5 µm. (d) Quantification of dendrites on the neuritic side showing colocalization of MAP2 with the phospho-MAPT antibodies 12E8 (n > 700 dendrites/dendritic branches from 5 experiments; one-way ANOVA with Tukey’s post hoc test; F [Citation2,Citation12] = 12; **p < 0.01), AT8 (n = > 70 dendrites/dendritic branches from 3 experiments; one-way ANOVA with Tukey’s post hoc test; F [Citation2,Citation6] = 0.05; p = 0.09) or PHF1 (n = > 30 dendrites/dendritic branches 3 experiments; one-way ANOVA with Tukey’s post hoc test; F [Citation2,Citation6] = 0.31; p = 0.74). ns, not significant.](/cms/asset/87494659-c065-4ca1-bd5b-93550717ced2/kaup_a_1509607_f0004_oc.jpg)
Enhancement of the autophagy or of the proteasome reduces MAPT missorting
To further confirm that the protein degradation systems are involved in the sorting of MAPT, we tested an alternative approach, that is, stimulating the protein degradation systems instead of suppressing them, because stimulation of the protein degradation systems has been suggested to be of therapeutic potential for tauopathies. We noticed that even under physiological conditions ~ 14% of the dendrites showed missorting of MAPT. We therefore asked whether stimulation of autophagy or of the proteasome system can reduce the basal amount of MAPT missorting. Our previous study [Citation23] had shown that trehalose induces autophagy in primary neurons and in an N2a cell model of tauopathy, and efficiently reduces the level of MAPT and MAPT aggregation. Because trehalose is free of toxic effects even at higher concentrations [Citation30], we used a concentration of 150 mM for treatment of neurons in MFCs. We applied trehalose on the neuritic side for 24 h ()), with sucrose (150 mM) treatment as control. Trehalose treatment indeed supressed the missorting of MAPT down to ~ 4 ± 0.7% of dendrites, far less than the control level (~ 16% of dendrites) ()). These results confirm the role of autophagy in degrading dendritic MAPT protein.
Figure 5. Enhancement of autophagy or proteasome activity reduces MAPT missorting. Rat hippocampal neurons (DIV 21–25) cultured in MFCs were treated on the neuritic side with sucrose (as control) or with trehalose, an enhancer of autophagy (a) or with rolipram, an enhancer of the proteasome (c) for 24 h. The dendrites are stained with MAP2 antibody (green) and MAPT is stained with K9JA antibody (red). Magnified images of the insets are shown on the right with a pair of eye-guiding dotted lines highlighting a dendrite without MAPT. (a and b) Impact of stimulation of autophagy on missorting of MAPT. In cultures treated with trehalose (150 mM, 24h) on the neuritic side, the fraction of dendrites with MAPT decreases strongly (see quantification in B) and a more stringent localization to axons is seen (a). Treatment with sucrose (150 mM, 24 h) resulted in a similar fraction of dendrites with missorted MAPT as DMSO treated control cultures, but trehalose (150 mM, 24 h) strongly reduced missorting of MAPT 4 fold (~ 4%) (b). In A, the image of the dendrites on the neuritic side represent reduced colocalization of MAPT with MAP2 (see panels representing high magnification of insets). Scale bars in all overview images on left:20 µm; in all magnifications of insets on right: 5 µm. Error bars, SEM from n > 450 dendrites/dendritic branches from 4 experiments. **p < 0.005, using Student’s t test. (c and d) Impact of stimulation of proteasome on missorting of MAPT. In cultures treated with rolipram (10 µM, 24 h) on the neuritic side, the fraction of dendrites with MAPT decreases by ~ 70% (see quantification in d). In c, the image of the dendrites on the neuritic side represents reduced colocalization of MAPT with MAP2 (see high magnification of insets). Error bars, SEM from n > 280 dendrites/dendritic branches from 4 experiments. *p < 0.05, using Student’s t test.
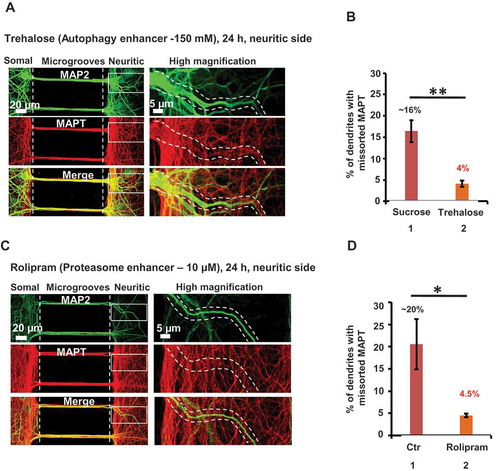
Similar to the activation of autophagy, we wanted to enhance the proteasome activity in neurons in MFCs. A recent study showed that rolipram can elevate the cAMP-PRKA/PKA activity leading to phosphorylation of proteasomal subunits and thereby enhancing its proteolytic activities in mice [Citation31]. We first tested the concentration at which rolipram efficiently reduced the amount of ubiquitin conjugates in cultured primary neurons. At 10 μM concentration, rolipram caused a reduction of ubiquitinated substrates (Figure S4I and J). Treatment with rolipram (10 µM) on the neuritic side for 24 h ()) supressed missorting of MAPT down to 4.5 ± 0.4% dendrites, far below the control level (20.5 ± 5.6% dendrites) ()), thereby confirming the role of the proteasome in degrading dendritic MAPT. The above 2 findings indeed support the role of the protein degradation pathways as a prerequisite for the asymmetric distribution of MAPT in neurons.
Accumulation of MAPT protein in dendrites via the inhibition of protein degradation results in loss of spines
Previous studies had shown that the missorting of MAPT into dendrites can cause loss of spines [Citation6,Citation7]. By analogy, we wanted to examine if the accumulation of MAPT in the dendrites induced by inhibition of the protein degradation systems could lead to spine loss as well. We applied the autophagy inhibitor wortmannin (1 µM) or the proteasomal inhibitor epoxomicin (0.2 µM) on the neuritic side of MFCs for 24 h, and DMSO (< 0.1%) as vehicle control (-). Spines were identified by antibodies against the spine marker DBN1 (drebrin 1). MAPT-free dendrites in controls had a spine density of ~ 17 per 20-µm (17.2 ± 0.5 per 20 µm) length, and there was a ~ 2-fold decrease in spine density in the MAPT-containing dendrites in neurons treated with wortmannin (7.4 ± 1.0 per 20 µm) or epoxomicin (8.2 ± 1.7 per 20 µm) ()). In the case of controls, different spine morphologies were clearly visible (), an enlarged version of iii), whereas upon treatment most of the spines assumed a stubby shape (iii, (c)iii). Similar results were obtained using phalloidin-actin staining (Figure S6A-D). We also examined the effect of bafilomycin A1 and lactacystin on dendritic spine density and morphology in whole neuronal culture. The dendrites containing missorted MAPT showed a loss of spines whereas MAPT-free dendrites had a normal spine distribution (Figure S6E-F). These results suggest that the missorting of MAPT into dendrites after local inhibition of protein degradation might be the cause of spine loss. In order to examine whether the toxic effect of the protein degradation inhibitors on spines is MAPT-dependent, we treated MAPT knockout neurons in MFCs with either wortmannin (Figure S7B) or with epoxomicin (Figure S7C) on the neuritic side. Neither of the treatments resulted in a significant difference in spine number in comparison to DMSO-treated cultures (Figure S7A; see quantification in Figure S7D) confirming the specific and toxic effect of MAPT in causing spine loss.
Figure 6. Local treatment with protein degradation inhibitors leads to dendritic MAPT mislocalization and spine loss. Rat hippocampal neurons (DIV 21–25) cultured in microfluidic chambers were treated on the neuritic side for 24 h either with DMSO (control, a), with the autophagy inhibitor wortmannin (b) or with the proteasomal inhibitor epoxomicin (c). MAP2 antibody (green), K9JA antibody (red) and DBN1 (cyan) were used to label dendrites, MAPT and spines, respectively. Only magnified images of the neuritic side are shown here. (a) In control, neurons treated with vehicle at the neuritic side (DMSO, < 0.1%, 24 h), MAPT is predominantly localized to the axons and the dendrites have a normal spine distribution and morphology (Aiii) (arrows). (b and c) In cultures treated with wortmannin (b, 1 µM, 24 h) or with epoxomicin (c, 0.2 µM, 24 h) MAPT can be observed in dendrites, and these dendrites show reduction of spines, and the remaining spines become stubby in nature (Biii and Ciii). Scale bar: 2 µm. (d) Quantification of the spine density of the dendrites on the neuritic side after treatment with DMSO or with protein degradation inhibitors (n = 17–20 dendrites from 3 experiments; one-way ANOVA with Tukey’s post hoc test; F [Citation2,Citation6] = 39.29; ***p < 0.001). (e) Enlarged version of Figure 6(a)iii clearly demonstrates different types of spine morphology such as mushroom head (*), stubby(@), thin(#) and filopodia(§) spines.
![Figure 6. Local treatment with protein degradation inhibitors leads to dendritic MAPT mislocalization and spine loss. Rat hippocampal neurons (DIV 21–25) cultured in microfluidic chambers were treated on the neuritic side for 24 h either with DMSO (control, a), with the autophagy inhibitor wortmannin (b) or with the proteasomal inhibitor epoxomicin (c). MAP2 antibody (green), K9JA antibody (red) and DBN1 (cyan) were used to label dendrites, MAPT and spines, respectively. Only magnified images of the neuritic side are shown here. (a) In control, neurons treated with vehicle at the neuritic side (DMSO, < 0.1%, 24 h), MAPT is predominantly localized to the axons and the dendrites have a normal spine distribution and morphology (Aiii) (arrows). (b and c) In cultures treated with wortmannin (b, 1 µM, 24 h) or with epoxomicin (c, 0.2 µM, 24 h) MAPT can be observed in dendrites, and these dendrites show reduction of spines, and the remaining spines become stubby in nature (Biii and Ciii). Scale bar: 2 µm. (d) Quantification of the spine density of the dendrites on the neuritic side after treatment with DMSO or with protein degradation inhibitors (n = 17–20 dendrites from 3 experiments; one-way ANOVA with Tukey’s post hoc test; F [Citation2,Citation6] = 39.29; ***p < 0.001). (e) Enlarged version of Figure 6(a)iii clearly demonstrates different types of spine morphology such as mushroom head (*), stubby(@), thin(#) and filopodia(§) spines.](/cms/asset/d8e07c47-dd29-43ba-8ff6-b5344f70b381/kaup_a_1509607_f0006_oc.jpg)
MAPT protein is locally synthesized in dendrites
Next we sought to determine the source of the dendritic MAPT. There could be 2 potential origins of dendritic MAPT: (1) it could originate from the cell body or axons due to diffusion/transport; or (2) it could be locally synthesized in the dendrites. As an example, there is some local translation of MAPT in axons driven by the MTOR signaling pathway [Citation16]. By analogy, we asked whether the dendritic MAPT could be produced by local synthesis as well. This was tested by blocking local protein synthesis. Neurons cultured in microfluidic chambers were treated on the neuritic side with protein translation inhibitors, cycloheximide or anisomycin [Citation32,Citation33], together with the protein degradation inhibitors, wortmannin or epoxomicin, for 24 h. As described above, axons and dendrites were monitored with MAPT antibody, K9JA, and with anti-MAP2 antibody, respectively.
Whereas wortmannin or epoxomicin alone caused high levels of MAPT missorting as described above ()), the combination with cycloheximide (, profoundly reduced MAPT missorting back to control levels ()). This result was confirmed using another protein translation inhibitor, anisomycin, combined with wortmannin or epoxomicin (). Conversely, treatment with protein translation inhibitors, cycloheximide or anisomycin, alone (Figure S8A and B) almost completely abrogated MAPT missorting (schematic in )). These results suggest that the dendritic MAPT is locally generated. To further validate this, we knocked down Mapt/Tau mRNA expression in distal dendrites to examine its influence on missorting of MAPT. First, we treated the neurons cultured in microfluidic chambers using a non-targeting siRNA with a FAM (carboxyfluorescein) label in order to confirm the local restriction of the treated siRNAs. It was evident that the siRNA was predominantly restricted to the neuritic (treated) side even after 3 days (Figure S9A). We tested the concentration and time point at which the siRNA against Mapt was effective. When neurons were treated with Mapt siRNA at 1 µM for 3 days, the level of MAPT protein was reduced (Figure S9B). Based on the observation of the local restriction of siRNA, we next treated the neuritic side with siRNA against Mapt/Tau mRNA. This prevented the missorting of MAPT almost completely (-h)), consistent with the results of chemical inhibition.
Figure 7. Protein translation inhibitors prevent MAPT missorting. Rat hippocampal neurons (DIV 21–25) cultured in MFCs treated on the neuritic side with the protein translation inhibitors cycloheximide (CHX) or anisomycin (Ani) combined either with wortmannin (a and c) or with epoxomicin (b and d) for 24 h or with Mapt siRNA (F-H) for 72 h. The dendrites are stained with MAP2 antibody (green) and MAPT is stained with K9JA antibody (red). Images of the dendrites on the neuritic side are shown highlighting a dendrite without MAPT. (a and b) When the neurons were treated with cycloheximide (10 µM) together with the autophagy inhibitor wortmannin (1 µM) (a) or with the proteasomal inhibitor epoxomicin (0.2 µM) (b) for 24 h, there was no increase in the dendritic accumulation of MAPT (quantification in e). (c and d) Similar experiment to A, B using anisomycin (10 µM) combined with wortmannin (1 µM) (c) or epoxomicin (0.2 µM) (d). There was no increase in the dendritic accumulation of MAPT (quantification in E). Scale bar: 5 µm. (e) Quantification of dendrites on the neuritic side showing colocalization of MAP2 with MAPT (n > 180 dendrites/dendritic branches from 3–5 experiments; one-way ANOVA with Tukey’s post hoc test; F [Citation4,Citation15] = 0.58; p = 0.68). (f–h) When the neurons were treated with siRNA against Mapt in the neuritic side (1 µM, 72 h) (f) there was very low accumulation of MAPT in dendrites on the neuritic side (see merged images in the right panels [g] and quantification [h]). Scale bars in all overview images on left: 20 µm; in all magnifications of insets on right: 5 µm. Error bar, SEM from n = > 800 dendrites/dendritic branches from 4 experiments.
![Figure 7. Protein translation inhibitors prevent MAPT missorting. Rat hippocampal neurons (DIV 21–25) cultured in MFCs treated on the neuritic side with the protein translation inhibitors cycloheximide (CHX) or anisomycin (Ani) combined either with wortmannin (a and c) or with epoxomicin (b and d) for 24 h or with Mapt siRNA (F-H) for 72 h. The dendrites are stained with MAP2 antibody (green) and MAPT is stained with K9JA antibody (red). Images of the dendrites on the neuritic side are shown highlighting a dendrite without MAPT. (a and b) When the neurons were treated with cycloheximide (10 µM) together with the autophagy inhibitor wortmannin (1 µM) (a) or with the proteasomal inhibitor epoxomicin (0.2 µM) (b) for 24 h, there was no increase in the dendritic accumulation of MAPT (quantification in e). (c and d) Similar experiment to A, B using anisomycin (10 µM) combined with wortmannin (1 µM) (c) or epoxomicin (0.2 µM) (d). There was no increase in the dendritic accumulation of MAPT (quantification in E). Scale bar: 5 µm. (e) Quantification of dendrites on the neuritic side showing colocalization of MAP2 with MAPT (n > 180 dendrites/dendritic branches from 3–5 experiments; one-way ANOVA with Tukey’s post hoc test; F [Citation4,Citation15] = 0.58; p = 0.68). (f–h) When the neurons were treated with siRNA against Mapt in the neuritic side (1 µM, 72 h) (f) there was very low accumulation of MAPT in dendrites on the neuritic side (see merged images in the right panels [g] and quantification [h]). Scale bars in all overview images on left: 20 µm; in all magnifications of insets on right: 5 µm. Error bar, SEM from n = > 800 dendrites/dendritic branches from 4 experiments.](/cms/asset/fcb3f649-ded5-4aff-beff-c646b895f23f/kaup_a_1509607_f0007_oc.jpg)
Collectively, these data suggest that the local synthesis of MAPT in dendrites occurs physiologically, and that dendritic MAPT levels are kept in check at a low level by the physiological activities of the protein degradation systems. This balance can be perturbed by changes in the activities of these opposing systems, protein synthesis vs. degradation.
Mapt/Tau mRNA distributes to dendrites, axons and cell bodies
The fact that missorted MAPT in dendrites can occur by local synthesis implies that Mapt/Tau mRNA is present in the dendrites. However, the subcellular distribution of Mapt/Tau mRNA in neurons has been an issue under debate. One study argued that Mapt/Tau mRNA only localizes to the cell body and the proximal region of the axon [Citation12], others showed that it distributes to proximal dendrites as well [Citation13]. To clarify this issue for our experimental system, we performed fluorescence in situ hybridization assay (FISH) to assess the distribution of Mapt/Tau mRNA in rat hippocampal neurons cultured in MFCs. The rat Mapt/Tau mRNA probe was 1135 base pairs long, covering the entire coding region of Mapt/Tau mRNA and detecting mRNA of all isoforms of MAPT.
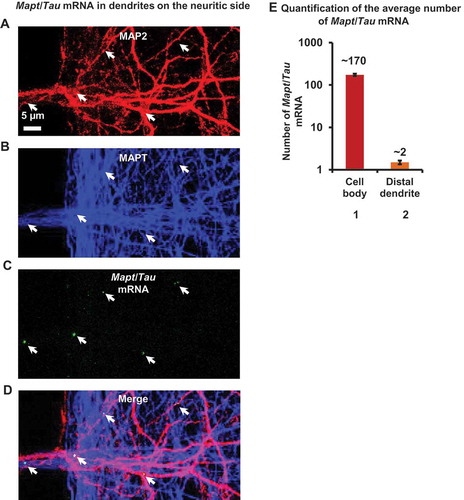
The in situ hybridization process was followed by immunostaining (Figure S10A) with the somatodendritic marker MAP2 ()) and the axonal marker MAPT (K9JA antibody) ()). Although Mapt/Tau mRNA predominantly distributed into the cell body (172.9 ± 10.5 Mapt/Tau mRNA puncta/cell body), a small amount of Mapt/Tau mRNA was detected in distal dendrites as well (1.5 ± 0.1 Mapt/Tau mRNA puncta, as denoted by arrows in ; quantification in ), bars 1, 2). To rule out the possibility of non-specificity of the probe, FISH analysis using a GFP mRNA probe was done in parallel. No positive signal for GFP mRNA was observed (Figure S10B). This observation, together with local synthesis of MAPT protein, confirms that Mapt mRNA is present in dendrites and is actively translated. By contrast, Mapt/Tau mRNA puncta were very rare in axons and could not be counted reliably.
Figure 8. Fluorescence in situ hybridization reveals the majority of Mapt/Tau mRNA in the cell body with a minority in distal dendrites. (a-d) Mapt/Tau mRNA in rat hippocampal neurons (DIV 21–25) cultured in MFCs monitored by FISH with a rat Mapt/Tau mRNA probe. Axons and dendrites were visualized by immunostaining with pan-MAPT antibody K9JA (blue, b) and anti-MAP2 antibody (red, a) respectively. Images of the dendrites on the neuritic side are shown. Note that Mapt/Tau mRNA (green puncta, c) can be found in distal dendrites. Arrows indicate a sparse distribution of Mapt/Tau mRNA in distal dendrites. Scale bar: 5 µm. (e) Quantification of the average number of Mapt/Tau mRNA puncta in the cell body (~ 170) vs a distal dendrite (~ 2). Error bars, SEM from n = 45 cell bodies and 106 distal dendrites from 3 individual experiments.
Discussion
MAPT is a neuronal protein that is ubiquitous in immature neurons but becomes sorted into axons during maturation where it stabilizes microtubules, the tracks of axonal transport [Citation3,Citation34]. However, even in mature neurons low levels of dendritic MAPT may play physiological roles, for example in the regulation of dendritic spines [Citation10,Citation35]. The mechanism of axonal sorting of MAPT has remained enigmatic, and several models have been proposed, involving differential transport, stability, or microtubule-interactions of MAPT protein or Mapt/Tau mRNA [Citation13,Citation14,Citation16,Citation17,Citation36]. The subcellular distribution of MAPT is developmentally regulated [Citation37]. In cell culture the transition towards axonal sorting takes place around DIV10 () and is accompanied by a pronounced upregulation of microtubule proteins. The major mechanism for MAPT’s axonal enrichment is the onset of slow axonal transport [Citation21]. Conversely, MAPT is a hydrophilic and highly mobile protein, with only a short residence time on microtubules [Citation22], and would therefore be expected to diffuse easily throughout the somatodendritic compartment.
The non-axonal accumulation of MAPT has received particular interest in the context of neurodegeneration with the discovery that the ‘somatodendritic missorting’ was an early hallmark of disease [Citation5,Citation38]. This posed the question of the origin of dendritic MAPT in mature neurons under pathological conditions. The term ‘missorting’ was suggestive of a redistribution of axonal MAPT back to soma and dendrites, consistent with a failure of the diffusion barrier near the axon initial segment [Citation17,Citation39]. Conversely, Alzheimer-like pathological missorting could be induced by exposure to Aβ oligomers or other stressors without breaking the barrier at the axon initial segment, implying that the somatodendritic accumulation was caused by local synthesis in the cell body [Citation9]. This view is supported by a recent study that revealed that Aβ oligomers induce de novo protein synthesis of MAPT and its hyperphosphorylation in the somatodendritic compartments, which is mediated by the kinase FYN via activating the MAPK/ERK-RPS6KB/p70S6 signaling pathway [Citation40]. Nevertheless, these observations still left open the question whether dendritic MAPT originated from cell bodies or locally in dendrites.
Such questions regarding protein synthesis, degradation, or translocation are usually adressed by inhibiting the underlying processes. However, application of inhibitors to neuronal cell cultures can lead to ambiguous results because of the different compositions and responses of the compartments and the toxic effects of inhibitor compounds. Therefore, in this study, we addressed the issue of dendritic MAPT using MFCs, which enable one to observe and manipulate different neuronal compartments separately [Citation19]. The experimental conditions were chosen such that the neuronal cell bodies were isolated from the tips of axons and dendrites (). These could then be exposed to different treatments without interference by the cell bodies and without toxic effects on the cells as a whole.
In brief, the results showed that, even in mature neurons, the dendrites contain Mapt/Tau mRNA up to their distal tips, capable of translating MAPT protein locally (). However, in spite of ongoing MAPT synthesis, the dendritic levels are kept low by efficient degradation of MAPT protein, involving both autophagy and the proteasome system (). This distinguishes mature neurons from immature ones where local MAPT synthesis is not counterbalanced by degradation. Consistent with this picture, inhibitors of autophagy or the proteasome can cause a local buildup of MAPT in restricted regions of dendrites, whereas activators of autophagy or the proteasome cause a further reduction below control levels (). The buildup of MAPT is completely prevented by local inhibition of protein synthesis (). These results argue that ‘somatodendritic missorting’ is not caused by a redirection of MAPT protein, but by ongoing protein synthesis combined with a failure of the protein degradation machinery.
The results are in agreement with the general observation that aging or degenerating brains suffer from impaired protein degradation, both at the level of autophagy and proteasomes [Citation24,Citation25,Citation41–Citation43]. This will likely affect not only the level of MAPT (which has a long intrinsic life time [Citation44]), but other proteins as well. One case in point is the dendritic accumulation of neurofilament proteins upon exposure to amyloid-β, which are axonal in normal neurons [Citation6]. It also explains why incipient aggregation of MAPT tends to occur in dendrites, rather than axons [Citation5,Citation13].
Missorting and aggregation of MAPT in AD neurofibrillary tangles is invariably accompanied by hyperphosphorylation, which has led to the view that phosphorylation is a trigger for MAPT aggregation. Given the multiplicity of potential phosphorylation sites on MAPT and corresponding kinases it has been difficult to prove a causal relationship. The explanation for enhanced phosphorylation may lie in an underactivity of protein phosphatases [Citation45], notably PPP2 which can directly interact with MAPT [Citation46]. In this context we note that axonal and dendritic MAPT differ in their phosphorylation state. Axonal MAPT shows various target sites inside and outside the repeat domain (e.g., antibodies 12E8, AT8, PHF1, , Figure S5), whereas dendritic MAPT (elevated after inhibition of degradation) shows enhanced phosphorylation mainly at the 12E8 site (p-Ser262/p-Ser356 in the repeat domain, ). This indicates a reduced interaction with microtubules and is consistent with the decay of dendritic microtubules after exposure to Aβ [Citation6]. Note that these sites in the dendritic shaft differ from the functional sites on MAPT reported to be important for dendritic spines [Citation47]. Phosphorylation of MAPT at other sites needs to be investigated further.
One point of particular importance is the question of MAPT-induced toxicity under ‘missorting conditions’. Different types of experiments have suggested that MAPT makes cells and brain tissue more vulnerable to stressors such as Aβ [Citation48,Citation49]. We tested this with the usual assays of cell viability or metabolic activity (LDH, MTT assays). There was no gross effect (Figure S2), which is understandable given that only cell extensions but not the cell bodies were exposed to the inhibitor treatment. However, there was a pronounced loss of dendritic spines on the dendrites with elevated MAPT (, Figure S6), reminiscent of the early loss of spines as marker of AD neurodegeneration [Citation7,Citation38]. The effect was comparable to the effect of MAPT added to the external medium, i.e. spine reduction rather than gross toxicity to neurons [Citation50,Citation51], and was specific for MAPT because it was absent from mapt KO neurons (Figure S7). It appears that dendritic spines are exquisitely sensitive to elevated MAPT, interacting either with the external or internal boundary of the cell. Thus, although low levels of dendritic MAPT are important for long-term depression [Citation8,Citation10,Citation52,Citation53], it must be fine-tuned to avoid its accumulation-induced synaptic toxicity. This may be achieved by the regulation of local synthesis and degradation of MAPT and is highlighted by the local concentration of proteasomal activity around spines [Citation54].
A final comment concerns some mechanistic aspects of observing protein degradation in MFCs: In contrast to typical applications of protein degradation inhibitors to cell cultures, the uptake and immediate effects are highly localized (here: to the tips of dendrites), but still can have consequences for other cell compartments. The experimental advantage is that toxic effects of inhibitors operating through the cell body are avoided by treating only remote sections. However, the internal communication between cell compartments must be taken into account, in particular in view of fast intracellular transport and the high diffusion rate of MAPT [Citation22]. Thus, at the rates of fast microtubule-based transport by kinesin or dynein (~ 0.5–1 µm/sec), cargoes can traverse the channels (150 µm) within minutes in both directions. In the case of proteasomes one may assume a general distribution throughout the cytosol (with local accumulations where needed, e.g. at spines) so that there is local degradation and turnover of products [Citation55,Citation56]. By contrast, autophagy relies on the trafficking and fusion of vesicles (autophagosomes, lysosomes) moving between the periphery and the cell body [Citation41,Citation57]. Thus, collection of cellular waste at neurite tips (by autophagosomes) and waste disposal (by lysosomes) are spatially separated, and the same might be expected for the action of inhibitors (wortmannin vs. bafilomycin A1). The observation that both have similar effects (MAPT accumulation only on the neuritic side) suggests a tight local crosstalk between the vesicular components. The importance of this crosstalk is highlighted by the fact that TMEM106B, a risk factor for frontotemporal lobar degeneration with TARDBP/TDP-43 pathology, controls the balance of lysosomal trafficking in dendrites [Citation58]. Another notable level of regulation is the fact that rising levels of dendritic MAPT can downregulate protein synthesis by interfering with ribosome functions [Citation59]. This may explain in part why the extent of somatodendritic missorting appears to be self-limiting to 50–80%, and is consistent with the initiation of MAPT aggregates by ribosomal RNA [Citation60].
In conclusion, this study demonstrates that: (1) the degradation systems of the proteasome and autophagy contribute to the polarized distribution of MAPT; (2) dendritic MAPT can be synthesized locally; (3) the dendritic and axonal MAPT protein are differentially phosphorylated; (4) downregulation of protein degradation pathways generates the apparent missorting of MAPT into dendrites; (5) accumulation of MAPT in dendrites causes the loss of spines. Our data point to an impairment of protein degradation systems in dendrites as an early event in Alzheimer neurodegeneration, resulting in the early loss of spines due to the accumulation of MAPT, likely followed by a dendritic generation of MAPT aggregates.
Materials and methods
Neuron culture in MFCs and treatments
Primary hippocampal neurons were prepared from Sprague-Dawley rat embryos at day 18 (E18) or from embryonic day 16 mapt/tau knockout (KO) mice and seeded at a density of approximately 3–6 × 10⁴ cells on poly-D-lysine (Sigma Aldrich, P7886; 1 mg/ml)-coated coverglasses assembled with MFCs (Xona microfluidics, USA, RD150; 150 ± 25 µm channels,). The cells were cultured in Neurobasal medium (LIFE Technologies, 21,103,049) supplemented with B27 (LIFE Technologies, 17,504,044), L-glutamine (Sigma Aldrich, G7513) and penicillin-streptomycin (PAN-Biotech GmbH, P06-07100) or with NS21 (PAN-Biotech GmbH, P07-2001), L-glutamine, penicillin/streptomycin, horse serum (Sigma Aldrich, H1270) and pyruvate. Four days after seeding, cytosine arabinoside (Sigma Aldrich, C1768) was added to the conditioned medium at a final concentration of 5 µg/ml to inhibit glial proliferation.
For local treatment of neurons on the neuritic side of the MFCs (right side in )), approximately 80 µl of medium was removed from the neuritic side, generating a flow gradient from the somal to the neuritic side to achieve fluidic isolation. It takes < 2 min for a fluorescent dye such as A488 (Thermo Fisher Scientific, A10254) to diffuse across the channels in the direction of flow (initial flow rate ~ 1 µm/s), but > 24 h to diffuse against the direction of flow. Thus, fluidic isolation is intact for over 24 h, enabling local treatments of all compounds for long periods of time.
All protein degradation inhibitors including wortmannin (Merck Millipore, 681,675; 1 µM), bafilomycin A1 (Merck Millipore, 196,000; 0.2 µM), epoxomicin (Merck Millipore, 324,800; 0.2 µM) and lactacystin (Merck Millipore, 426,100; 0.5 µM), protein synthesis inhibitors including cycloheximide (Sigma Aldrich, C4859; 10 µM) and anisomycin (Sigma Aldrich, A5862; 10 µM), modulators of degradation such as trehalose (Sigma Aldrich, 6138–23-4; 150 mM) and rolipram (Enzo Life Sciences, BML-PD175-0010; 10 µM) were added only to the neuritic side and thus had no direct effects on cell bodies. Unless stated otherwise all chemicals (except trehalose) were prepared in DMSO (Sigma Aldrich, D8414). The local treatments were maintained for 24 h.
Wortmannin blocks class III PtdIns3K and thus the formation of autophagosomes [Citation25,Citation61] (note that wortmannin affects other targets and pathways as well, e.g. the rates of endocytosis, due to its reversible modification in cells [Citation62,Citation63]; for applications to study autophagy see ref [Citation25,Citation41]). Bafilomycin A1 inhibits the vacuolar-type H+-ATPase and thus the acidification of lysosomes and fusion with autophagosomes [Citation25,Citation64]. Epoxomicin inhibits the chymotrypsin-like activity of proteasomes [Citation28] (PSMB5/beta-5 subunit), lactacystin inhibits all 3 β subunits of the 20S proteasome (PSMB1, PSMB4 and PSMB5) [Citation65,Citation66]. Trehalose inhibits the activity of glucose transporters (SLC2A1 to SLC2A4) and thus activates AMPK and the autophagy pathway [Citation67,Citation68]. Rolipram, a phosphodiesterase inhibitor, raises cAMP levels, and thereby activates PKA and enhances the activity of proteasomes [Citation31].
Western blot assay
For Western blotting, cells were treated as indicated above (see also figure legends), washed twice with ice-cold phosphate-buffered saline (PBS; Sigma Aldrich, D8537; pH 7.4), and scraped into lysis buffer (LB; 50 mM Tris-HCl, pH 7.4, 0.5 mM Na3VO4, 5 mM NaF, 150 mM NaCl, 1 mM EDTA, 1 mM EGTA, 1% Triton X-100 [Gerbu, 2000–1000], 1 μM okadaic acid [Enzo Life Sciences, ALX-350–003] and protease inhibitor cocktail Complete [Roche, 11,836,153,001]). Cells were allowed to lyse for 20 min on ice. The samples were then centrifuged at 15,996 x g, at 4°C for 20 min and the supernatant was collected for analysis. Protein concentration was determined using the Micro-BCA method (Thermo Fisher Scientific, 23,225). A total of 2–3 μg of total protein were loaded on 10% or 17% SDS polyacrylamide gels and transferred onto Immobilon-P transfer membranes (Merck Millipore, IPVH00010). The following antibodies and dilutions were used: K9JA (DAKO, A0024; 1:20,000), and anti-ACTB/actin (Sigma Aldrich, A3853; 1:20,000). Blots were developed using ECL-Plus (GE Healthcare, RPN 2232) and then analyzed by densitometry using the AIDA software.
SiRNA treatments
Both Mapt (E-089500–00-0010) and a non-targeting (D-001950–01-05) siRNA were purchased from Dharmacon (Accell SMART pool). The target sequences of Mapt siRNA are (1) 5ʹ-GCAGUGUGCAAAUAGUCUA-3ʹ, (2) 5ʹ-CCCUUGAUUGAAAUGUUUU-3ʹ, (3) 5ʹ-UUAUGAGCCUUCAAACUUC-3ʹ, (4) 5ʹ-UCAUCUUUCCAAAUUGAUU-3ʹ. The siRNAs were resuspended in 1X siRNA buffer to a concentration of 20 µM according to manufacturer’s instructions. After establishing fluidic isolation, the neuritic side of the microfluidic chambers was treated with either Mapt siRNA or with non-targeting siRNA labeled with the fluorescein derivative FAM (carboxyfluorescein; Thermo Fisher Scientific, C1360) at a concentration of 1 µM for 3 days. Following treatment, the neurons in the chambers were fixed for fluorescence observation. For western blotting, neurons cultured in 24-well plates were treated with appropriate siRNAs and total lysates were collected and probed with K9JA and anti-ACTB antibodies.
Cytotoxicity assay
Cytotoxicity was determined by a LDH (lactate dehydrogenase) assay kit (Roche Applied Science, 11,644,793,001) according to manufacturer’s manual. Primary neurons were seeded at a density of ~ 3–6 × 10⁴ cells on the somal side of the MFCs. After 3 weeks the neuronal processes traversing the channels into the neuritic side were treated with the different protein degradation inhibitors for 24 h. Then 50 µl of medium was collected from the neuritic and somal side of control and treated cultures for LDH measurements. Results are shown as the relative change in OD reading in each condition and comparisons between the somal and neuritic sides were carried out separately.
Immunofluorescence
Immunofluorescence was performed as described previously [Citation69] with slight modifications. Following treatment of the neurons, the MFCs were removed carefully and the neurons were fixed with 3.7% formaldehyde (Sigma Aldrich, F1635), 4% sucrose (Sigma Aldrich, S7903) in PBS for 30 min at 37°C. Then the cells were washed 3 times with PBS and permeabilized with 0.1% Triton X-100 for 10 min at room temperature and blocked in 5% bovine serum albumin (BSA; Gerbu, 1501–0500) for 1 h at room temperature followed by incubation with the primary and secondary antibodies in 1% BSA. The following primary and secondary antibodies were used: K9JA (1:1000), MAP2 (Sigma Aldrich, M-1406; 1:200), SQSTM1/p62 (Abnova, H00008878-M01; 1:500), DA9 (1:100) and PHF1 (1:1000) (both gifts from P. Davies, Litwin-Zucker Center for Alzheimer’s Disease, Feinstein Institute for Medical Research, HOFSTRA University, Hempstead, New York), ubiquitin (DAKO, Z045801;1:50), MAP2 (Abcam; ab5392-25; 1:10,000), p-MAPT/Tau (p-S262/p-S356) (12E8, 1:1000, gift of P. Seubert, Elan Pharmaceuticals), p-MAPT/Tau (Ser202, Thr205) (AT8; Thermo Fisher Scientific, MN1020; 1:1500), and DBN1/Drebrin (Enzo Life Sciences, ADI-NBA-110-E; 1:300). Fluorescently labeled secondary antibodies (Cy2, Cy3, Cy5, Alexa Fluor 488, and Alexa Fluor 647) were purchased from Dianova (Dianova, 111–165-144, 715–605-151, 715–165-151,115–165-062, 715–545-151, 111–165-144, 711–605-152, 112–175-062, 103–165-155, 715–605-155, 703–165-155). After incubation with the primary and secondary antibodies, the coverglasses were mounted onto glass microscope slides using Fluormount G (SouthernBiotech, 0100–01).
Confocal imaging
The neurons were observed with a 20x, 40x and a 63x objective on a LSM700 microscope (Zeiss) or Fluoview fv1000 (Olympus) using lasers, beam splitters and filters according to the fluorophores. The smartsetup of the ZEN software was used to select the different lasers for imaging different fluorescent dyes. The laser power was used at 1.0% to avoid saturation of the dyes. A Z-stack of the images was taken which were merged using the ‘maximum intensity projection’ option in the software. Quantification of dendrites containing missorted MAPT was done by counting almost all dendrites that projected through the microgrooves to the neuritic side (the side of treatment). Orthogonal views of a z-slice of the processes were used when necessary to check 3-dimensional arrangement of cell processes, e.g. (Figure S1C).
Fluorescence in situ hybridization
The fluorescence RNA in situ hybridization was done using a ‘ViewRNATM ISH Cell Assay (Thermo Fisher Scientific, QVC0001), according to the manufacturer’s manual. In brief, neurons in microfluidic chambers were fixed with 3.7% formaldehyde, 4% sucrose for 30 min at 37°C, then permeabilized with the detergent solution for 5 min and washed twice with PBS. Afterwards, the neurons were treated with the protease (1:10,000) for 10 min at room temperature and washed 3 times with 1X PBS. The cells were incubated with the probe set for rat Mapt/Tau mRNA or GFP mRNA diluted in pre-warmed diluent (1:100) at 40°C for 3 h. After washing with the ‘washing buffer’ 3 times each for 2 min, neurons were incubated with pre-amplifier, Amplifier and Label probe mix in respective pre-warmed diluents (1:25) each for 30 min at 40°C, with washes in between for 2 min with washing buffer. Finally, the neurons were washed in washing buffer 3 times, once with PBS and blocked in 5% BSA for 1 h at room temperature, followed by incubation with primary antibodies – K9JA (1:1000) and MAP2 (1:200) for 1 h at 37°C. After washing with PBS 3 times, the neurons were incubated for 1 h with Cy3-labeled (1:200) and Alexa Fluor 647-labeled secondary antibodies (1:200). After incubation with secondary antibodies the cells were washed 3 times with PBS, and fluoromount-G was added to all the wells of the MFCs. The probe sets bind to adjacent regions of the mRNA followed by the binding of the preamplification probes spanning the probe sets. This is in turn followed by the binding of the amplification and label probes which can amplify the signal ~ 8000 fold for each mRNA transcript.
Statistical analysis
Error bars show the mean ± SEM for multiple experiments as indicated in the figure legends. Statistical analysis was conducted using GraphPad Prism 6 software. The significance of differences was analyzed by Student’s t test or one-way ANOVA with Tukey’s post hoc test. In all the experiments, the confidence interval was set at 95%. Hence, a p-value < 0.05 was considered to be statistically significant.
Author contributions
VB performed experiments, contributed to experimental design, data analysis and writing of the manuscript. SK performed experiments, contributed to experimental design, data analysis and revised the version of the manuscript. YW contributed to experimental design, data analysis and writing of the manuscript. EM and E-MM supervised the study, contributed to experimental design and writing of the manuscript. All authors revised the article critically for intellectual content and have read and approved the final version of the manuscript.
Supplemental Material
Download Zip (3.1 MB)Acknowledgments
The authors thank J. Roth and J. Luedtke for preparing primary neurons. We thank Dr. P. Seubert (Elan Pharma, South San Francisco, CA, USA) for antibody 12E8 and Dr. P. Davies (Litwin-Zucker Center for Alzheimer’s Disease, Feinstein Institute for Medical Research,
HOFSTRA Univesity, Hempstead, New York) for PHF1 antibody.
Disclosure statement
No potential conflict of interest was reported by the authors.
Supplementary material
Supplemental data for this article can be accessed here.
Additional information
Funding
Related Research Data
References
- Mandelkow EM, Mandelkow E. Biochemistry and cell biology of tau protein in neurofibrillary degeneration. Cold Spring Harb Perspect Med. 2012 Jul;2(7):a006247. PubMed PMID: 22762014; PubMed Central PMCID: PMC3385935.
- Drubin DG, Kirschner MW. Tau protein function in living cells. J Cell Biol. 1986 Dec;103(6 Pt 2):2739–2746. PubMed PMID: 3098742; PubMed Central PMCID: PMC2114585.
- Binder LI, Frankfurter A, Rebhun LI. The distribution of tau in the mammalian central nervous system. J Cell Biol. 1985 Oct;101(4):1371–1378. PubMed PMID: 3930508; PubMed Central PMCID: PMC2113928.
- Kosik KS, Joachim CL, Selkoe DJ. Microtubule-associated protein tau (tau) is a major antigenic component of paired helical filaments in Alzheimer disease. Proc Natl Acad Sci USA. 1986 Jun;83(11):4044–4048. PubMed PMID: 2424016; PubMed Central PMCID: PMC323662.
- Braak E, Braak H, Mandelkow EM. A sequence of cytoskeleton changes related to the formation of neurofibrillary tangles and neuropil threads. Acta Neuropathol. 1994;87(6):554–567. PubMed PMID: 7522386.
- Zempel H, Thies E, Mandelkow E, et al. Abeta oligomers cause localized Ca(2+) elevation, missorting of endogenous Tau into dendrites, Tau phosphorylation, and destruction of microtubules and spines. J Neurosci. 2010 Sep 8;30(36):11938–11950. PubMed PMID: 20826658.
- Thies E, Mandelkow EM. Missorting of tau in neurons causes degeneration of synapses that can be rescued by the kinase MARK2/Par-1. J Neurosci. 2007 Mar 14;27(11):2896–2907. PubMed PMID: 17360912.
- Hoover BR, Reed MN, Su J, et al. Tau mislocalization to dendritic spines mediates synaptic dysfunction independently of neurodegeneration. Neuron. 2010 Dec 22;68(6):1067–1081. PubMed PMID: 21172610; PubMed Central PMCID: PMC3026458. eng.
- Zempel H, Luedtke J, Kumar Y, et al. Amyloid-beta oligomers induce synaptic damage via Tau-dependent microtubule severing by TTLL6 and spastin. EMBO J. 2013 Nov 13;32(22):2920–2937. PubMed PMID: 24065130; PubMed Central PMCID: PMC3831312. eng.
- Ittner LM, Ke YD, Delerue F, et al. Dendritic function of tau mediates amyloid-beta toxicity in Alzheimer’s disease mouse models. Cell. 2010 Aug 6;142(3):387–397. PubMed PMID: 20655099.
- Ittner LM, Gotz J. Amyloid-beta and tau–a toxic pas de deux in Alzheimer’s disease. Nat Rev Neurosci. 2011 Feb;12(2):65–72. PubMed PMID: 21193853.
- Litman P, Barg J, Rindzoonski L, et al. Subcellular localization of tau mRNA in differentiating neuronal cell culture: implications for neuronal polarity. Neuron. 1993 Apr;10(4):627–638. PubMed PMID: 8476613.
- Kosik KS, Crandall JE, Mufson EJ, et al. Tau in situ hybridization in normal and Alzheimer brain: localization in the somatodendritic compartment. Ann Neurol. 1989 Sep;26(3):352–361. PubMed PMID: 2508535.
- Hirokawa N, Funakoshi T, Sato-Harada R, et al. Selective stabilization of tau in axons and microtubule-associated protein 2C in cell bodies and dendrites contributes to polarized localization of cytoskeletal proteins in mature neurons. J Cell Biol. 1996 Feb;132(4):667–679. PubMed PMID: 8647897; PubMed Central PMCID: PMC2199865.
- Kanai Y, Hirokawa N. Sorting mechanisms of tau and MAP2 in neurons: suppressed axonal transit of MAP2 and locally regulated microtubule binding. Neuron. 1995 Feb;14(2):421–432. PubMed PMID: 7857650.
- Morita T, Sobue K. Specification of neuronal polarity regulated by local translation of CRMP2 and Tau via the mTOR-p70S6K pathway. J Biol Chem. 2009 Oct 2;284(40):27734–27745. PubMed PMID: 19648118; PubMed Central PMCID: PMCPMC2785701.
- Li X, Kumar Y, Zempel H, et al. Novel diffusion barrier for axonal retention of Tau in neurons and its failure in neurodegeneration. EMBO J. 2011 Nov 30;30(23):4825–4837. PubMed PMID: 22009197; PubMed Central PMCID: PMC3243615.
- Nixon RA. The role of autophagy in neurodegenerative disease. Nat Med. 2013 Aug;19(8):983–997. PubMed PMID: 23921753.
- Taylor AM, Blurton-Jones M, Rhee SW, et al. A microfluidic culture platform for CNS axonal injury, regeneration and transport. Nat Methods. 2005 Aug;2(8):599–605. PubMed PMID: 16094385; PubMed Central PMCID: PMC1558906.
- Mandell JW, Banker GA. The microtubule cytoskeleton and the development of neuronal polarity. Neurobiol Aging. 1995 May-Jun;16(3):229–237. discussion 238. PubMed PMID: 7566333.
- Mercken M, Fischer I, Kosik KS, et al. Three distinct axonal transport rates for tau, tubulin, and other microtubule-associated proteins: evidence for dynamic interactions of tau with microtubules in vivo. J Neurosci. 1995 Dec;15(12):8259–8267. PubMed PMID: 8613759.
- Konzack S, Thies E, Marx A, et al. Swimming against the tide: mobility of the microtubule-associated protein tau in neurons. J Neurosci. 2007 Sep 12;27(37):9916–9927. PubMed PMID: 17855606.
- Kruger U, Wang Y, Kumar S, et al. Autophagic degradation of tau in primary neurons and its enhancement by trehalose. Neurobiol Aging. 2012 Oct;33(10):2291–2305. PubMed PMID: 22169203.
- Wang Y, Martinez-Vicente M, Kruger U, et al. Tau fragmentation, aggregation and clearance: the dual role of lysosomal processing. Hum Mol Genet. 2009 Nov 1;18(21):4153–4170. PubMed PMID: 19654187; PubMed Central PMCID: PMCPMC2758146.
- Rubinsztein DC, Gestwicki JE, Murphy LO, et al. Potential therapeutic applications of autophagy. Nat Rev Drug Discovery. 2007 Apr;6(4):304–312. PubMed PMID: 17396135.
- Rubinsztein DC, Cuervo AM, Ravikumar B, et al. In search of an “autophagomometer”. Autophagy. 2009 Jul;5(5):585–589. PubMed PMID: 19411822; eng.
- Yew EH, Cheung NS, Choy MS, et al. Proteasome inhibition by lactacystin in primary neuronal cells induces both potentially neuroprotective and pro-apoptotic transcriptional responses: a microarray analysis. J Neurochem. 2005 Aug;94(4):943–956. PubMed PMID: 15992382; eng.
- Meng L, Mohan R, Kwok BH, et al. Epoxomicin, a potent and selective proteasome inhibitor, exhibits in vivo antiinflammatory activity. Proc Natl Acad Sci USA. 1999 Aug 31;96(18):10403–10408. PubMed PMID: 10468620; PubMed Central PMCID: PMCPMC17900.
- Kopke E, Tung YC, Shaikh S, et al. Microtubule-associated protein tau. Abnormal phosphorylation of a non-paired helical filament pool in Alzheimer disease. J Biol Chem. 1993 Nov 15;268(32):24374–24384. PubMed PMID: 8226987; eng.
- Rodriguez-Navarro JA, Rodriguez L, Casarejos MJ, et al. Trehalose ameliorates dopaminergic and tau pathology in parkin deleted/tau overexpressing mice through autophagy activation. Neurobiol Dis. 2010 Sep;39(3):423–438. PubMed PMID: 20546895.
- Myeku N, Clelland CL, Emrani S, et al. Tau-driven 26S proteasome impairment and cognitive dysfunction can be prevented early in disease by activating cAMP-PKA signaling. Nat Med. 2016 Jan;22(1):46–53. PubMed PMID: 26692334.
- Kleiman R, Banker G, Steward O. Inhibition of protein synthesis alters the subcellular distribution of mRNA in neurons but does not prevent dendritic transport of RNA. Proc Natl Acad Sci USA. 1993 Dec 1;90(23):11192–11196. PubMed PMID: 8248226; PubMed Central PMCID: PMC47948. eng.
- Ghirardi M, Benfenati F, Giovedi S, et al. Inhibition of neurotransmitter release by a nonphysiological target requires protein synthesis and involves cAMP-dependent and mitogen-activated protein kinases. J Neurosci. 2004 May 26;24(21):5054–5062. PubMed PMID: 15163698; eng.
- Drubin DG, Feinstein SC, Shooter EM, et al. Nerve growth factor-induced neurite outgrowth in PC12 cells involves the coordinate induction of microtubule assembly and assembly-promoting factors. J Cell Biol. 1985 Nov;101(5 Pt 1):1799–1807. PubMed PMID: 2997236; PubMed Central PMCID: PMC2113947.
- Mondragon-Rodriguez S, Trillaud-Doppia E, Dudilot A, et al. Interaction of endogenous tau protein with synaptic proteins is regulated by N-methyl-D-aspartate receptor-dependent tau phosphorylation. J Biol Chem. 2012 Sep 14;287(38):32040–32053. PubMed PMID: 22833681; PubMed Central PMCID: PMC3442535. eng.
- Aronov S, Aranda G, Behar L, et al. Axonal tau mRNA localization coincides with tau protein in living neuronal cells and depends on axonal targeting signal. J Neurosci. 2001 Sep 01;21(17):6577–6587. PubMed PMID: 11517247.
- Drubin DG, Caput D, Kirschner MW. Studies on the expression of the microtubule-associated protein, tau, during mouse brain development, with newly isolated complementary DNA probes. J Cell Biol. 1984 Mar;98(3):1090–1097. PubMed PMID: 6421824; PubMed Central PMCID: PMC2113151. eng.
- Coleman PD, Yao PJ. Synaptic slaughter in Alzheimer’s disease. Neurobiol Aging. 2003 Dec;24(8):1023–1027. PubMed PMID: 14643374.
- Song AH, Wang D, Chen G, et al. A selective filter for cytoplasmic transport at the axon initial segment. Cell. 2009 Mar 20;136(6):1148–1160. PubMed PMID: 19268344.
- Li C, Gotz J. Somatodendritic accumulation of Tau in Alzheimer’s disease is promoted by Fyn-mediated local protein translation. EMBO J. 2017 Sep 01;36:3120–3138. PubMed PMID: 28864542.
- Menzies FM, Fleming A, Rubinsztein DC. Compromised autophagy and neurodegenerative diseases. Nat Rev Neurosci. 2015 Jun;16(6):345–357. PubMed PMID: 25991442.
- Kaushik S, Cuervo AM. Proteostasis and aging. Nat Med. 2015 Dec;21(12):1406–1415. PubMed PMID: 26646497.
- Wang Y, Mandelkow E. Tau in physiology and pathology. Nat Rev Neurosci. 2016 Jan;17(1):5–21. PubMed PMID: 26631930.
- Yamada K, Patel TK, Hochgrafe K, et al. Analysis of in vivo turnover of tau in a mouse model of tauopathy. Mol Neurodegener. 2015 Oct;26(10):55. PubMed PMID: 26502977; PubMed Central PMCID: PMCPMC4621881.
- Planel E, Richter KE, Nolan CE, et al. Anesthesia leads to tau hyperphosphorylation through inhibition of phosphatase activity by hypothermia. J Neurosci. 2007 Mar 21;27(12):3090–3097. PubMed PMID: 17376970.
- Sontag E, Nunbhakdi-Craig V, Lee G, et al. Molecular interactions among protein phosphatase 2A, tau, and microtubules. Implications for the regulation of tau phosphorylation and the development of tauopathies. J Biol Chem. 1999 Sep 3;274(36):25490–25498. PubMed PMID: 10464280.
- Ittner A, Chua SW, Bertz J, et al. Site-specific phosphorylation of tau inhibits amyloid-beta toxicity in Alzheimer’s mice. Science. 2016 Nov 18;354(6314):904–908. PubMed PMID: 27856911.
- Palop JJ, Mucke L. Network abnormalities and interneuron dysfunction in Alzheimer disease. Nat Rev Neurosci. 2016 Dec;17(12):777–792. PubMed PMID: 27829687.
- Roberson ED, Scearce-Levie K, Palop JJ, et al. Reducing endogenous tau ameliorates amyloid beta-induced deficits in an Alzheimer’s disease mouse model. Science. 2007 May 4;316(5825):750–754. PubMed PMID: 17478722.
- Kaniyappan S, Chandupatla RR, Mandelkow EM, et al. Extracellular low-n oligomers of tau cause selective synaptotoxicity without affecting cell viability. Alzheimer’s Dementia. 2017 May 18;13:1270–1291. PubMed PMID: 28528849.
- Tepper K, Biernat J, Kumar S, et al. Oligomer formation of tau protein hyperphosphorylated in cells. J Biol Chem. 2014 Dec 5;289(49):34389–34407. PubMed PMID: 25339173; PubMed Central PMCID: PMC4256367. eng.
- Kimura T, Whitcomb DJ, Jo J, et al. Microtubule-associated protein tau is essential for long-term depression in the hippocampus. Philos Trans R Soc London Ser B. 2014 Jan 5;369(1633):20130144. PubMed PMID: 24298146; PubMed Central PMCID: PMC3843876.
- Frandemiche ML, De Seranno S, Rush T, et al. Activity-dependent tau protein translocation to excitatory synapse is disrupted by exposure to amyloid-beta oligomers. J Neurosci. 2014 Apr 23;34(17):6084–6097. PubMed PMID: 24760868.
- Tai HC, Schuman EM. Ubiquitin, the proteasome and protein degradation in neuronal function and dysfunction. Nat Rev Neurosci. 2008 Nov;9(11):826–838. PubMed PMID: 18931696.
- Ehlers MD. Activity level controls postsynaptic composition and signaling via the ubiquitin-proteasome system. Nat Neurosci. 2003 Mar;6(3):231–242. PubMed PMID: 12577062.
- Asano S, Fukuda Y, Beck F, et al. Proteasomes. A molecular census of 26S proteasomes in intact neurons. Science. 2015 Jan 23;347(6220):439–442. PubMed PMID: 25613890.
- Maday S, Holzbaur EL. Compartment-specific regulation of autophagy in primary neurons. J Neurosci. 2016 Jun 01;36(22):5933–5945. PubMed PMID: 27251616; PubMed Central PMCID: PMCPMC4887563.
- Schwenk BM, Lang CM, Hogl S, et al. The FTLD risk factor TMEM106B and MAP6 control dendritic trafficking of lysosomes. EMBO J. 2014 Mar 03;33(5):450–467. PubMed PMID: 24357581; PubMed Central PMCID: PMCPMC3989627.
- Meier S, Bell M, Lyons DN, et al. Pathological Tau promotes neuronal damage by impairing ribosomal function and decreasing protein synthesis. J Neurosci. 2016 Jan 20;36(3):1001–1007. PubMed PMID: 26791227; PubMed Central PMCID: PMCPMC4719006.
- Kampers T, Friedhoff P, Biernat J, et al. RNA stimulates aggregation of microtubule-associated protein tau into Alzheimer-like paired helical filaments. FEBS Lett. 1996 Dec 16;399(3):344–349. PubMed PMID: 8985176.
- Yang YP, Hu LF, Zheng HF, et al. Application and interpretation of current autophagy inhibitors and activators. Acta Pharmacol Sin. 2013 May;34(5):625–635. PubMed PMID: 23524572; PubMed Central PMCID: PMC4002883.
- Spiro DJ, Boll W, Kirchhausen T, et al. Wortmannin alters the transferrin receptor endocytic pathway in vivo and in vitro. Mol Biol Cell. 1996 Mar;7(3):355–367. PubMed PMID: 8868465; PubMed Central PMCID: PMCPMC275889.
- Yuan H, Barnes KR, Weissleder R, et al. Covalent reactions of wortmannin under physiological conditions. Chem Biol. 2007 Mar;14(3):321–328. PubMed PMID: 17379147.
- Yamamoto A, Tagawa Y, Yoshimori T, et al. Bafilomycin A1 prevents maturation of autophagic vacuoles by inhibiting fusion between autophagosomes and lysosomes in rat hepatoma cell line, H-4-II-E cells. Cell Struct Funct. 1998 Feb;23(1):33–42. PubMed PMID: 9639028.
- Craiu A, Gaczynska M, Akopian T, et al. Lactacystin and clasto-lactacystin beta-lactone modify multiple proteasome beta-subunits and inhibit intracellular protein degradation and major histocompatibility complex class I antigen presentation. J Biol Chem. 1997 May 16;272(20):13437–13445. PubMed PMID: 9148969.
- Aikawa S, Matsuzawa F, Satoh Y, et al. Prediction of the mechanism of action of omuralide (clasto-lactacystin beta-lactone) on human cathepsin A based on a structural model of the yeast proteasome beta5/PRE2-subunit/omuralide complex. Biochim Biophys Acta. 2006 Aug;1764(8):1372–1380. PubMed PMID: 16870514.
- Mardones P, Rubinsztein DC, Hetz C. Mystery solved: trehalose kickstarts autophagy by blocking glucose transport. Sci Signal. 2016;9(416):fs2. PubMed PMID: 26905424.
- DeBosch BJ, Heitmeier MR, Mayer AL, et al. Trehalose inhibits solute carrier 2A (SLC2A) proteins to induce autophagy and prevent hepatic steatosis. Sci Signal. 2016 Feb 23;9(416):ra21. PubMed PMID: 26905426; PubMed Central PMCID: PMCPMC4816640.
- Deshpande A, Win KM, Busciglio J. Tau isoform expression and regulation in human cortical neurons. FASEB J. 2008 Jul;22(7):2357–2367. PubMed PMID: 18263702.