
ABSTRACT
Helicobacter pylori-derived CagA, a type IV secretion system effector, plays a role as an oncogenic driver in gastric epithelial cells. However, upon delivery into gastric epithelial cells, CagA is usually degraded by macroautophagy/autophagy. Hence, the induction of autophagy in H. pylori-infected epithelial cells is an important host-protective ability against gastric carcinogenesis. However, the mechanisms by which autophagosome-lysosome fusion is regulated, are unknown. Here, we report that enhancement of LAMP1 (lysosomal associated membrane protein 1) expression is necessary for autolysosome formation. LAMP1 expression is induced by nuclear translocated LRP1 (LDL receptor related protein 1) intracellular domain (LRP1-ICD) binding to the proximal LAMP1 promoter region. Nuclear translocation of LRP1-ICD is enhanced by H. pylori infection. In contrast, CAPZA1 (capping actin protein of muscle Z-line alpha subunit 1) inhibits LAMP1 expression via binding to LRP1-ICD in the nuclei. The binding of CAPZA1 to LRP1-ICD prevents LRP1-ICD binding to the LAMP1 proximal promoter. Thus, in CAPZA1-overexpressing gastric epithelial cells infected with H. pylori, autolysosome formation is inhibited and CagA escapes autophagic degradation. These findings identify CAPZA1 as a novel negative regulator of autolysosome formation and suggest that deregulation of CAPZA1 expression leads to increased risk of gastric carcinogenesis.
Abbreviations: CagA: cytotoxin-associated gene A; CAPZA1: capping actin protein of muscle Z-line alpha subunit 1; ChIP: chromatin immunoprecipitation; GTF2I: general transcription factor IIi; HDAC: histone deacetylase; LAMP1: lysosomal associated membrane protein 1; LRP1: LDL receptor related protein 1; LRP1-ICD: CagA intracellular domain; qPCR: quantitative polymerase chain reaction; VacA: vacuolating cytotoxin.
Introduction
Epidemiological studies have demonstrated a close relationship between Helicobacter pylori infection and gastric cancer [Citation1,Citation2]. This notion is supported by animal studies demonstrating that H. pylori infection causes corpus-predominant atrophic gastritis, a precancerous condition [Citation3,Citation4]. Specifically, Ohnishi et al. found that systemic expression of H. pylori-derived CagA (cytotoxin-associated gene A) in transgenic mice leads to gastrointestinal malignancies, indicating that CagA plays an active role in the development of gastric cancer [Citation5]. The CagA is delivered into gastric epithelial cells through a bacterial type IV secretion system [Citation6]. Upon delivery, CagA undergoes tyrosine phosphorylation at the Glu-Pro-Ile-Tyr-Ala (EPIYA) repeat region and thereby aberrantly activates PTPN11/SHP2, which is recognized as a pro-oncogenic phosphatase [Citation7]. However, it has been shown that translocated CagA is usually degraded by autophagy [Citation8]. Therefore, if intracellular CagA does indeed trigger oncogenic pathways, it must escape autophagic degradation.
Autophagy is an evolutionarily conserved system for the degradation of cytoplasmic contents in mammalian cells. Cytoplasmic proteins, organelles, and invading bacteria are sequestered within an autophagosome, which subsequently fuses with a lysosome; degradation of the contents ensues. In H. pylori-infected gastric mucosa, autophagy is involved not only in the degradation of translocated CagA but also in suppressing the growth of intracellular H. pylori, thus contributing to protection against inflammation and eventual carcinogenesis [Citation9]. Terebiznik et al. reported that autophagy is induced by VacA (vacuolating cytotoxin) in AGS cells infected with H. pylori [Citation10]. Moreover, our previous studies showed that this autophagic process is activated by the accumulation of reactive oxygen species (ROS) after VacA binds to LRP1 (LDL receptor related protein 1) [Citation8,Citation11]. However, it remains unclear how autophagosome-lysosome fusion is regulated in H. pylori-infected cells.
Lysosomes present a highly acidic environment; each lysosome includes more than 50 soluble acid hydrolases. Lysosomes are an important subcellular organelle in the facilitation of autophagosome content degradation. LAMP1 (lysosomal associated membrane protein 1) is a major protein component of the lysosomal membrane. LAMP1 mainly plays a role in protecting the lysosomal membrane against the action of hydrolases [Citation12]. In this study, we show that LAMP1 expression is induced by H. pylori infection, contributing to the formation of CagA-degrading autolysosomes.
The F-actin capping protein is a heterodimeric protein composed of α and β subunits. CAPZA1 (capping actin protein of muscle Z-line alpha subunit 1) encodes the α subunit of F-actin capping protein [Citation13]. CAPZA1 regulates actin polymerization and cell motility via binding to the barbed ends of actin filaments [Citation14–Citation17]. Except for its role in regulating actin dynamics, other physiological functions of CAPZA1 have not been elucidated. In the present study, we demonstrate that CAPZA1 plays a role as negative regulator of autolysosome formation by inhibiting LAMP1 expression.
Results
Enhanced LAMP1 expression is necessary for caga-degrading autolysosome formation
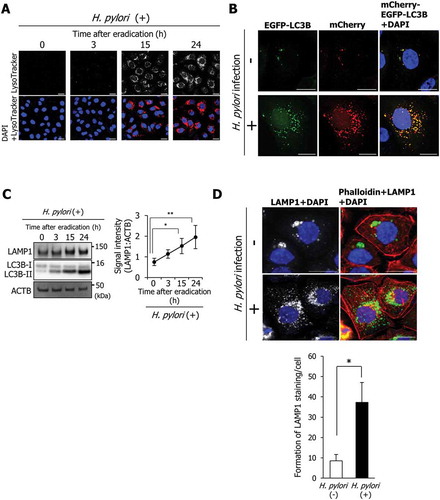
In H. pylori-infected AGS cells undergoing bacterial eradication 5 h post-infection, translocated CagA is degraded by autophagy at 15 and 24 h after eradication [Citation8]. Staining with LysoTracker Red, which stains autolysosomes but not early autophagosomes, was enhanced in AGS cells at 15 and 24 h after H. pylori eradication (). Additionally, autophagic-flux assays based on the use of mCherry-EGFP-LC3B indicated that the number of red and yellow puncta in AGS cells at 24 h after H. pylori eradication was higher than that in uninfected control cells ()). In these assays, yellow puncta (green merged with red) indicate autophagosomes, whereas red puncta indicate autolysosomes [Citation18,Citation19]. These results showed that fusion of autophagosomes and lysosomes is also enhanced in AGS cells at 15 and 24 h after H. pylori eradication. However, the mechanisms by which autophagosome-lysosome fusion is promoted are unknown. Remarkably, LAMP1 expression was significantly increased in AGS cells at 15 and 24 h after eradication ()). Moreover, formation of LAMP1 staining in AGS cells at 24 h after H. pylori eradication was also significantly higher compared with that in uninfected AGS cells ()).
Figure 1. LAMP1 expression is induced during autolysosome formation. (a) AGS cells were incubated with a medium containing antibiotic for the indicated time period, infected with H. pylori for 5 h at a multiplicity of infection value of 50 (MOI 50), and stained with LysoTracker Red DND-99. Nuclei (blue) were stained with 4ʹ,6-diamidino-2-phenylindole (DAPI). Scale bar: 20 μm. (b) AGS cells were transfected with pTet-On and TRE2hyg-mCherry-EGFP-LC3B plasmids, infected with H. pylori for 5 h (MOI 50), and incubated in a medium containing antibiotic for 24 h. Then, EGFP and mCherry signals were detected. Nuclei (blue) were stained with DAPI. Scale bar: 20 μm. (C) LAMP1 levels were determined in AGS cells that were incubated with a medium containing antibiotic for the indicated duration after H. pylori infection for 5 h (MOI 50). Data are presented as the mean ± SD of 3 independent assays. *P < 0.05, **P < 0.01. (D) AGS cells were infected with H. pylori for 5 h (MOI 50) and incubated in a medium containing antibiotic for 24 h. Then, staining for LAMP1 and phalloidin staining were performed. Nuclei (blue) were stained with DAPI. Scale bar: 20 μm. The number of LAMP1-staining puncta were counted by using the ImageJ program. Data are presented as the mean ± SD of 3 independent images. *P < 0.05.
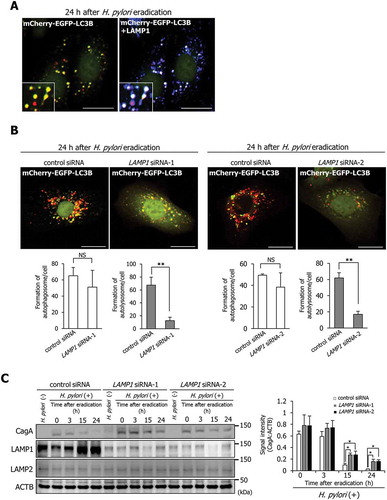
Additionally, we observed colocalization of LAMP1 with both yellow and red puncta in AGS cells transfected with the mCherry-EGFP-LC3B plasmid 24 h after H. pylori eradication, indicating that enhanced LAMP1 expression is an important step in connecting lysosomes with autophagosomes (). Subsequently, to examine whether enhanced LAMP1 expression is an essential event for autolysosome formation responsible for CagA degradation, we constructed specific LAMP1-knockdown AGS cells transfected with the mCherry-EGFP-LC3B plasmid using small interfering RNAs (siRNAs). To rule out off-target effects of siRNA, we used 2 different LAMP1 siRNAs (LAMP1 siRNA-1 and LAMP1 siRNA-2). Although the number of yellow puncta (indicating autophagosomes) was not altered by specific knockdown of LAMP1, the number of red puncta (indicating autolysosomes) was significantly decreased (). In addition, the levels of translocated CagA in AGS cells at 15 and 24 h after H. pylori eradication following LAMP1 knockdown were significantly higher than those in control cells, indicating that enhanced LAMP1 expression was required for CagA degradation ()). We then examined the expression levels and distribution of LAMP2 upon LAMP1 knockdown. The LAMP2 expression levels and distributions were not altered by LAMP1 knockdown () and S1A). In addition, we examined whether LAMP2 contributes to the formation of autolysosomes upon LAMP1 knockdown. LAMP2 did not colocalize with either yellow or red puncta in AGS cells transfected with the mCherry-EGFP-LC3B vector 24 h after H. pylori eradication following LAMP1 knockdown (Fig. S1B). These results showed that LAMP2 does not contribute to the autolysosome formation alternatively to LAMP1 upon LAMP1 knockdown. Our observations demonstrate that induction of LAMP1 expression facilitates autolysosome formation, leading to CagA degradation.
Figure 2. Increased LAMP1 expression mediates the formation of CagA-degrading autolysosomes. (a) AGS cells were transfected with pTet-On and TRE2hyg-mCherry-EGFP-LC3B plasmids, infected with H. pylori for 5 h (MOI 50), incubated in a medium containing antibiotic for 24 h, and then, immunostained for LAMP1. Scale bar: 20 μm. (b) AGS cells, which had been transfected with pTet-On and TRE2hyg-mCherry-EGFP-LC3B plasmids, were transfected with control, LAMP1 siRNA-1, or LAMP1 siRNA-2, infected with H. pylori for 5 h (MOI 50), and incubated in a medium containing antibiotic for 24 h. Thereafter, autophagosomes (yellow puncta) and autolysosomes (red puncta) were counted. Scale bar: 20 μm. Data are presented as the mean ± SD of 3 independent assays. **P < 0.01; NS, not significant. (c) AGS cells transfected with control, LAMP1 siRNA-1, or LAMP1 siRNA-2, had been infected with H. pylori for 5 h (MOI 50), and incubated in a medium containing antibiotic for the indicated times. Data are presented as the mean ± SD of 3 independent assays. *P < 0.05.
LRP1-ICD induces LAMP1 expression in H. pylori-infected AGS cells
We subsequently examined the induction mechanism of LAMP1 expression in H. pylori-infected AGS cells. We had previously found that the autophagic pathway causing CagA degradation is triggered by VacA binding to LRP1 [Citation8,Citation11]. Zurhove et al. reported that the 12-kDa C-terminal fragment of the intracellular LRP1 domain (LRP1-ICD) translocates efficiently to the nucleus, where it acts as a transcriptional regulator [Citation20]. In uninfected AGS cells, nuclear translocation of LRP1-ICD was detected using western blotting (, lane 2). Additionally, 24 h after H. pylori eradication, increased nuclear accumulation of LRP1-ICD was observed compared with that in AGS cells at 0 h after H. pylori eradication (), lanes 4 and 6). From these observations, we hypothesized that LAMP1 expression is induced by LRP1-ICD translocated to the nucleus. To confirm this hypothesis, we first examined the effect of specific LRP1-knockdown on LAMP1 expression. To rule out off-target effects of siRNA, we used 2 different LRP1 siRNAs (LRP1 siRNA-1 and LRP1 siRNA-2). The specific LRP1-knockdown repressed LAMP1 expression in uninfected AGS cells compared with that of control siRNA ()). Additionally, although the LAMP1 expression was enhanced in AGS cells treated with control siRNA at 15 and 24 h after H. pylori eradication, this enhanced LAMP1 expression was not detected in specific LRP1-knockdown AGS cells ()). Second, we examined whether disruption of LRP1-ICD translocation to the nucleus from the cytoplasm inhibits induction of LAMP1 expression by H. pylori infection. Treatment with leptomycin B, a potent inhibitor of cytoplasm-nuclear transportation [Citation21], repressed nuclear translocation of LRP1-ICD in AGS cells at 24 h after H. pylori eradication (Fig. S2A). Under this condition, LAMP1 expression was not enhanced in AGS cells at 15 or 24 h after H. pylori eradication ()). These results showed that nuclear translocation of LRP1-ICD is required for enhancing LAMP1 expression.
Figure 3. LRP1-ICD induces LAMP1 expression via binding to the LAMP1 proximal promoter. (a) AGS cells were infected with H. pylori for 5 h (MOI 50) and incubated in a medium containing antibiotic for 0 and 24 h. Then, subcellular fractionation of these cells indicated the localization of LRP1-ICD in cytoplasmic (Cyt) and nuclear (Nuc) extracts. (b) AGS cells were transfected with control, LRP1 siRNA-1, or LRP1 siRNA-2, and incubated for the indicated time period prior to analysis of protein extracts with the indicated antibodies by western blot. (c) AGS cells were transfected with control, LRP1 siRNA-1, or LRP1 siRNA-2, infected with H. pylori for 5 h (MOI 50), and incubated in a medium containing antibiotic for the indicated times, then analyzed by western blot. (d) AGS cells were treated with 200 nM leptomycin B, infected with H. pylori for 5 h (MOI 50), and incubated in a medium containing antibiotic for the indicated times. (e) AGS cells were transfected with LRP1 siRNA-1 or LRP1 siRNA-2, infected with H. pylori for 5 h (MOI 50), incubated in a medium containing antibiotic for 0 or 24 h, and then a ChIP assay was performed on these cells by using an anti-LRP1-carboxyterminal end antibody or an IgG from rabbit serum. Real-time PCR demonstrated relative enrichment of LAMP1 target promoter genes in the DNA fragments pulled down by an anti-LRP1-carboxyterminal end antibody and an IgG from rabbit serum. The result shown is representative of those observed in 2 independent experiments.
We subsequently used chromatin immunoprecipitation (ChIP) with an antibody against the C terminus of LRP1 to determine whether LRP1-ICD interacts with the LAMP1 proximal promoter. We used qPCR primers specifically designed for −1 kb from the transcription start site of the LAMP1 gene. Increased binding of LRP1-ICD to the LAMP1 proximal promoter region was detected in AGS cells at 24 h after H. pylori eradication compared with uninfected AGS cells ()). The detection of increased binding of LRP1-ICD to the LAMP1 proximal promoter region was cancelled by specific LRP1-knockdown ()). Additionally, increased binding of LRP1-ICD to the LAMP1 proximal promoter region was not detected using serum IgG for a control immunoprecipitation as well ()). These observations suggest that enhanced nuclear translocation of LRP1-ICD induces LAMP1 expression by binding to the promoter region.
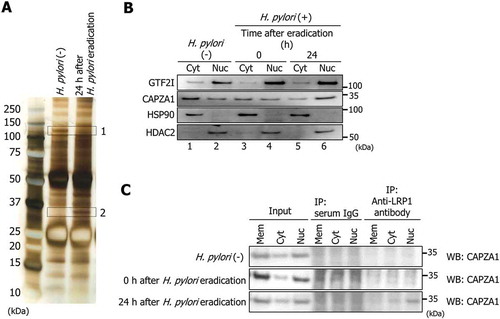
Subsequently, to investigate the details of regulation mechanisms of LAMP1 expression by LRP1-ICD in H. pylori-infected AGS cells, we searched for proteins interacting with LRP1-ICD in AGS cells at 24 h after H. pylori eradication using an immunoprecipitation assay. To this end, we employed an antibody against the C terminus of LRP1. As shown in , we detected 1 protein that dissociated from LRP1-ICD (protein band 1, ~ 120 kDa) and another protein that bound to LRP1-ICD (protein band 2, ~ 35 kDa) in AGS cells at 24 h after H. pylori eradication. Using HPLC-Chip-MS/MS, we determined that the 2 bands were GTF2I (general transcription factor IIi) and CAPZA1, respectively (). The dissociation of GTF2I from LRP1-ICD and binding of CAPZA1 to LRP1-ICD were confirmed using western blot analysis of the immunoprecipitates (Fig. S2B and C). GTF2I, a multi-functional transcription factor with broad biochemical and biological activities, was localized mainly in the nuclei ()), and consequent dissociation of GTF2I from LRP1-ICD occurred in the nuclei (Fig. S2D). CAPZA1, which plays an important role in regulating actin reorganization, was localized in both the cytoplasm and nuclei ()). Remarkably, using anti-LRP1 antibody for immunoprecipitation, the CAPZA1 signals were detected in the nucleus fraction of AGS cells at 24 h after H. pylori eradication ()). The CAPZA1 signals were not detected using serum IgG as a control for the immunoprecipitation ()). These results show that binding of CAPZA1 to LRP1-ICD in AGS cells at 24 h after H. pylori eradication occurred mainly in the nuclei.
Table 1. List of proteins identified by the HPLC-Chip-MS/MS system.
Figure 4. CAPZA1 binds to LRP1-ICD during autophagy induction. (a) AGS cells were infected with H. pylori for 5 h (MOI 50) and incubated in a medium containing antibiotic for 24 h. Then, an immunoprecipitation assay was performed on these cells with an anti-LRP1-carboxyterminal end antibody. The immunoprecipitate was subjected to SDS-PAGE, the gel was stained with a silver stain, and then 2 proteins (protein band 1 and 2) were identified by HPLC-Chip-MS/MS experiments using an Agilent 1100 LC/MSDTrap-XCT series system. (b) AGS cells were infected with H. pylori for 5 h (MOI 50) and incubated in a medium containing antibiotic for 0 and 24 h. Then, subcellular fractionation of these cells indicated the localization of GTF2I and CAPZA1 in cell membrane (Mem), cytoplasmic (Cyt) and nuclear (Nuc) extracts. (c) AGS cells were infected with H. pylori for 5 h (MOI 50) and incubated in a medium containing antibiotic for 0 and 24 h. After subcellular fractionation of these cells, an immunoprecipitation assay was performed with an anti-LRP1-carboxyterminal end antibody or an IgG from rabbit serum.
CAPZA1 suppresses LAMP1 expression via binding to LRP1-ICD
To analyze the role of CAPZA1 on LAMP1 expression by LRP1-ICD, we constructed CAPZA1-overexpressing AGS cells by transfecting with a pCMV6-CAPZA1 plasmid. The levels of CAPZA1 protein were increased more than 3 fold in CAPZA1-overexpressing AGS cells (). As a result, LAMP1 expression in uninfected CAPZA1-overexpressing AGS cells was reduced to less than one-half, suggesting that CAPZA1 overexpression contributed to the repression of LAMP1 expression ()). Furthermore, the immunostaining signal for LAMP1 was not increased in CAPZA1-overexpressing AGS cells at 24 h after H. pylori eradication compared with that in uninfected CAPZA1-overexpressing AGS cells ()). Additionally, no increase in LysoTracker Red staining in CAPZA1-overexpressing AGS cells at 24 h after H. pylori eradication was detected ()).
Figure 5. Overexpression of CAPZA1 inhibits the formation of CagA-degrading autolysosomes via repressing LAMP1 expression. (a) AGS cells were transfected with pCMV-control or pCMV-CAPZA1 plasmid, incubated for the indicated time periods, and then CAPZA1 and LAMP1 expression levels were determined. (b) AGS cells were transfected with pCMV-CAPZA1 plasmid, infected with H. pylori for 5 h (MOI 50), and incubated in a medium containing antibiotic for 24 h. Then, LAMP1 and phalloidin staining were performed. Nuclei (blue) were stained with DAPI. Scale bar: 20 μm. The number of LAMP1-staining puncta were counted by using the ImageJ program. Data are presented as the mean ± SD of 3 independent images. NS, not significant. (c) AGS cells were transfected with pCMV-CAPZA1 plasmid, infected with H. pylori for 5 h (at MOI 50), and incubated in a medium containing antibiotic for 24 h. Then, LysoTracker Red DND-99 staining was performed. Nuclei (blue) were stained with DAPI. Scale bar: 20 μm. The number of LysoTracker Red-staining puncta were counted by using the ImageJ program. Data are presented as the mean ± SD of 3 independent images. NS, not significant. (d) AGS cells were transfected with pCMV-control or pCMV-CAPZA1 plasmids, infected with H. pylori for 5 h (MOI 50), and incubated in a medium containing antibiotic for the indicated times. Data are presented as the mean ± SD of 3 independent assays. *P < 0.05, **P < 0.01. (e) AGS cells were transfected with pCMV-CAPZA1 plasmid, infected with H. pylori for 5 h (at MOI 50), and incubated in a medium containing antibiotic for 24 h. Then, a ChIP assay was performed on these cells with an anti-LRP1-carboxyterminal end antibody. Real-time PCR demonstrated relative enrichment of LAMP1 target promoter genes in the DNA fragments pulled down by an anti-LRP1-carboxyterminal end antibody. Result shown is representative of those observed in 2 independent experiments. (f) AGS cells were infected with H. pylori for 5 h (MOI 50) and incubated in a medium containing antibiotic for 24 h. Then, a ChIP assay was performed on these cells with an anti-CAPZA1 antibody. Real-time PCR demonstrated relative enrichment of LAMP1 target promoter genes in the DNA fragments pulled down by an anti-CAPZA1 antibody. Result shown is representative of those observed in 2 independent experiments.
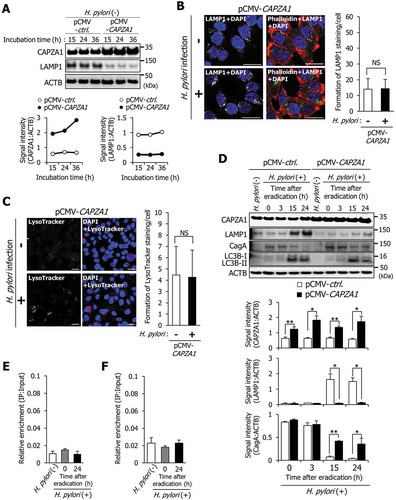
Subsequently, we examined the effect of CAPZA1 overexpression on cytoplasm-nuclear transportation of LRP1-ICD. In uninfected AGS cells, nuclear translocation of LRP1-ICD was detected using western blot analysis (Fig. S3, lane 2). In contrast, nuclear translocation of LRP1-ICD in uninfected CAPZA1-overexpressing AGS cells was not detected (Fig. S3, lane 8). It was thought that this was the reason why LAMP1 expression was repressed in uninfected CAPZA1-overexpressing AGS cells ()). However, nuclear translocation of LRP1-ICD in CAPZA1-overexpressing AGS cells was enhanced at 24 h after H. pylori eradication (Fig. S3, lane 12). These results indicate that although overexpression of CAPZA1 has the ability to inhibit the nuclear translocation of LRP1-ICD, overexpression of CAPZA1 cannot inhibit enhanced nuclear translocation of LRP1-ICD by H. pylori infection. In CAPZA1-overexpressing AGS cells infected with H. pylori, LAMP1 expression was not increased at 15 or 24 h after H. pylori eradication, and the levels of translocated CagA were significantly increased in CAPZA1-overexpressing AGS cells 15 and 24 h after H. pylori eradication ()). Interestingly, the conversion of LC3B-I to LC3B-II was clearly detected in CAPZA1-overexpressing AGS cells infected with H. pylori ()). These results show that the degradation of CagA was repressed in CAPZA1-overexpressing cells by inhibiting induction of LAMP1 expression.
We subsequently examined whether enhancement of LRP1-ICD binding to the LAMP1 proximal promoter was suppressed in H. pylori-infected CAPZA1-overexpressing AGS cells. The increased binding of LRP1-ICD to the LAMP1 proximal promoter, the phenomenon we described above ()) in CAPZA1-overexpressing AGS cells at 24 h after H. pylori eradication, was not observed ()). Moreover, increased binding of CAPZA1 to the LAMP1 proximal promoter was not observed using an anti-CAPZA1 antibody in AGS cells at 24 h after H. pylori eradication, suggesting that CAPZA1 does not directly repress LAMP1 gene expression ()).
We subsequently examined the effect of specific CAPZA1 knockdown on LAMP1 expression in AGS cells using siRNAs. To rule out off-target effects of siRNA, we used 2 different CAPZA1 siRNAs (CAPZA1 siRNA-1 and CAPZA1 siRNA-2). CAPZA1 expression was decreased in uninfected AGS cells treated with each CAPZA1 siRNA at 36 h (). Neither of the specific CAPZA1 knockdowns in uninfected AGS cells affected LAMP1 expression at 36 h ()) In contrast, each specific knockdown of CAPZA1 significantly increased LAMP1 expression at 15 and 24 h after eradication of H. pylori, suggesting that CAPZA1 functioned as a negative regulator of LAMP1 expression in H. pylori-infected AGS cells ()). However, degradation of intracellular CagA was not enhanced by treatment with CAPZA1 siRNA, even though LAMP1 expression was increased ()). The reason for this was considered to be that CAPZA1 did not participate in autophagosome formation, the rate-limiting step in CagA degradation. Indeed, specific knockdown of CAPZA1 did not enhance the conversion of LC3B-I to LC3B-II ()).
Figure 6. CAPZA1 and GTF2I function as negative regulators of LAMP1 expression. (a) AGS cells were transfected with control siRNA, CAPZA1 siRNA-1, or CAPZA1 siRNA-2 and incubated for the indicated durations. (b) AGS cells were transfected with control siRNA, CAPZA1 siRNA-1, or CAPZA1 siRNA-2, infected with H. pylori for 5 h (at MOI 50), and incubated in a medium containing antibiotic for the indicated time periods. Data are presented as the mean ± SD of 3 independent assays. *P < 0.05, NS, not significant. (c) AGS cells were transfected with control siRNA, GTF2I siRNA-1, or GTF2I siRNA-2 and incubated for the indicated durations. (d) AGS cells were transfected with control siRNA, CAPZA1 siRNA-1, CAPZA1 siRNA-2, GTF2I siRNA-1, or GTF2I siRNA-2, infected with H. pylori for 5 h (at MOI 50), and incubated in a medium containing antibiotic for the indicated time periods. The mRNA expression of LAMP1 was quantified by real-time qRT-PCR. Data are presented as the mean ± SD of 3 independent assays. *P < 0.05, **P < 0.01. (e) AGS cells were transfected with PCMV-control or pCMV-CAPZA1 plasmid, infected with H. pylori for 5 h (at MOI 50), and incubated in a medium containing antibiotic for 24 h. Then, the mRNA expression of LAMP1 was quantified by real-time qRT-PCR. Data are presented as the mean ± SD of 3 independent assays. *P < 0.05.
Because GTF2I dissociates from LRP1-ICD in AGS cells at 24 h after H. pylori infection, it was considered to be uninvolved in the enhancement of LAMP1 expression in H. pylori-infected cells. We subsequently examined the role of GTF2I on LAMP1 expression in uninfected AGS cells. To rule out off-target effects of siRNA, we used 2 different GTF2I siRNAs (GTF2I siRNA-1 and GTF2I siRNA-2). Each specific knockdown of GTF2I induced LAMP1 expression, suggesting that GTF2I is a suppressor of LAMP1 expression in uninfected AGS cells ()).
These results showed that LAMP1 expression was regulated by interaction of LRP1-ICD with the LAMP1 proximal promoter, and GTF2I and CAPZA1 are suppressors of LAMP1 expression via binding to LRP1-ICD in the nucleus (, and -c)). We subsequently examined whether regulation of LAMP1 expression by LRP1-ICD occurred at the transcriptional level. The mRNA expression of LAMP1 was significantly increased in AGS cells at 24 h after H. pylori eradication, and this enhanced LAMP1 expression was further increased by each specific CAPZA1 knockdown ()). Although each specific GTF2I knockdown in uninfected AGS cells significantly increased LAMP1 mRNA expression, the LAMP1 expression in AGS cells at 24 h after H. pylori eradication was not further enhanced ()). Moreover, the induction of LAMP1 mRNA expression by H. pylori infection was significantly repressed in CAPZA1-overexpressing AGS cells at 24 h after H. pylori eradication ()). These results showed that LRP1-ICD enhances LAMP1 expression at the transcriptional level via interacting with the LAMP1 proximal promoter, and that this transcriptional regulation of LRP1-ICD is repressed by binding of GTF2I or CAPZA1.
Capza1-overexpressing cells are detected in H. pylori-infected gastric mucosa and early gastric cancer tissues
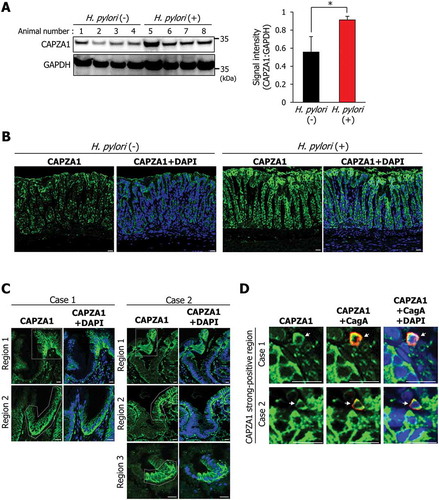
Our findings suggest that CAPZA1-overexpressing cells would accumulate CagA by H. pylori infection. We thus assessed whether CAPZA1 expression levels were affected by H. pylori infection in vivo. CAPZA1 expression in the gastric mucosa of Mongolian gerbils was significantly increased by H. pylori infection (). Moreover, gastric epithelial cells strongly stained for CAPZA1 were more strongly detected in H. pylori-infected gastric mucosa compared with uninfected gastric mucosa ()). These results showed that CAPZA1 expression in gastric mucosa was specifically increased by H. pylori infection. Subsequently, we assessed the expression pattern of CAPZA1 in endoscopically resected early gastric cancer tissues from 2 cases of human gastric adenocarcinoma. Patients 1 and 2 were a 75-year-old male and a 71-year-old male, respectively, who were H. pylori-positive and had well-differentiated adenocarcinomas. Cells strongly stained for CAPZA1 were detected in samples from both patients ()). Remarkably, intracellular CagA staining was also detected in cells strongly stained for CAPZA1 ()). The staining intensity of CAPZA1 in CagA-positive cells was significantly higher compared to their adjacent CagA-negative cells, suggesting an accumulation of translocated CagA in CAPZA1-overexpressing cells of human gastric adenocarcinoma (Fig. S4A). These results show that CAPZA1 expression levels are increased in H. pylori-infected gastric mucosa, and that this is associated with accumulation of CagA.
Figure 7. CAPZA1-overexpressing cells in H. pylori-infected gastric mucosa and early gastric cancer tissues. (a) Mongolian gerbils were inoculated with H. pylori (109 CFU/mL) or vehicle. Twelve weeks after the inoculation, the animals were sacrificed, and their stomachs were excised. Western blotting using protein extracts for detection of CAPZA1 was performed. CAPZA1 signal intensity of each mouse were analyzed using the ImageJ program. *P < 0.05. (b) Staining of the stomach tissue for CAPZA1 was performed. Scale bar: 20 μm. (c) Immunostaining for CAPZA1 in human gastric adenocarcinoma. Case 1 and case 2 indicate individual gastric adenocarcinoma tissue specimens from 2 different patients. Green color indicates CAPZA1 staining. Nuclei (blue color) were stained with DAPI. The region surrounded by the white dotted line indicates a CAPZA1 strongly stained cell area. Scale bar: 20 μm. (d) Immunostaining for CagA and CAPZA1 in human gastric adenocarcinoma. Red staining indicates intracellular CagA, and green staining indicates CAPZA1. Nuclei (blue) were stained with DAPI. Scale bar: 20 μm. Arrows indicate accumulation of translocated CagA in the gastric epithelial cells strongly stained for CAPZA1.
In tumor cells, it is conceivable that CAPZA1 inhibits epithelial-mesenchymal transition (EMT) through the regulation of actin cytoskeleton remodeling, thereby reducing the metastatic ability of the tumor cells [Citation22,Citation23]. Accordingly, it has been reported that cell migration and invasion of cancer cell lines are suppressed by overexpression of CAPZA1 [Citation22,Citation23]. In contrast, translocated CagA enhances cell migration and invasion through the upregulation of MMP7 (matrix metallopeptidase 7) by CTNNB1/β-catenin transactivation [Citation24–Citation26]. We examined the effect of H. pylori infection on the cell invasive properties of CAPZA1-overexpressing AGS cells. The invasive properties of CAPZA1-overexpressing AGS cells were significantly increased by H. pylori infection, similar to control AGS cells (Figs. S4B and C). These findings indicate that suppression of the invasive capacity of CAPZA1-overexpressing cells is cancelled by accumulation of intracellular CagA.
CAPZA1 expression is increased by HDAC inhibitor
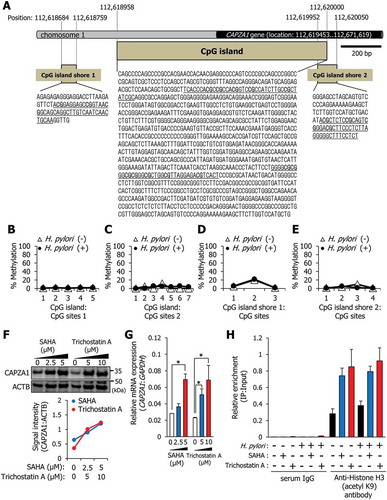
We examined the regulatory mechanisms of CAPZA1 gene expression. A CpG island was identified near the CAPZA1 gene (). Moreover, 2 CpG island shores, which are regions of comparatively low CpG density, could be predicted ()). We subsequently analyzed epigenetic regulation of the CAPZA1 gene by using bisulfite genomic sequencing. The CpG island and CpG island shores were not methylated, nor were methylation levels altered by H. pylori infection (). However, treatment with suberoylanilide hydroxamic acid (SAHA) and trichostatin A, which are potent inhibitors of histone deacetylase (HDAC), induced CAPZA1 expression (). Under these conditions, HDAC activities were significantly decreased (Fig. S5). Additionally, the CAPZA1 mRNA expression was also significantly increased in a dose-dependent manner by treatment with SAHA and trichostatin A ()). We subsequently analyzed alterations in the chromatin structure of the CAPZA1 proximal promoter region using ChIP with an antibody against the acetylated histone H3 in AGS cells infected with H. pylori. Acetylated histone H3 levels increased upon SAHA or trichostatin A treatment, but remained unaltered after H. pylori infection ()). These results showed that alteration in the chromatin structure by HDAC inhibitor-induced acetylated histone H3 is involved in the induction of CAPZA1 expression at the transcriptional level, and this alteration in the chromatin structure is not induced by H. pylori infection in vitro.
Figure 8. The CAPZA1 gene is regulated not by methylation of a CpG island, but by acetylation of histone. (a) Identification of a CpG island and CpG island shores around the CAPZA1 gene. Schematic map of the CpG island showing locations of 12 CpG sites, CpG island shore 1, and CpG island shore 2 with the indicated locations of CpG sites 3 and 4. (b, c, d, and e) AGS cells were infected with H. pylori for 5 h (MOI 50) and incubated in a medium containing antibiotic for 24 h. DNA methylation levels of 12 CpG sites of the CpG island (b and c) and of 7 CpG sites of CpG island shores (d and e) were analyzed by bisulfite genomic sequencing. (f) AGS cells were incubated with SAHA or trichostatin A for 24 h, and the levels of CAPZA1 expression were examined. (g) AGS cells were incubated with SAHA or trichostatin A for 24 h, and CAPZA1 mRNA expressions were quantified by real-time quantitative RT-PCR. Data are presented as the mean ± SD of 3 independent assays. *P < 0.05. (h) AGS cells were infected with H. pylori for 5 h (MOI 50) and incubated in a medium containing antibiotic and 5 μM SAHA or 5 μM trichostatin A for 24 h. Then, a ChIP assay was performed on these cells with an anti-histone H3 (acetyl K9) antibody or IgG from rabbit serum. Real-time PCR demonstrated the relative enrichment of CAPZA1 promoter genes in the DNA fragments pulled down by an anti-histone H3 (acetyl K9) antibody.
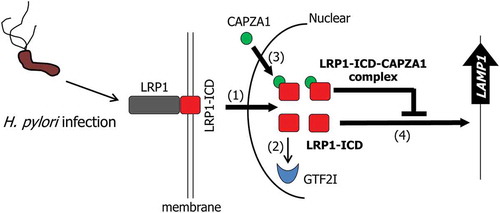
Our observations revealed the regulatory mechanisms of LAMP1 expression in H. pylori-infected AGS cells (). In AGS cells at 24 h after H. pylori eradication, as LRP1-ICD accumulation in the nucleus is enhanced, more LRP1-ICDs can bind to the LAMP1 proximal promoter and induce LAMP1 expression (). Increased expression of LAMP1 is an essential factor that promotes the formation of CagA-degrading autolysosomes. At the same time, GTF2I dissociates from LRP1-ICD, and CAPZA1 binds to LRP1-ICD in the nucleus, thereby preventing excess LRP1-ICD from binding to the LAMP1 proximal promoter (). Therefore, overexpression of CAPZA1 inhibits the induction of LAMP1 expression by H. pylori infection.
Figure 9. Schematic representation of the proposed mode of the regulation of LAMP1 expression by LRP1-ICD in the H. pylori-infected epithelial cells. In H. pylori-infected epithelial cells, translocation of LRP1-ICD to the nucleus is enhanced (1). Nuclear translocated LRP1-ICD binds to the LAMP1 promoter, leading to the induction of LAMP1 expression (2). GTF2I dissociates from LRP1-ICD (3) and CAPZA1 binds to nuclear translocated LRP1-ICD (4). The binding of CAPZA1 to LRP1-ICD in the nuclei represses binding of LRP1-ICD to the LAMP1 promoter, leading to the inhibition of LAMP1 expression.
Discussion
When CagA is delivered into gastric epithelial cells via the type IV secretion system, aberrant pro-oncogenic signals are caused by deregulation of PTPN11/SHP2 via the EPIYA motif [Citation27]. In the EPIYA repeat region, 4 distinct segments (EPIYA-A, -B, -C, and -D) have been identified [Citation6,Citation28]. These distinct EPIYA segments influence the binding activities of CagA to PTPN11/SHP2, and therefore the oncogenic activity is different for each individual CagA [Citation29]. However, our previous study showed that CagA degradation by autophagy is not affected by differences in the EPIYA segments [Citation8]. Therefore, CagA oncogenic activity is also influenced by host cell characteristics that allow accumulation of CagA through the escape from autophagic degradation. Here, we showed that CagA can escape from autophagic degradation in CAPZA1-overexpressing gastric epithelial cells.
In this study, we demonstrated that CAPZA1 expression levels in H. pylori-infected gastric mucosa of Mongolian gerbils were significantly increased (,b)). Additionally, our findings showed that histone acetylation is implicated in the regulation of CAPZA1 gene expression (–h)). Remarkably, in vitro H. pylori infection did not affect the levels of CAPZA1 expression or the levels of acetylated histone H3 at the CAPZA1 proximal promoter region (–h)). In vivo H. pylori infection causes chronic inflammation, accumulation of ROS, and oxidative DNA damage in the gastric mucosa by inducing infiltration of neutrophils, macrophages, and B and T lymphocytes [Citation30]. Therefore, the accumulation of ROS in H. pylori-infected gastric mucosa might induce CAPZA1 expression via enhancing acetylated histone H3 levels of the CAPZA1 proximal promoter.
It is known that some viral proteins enhance gene expression through the modulation of histone acetylation levels (e.g., activation of histone acetyltransferases [HATs] and/or the inhibition of HDAC activity) [Citation31]. In particular, Epstein-Barr virus (EBV) infection, known to promote the development of gastric cancer, increases HAT activity, leading to the induction of cellular gene expression [Citation32,Citation33]. Therefore, CAPZA1 expression in EBV-infected gastric epithelial cells might be increased. Recently, it has been reported that the oncogenic activity of CagA in EBV-infected epithelial cells was higher than that in non-EBV-infected epithelial cells [Citation34]. This finding suggests that CagA stabilization by CAPZA1 overexpression may be involved in the enhancement of CagA oncogenic activity in EBV-infected epithelial cells.
Delivery of the autophagosome substrate to lysosomes is an essential step for the degradation of the autophagosome contents. Fusion of autophagosomes with lysosomes is a complex process mediated via multiple molecules, including soluble N-ethylmaleimide-sensitive factor attachment protein receptors (SNAREs), endosomal sorting complex required for transport (ESCRT), and RAB7 [Citation35–Citation38]. The present study demonstrates that the increase in LAMP1 expression is essential for formation of CagA-degrading autolysosomes. Specific knockdown of LAMP1 inhibited the formation of autolysosomes; however, this did not result in the accumulation of autophagosomes ()). These results suggested that LAMP1 does not directly mediate the binding of lysosomes to autophagosomes. LAMP1 is mainly expressed in the lysosomes and late endosomes and maintains the lysosomal membrane integrity [Citation39,Citation40]. Thus, our observations indicate that enhanced LAMP1 expression promotes lysosomal biogenesis, contributing to the lysosome supply for fusion with autophagosomes. Although it has also been reported that being doubly deficient in LAMP1 and LAMP2 causes repression of autolysosome formation [Citation41–Citation43], how LAMP1 expression is regulated during autophagic processes has remained unclear.
In the present study, we showed that LAMP1 expression is induced by nuclear translocated LRP1-ICD, and that CAPZA1 plays a role in the negative regulation of LAMP1 expression by binding to LRP1-ICD. In intestinal epithelial cells, LAMP1 expression is known to be enhanced during lipopolysaccharide (LPS)-induced autophagy [Citation44]. Interestingly, treatment with a supernatant of the probiotic Bifidobacterium bifidum culture inhibits LPS-induced autophagy by repressing LAMP1 expression [Citation44]. Moreover, stimulation with LPS promotes the translocation of LRP1-ICD to the nucleus [Citation20]. These reports suggested that LPS-induced autophagy in intestinal epithelial cells follows the same mechanism as autophagosome maturation in gastric epithelial cells infected with H. pylori. It is conceivable that the enhancement of LAMP1 expression by LRP1-ICD, which is associated with the effective formation of autolysosomes in bacteria-infected epithelial cells, represents an important host defense mechanism.
Materials and methods
Cell culture and bacterial strain
The human gastric cancer AGS cell line was maintained in RPMI 1640 medium (Thermo Fisher Scientific, 11,875,093) supplemented with 10% fetal bovine serum (FBS). Helicobacter pylori strain ATCC700392 was used. Bacteria were cultured on Brucella agar (Becton Dickinson Biosciences, 211,086) containing 7% sheep blood (Nippon Bio-test Laboratories, 0102–2) and 7% FBS for 2 days at 37°C under microaerobic conditions maintained with AnaeroPack MicroAero (Mitsubishi Gas Chemical, A-28).
Drugs and antibodies
Suberoylanilide hydroxamic acid (Sigma-Aldrich, SML0061) and trichostatin A (Sigma-Aldrich, T8552) were used as histone deacetylase inhibitors. Leptomycin B (Sigma-Aldrich, L2913) was used as potent inhibitor of cytoplasm-nuclear transportation. The following antibodies were used for western blotting: anti-CagA (Austral Biologicals, HPM-5001–5; 1:2000), anti-LAMP1 (Santa Cruz Biotechnology, sc-20,011; 1:1000), anti-LAMP2 (Abcam, ab25631; 1:1000), anti-LC3B (Cell Signaling Technology, 2775S; 1:1000), anti-LRP1-carboxyterminal end (Abcam, ab76661; 1:1000), anti-LRP1 (Santa Cruz Biotechnology, sc-16,166; 1:1000), anti-HSP90 (Enzo Life Science, ADI-SPS-771-D; 1:1000), anti-HDAC2 (Thermo Fisher Scientific, 515,100; 1:1000), anti-GTF2I (Cell Signaling Technology, 4562S; 1:1000), and anti-CAPZA1 (Merck Millipore, AB6016; 1:2000). Anti-LAMP1 antibodies (Santa Cruz Biotechnology, sc-20,011; 1:50) and anti-LAMP2 antibodies (Abcam, ab25631; 1:50) were used for fluorescence immunocytochemistry. The following antibodies were used for immunohistochemical analysis: anti-CagA (Austral Biologicals, HPM-5001–5; 1:40), and anti-CAPZA1 (Merck Millipore, AB6016; 1:500). The following antibodies were used for immunoprecipitation analysis: anti-LRP1-carboxyterminal end (Abcam, ab76661; 1:50), anti-CAPZA1 (Merck Millipore, AB6016; 1:500), anti-histone H3 (acetyl K9; Abcam, ab4441; 1:250), and IgG from rabbit serum (Sigma-Aldrich, 18,140; 1:2000).
Plasmids, RNA interference, and transfection
CAPZA1 plasmid (NM_006135) was obtained from ORIGENE, and pCMV-TET3G plasmid was obtained from TaKaRa Bio (631,168). The mCherry-EGFP-LC3B cDNA was introduced into the pTRE2hyg vector (Clontech Laboratories, 631,014). Cells were grown to sub-confluence and transfected with each plasmid as well as with LAMP1 siRNA (1) (Qiagen, SI04340133; Hs_LAMP1_8) LAMP1 siRNA (2) (Qiagen, SI00467915; Hs_LAMP1_2), LRP1 siRNA (1) (Qiagen, SI03109400; Hs_LRP1_5), LRP1 siRNA (2) (Qiagen, SI00036204; Hs_LRP1_3), CAPZA1 siRNA (1) (Qiagen, SI04159302; Hs_CAPZA1_8), CAPZA1 siRNA (2) (Qiagen, SI04228588; Hs_CAPZA1_9), GTF2I-siRNA (1) (Qiagen, SI2652293; Hs_GTF2I_12), GTF2I-siRNA (2) (Qiagen, SI02652300; Hs_GTF2I_13), or control siRNA (Qiagen, 1,027,280) using Lipofectamine 2000 (Thermo Fisher Scientific, 11,668,027) according to the manufacturer’s instructions. The experiments were carried out following an overnight incubation of the transfected cells. AGS cells stably expressing CAPZA1 were obtained by selection with 0.5–1 mM G418 (Thermo Fisher Scientific, 10,131,035) for 2 weeks.
H. pylori infection in mongolian gerbils
All experiments and procedures were approved by the Keio University Animal Research Committee (08080–12). Infection of Mongolian gerbils with H. pylori was performed as described previously [Citation45]. Briefly, 7-week-old Mongolian gerbils (Sankyo Labo Service Corporation, MON/Jms/Gbs Slc) were inoculated with H. pylori strain ATCC700392 (109 colony-forming units [CFUs]/mL). Twelve weeks after inoculation, the animals were sacrificed, and their stomachs were excised. To confirm H. pylori infection, the number of viable CFUs was determined by plating on Nissui Helicobacter agar (Nissui Pharmaceutical, 51,035).
Tissue specimens
Human gastric adenocarcinoma tissue specimens were obtained from a 75-year-old male (case 1) and a 71-year-old male (case 2) who underwent endoscopic submucosal dissection at the Keio University Hospital after obtaining their written informed consent. The pathological diagnosis of both specimens was well-differentiated adenocarcinoma according to the Japanese Gastric Cancer Association classification of gastric carcinoma (14th edition). The study protocol was approved by the ethics committees of the Keio University School of Medicine (20,070,068). The study was performed in accordance with the principles of the Declaration of Helsinki.
H. pylori infection in vitro
Infection of cells with H. pylori in vitro was carried out as described previously [Citation8]. Briefly, cells were incubated with H. pylori ATCC700392 for 5 h (multiplicity of infection [MOI] of 50), and extracellular bacterial cells were killed in the presence of RPMI 1640 medium containing 400 mg/mL kanamycin for the indicated incubation period (0, 3, 15, or 24 h).
Protein identification
Proteomic analyses were carried out as described previously [Citation46,Citation47]. HPLC-Chip-MS/MS experiments were performed using an Agilent 1100 LC/MSDTrap-XCT series system. For protein identification, H. pylori or human protein database searches were performed in the NCBInr Swiss-Prot databases using Agilent Spectrum Mill MS Proteomics Workbench.
Autophagic flux assay
Reporter cells were constructed by the transfection of AGS cells with pTet-On and TRE2hyg-mCherry-EGFP-LC3B vectors. The reporter cells were maintained in RPMI 1640 medium supplemented with 10% FBS and 1 mM G418. The expression of mCherry-EGFP-LC3B in the reporter cells was induced by the presence of doxycycline (Dox; Sigma-Aldrich, D3072). Reporter cells transfected with specific siRNA molecules (LAMP1 siRNA or control siRNA) were exposed to H. pylori for 5 h, then incubated in RPMI 1640 medium containing 400 mg/mL kanamycin to kill extracellular bacteria and Dox to induce the expression of mCherry-EGFP-LC3B for 24 h and then fixed with 4% paraformaldehyde. The cells were examined using an LSM710 confocal microscope (Carl Zeiss, Oberkochen, Germany).
Cell fractionation
Soluble cytoplasmic, membrane, and nuclear proteins were separated and extracted using a subcellular protein fractionation kit (Thermo Fisher Scientific, 78,840) according to the manufacturer’s instructions. For characterization of different subcellular fractions, anti-HSP90 and anti-HDAC2 antibodies were used as markers for the cytoplasmic and the nuclear fractions, respectively.
Immunoprecipitation
Each cell lysate was incubated at 4°C overnight with an anti-LRP1-carboxyterminal end antibody. EZview Red Protein A Affinity Gel (Sigma-Aldrich, P6486) was then added, followed by overnight incubation at 4°C. The immunoprecipitate was subjected to SDS–PAGE, and the gel was stained with a silver stain MS kit (FUJIFILM Wako Chemicals, 299–58,901) for protein identification by HPLC-Chip-MS/MS. The immunoprecipitate was subjected to western blotting using an anti-CAPZA1 antibody or an anti-GTF2I antibody.
Fluorescence immunocytochemistry
To detect the localization of LAMP1, LAMP2 and mCherry-EGFP-LC3B, reporter cells were infected with H. pylori for 5 h and incubated in RPMI 1640 culture medium containing 400 mg/mL kanamycin for 24 h. The cells were washed in phosphate-buffered saline (Nacalai tesque, 14,249–24), fixed with 4% paraformaldehyde, and incubated with an anti-LAMP1 antibody (Santa Cruz Biotechnology, sc-20,011) or anti-LAMP2 antibody (Abcam, ab25631). Alexa Fluor 647-conjugated anti-mouse IgG (Thermo Fisher Scientific, A28181) and Alexa Fluor 647-conjugated anti-rabbit IgG (Thermo Fisher Scientific, A31573) were used as secondary antibodies. LysoTracker Red DND-99 (Thermo Fisher Scientific, L7528) signals in AGS cells infected with H. pylori were detected as described previously. To detect LAMP1 or LAMP2 expression, cells were infected with H. pylori for 5 h and incubated in RPMI 1640 culture medium containing 400 mg/mL kanamycin for 24 h. After fixation with 4% paraformaldehyde, the cells were incubated with rhodamine-conjugated phalloidin (Thermo Fisher Scientific, R415) at room temperature for 20 min, followed by incubation with an anti-LAMP1 antibody or an anti-LAMP2 antibody. Alexa Fluor 488-conjugated anti-mouse IgG (Thermo Fisher Scientific, A11029) was used as the secondary antibody. The samples were examined using an LSM710 Zeiss confocal microscope.
Immunohistochemistry
Tissue sections were fixed in 4% paraformaldehyde, depleted of paraffin, and rehydrated in a series of graded ethanol solutions. Tissue sections were subjected to antigen retrieval by heating for 10 min at 105°C in Target Retrieval Solution, pH 9 (Dako, S2375). The sections were incubated overnight at 4°C with the primary antibody. Immunoreactivity was detected using Alexa Fluor 568-conjugated anti-mouse IgG (Thermo Fisher Scientific, A11031) or Alexa Fluor 488-conjugated anti-rabbit IgG (Thermo Fisher Scientific, A21206). The samples were examined using an LSM710 Zeiss confocal microscope. Staining intensity of CAPZA1 were analyzed with the ImageJ program.
Chromatin immunoprecipitation (chip) assay
ChIP was performed using an EpiTect ChIP OneDay Kit (Qiagen, 334,471) and Simple ChIP Plus Sonication Chromatin IP Kit (Cell Signaling Technology, 56383S) following the manufacturer’s instructions. Briefly, cross-linking was performed using a 1%-formaldehyde solution in phosphate-buffered saline. Prior to immunoprecipitation, each input fraction was saved and used as a positive control. The supernatants were immunoprecipitated with anti-LRP1 carboxyterminal end, anti-CAPZA1, and anti-histone H3 (acetyl K9) antibodies or IgG from rabbit serum at 4°C overnight. Then, the resulting enriched genomic DNA samples were measured by qPCR using the EpiTect ChIP-qPCR Primer Assay kit for LAMP1 (Qiagen, GPH1003759(−)01A; −1 kb from the transcription start site), for CAPZA1 (Qiagen, GPH100073(-)01A; −1 kb from the transcription start site). These ChIP qPCR primers were pre-designed, and qPCR assays were optimized to measure genomic DNA in the region of −1 kb from the transcription start site of LAMP1 or CAPZA1.
Western blotting
Total protein (10 μg/lane) was separated on a 4–12% NuPAGE gradient gel (Thermo Fisher Scientific, NP0322BOX) or 10% Bis-Tris Plus gel (Thermo Fisher Scientific, NW00107BOX) and transferred to a polyvinylidene difluoride membrane (Thermo Fisher Scientific, LC2002). An anti-ACTB antibody (Sigma-Aldrich, A5316) was used as the loading control. The immunoreactive bands were detected by chemiluminescence using ECL Prime (GE Healthcare, RPN2232). Signal quantification was performed using the ImageJ program (National Institutes of Health).
Bisulfite-genomic sequencing
Genomic DNA (1 μg) was treated with sodium bisulfite by using an EpiTect plus DNA bisulfite kit (Qiagen, 59,124). Bisulfite-modified DNA was subjected to PCR as follows: 98°C for 10 min followed by 40 cycles of 98°C for 10 sec, 58°C for 30 sec, and 72°C for 30 sec. The final extension step was incubation at 72°C for 10 min. The following primer sequences were used. CpG sites 1: forward 5′-GGGTTTAGGTTAGGGATAGATGTA and reverse 5′-CCCAAAACTCAACCTTCACA; CpG sites 2: forward 5′-TAGATGGATGGGAAATGAGTGTA and reverse 5′-ACCAAAAAAACCCCATATCAATTATAC; CpG shore-1: forward 5′-AGAGAGAGGGAGGATTTTAAGAGTT and reverse 5′-CAACCTTACAATTAATTAACAAACCTA; CpG shore-2: forward 5′-GGGAGTTTAGTAGTGTTTTTAGGA and reverse 5′-ACCCCTAAACTATACCTCAAACC. Bisulfite PCR products were analyzed by pyrosequencing.
Cell invasion assay
AGS cells were transfected with pCMV-control or pCMV-CAPZA1 plasmid and infected with H. pylori for 5 h. Then, 400 mg/mL kanamycin was added to RPMI 1640 medium to kill extracellular bacteria. The cells (3 × 10⁴) were added to the top chambers of 24-well Trans-well plates, which were either coated with Matrigel® barriers (Corning, 354,165) or uncoated. After 24-h incubation, top (non-invaded) cells were removed, and bottom cells (invaded cells) were fixed and stained with hematoxylin and eosin. The numbers of invaded cells were counted, and the fraction of invaded cells was calculated [Citation48].
HDAC activity
Nuclear proteins were extracted using a subcellular protein fractionation kit (Thermo Fisher Scientific, 78,840) according to the manufacturer’s instructions. Then, HDAC activity was measured using the HDAC activity assay kit (BioVision, K331).
Total RNA isolation and real-time quantitative RT-PCR
The total RNA was isolated using the SV Total RNA Isolation system (Promega, Z3100). The reverse transcription (RT) reaction was performed using the PrimeScript RT reagent Kit (TaKaRa, RR037A) according to the manufacturer’s guidelines. Real-time polymerase chain reaction (PCR) was performed using a SYBR Premix Ex Taq Perfect Real Time Kit (TaKaRa, RR041A) in a Thermal Cycler Dice Real Time System (TaKaRa, Ohtsu, Japan). The primer sequences used were as follows: LAMP1 mRNA: forward 5ʹ-CCAGTTCGGGATGAATGCAAGT and reverse 5ʹ-TTGGCAGCTTTAAAGGCAGGGT [Citation49]; CAPZA1 mRNA: forward 5ʹ- ACAATCTCCTCAGGGAAGGGG and reverse 5ʹ-TGCTTCTTTCCGTAAGTGGTCAAA [Citation50]; GAPDH mRNA: forward 5ʹ-GACATCAAGAAGGTGGTGAAGCAG and reverse 5ʹ-ATACCAGGAAATGAGCTTGACAAA [Citation8]. The cells’ GAPDH gene were used as the internal control for the quantitative RT-PCR.
Statistical analysis
All values are expressed as the mean ± SD. Statistical significance of differences between groups was evaluated using Student’s t-test and one-way ANOVA. Statistical analysis was performed using JSTAT statistical software (version 8.2). Differences were considered to be statistically significant if P < 0.05.
Disclosure of potential conflicts of interest
During the last two years, H.S. received scholarship funds for the research from Daiichi-Sankyo Co., EA Pharma Co., Otsuka Pharmaceutical Co. Ltd., and Tsumura Co., and received service honoraria from Astellas Pharma Inc, AstraZeneca K.K., Otsuka Pharmaceutical Co. Ltd., Daiichi-Sankyo Co., EA Pharma Co., Takeda Pharmaceutical Co. Ltd., Tsumura, Co., Mylan EPD Co., and Zeria Pharmaceutical Co. Ltd.
Supplemental Material
Download MS Word (463.5 KB)Acknowledgments
We are grateful to the Collaborative Research Resources, School of Medicine, Keio University for technical assistance. This work was supported by a Grant-in-Aid for Scientific Research (C) (16K08349, to H.T.), a Grant-in-Aid for Scientific Research (B) (16H05291, to H.S.), MEXT-Supported Program for the Strategic Research Foundation at Private Universities (S1411003, to H.S.), and Keio Gijuku Academic Development Funds (to H.S.).
Supplementary Material
Supplemental data for this article can be accessed here.
Related Research Data
References
- Uemura N, Okamoto S, Yamamoto S, et al. Helicobacter pylori infection and the development of gastric cancer. N Engl J Med. 2001 Sep 13;345(11):784–789. PubMed PMID: 11556297.
- Parsonnet J, Friedman GD, Vandersteen DP, et al. Helicobacter pylori infection and the risk of gastric carcinoma. N Engl J Med. 1991 Oct 17;325(16):1127–1131. PubMed PMID: 1891020.
- Rieder G, Merchant JL, Haas R. Helicobacter pylori cag-type IV secretion system facilitates corpus colonization to induce precancerous conditions in Mongolian gerbils. Gastroenterology. 2005 May;128(5):1229–1242. PubMed PMID: 15887107.
- Suzuki H, Iwasaki E, Hibi T. Helicobacter pylori and gastric cancer. PubMed PMID: 19562461 Gastric Cancer. 2009;122:79–87.
- Ohnishi N, Yuasa H, Tanaka S, et al. Transgenic expression of Helicobacter pylori CagA induces gastrointestinal and hematopoietic neoplasms in mouse. Proc Natl Acad Sci U S A. 2008 Jan 22;105(3):1003–1008. PubMed PMID: 18192401; PubMed Central PMCID: PMCPMC2242726.
- Hatakeyama M. Oncogenic mechanisms of the Helicobacter pylori CagA protein. Nat Rev Cancer. 2004 Sep;4(9):688–694. . PubMed PMID: 15343275.
- Higashi H, Tsutsumi R, Muto S, et al. SHP-2 tyrosine phosphatase as an intracellular target of Helicobacter pylori CagA protein. Science. 2002 Jan 25;295(5555):683–686. PubMed PMID: 11743164.
- Tsugawa H, Suzuki H, Saya H, et al. Reactive oxygen species-induced autophagic degradation of Helicobacter pylori CagA is specifically suppressed in cancer stem-like cells. Cell Host Microbe. 2012 Dec 13;12(6):764–777. PubMed PMID: 23245321.
- Raju D, Hussey S, Ang M, et al. Vacuolating cytotoxin and variants in Atg16L1 that disrupt autophagy promote Helicobacter pylori infection in humans. Gastroenterology. 2012 May;142(5):1160–1171. PubMed PMID: 22333951; PubMed Central PMCID: PMCPMC3336037.
- Terebiznik MR, Raju D, Vazquez CL, et al. Effect of Helicobacter pylori’s vacuolating cytotoxin on the autophagy pathway in gastric epithelial cells. Autophagy. 2009 Apr;5(3):370–379. PubMed PMID: 19164948.
- Yahiro K, Satoh M, Nakano M, et al. Low-density lipoprotein receptor-related protein-1 (LRP1) mediates autophagy and apoptosis caused by Helicobacter pylori VacA. J Biol Chem. 2012 Sep 7;287(37):31104–31115. PubMed PMID: 22822085; PubMed Central PMCID: PMCPMC3438942.
- Eskelinen EL. Roles of LAMP-1 and LAMP-2 in lysosome biogenesis and autophagy. Mol Aspects Med. 2006 Oct-Dec;27(5–6):495–502. . PubMed PMID: 16973206.
- Kilimann MW, Isenberg G. Actin filament capping protein from bovine brain. EMBO J. 1982;1(7): 889–894. PubMed PMID: 7188363; PubMed Central PMCID: PMCPMC553127.
- Matsuo K, Xiang Y, Nakamura H, et al. Identification of novel citrullinated autoantigens of synovium in rheumatoid arthritis using a proteomic approach. Arthritis Res Ther. 2006;8(6):R175. PubMed PMID: 17125526; PubMed Central PMCID: PMCPMC1794520.
- Hopmann R, Cooper JA, Miller KG. Actin organization, bristle morphology, and viability are affected by actin capping protein mutations in Drosophila. J Cell Biol. 1996 Jun;133(6):1293–1305. PubMed PMID: 8682865; PubMed Central PMCID: PMCPMC2120907.
- Takeda S, Minakata S, Koike R, et al. Two distinct mechanisms for actin capping protein regulation–steric and allosteric inhibition. PLoS Biol. 2010;8(7):e1000416. PubMed PMID: 20625546; PubMed Central PMCID: PMCPMC2897767.
- Bombardier JP, Eskin JA, Jaiswal R, et al. Single-molecule visualization of a formin-capping protein ‘decision complex’ at the actin filament barbed end. Nat Commun. 2015;6:8707. PubMed PMID: 26566078; PubMed Central PMCID: PMCPMC4660045.
- Kimura S, Noda T, Yoshimori T. Dissection of the autophagosome maturation process by a novel reporter protein, tandem fluorescent-tagged LC3. Autophagy. 2007 Sep-Oct;3(5):452–460. PubMed PMID: 17534139.
- Klionsky DJ, Abdelmohsen K, Abe A, et al. Guidelines for the use and interpretation of assays for monitoring autophagy (3rd edition). Autophagy. 2016;12(1):1–222. PubMed PMID: 26799652; PubMed Central PMCID: PMCPMC4835977.
- Zurhove K, Nakajima C, Herz J, et al. Gamma-secretase limits the inflammatory response through the processing of LRP1. Sci Signal. 2008;1(47):ra15. PubMed PMID: 19036715; PubMed Central PMCID: PMCPMC2694618.
- Engel K, Kotlyarov A, Gaestel M. Leptomycin B-sensitive nuclear export of MAPKAP kinase 2 is regulated by phosphorylation. EMBO J. 1998 Jun 15;17(12):3363–3371. . PubMed PMID: 9628873; PubMed Central PMCID: PMCPMC1170674.
- Huang D, Cao L, Zheng S. CAPZA1 modulates EMT by regulating actin cytoskeleton remodelling in hepatocellular carcinoma. J Exp Clin Cancer Res. 2017 Jan 16;36(1):13. . PubMed PMID: 28093067; PubMed Central PMCID: PMCPMC5240199.
- Lee YJ, Jeong SH, Hong SC, et al. Prognostic value of CAPZA1 overexpression in gastric cancer. Int J Oncol. 2013 May;42(5):1569–1577. PubMed PMID: 23545944; PubMed Central PMCID: PMCPMC3661194.
- Lee YS, Lee Do Y, Yu Da Y, et al. Helicobacter pylori induces cell migration and invasion through casein kinase 2 in gastric epithelial cells. Helicobacter. 2014 Dec;19(6):465–475. PubMed PMID: 25052887.
- Bagnoli F, Buti L, Tompkins L, et al. Helicobacter pylori CagA induces a transition from polarized to invasive phenotypes in MDCK cells. Proc Natl Acad Sci U S A. 2005 Nov 8;102(45):16339–16344. PubMed PMID: 16258069; PubMed Central PMCID: PMCPMC1274241.
- Wroblewski LE, Noble PJ, Pagliocca A, et al. Stimulation of MMP-7 (matrilysin) by Helicobacter pylori in human gastric epithelial cells: role in epithelial cell migration. J Cell Sci. 2003 Jul 15;116(Pt 14):3017–3026. PubMed PMID: 12808021.
- Hatakeyama M. Structure and function of Helicobacter pylori CagA, the first-identified bacterial protein involved in human cancer. PubMed PMID: 28413197; PubMed Central PMCID: PMCPMC5489429 Proc Jpn Acad Ser B Phys Biol Sci. 2017;934:196–219.
- Higashi H, Tsutsumi R, Fujita A, et al. Biological activity of the Helicobacter pylori virulence factor CagA is determined by variation in the tyrosine phosphorylation sites. Proc Natl Acad Sci U S A. 2002 Oct 29;99(22):14428–14433. PubMed PMID: 12391297; PubMed Central PMCID: PMCPMC137900.
- Hayashi T, Senda M, Suzuki N, et al. Differential Mechanisms for SHP2 Binding and Activation Are Exploited by Geographically Distinct Helicobacter pylori CagA Oncoproteins. Cell Rep. 2017 Sep 19;20(12):2876–2890. PubMed PMID: 28930683.
- Suzuki H, Nishizawa T, Tsugawa H, et al. Roles of oxidative stress in stomach disorders. J Clin Biochem Nutr. 2012 Jan;50(1):35–39. PubMed PMID: 22247598; PubMed Central PMCID: PMCPMC3246180.
- Lieberman PM. Chromatin regulation of virus infection. Trends Microbiol. 2006 Mar;14(3):132–140. . PubMed PMID: 16458005.
- Fukayama M, Hino R, Uozaki H. Epstein-Barr virus and gastric carcinoma: virus-host interactions leading to carcinoma. Cancer Sci. 2008 Sep;99(9):1726–1733. . PubMed PMID: 18616681.
- Cotter MA 2nd, Robertson ES. Modulation of histone acetyltransferase activity through interaction of epstein-barr nuclear antigen 3C with prothymosin alpha. Mol Cell Biol. 2000 Aug;20(15):5722–5735. PubMed PMID: 10891508; PubMed Central PMCID: PMCPMC86050.
- Saju P, Murata-Kamiya N, Hayashi T, et al. Host SHP1 phosphatase antagonizes Helicobacter pylori CagA and can be downregulated by Epstein–barr virus. Nat Microbiol. 2016;1. 10.1038/nmicrobiol.2016.26.
- Henne WM, Buchkovich NJ, Emr SD. The ESCRT pathway. Dev Cell. 2011 Jul 19;21(1):77–91. . PubMed PMID: 21763610.
- Jager S, Bucci C, Tanida I, et al. Role for Rab7 in maturation of late autophagic vacuoles. J Cell Sci. 2004 Sep 15;117(Pt 20):4837–4848. PubMed PMID: 15340014.
- Gutierrez MG, Munafo DB, Beron W, et al. Rab7 is required for the normal progression of the autophagic pathway in mammalian cells. J Cell Sci. 2004 Jun 01;117(Pt 13):2687–2697. PubMed PMID: 15138286.
- Fraldi A, Annunziata F, Lombardi A, et al. Lysosomal fusion and SNARE function are impaired by cholesterol accumulation in lysosomal storage disorders. EMBO J. 2010 Nov 03;29(21):3607–3620. PubMed PMID: 20871593; PubMed Central PMCID: PMCPMC2982760.
- Fukuda M. Lysosomal membrane glycoproteins. Structure, biosynthesis, and intracellular trafficking. J Biol Chem. 1991 Nov 15;266(32):21327–21330. PubMed PMID: 1939168.
- Saftig P, Klumperman J. Lysosome biogenesis and lysosomal membrane proteins: trafficking meets function. Nat Rev Mol Cell Biol. 2009 Sep;10(9):623–635. . PubMed PMID: 19672277.
- Saftig P, Beertsen W, Eskelinen EL. LAMP-2 : a control step for phagosome and autophagosome maturation. Autophagy. 2008 May;4(4):510–512. PubMed PMID: 18376150.
- Eskelinen EL, Illert AL, Tanaka Y, et al. Role of LAMP-2 in lysosome biogenesis and autophagy. Mol Biol Cell. 2002 Sep;13(9):3355–3368. PubMed PMID: 12221139; PubMed Central PMCID: PMCPMC124165.
- Eskelinen EL, Schmidt CK, Neu S, et al. Disturbed cholesterol traffic but normal proteolytic function in LAMP-1/LAMP-2 double-deficient fibroblasts. Mol Biol Cell. 2004 Jul;15(7):3132–3145. PubMed PMID: 15121881; PubMed Central PMCID: PMCPMC452571.
- Han C, Ding Z, Shi H, et al. The role of probiotics in lipopolysaccharide-induced autophagy in intestinal epithelial cells. Cell Physiol Biochem. 2016;38(6):2464–2478. PubMed PMID: 27309845.
- Tsugawa H, Suzuki H, Matsuzaki J, et al. FecA1, a bacterial iron transporter, determines the survival of Helicobacter pylori in the stomach. Free Radic Biol Med. 2012 Mar 15;52(6):1003–1010. PubMed PMID: 22245091.
- Sato A, Naito T, Hiramoto A, et al. Association of RNase L with a Ras GTPase-activating-like protein IQGAP1 in mediating the apoptosis of a human cancer cell-line. FEBS J. 2010 Nov;277(21):4464–4473. PubMed PMID: 20875083.
- Sato A, Satake A, Hiramoto A, et al. Protein expression profiles of necrosis and apoptosis induced by 5-fluoro-2ʹ-deoxyuridine in mouse cancer cells. J Proteome Res. 2010 May 7;9(5):2329–2338. PubMed PMID: 20155980.
- Seton-Rogers SE, Lu Y, Hines LM, et al. Cooperation of the ErbB2 receptor and transforming growth factor beta in induction of migration and invasion in mammary epithelial cells. Proc Natl Acad Sci U S A. 2004 Feb 03;101(5):1257–1262. PubMed PMID: 14739340; PubMed Central PMCID: PMCPMC337040.
- Jegga AG, Schneider L, Ouyang X, et al. Systems biology of the autophagy-lysosomal pathway. Autophagy. 2011 May;7(5):477–489. PubMed PMID: 21293178; PubMed Central PMCID: PMCPMC3127210.
- Dehghan-Nayeri N, Eshghi P, Kg P, et al. Differential expression pattern of protein markers for predicting chemosensitivity of dexamethasone-based chemotherapy of B cell acute lymphoblastic leukemia. Cancer Chemother Pharmacol. 2017 Jul;80(1):177–185. PubMed PMID: 28585036.