
ABSTRACT
Macroautophagy is a mechanism that is involved in various cellular processes, including cellular homeostasis and innate immunity. This pathway has been described in organisms ranging in complexity from yeasts to mammals, and recent results indicate that it occurs in the mantle of the Pacific oyster, Crassostrea gigas. However, the autophagy pathway has never been explored in the hemocytes of C. gigas, which are the main effectors of its immune system and thus play a key role in the defence of the Pacific oyster against pathogens. To investigate autophagy in oyster hemocytes, tools currently used to monitor this mechanism in mammals, including flow cytometry, fluorescent microscopy and transmission electron microscopy, were adapted and applied to the hemocytes of the Pacific oyster. Oysters were exposed for 24 and 48 h to either an autophagy inducer (carbamazepine, which increases the production of autophagosomes) or an autophagy inhibitor (ammonium chloride, which prevents the degradation of autophagosomes). Autophagy was monitored in fresh hemocytes withdrawn from the adductor muscles of oysters using a combination of the three aforementioned methods. We successfully labelled autophagosomes and observed them by flow cytometry and fluorescence microscopy, and then used electron microscopy to observe ultrastructural modifications related to autophagy, including the presence of double-membrane-bound vacuoles. Our results demonstrated that autophagy occurs in hemocytes of C. gigas and can be modulated by molecules known to modulate autophagy in other organisms. This study describes an integrated approach that can be applied to investigate autophagy in marine bivalves at the cellular level.
Abbreviations
MAP1LC3: microtubule associated protein 1 light chain 3; MCA: multiple correspondence analysis; NH4Cl: ammonium chloride; PI: propidium iodide; TEM: transmission electron microscopy
Introduction
Autophagy is a process that controls the quality and quantity of intracellular biomass by autodigesting cytoplasmic components that range in complexity and size from individual proteins to whole organelles [Citation1]. Different types of autophagy have been identified, such as microautophagy, chaperone-mediated autophagy, and macroautophagy. The present study focused on macroautophagy [Citation2], which is more commonly simply called autophagy and acts as a bulk process that captures large portions of cytosol or sequesters organelles like mitochondria or peroxisomes [Citation1], which then fuse with lysosomes. Autophagy is a constitutive process that contributes to the turnover of cytoplasmic components in the cell (e.g. protein aggregates, organelles, ribosomes). This pathway is also involved in other key processes, including microorganism elimination, adaptation to starvation, and cell death [Citation3]. Autophagy comprises three main steps [Citation4]: (1) in the initiation step, phagophores are formed by the association of membranes suspected to come from the endoplasmic reticulum, trans-Golgi, and late endosomes [Citation2]; (2) during the elongation step, the phagophore’s double-membrane is extended and encloses cytoplasmic components to form an autophagosome; (3) finally, the fusion between the autophagosome and a lysosome leads to the degradation of the enclosed cytoplasmic components by lysosomal enzymes. Degradation products then return to the cytoplasm, where they can be reused to build new molecules or in metabolism [Citation5]. These different steps are regulated by various proteins that are encoded by autophagy-related genes.
To investigate whether this process occurs and is working in the tissues or cells of different organisms [Citation6–Citation9], a wide range of inhibitors and inducers of the autophagy pathway have been identified [Citation10,Citation11]. In the present study, the effects of an inducer (carbamazepine) and an inhibitor (ammonium chloride; NH4Cl) of the autophagy pathway were investigated. These molecules were previously reported to modulate the incidence of autophagy in the mantle of the Pacific oyster, Crassostrea gigas [Citation12]. Autophagy can be induced by carbamazepine, which acts on the inositol metabolism and provokes a decrease in the level of myo-inositol-1.4.5-triphosphate [Citation6]. Ammonium chloride (NH4Cl) is a lysosomotropic compound that neutralizes the lysosomal pH [Citation7–Citation9] and inhibits the degradation of autophagosomes.
Several tools have been developed to investigate the effects of drugs and monitor autophagy at a cellular level in vertebrates. Transmission electron microscopy (TEM) is one of the principal methods used to detect and quantify autophagic compartments in mammalian cells [Citation13–Citation16], and is notable because it allows autophagic structures in the cytoplasm to be observed. Fluorescence microscopy and flow cytometry are powerful and complementary tools that are used to observe autophagy in vertebrate cells, including those of the mouse [Citation17], Chinese hamster [Citation18], and human [Citation19]. Western blotting and immunohistochemistry are other methods that can also be used to investigate autophagy in organisms. Most of these tools rely on the detection and quantification of the protein MAP1LC3 (microtubule associated protein 1 light chain 3), which is a key marker of the autophagy flow [Citation7].
Recently, Moreau et al. [Citation12] detected the presence of MAP1LC3 in the mantle of C. gigas by western blotting. The expression level of the MAP1LC3 protein appeared to be modulated by an inducer and an inhibitor of the autophagy pathway, which were carbamazepine and NH4Cl, respectively. Furthermore, an accumulation of vesicular structures considered to likely be autophagosomes was observed in the mantle of the Pacific oyster in the presence of NH4Cl by TEM. These results demonstrated the occurrence of autophagy in the mantle of C. gigas and suggested that this process can be modulated by incubating oysters in water baths with NH4Cl or carbamazepine. However, no information is available about the occurrence or characteristics of autophagy in hemocytes, which are circulating cells present in the hemolymph of molluscs that play a key role in their immune response [Citation20] against such pathogens as protozoans, bacteria, and viruses [Citation21].
Based on preliminary results obtained by Moreau et al. [Citation12] and considering the importance of hemocytes in the defence mechanisms of bivalve molluscs, in this study we developed a multi-tool approach to monitor autophagy in hemocytes using a combination of fluorescence microscopy, TEM and flow cytometry. Combining complementary approaches is needed to provide robust conclusions [Citation7] and demonstrate that a mechanism such as autophagy occurs in a new species or new targets. This approach was then used to investigate the effects of NH4Cl and carbamazepine, which are known to inhibit and induce autophagy in mammals, respectively, on autophagy in C. gigas hemocytes.
Results
Analysis of autophagic modulation in hemocytes of C. gigas by flow cytometry
Prior to measuring the autophagy activity, hemocyte mortality was evaluated using PI. Mean cell mortality never exceeded 9.2% in any treatment, and showed low variation among replicates (CV = 3.0%, n = 9).
Two hemocyte populations were identified: (1) negative hemocytes, i.e. those not stained by Cyto ID®, and (2) positive hemocytes, i.e. those that were stained by Cyto ID® (). The percentage of hemocytes stained by Cyto ID® differed among oyster exposure conditions.
Figure 1. Detection and monitoring of autophagy in hemocytes of C. gigas by flow cytometry. (A) FL1 histogram overlay of hemocytes stained with Cyto ID® in normal condition (at T0) and presenting signs of autophagy inhibition (NH4Cl condition). The horizontal axis represents the fluorescence intensity, while the vertical axis represents the number of hemocytes. Based on Cyto ID® staining, two populations are defined: a negative cell population situated on the left of the histogram, and a positive cell population situated on the right of the histogram and only observed in the induced condition. (B) Ratios between percentages of hemocytes with autophagosomes in the different test conditions (control, NH4Cl, carbamazepine, carbamazepine+NH4Cl) after 24 or 48 h to those at T0. Values are means of nine replicates, and error bars represent standard deviation. a: significant difference between a treatment and the control condition at the respective time (p < 0.01). b: significant difference between control conditions at different times (p < 0.01). c: significant difference between a treatment and the NH4Cl condition at the respective time (p < 0.01). The red line represents the basal level of autophagy (T0 condition). (C) Forward scatter (FSC) vs. side scatter (SCC) density plot distinguishing 3 hemocyte populations. In order to define the hemocyte populations, 30,000 events were counted. Group I corresponds to hemocytes with low complexity and size, group II corresponds to hemocytes with moderate size and complexity, and group III corresponds to hemocytes with high complexity and size. (D) Proportion of hemocytes represented by each of the 3 populations at T0 and after 24 or 48 h post-exposure with different reagents (NH4Cl and/or carbamazepine). The control condition represents oysters only in seawater, without reagents. (E) Proportion of hemocytes represented by each of the 3 populations labelled with Cyto ID® at T0 and after 24 or 48 h post-exposure with different reagents (NH4Cl and/or carbamazepine). Values are means of 9 replicates, and error bars represent standard deviation. a: significant difference among respective cell populations relative to proportions of population I cells (p ≤ 0.0001). b: significant difference among respective cell populations relative to proportions of population II cells (p ≤ 0.0001). c: significant difference among respective cell populations relative to the control condition (p ≤ 0.05). d: significant difference among respective cell populations relative to T0 (p ≤ 0.05).
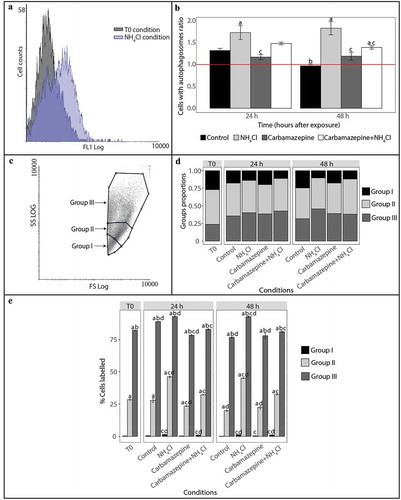
These cell populations were further used to determine the autophagy activity of hemocytes by calculating the ratios between the percentage of cells with autophagosomes in the tested condition and that at T0 (). At T0, 34 ± 10% of hemocytes were found to be positive for staining by flow cytometry. No significant difference was observed between the ratio at T0 and those ratios at 24 and 48 h from oysters in the control condition. However, the ratio significantly decreased from 24 to 48 h (p < 0.01) in the control condition, at which point it returned to the ratio at T0 (). Ratios were significantly higher for the NH4Cl condition than for the control condition at 24 and 48h (both p < 0.01). In the presence of carbamazepine+NH4Cl, a significant increase in the ratio was also observed compared with the control condition, but only at 48 h after exposure (p < 0.01). With carbamazepine alone, the ratios at 24 and 48 h were similar to those observed in the control condition at the same sampling times.
Based on density plots, 3 hemocyte groups were identified (). Regardless of the conditions tested, group I hemocytes were significantly less abundant than those belonging to groups II and III (p ≤ 0.001) (). With the exception of the NH4Cl condition at 48 h, the proportion of hemocytes representing group II was significantly higher than that of group III (p ≤ 0.05). Moreover, the proportions of hemocytes in groups I and II decreased significantly in the presence of the autophagy modulators tested compared to those at T0 (p ≤ 0.001). The relative proportion of group III hemocytes concurrently increased in all of the tested conditions compared to those at T0 (p ≤ 0.05).
For all conditions, the percentage of cells in group I was labelled very low (< 0.2%) (). The percentage of hemocytes that were positive was always higher in group III than that in group II (p ≤ 0.0001). Significantly more positive cells were observed in groups II and III in oysters exposed for 48 h to NH4Cl and carbamazepine+NH4Cl than in the control condition at the equivalent sampling times (p ≤ 0.05). In contrast, the percent of cells positive significantly decreased in groups II and III in oysters maintained for 24 h with carbamazepine.
A fluorescence microscopy approach to visualize and analyze autophagic vesicles in hemocytes
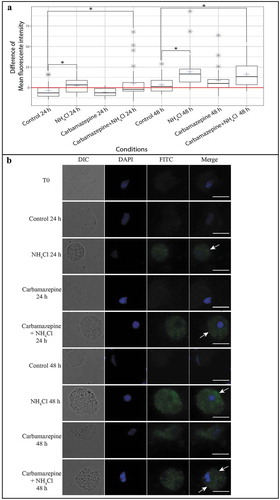
In parallel, the presence of autophagic vesicles in hemocytes was evaluated in the different conditions using fluorescence microscopy by measuring the mean fluorescence intensity of thirty cells per condition (). The mean fluorescence intensity decreased significantly after 24 h in the control condition (p = 0.05) and then returned to the initial (T0) level at 48 h. The mean fluorescence intensity significantly increased in hemocytes from oysters exposed to NH4Cl (p ≤ 0.01) and carbamazepine+NH4Cl (p ≤ 0.01) in comparison to that in the control condition at 24 and 48 h. No significant difference was observed between the carbamazepine condition and the control condition. shows hemocytes from oysters exposed to the four conditions after 24 and 48 h. Low green fluorescence was observed at T0 and at all times in the control condition, while in the NH4Cl and carbamazepine+NH4Cl conditions an increase in the fluorescence intensity was observed at 24 and 48 h ().
Figure 2. Observation and measurement of the fluorescence intensity of hemocytes stained with Cyto ID®. (A) Difference in the mean fluorescence intensity of hemocytes stained with Cyto ID® between each condition at different times and T0. Each blue cross represents the difference in the mean fluorescence intensity of the hemocytes of the selected condition. The red line represents the difference in the mean fluorescence intensity of hemocytes from that at T0. Gray stars represent outliers. Each boxplot was made with n = 30; * p ≤ 0.01. (B) Hemocyte pictures from different test conditions (NH4Cl, carbamazepine, carbamazepine+NH4Cl, and control) labelled with Cyto ID® (FITC) (column 3) and counterstained with DAPI (4′,6-diamidino-2-phenylindole) (blue) (column 2). A combined image merging results with DAPI and FITC is presented in column 4. The edges of hemocytes can be observed in white light (DIC) (column 1). White arrows show the accumulation of autophagosomes in the hemocytes’ cytoplasm. Scale bar: 10 µm.
Identification of ultrastructural modifications related to autophagy in hemocytes of C. gigas by transmission electron microscopy
Autophagic structures in hemocytes were observed by TEM. After 24 h of exposure to different modulators, double- and single-membrane-bound vacuoles resembling autophagic structures were observed in all conditions (). The majority (from 61 to 81%) of the structures identified had a lumen between two membranes in all conditions. All of the structures had contents resembling the cytoplasm around the double-membrane-bound structure. The single-membrane-bound structures each had a single-membrane with partially degraded or intact contents.
Figure 3. Detection of autophagic structures in hemocytes by transmission electron microscopy. (A) TEM observations of morphological modifications and autophagic structures in hemocytes of C. gigas; scale bar: 1 µm. i. hemocytes without ultrastructural modification (control condition); ii. hemocytes exposed to carbamazepine+NH4Cl presenting ultrastructural modifications; iii. hemocytes treated with an inhibitor of autophagy (NH4Cl) presenting autophagic structures; iv. hemocytes treated with an inducer of autophagy (carbamazepine) presenting autophagic structures. v. autophagic structures with double- or single-membrane-bound structures in all of the different conditions tested; scale bar: 200 µm. Arrow: presence of the double- or single-membrane-bound structure. (B) Results of the MCA of the different variables examined with the TEM approach. i. histogram of the percentages of variances explained by each dimension of the MCA; ii. variables’ contributions to each of the two first dimensions; iii. MCA plot representation of the tested variable (cells with double- or single-membrane-bound structures, changed ultrastructural state, and condition).
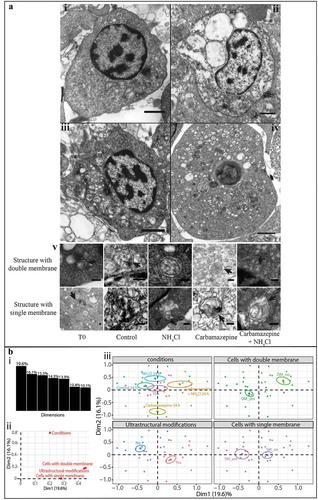
In the control condition, hemocytes showed a normal nucleus with no cytoplasmic modifications, organelles were not swollen, and few vacuoles were present (). An accumulation of vacuolar structures presenting double-membranes with cytoplasmic contents and condensation of the chromatin to a variable extent were noted in hemocytes from spat that were in contact with autophagy modulators (carbamazepine or NH4Cl) (). In the carbamazepine+NH4Cl condition, the ultrastructural modifications generally included variable condensation of the chromatin, swelling of the mitochondria, and large vacuoles in the cells ().
A qualitative approach was carried out to assess the results based on a multiple correspondence analysis (MCA) (). The 2 first dimensions of the MCA were selected for plotting and interpretation because they represented the majority of the total variance (35.7%) in the data that could be explained based on the variables examined. The presence/absence of double- or single-membrane-bound structures and of ultrastructural modifications to the cell was represented by axis 1. The second axis took into account the effects of the condition (treatments or control). Figure 3Biii shows the distribution of the different variables examined as defined by these 2 dimensions. The position of the variables in the plotted 2-dimensional space indicates the mutual association among variables. Each point represents several cells that showed the same profiles. The T0 condition was plotted close to the origin of the graph, and there was no difference between T0 points and those at later sampling times in the control condition. Results for the autophagy inducer (carbamazepine) and inhibitor (NH4Cl) conditions were plotted at opposite positions along the second axis, showing the effect of these molecules on the autophagy pathway. The carbamazepine+NH4Cl condition was plotted at an intermediate position along the second axis.
Cells plotted on the left side of the graph were similar in terms of the detection of double- and single-membrane-bound structures and the absence of ultrastructural modifications in them. On the right side of the graphs, the absence of double- and single-membrane-bound structures was clustered with the appearance of ultrastructural modifications. This demonstrates that cells in the control condition presented double-and single-membrane-bound structures but few ultrastructural changes, whereas cells in the carbamazepine+NH4Cl condition did not present double- or single-membrane-bound structures but did show ultrastructural modifications. Cells in the inducer or inhibitor conditions had an intermediate state between that of cells in the two other conditions.
Discussion
Macroautophagy, herein referred to simply as autophagy, is used by organisms as a defence strategy against a wide range of extra- or intracellular stressors [Citation22–Citation24]. This mechanism has been described as one of the most important intracellular pathways for the degradation and recycling of proteins and organelles, and relies on the sequestration of organelles into double-membrane-bound vesicles. Although autophagy was previously measured in the digestive gland of the blue mussel, Mytilus edulis, to monitor the impact of different environmental stressors on this process [Citation25,Citation26], very few studies have investigated this key mechanism in hemocytes, which are the main cellular effectors of the immune system in bivalve molluscs. However, bivalve molluscs are particularly exposed to environmental changes, including changes in climate, pollution, and pathogens that might modulate autophagy in their hemocytes.
In this study, we combined complementary tools to demonstrate, at the cellular level, that autophagy can be modulated in hemocytes of Pacific oysters (C. gigas) by known autophagy modulators (i.e. the inhibitor NH4Cl and the inducer carbamazepine). We used Cyto-ID® green dye, which labels autophagic compartments [Citation27], to detect and observe autophagy modulation in the hemocytes of C. gigas by flow cytometry and fluorescence microscopy, respectively. Flow cytometry is a particularly powerful tool for performing quantitative analyzes of cell populations [Citation28,Citation29]. In addition, ultrastructural modifications were also observed by TEM.
Interestingly, the level of hemocytes with autophagosomes in the control condition trend to increased from T0 to 24 h, and then returned close to the T0 level at 48 h. The increase observed at 24 h might correspond to an increase in the basal physiological autophagy level.
Although carbamazepine has been reported to induce autophagy [Citation6,Citation11], flow cytometry results obtained in the present study did not show an increase in levels of autophagosomes in hemocytes of C. gigas exposed to this molecule. Hidvegi et al. [Citation30] observed a dose-dependent increase in the MAP1LC3-II to MAP1LC3-I ratio in mouse hepatic cells, indicating that carbamazepine elicits increased autophagy flux in these cells. Moreau et al. [Citation12] also observed that autophagy was induced in the mantle of the Pacific oyster by carbamazepine. Interestingly, carbamazepine did not induce the activation of autophagy at all in hemocytes of the mussel Mytilus galloprovincialis [Citation31]. These results, together with results obtained in the present study, suggest that autophagic responses differ among cell types.
In contrast to carbamazepine, NH4Cl is known to inhibit autophagy, and more specifically to inhibit autophagosome degradation [Citation7]. In rat [Citation8] and human cell cultures [Citation32,Citation33], this molecule induces an accumulation of MAP1LC3-II and prevents the degradation of autophagosomes [Citation28,Citation32,Citation33]. Consequently, exposure to NH4Cl is expected to induce an accumulation of autophagosomes, resulting in an increase in the numbers of Cyto ID®-labelled cells detected by flow cytometry. Because we found that the percentage of hemocytes with autophagosomes increased significantly in oysters exposed to NH4Cl compared with that in control condition, our results are in accordance with the literature.
The combination of the 2 modulator drugs (carbamazepine and NH4Cl) led to a greater induction of autophagy at 48 h relative to that in the control condition. This induction was significantly less than that induced by the inhibitor alone. Our results show that there is no significant effect of the combination of carbamazepine and NH4Cl on the hemocytes of C. gigas. Carbamazepine alone also did not have an effect on hemocyte autophagy. However, perhaps carbamazepine can affect other cellular pathways in hemocytes that moderate the induction of autophagy expected in the presence of NH4Cl alone. It has been reported by Klionsky et al. [Citation7] that several pharmacological molecules used to induced or inhibit the autophagy pathway are not specific, and can affect several other cellular pathways as well. Cyto ID®-labelled cells were also analyzed in this study using fluorescence microscopy. Intense fluorescent dots similar to the autophagic compartments reported in mammalian cells [Citation27] maintained in conditions of starvation [Citation17,Citation32] were observed in the cytoplasm of oyster hemocytes. An increase in the abundance of these intracytoplasmic autophagic structures was observed in hemocytes from oysters exposed for 24 and 48 h to NH4Cl and carbamazepine+NH4Cl. This observation confirms the results obtained by flow cytometry.
Flow cytometry also revealed changes in morphological features (size and complexity) of the hemocytes of oysters exposed to autophagy modulators. Higher percentages of cells with greater structural complexity were observed after oysters were exposed to NH4Cl, and to a lesser extent in the cells of oysters exposed to carbamazepine. This increased hemocyte complexity might be related to increased numbers of autophagic vesicles in the cytoplasm.
TEM is an informative approach that can be used to observe and identify autophagic structures in tissue sections and cell cultures [Citation7,Citation14–Citation16,Citation34,Citation35]. In mammals, two categories of autophagic vacuoles are commonly described [Citation13,Citation14,Citation16,Citation36,Citation37]: (i) the intermediate/early autophagic vacuoles or autophagosomes, and (ii) the degradative/late autophagic vacuoles, also corresponding to autolysosomes or amphisomes. In our study, ultrastructures observed in oyster hemocytes were similar to both types of autophagic vacuoles described in the literature. Analyzes of Pacific oyster hemocytes showed that a greater proportion of the hemocytes contained autophagosomes than autolysosomes in all of the conditions tested. Similar observations have been reported in mammals, and can be explained by the fact that autolysosomes are short-lived structures, so that it is difficult to observed them by TEM [Citation14]. The presence of autophagic structures was found herein to be variable, and dependent on the exposure condition. More autophagic structures bound with double- or single-membranes were observed in the control condition, and fewer were observed in the carbamazepine+NH4Cl condition. The NH4Cl and carbamazepine conditions demonstrated that hemocytes react differently depending on the molecule with which they are treated. The detection of the presence of autophagic structures is strongly associated with ultrastructural modifications to the cell.
Specific ultrastructural features related to autophagy were observed in our study, including a slight condensation of the chromatin, significant vacuolization of the cytoplasm, and degradation of the cytoplasmic contents [Citation38,Citation39]. These modifications appeared to increase in frequency and extent when oysters were exposed to NH4Cl or carbamazepine compared to those in the control condition. However when combining both modulators (carbamazepine+NH4Cl) more ultrastructural modifications related to necrosis and apoptosis were observed than in the other conditions. The interactions between cell death and autophagy remain unclear [Citation40,Citation41]. Indeed, there is controversy, as autophagy can be interpreted as either a form of programmed cell death or as a step that occurs before apoptosis or necrosis that promotes cell survival. Carbamazepine and NH4Cl in combination were harmful to hemocytes and induced more characteristic modifications associated with the programmed cell death response than the autophagy response. Moreau et al. [Citation12] also observed autophagic structures in mantle cells of the Pacific oyster by TEM. Herein, we demonstrated the presence of autophagic structures interpreted as autophagosomes or autolysosomes in oyster hemocytes. These structures were similar to the autophagic vacuoles previously described in mussel hemocytes [Citation31].
In the present study, we not only confirmed that autophagy occurs in the hemocytes of C. gigas, but also showed the importance of combining different approaches (flow cytometry, optical microscopy, and TEM) to monitor autophagy at the cellular level. The guidelines for the use and interpretation of assays for monitoring autophagy [Citation7] highlight the importance of using a multi-tool approach to investigate autophagy. By following these recommendations, we demonstrated that NH4Cl can inhibit autophagy and that carbamazepine has no effect on autophagy in the hemocytes of C. gigas. This study described an integrated approach that can be applied in marine bivalves, including but not limited to the Pacific oyster, to investigate the potential effects on autophagy of various biotic and abiotic factors, including chemicals or pathogenic organisms.
Materials and methods
Oyster farming
C. gigas spat was produced at the Ifremer hatchery in La Tremblade, Charente-Maritime, France. Spawning occurred in March 2015, after which larvae and spat were cultured as described by Dégremont et al. [Citation42] and Azéma et al. [Citation43]. Prior to the experiment, spat were acclimatized to a constant flow of filtered and UV-treated seawater enriched in phytoplankton (Skeletonema costatum, Isochrisis galbana, and Tetraselmis suecica) in 120 L tanks at 19°C for at least 2 weeks.
Experimental design
Three treatments were used to test the modulation of autophagy in oyster spat. Groups of spat were maintained for 24 or 48 h in seawater supplemented with dissolved (1) NH4Cl (Sigma-Aldrich, A9434) at a concentration of 0.53 g/10 L of seawater, (2) carbamazepine (Sigma-Aldrich, C4024) at a concentration of 0.071 g/10 L seawater, or (3) carbamazepine+NH4Cl at concentrations of, respectively, 0.071 g/10 L of seawater and 0.53 g/10 L of seawater [Citation12]. One control condition was also used, which consisted of spat maintain only in the seawater. For each of the 4 conditions tested (3 treatments and 1 control), 6 tanks were used containing 13 oysters each. At each sampling time (24 and 48 h), 3 tanks of 13 animals were sampled per condition. At T0 (the time before oysters were incubated in the different test conditions), 3 pools of 13 oysters were sampled to record the basal level of autophagy in their hemocytes.
Hemolymph collection
Hemolymph was withdrawn from the adductor muscles of oysters using a 1-mL syringe equipped with a needle (0.6 × 32 mm). Hemolymph was kept on ice to limit cellular aggregation, and was filtered through a 74 µm nylon filter to eliminate debris. The hemolymph of the 13 oysters in each tank was pooled.
Flow cytometry approach
Hemocytes with autophagy activity
Percentages of hemocytes with autophagy activity were quantified using the commercial Cyto ID® autophagy detection kit (ENZO Life Sciences, ENZ-51,031-K200), while following the manufacturer’s protocol. This kit contains a 488 nm excitable green fluorescent detection reagent that becomes brightly fluorescent when incorporated into the vesicles produced during autophagy. For each condition at each sampling time, 3 pools of hemolymph (4 mL) were centrifuged for 10 min at 1500 × g and 4°C. The supernatant was discarded, and the pellet containing the hemocytes was then suspended in 1 mL of buffer containing the Cyto ID® green detection reagent. Cells were then incubated for 90 min in the dark at room temperature (21°C). Cells that contained autophagosomes were stained by Cyto ID® and emitted green fluorescent light (FL1: 500–550 nm).
Hemocyte mortality and viability
As previously described by Gagnaire [Citation44], hemocyte mortality was measured in 200 μL of cell suspension sampled from each condition (3 replicates) and at each sampling time. Cells were incubated in the dark for 30 min at 4°C with 10 μL of propidium iodide (ThermoFisher Scientific, P3566; PI). PI is a fluorescent DNA/RNA-specific dye that only permeates the membranes of dead cells and stains their nucleic acids. Cells that emit red fluorescent light (FL3: 560–670 nm) when stained by PI were thus considered to be dead.
Flow cytometry analysis
For each sample, 5000 events were counted using an EPICS XL 4 particle counter (Beckman Coulter, USA). Size discrimination was used to ensure that small particles or bacteria were not counted, so that only hemocytes were taken into account when measuring cell activity. Results were depicted as cell cytograms and reported as log-scale fluorescence levels of each marker used. The results were expressed as ratios between the percentage of hemocytes that positively presented autophagosomes for each condition and the percentage of hemocytes labelled at T0. Flow cytometry data were analyzed with flowing software 2.5.1 (University of Turku, Finland). To detect any effects of the test conditions, a Kruskal-Wallis test was carried out in R studio software version 3.3.2 using the package PMCMR (version 4.1). Results were expressed as means ± standard deviations.
Fluorescence microscopy
Hemocytes were labelled as previously described for flow cytometry (cf. ‘Hemocytes with autophagy activity’ above). For each condition at each sampling time, 6 replicates of 100 μL hemocyte suspensions (around 1 × 10⁵ cells) were deposited on glass slides and cytocentrifuged for 1 min at 100 × g and 4°C. Hemocytes were observed under a fluorescence microscope at 100 × magnification using immersion oil (Leica Microsystems, Germany; Leica DMI6000B). Useful images were extracted from LAS AF software (Leica Microsystems, Germany; Leica application suite advanced fluorescence software) and analyzed with ImageJ software (National Institutes of Health, USA). The fluorescence intensity of 30 hemocytes was measured per condition and sampling time. For each picture, three background intensities of fluorescence were used to obtain a mean fluorescence intensity for the image. The corrected cell fluorescence was then measured by subtracting the mean fluorescence intensity of the background from the fluorescence intensity of the hemocytes. Box plots were made and statistical analyses were performed using the packages ggplot2 (version 2.2.1) and PMCMR (version 4.1) in R studio software version 3.3.2.
Transmission electron microscopy
For each condition at each sampling time, 2 replicates of 1 mL hemocyte suspension (1 × 10⁶ cells) were centrifuged at 500 × g for 8 min at 4°C, and the supernatants were then discarded. Samples were fixed in 3% glutaraldehyde solution (Sigma-Aldrich, G5882) for 24 h at 4°C. Cells were washed 3 times with 0.4 M cacodylate buffer (Sigma-Aldrich, C0250) and post-fixed with a solution of 1% osmium tetroxide (Sigma-Aldrich, 75,632) for 1 h at 4°C. Cells were washed again in 0.4 M cacodylate buffer twice. After dehydration in successive baths of ethanol and treatment with two baths of propylene oxide, samples were progressively impregnated and embedded in Epoxy embedding medium (Sigma Aldrich, 45,345). After polymerization at 60°C, semi-thin sections were cut to 1 μm thickness for quality control and then to 80 to 85 nm thickness for examination using a Leica Ultracut (Leica Microsystems, Germany; EM UC6), and then were floated on copper electron microscopy grids and stained with uracil acetate/lead citrate [Citation45]. The sections were examined using a transmission electron microscope (JEOL, USA; JEM 1000) at 80 kV. Thirty hemocytes per condition were observed on micrographs taken by TEM. The presence of ultrastructural modifications and autophagic structures of the hemocytes was examined based on the criteria described in the literature [Citation13,Citation36,Citation46]. Ultrastructural modifications included characteristics associated with apoptosis (loss of pseudopodia, nuclear fragmentation and/or chromatin condensation, and the presence of apoptotic bodies or membrane blebbing) and necrosis (chromatin condensation, cytoplasmic and/or mitochondrial swelling, and damage to the cytoplasmic membrane) were also investigated. Double-membrane-bound autophagic structures were identified based on the presence of a double-membrane with a lumen between the two lipid bilayers, with contents resembling the cytoplasm around the structure in their density and composition. Single-membrane-bound autophagic structures were identified based on the presence of a single-membrane and partially degraded or intact contents. A MCA was performed to determine the association among variables related to these ultrastructural and autophagic characteristics, including cell condition, the presence or absence of a double- or single-membrane-bound structure and of ultrastructural modifications. The packages FactoMineR (version 1.39) and factoextra (version 1.0.5) were used to plot the results of the MCA in R studio software version 3.3.2.
Disclosure statement
No potential conflict of interest was reported by the authors.
Additional information
Funding
Related Research Data
References
- Deretic V, Levine B. Autophagy, immunity, and microbial adaptations. Cell Host Microbe. 2009;5(6):527–549.
- Glick D, Barth S, Macleod KF. Autophagy: cellular and molecular mechanisms. J Pathol. 2010;221(1):3–12.
- Mizushima N. The pleiotropic role of autophagy: from protein metabolism to bactericide. Cell Death Differ. 2005;12(Suppl 2):1535–1541.
- Deretic V. Autophagy as an immune defense mechanism. Curr Opin Immunol. 2006;18(4):375–382.
- Mizushima N. Autophagy: process and function. Genes Dev. 2007;21(22):2861–2873.
- Sarkar S, Floto RA, Berger Z, et al. Lithium induces autophagy by inhibiting inositol monophosphatase. J Cell Biol. 2005;170(7):1101–1111.
- Klionsky DJ, Abdelmohsen K, Abe A, et al. Guidelines for the use and interpretation of assays for monitoring autophagy (3rd edition). Autophagy. 2016;12(1):1–222. eng.
- Seglen PO, Grinde B, Solheim AE. Inhibition of the lysosomal pathway of protein degradation in isolated rat hepatocytes by ammonia, methylamine, chloroquine and leupeptin. Eur J Biochem. 1979;95(2):215–225. eng.
- Sun R, Luo Y, Li J, et al. Ammonium chloride inhibits autophagy of hepatocellular carcinoma cells through SMAD2 signaling. Tumour Biol. 2015;36(2):1173–1177.
- Rubinsztein DC, Codogno P, Levine B. Autophagy modulation as a potential therapeutic target for diverse diseases. Nat Rev Drug Discov. 2012;11(9):709–730.
- Rubinsztein DC, Gestwicki JE, Murphy LO, et al. Potential therapeutic applications of autophagy. Nat Rev Drug Discov. 2007;6(4):304–312.
- Moreau P, Moreau K, Segarra A, et al. Autophagy plays an important role in protecting Pacific oysters from OsHV-1 and Vibrio aestuarianus infections. Autophagy. 2015;11(3):516–526.
- Ylä-Anttila P, Vihinen H, Jokitalo E, et al. Monitoring autophagy by electron microscopy in Mammalian cells. Meth Enzymol. 2009;452:143–164.
- Eskelinen E-L. Fine structure of the autophagosome. Methods Mol Biol. 2008;445:11–28.
- Eskelinen E-L. To be or not to be? Examples of incorrect identification of autophagic compartments in conventional transmission electron microscopy of mammalian cells. Autophagy. 2008;4(2):257–260.
- Martinet W, Timmermans J-P, De Meyer GRY. Chapter five - methods to assess autophagy in situ—transmission electron microscopy versus immunohistochemistry. In: Galluzzi L, Kroemer G, editors. Methods in enzymology. Cell-wide Metabolic Alterations Associated with Malignancy. Vol. 543. Academic Press; 2014. p. 89–114.
- Yakoub AM, Shukla D. Autophagy stimulation abrogates herpes simplex virus-1 infection. Sci Rep. 2015;5:9730.
- Lee JS, Lee GM. Monitoring of autophagy in Chinese hamster ovary cells using flow cytometry. Methods. 2012;56(3):375–382.
- Klappan AK, Hones S, Mylonas I, et al. Proteasome inhibition by quercetin triggers macroautophagy and blocks mTOR activity. Histochem Cell Biol. 2012;137(1):25–36.
- Fisher WS. Structure and functions of oyster hemocytes. In: Michel B, editor. Immunity in invertebrates. Proceedings in Life Sciences. Berlin: Springer; 1986. p. 25–35.
- Allam B, Raftos D. Immune responses to infectious diseases in bivalves. J Invertebr Pathol. 2015;131:121–136.
- Galluzzi L, Pietrocola F, Levine B, et al. Metabolic control of autophagy. Cell. 2014;159(6):1263–1276.
- He C, Klionsky DJ. Regulation mechanisms and signaling pathways of autophagy. Annu Rev Genet. 2009;43:67–93.
- Paul P, Münz C. Autophagy and mammalian viruses: roles in immune response, viral replication, and beyond. Adv Virus Res. 2016;95:149–195.
- Moore MN. Autophagy as a second level protective process in conferring resistance to environmentally-induced oxidative stress. Autophagy. 2008;4(2):254–256.
- Moore MN, Viarengo A, Donkin P, et al. Autophagic and lysosomal reactions to stress in the hepatopancreas of blue mussels. Aquat Toxicol. 2007;84(1):80–91.
- Guo S, Liang Y, Murphy SF, et al. A rapid and high content assay that measures cyto-ID-stained autophagic compartments and estimates autophagy flux with potential clinical applications. Autophagy. 2015;11(3):560–572.
- Eng KE, Panas MD, Karlsson Hedestam GB, et al. A novel quantitative flow cytometry-based assay for autophagy. Autophagy. 2010;6(5):634–641.
- Demishtein A, Porat Z, Elazar Z, et al. Applications of flow cytometry for measurement of autophagy. Methods. 2015;75:87–95.
- Hidvegi T, Ewing M, Hale P, et al. An autophagy-enhancing drug promotes degradation of mutant alpha1-antitrypsin Z and reduces hepatic fibrosis. Science. 2010;329(5988):229–232.
- Balbi T, Cortese K, Ciacci C, et al. Autophagic processes in Mytilus galloprovincialis hemocytes: effects of Vibrio tapetis. Fish Shellfish Immunol. 2017;73:66–74.
- Michiorri S, Gelmetti V, Giarda E, et al. The Parkinson-associated protein PINK1 interacts with Beclin1 and promotes autophagy. Cell Death Differ. 2010;17(6):962.
- Castino R, Fiorentino I, Cagnin M, et al. Chelation of lysosomal iron protects dopaminergic SH-SY5Y neuroblastoma cells from hydrogen peroxide toxicity by precluding autophagy and akt dephosphorylation. Toxicol Sci. 2011;123(2):523–541.
- Mizushima N, Yoshimorim T, Levine B. Methods in mammalian autophagy research. Cell. 2010;140(3):313–326.
- Perrotta I. The use of electron microscopy for the detection of autophagy in human atherosclerosis. Micron. 2013;50:7–13.
- Eskelinen E-L, Kovács AL. Double membranes vs. lipid bilayers, and their significance for correct identification of macroautophagic structures. Autophagy. 2011;7(9):931–932.
- Eskelinen E-L. Maturation of autophagic vacuoles in Mammalian cells. Autophagy. 2005;1(1):1–10.
- Cabon L, Martinez-Torres A-C, Susin SA. La mort cellulaire programmée ne manque pas de vocabulaire [Programmed cell death does not lack vocabulary]. Med Sci (Paris). 2013;2912:1117–1124. French
- Fink SL, Cookson BT. Apoptosis, pyroptosis, and necrosis: mechanistic description of dead and dying eukaryotic cells. Infect Immun. 2005;73(4):1907–1916.
- Liu Y, Levine B. Autosis and autophagic cell death: the dark side of autophagy. Cell Death Differ. 2015;22(3):367–376.
- Fitzwalter BE, Thorburn A. Recent insights into cell death and autophagy. FEBS J. 2015;282(22):4279–4288.
- Dégremont L, Bédier E, Soletchnik P, et al. Relative importance of family, site, and field placement timing on survival, growth, and yield of hatchery-produced Pacific oyster spat (Crassostrea gigas). Aquaculture. 2005;249:213–229.
- Azema P, Lamy JB, Boudry P, et al. Genetic parameters of resistance to Vibrio aestuarianus, and OsHV-1 infections in the Pacific oyster, Crassostrea gigas, at three different life stages. Genet Sel Evol. 2017;49:23.
- Gagnaire B. Etude des effets de polluants sur les paramètres hémocytaires de l’huître creuse, Crassostrea gigas - Interactions entre environnement, mécanismes de défense et maladies infectieuses. La Tremblade: Université de la Rochelle; 2005.
- Lewis PR, Knight DP. Staining methods for sectioned material. North-Holland; 1977.
- Silva MT, Vale A, Santos N. Secondary necrosis in multicellular animals: an outcome of apoptosis with pathogenic implications. Apoptosis. 2008;13(4):463–482.