
ABSTRACT
Macroautophagy/autophagy is involved in myeloid cellular repair, destruction, and osteoclast differentiation; conversely, KLF2 (kruppel-like factor 2 [lung]) regulates myeloid cell activation and differentiation. To investigate the specific role of KLF2 in autophagy, osteoclastic differentiation was induced in monocytes in presence or absence of the autophagy inhibitor 3-methyladenine (3-MA), KLF2 inducer geranylgeranyl transferase inhibitor (GGTI298), and adenoviral overexpression of KLF2. We found that the number of autophagic cells and multinucleated osteoclasts were significantly decreased in presence of 3-MA, GGTI298, and KLF2 overexpressed cells indicating involvement of KLF2 in these processes. In addition, autophagy-related protein molecules were significantly decreased after induction of KLF2 during the course of osteoclastic differentiation. Furthermore, induction of arthritis in mice reduced the level of Klf2 in monocytes, and enhanced autophagy during osteoclastic differentiation. Mechanistically, knocking down of KLF2 increased the level of Beclin1 (BECN1) expression, and conversely, KLF2 over-expression reduced the level of BECN1 in monocytes. Moreover, 3-MA and GGTI298 both reduced myeloid cell proliferation concomitantly upregulating senescence-related molecules (CDKN1A/p21 and CDKN1B/p27kip1). We further confirmed epigenetic regulation of Becn1 by modulating Klf2; knocking down of Klf2 increased the levels of histone activation marks H3K9 and H4K8 acetylation in the promoter region of Becn1; and overexpression of Klf2 decreased the levels of H4K8 and H3K9 acetylation. In addition, osteoclastic differentiation also increased levels of H3K9 and H4K8 acetylation in the promoter region of Becn1. Together these findings for the first time revealed that Klf2 critically regulates Becn1-mediated autophagy process during osteoclastogenesis.
Abbreviations: ACP5/TRAP: acid phosphatase 5, tartrate resistant; Ad-KLF2: adenoviral construct of KLF2; ATG3: autophagy related 3; ATG5: autophagy related 5; ATG7: autophagy related 7; ATG12: autophagy related 12; BECN1: beclin 1, autophagy related; C57BL/6: inbred mouse strain C57 black 6; ChIP: chromatin immunoprecipitation; CSF1/MCSF: colony stimulating factor 1 (macrophage); CTSK: cathepsin K; EV: empty vector; GGTI298: geranylgeranyl transferase inhibitor; H3K9Ac: histone H3 lysine 9 acetylation; H4K8Ac: histone H4 lysine 8 acetylation; K/BxN mice: T cell receptor (TCR) transgene KRN and the MHC class II molecule A(g7) generates K/BxN mice; KLF2: kruppel-like factor 2 (lung); 3MA: 3-methyladenine; MAP1LC3B/LC3B: microtubule-associated protein 1 light chain 3 beta; MDC: monodansylcadaverine; NFATc1: nuclear factor of activated T cells 1; NFKB: nuclear factor of kappa light polypeptide gene enhancer in B cells; p21/CDKN1A: cyclin dependent kinase inhibitor 1A; p27kip1/CDKN1B: cyclin-dependent kinase inhibitor 1B; PCR: polymerase chain reaction; PtdIns3K: phosphoinositide 3-kinase; RA: rheumatoid arthritis; siKlf2: small interfering KLF2 ribonucleic acid; NS: non-specific; RAW 264.7: abelson murine leukemia virus transformed macrophage cell line; TNFSF11/RANKL: tumor necrosis factor (ligand) superfamily, member 11; TSS: transcriptional start site; UCSC: University of California, Santa Cruz.
Introduction
Myeloid cells play critical role in mediating inflammation, and destruction of bone and cartilage in various musculoskeletal diseases including rheumatoid arthritis (RA). While the pathogenesis of RA is undoubtedly complex, infiltration of myeloid cells into the joint followed by interaction with local cellular constituents (e.g. synovial fibroblasts and infiltrated lymphocytes) lead to eventual tissue destruction [Citation1]. Given the importance of myeloid cells in this process, a greater understanding of mechanisms regarding myeloid cells, specifically monocyte differentiation and intracellular mechanism are of considerable interest. Emerging evidence suggests that KLF2 regulates activation and function of myeloid cells as well as autophagy, an intracellular regulatory mechanism that plays critical role during osteoclast differentiation [Citation2,Citation3]. The current investigation focuses on delineating the role of KLF2 in regulating autophagy during osteoclast differentiation, which is critically important in mediating inflammatory arthritis.
Autophagy is an intracellular catabolic process by which a cell recycles its own constituents [Citation4]. When cells are under stress, autophagy helps them to adapt new environmental conditions to ensure availability of compounds necessary for synthesis of required macromolecules for survival; however, long-term autophagy may lead to apoptosis and cell death. Many serious disease conditions, such as cancer, neurodegenerative disease, and heart disease are closely associated with the regulation of autophagy [Citation5], and this process has become an attractive therapeutic target for those disease conditions [Citation6]. Most pathological conditions are developed due to the imbalances in the autophagy process in engulfing long-lived proteins and damaged organelles within cells [Citation7].
Osteoclasts are multinucleated specialized cells that originate from the myeloid cells, are positive for tartrate acid phosphatase and calcitonin receptors, are capable of resorbing bone for both maintaining bone homeostasis and developing bone pathogenesis [Citation8]. The orchestrated process of osteoclast differentiation mainly involves rearrangement of the cytoskeleton structure, changes in the organelles, and the degradation and renewal of intracellular proteins. It is reported that autophagy is involved in these orchestrated process of osteoclastic differentiation in maintaining bone homeostasis and development of pathogenic condition in bone-related diseases with an unclear mechanism [Citation9]. The activation of autophagy leads to the suppression of reactive oxygen species levels, which contributes to increased osteogenic differentiation of bone marrow stem cells showing it’s involvement in bone biology [Citation10].
Kruppel-like factors (KLFs) are a subclass of the zinc-finger family of transcription factors implicated in the regulation of cellular growth and differentiation [Citation2]. One of the members of this family of transcription factors, KLF2, plays an important role in pro-inflammatory activation of monocytes [Citation11]. However, function and regulation mechanisms of KLF2 in osteoclastic differentiation remain largely unknown. A recent report indicated that KLF2 possibly contributes to regulation of autophagy in a model of acute liver injury, where simvastatin pretreatment maintained autophagy through the upregulation of RAB7 (RAB7, member RAS oncogene family) and KLF2 in improving cell viability and ameliorated hepatic damage by restoring microvascular function both in liver sinusoidal endothelial cells and human umbilical vein endothelial cells [Citation12]. In addition, another report indicated that the KLF-autophagy pathway modulates the life span of nematodes, and regulates mammalian age-associated vascular dysfunction [Citation13].
The differentiation of osteoclast precursor is mediated by macrophage colony stimulating factor (CSF1/MCSF), and tumor necrosis factor (ligand) superfamily, member 11 (TNFSF11/RANKL). Various signaling pathway molecules such as NFKB, proto-oncogene fibroblast osteogenic sarcoma, activator protein (AP)1, and nuclear factor of activated T cells (NFAT)c1 are activated during the osteoclastogenesis process [Citation14]. A number of studies have shown that autophagy regulates the differentiation process of osteoclasts. For example, suppression of the adenosine monophosphate-activated protein kinase (AMPK)-MTOR (mechanistic target of rapamycin kinase)-ULK1 (unc-51 like autophagy activating kinase 1) signaling axis decreases autophagy in glucose-mediated osteoclast differentiation [Citation15], and lipopolysaccharide (LPS)-induced autophagy in regulating osteoclastogenesis process [Citation16]. The present study was undertaken to investigate the potential role of KLF2 in regulating autophagy-mediated osteoclastogenesis process. Our results provide the first evidence to support the regulatory role of KLF2 in CSF1/MCSF- and TNFSF11/RANKL-induced autophagy and osteoclastogenesis. Furthermore, using a K/BxN serum-induce arthritis model we show that autophagy is important in osteoclastic differentiation, and further confirmed with mechanistic studies showing that KLF2 is critical in regulating autophagy. These results suggest that a strategy, which targets KLF2 in modulating autophagy, could be used to develop a new potential therapy for osteoclast-activated diseases including arthritis and osteoporosis.
Results
Effect of KLF2 on autophagic vesicle formation during osteoclastogenesis
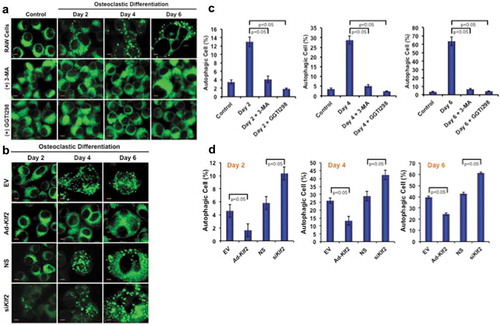
To determine the effect of KLF2 on autophagy during osteoclast differentiation, RAW264.7 cells were stimulated with CSF1/MCSF and soluble (s)TNFSF11/RANKL in presence or absence of KLF2 inducer GGTI298; and autophagic vesicles were determined by MDC staining. Upon induction of osteoclast differentiation, osteoclasts exhibited autophagic vesicles, whereas undifferentiated control cells did not show any autophagic vesicle (), upper panels). This result confirms that an increased number of autophagosomes was recruited in the cytoplasm of monocytes during osteoclastic differentiation. We found that number of autophagic vesicles was markedly reduced in presence of standard autophagy inhibitor, 3-MA during osteoclastic differentiation process (), middle panels). Interestingly, upon induction of KLF2 using GGTI298, autophagic vesicles were visibly reduced (), lower panels). Percentage (%) of autophagic cells was also counted and graphically presented ()). Evaluation revealed that approximately 13, 28.66, and 63.67% cells became autophagic during osteoclast differentiation at days 2, 4, and 6 respectively. However, after addition of 3-MA number of autophagic cells (%) was significantly reduced and became 4.1, 5.0, and 6.5 at days 2, 4, and 6 respectively. Interestingly, after addition of GGTI298, the percentage of autophagic cells (%) reduced significantly to 1.8, 2.3, and 4.2 at days 2, 4, and 6, respectively. In addition, we also assessed the formation of autophagic vesicle in Klf2 overexpressed and knockdown cells during osteoclastic differentiation. We found that a reduced number of autophagic cells after overexpression of Klf2 (Ad-klf2) compared to the empty vector (EV) ()). Conversely, we observed a greater number of autophagic cells after knockdown of Klf2 compared to the non-specific control (NS) ()). Quantification of autophagic cells indicates that the differences were statistically significant and were shown graphically ()). Therefore, these results are indicating that the KLF2 might play an important role in reducing autophagic vesicle formation.
Figure 1. Number of autophagic cells decreased after induction of KLF2. (a) Shows the MDC staining of RAW264.7 cells at various time points during the osteoclastic differentiation in presence or absence of 3 MA (autophagy inhibitor) or GGTI298 (KLF2 inducer), or RAW264.7 cells without differentiation as a control. (b) MDC stained vesicles were visualized in Klf2 overexpressed (Ad-Klf2) or empty vector (EV) infected control cells; and Klf2 knockdown (siKlf2) or control non-specific siRNA (NS) transfected cells during the course of osteoclast differentiation. (c) Bar graphs represent the cumulative data in percent of autophagic cells present per high power field of image. Each experiment was performed at least 3 times and 15 fields were counted/experiment. (d) Bar graphs represent the quantification of autophagic cells in (Ad-Klf2/EV) infected or (siKlf2/NS) transfected RAW264.7 cells during the course of differentiation. Each experiment was performed at least 3 times and 15 fields were counted/experiment. Data represent as Mean±SEM.
Effect of KLF2 on autophagy related molecules during osteoclastogenesis
To confirm the inhibition of autophagic process in monocytes after induction of KLF2, we further evaluated the expression levels of autophagy-related marker molecules in RAW264.7 cells in the presence or absence of GGTI298 or 3-MA by western blot method. We found the expression of BECN1, ATG3, ATG5, and LC3B-II:LC3B-I ratio was markedly upregulated in a time-dependent manner during osteoclastogenesis. Conversely, after addition of 3-MA, all tested autophagic molecules were downregulated, which assures appropriate experimental conditions. Importantly, the level of KLF2 was markedly increased after addition of 3-MA ()). The level of BECN1, ATG3, ATG5, KLF2, LC3B-II:LC3B-I ratio in presence of 3-MA was measured and presented graphically in Figure S2. Furthermore, in the presence of KLF2 inducer GGTI298 during the osteoclastic differentiation process, all tested autophagic molecules were markedly reduced, indicating KLF2’s involvement in the autophagic process ()). The level of BECN1, ATG3, ATG5, KLF2, LC3B-II:LC3B-I ratio in presence of GGTI298 was measured and presented graphically in Figure S3. The expressions of autophagic molecules (BECN1, ATG3, ATG5, and LC3B-II:LC3BI) were further confirmed in adenovirus-mediated KLF2 overexpressed cells during the course of osteoclastic differentiation. The autophagic molecules were significantly reduced after overexpression of KLF2 ()). The level of BECN1, ATG3, ATG5, KLF2, LC3B-II:LC3B-I ratio in KLF2 overexpressed cells was measured and graphically presented in Figure S4.
Figure 2. Osteoclastic differentiation induced autophagic molecules and KLF2 reduced them. Western blot analysis was performed to determine changes of autophagic molecules in presence or absence of (a) 3-MA, or (b) GGTI298 or (c) adenoviral overexpression of Klf2 (Ad-Klf2) infected RAW264.7 cells during the course of osteoclastic differentiation. Undifferentiated cells were used as a control.
Effect of KLF2 on osteoclastogenesis
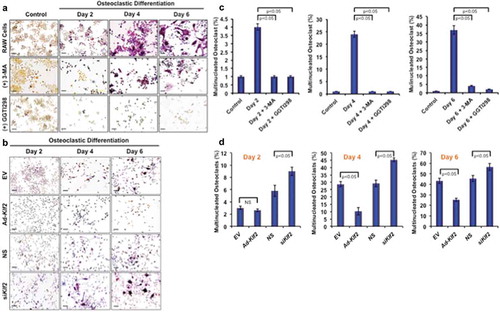
To determine the effect of KLF2 on osteoclastogenesis, RAW264.7 cells were induced with CSF1/MCSF and sTNFSF11/RANKL in presence or absence of KLF2 inducer GGTI298, and the number of osteoclasts was evaluated during the course of differentiation. Upon addition of sTNFSF11/RANKL and CSF1/MCSF to RAW264.7 cells, ample differentiation was observed over the 6 days, and cells stained positive for TRAP, whereas undifferentiated cells did not show any TRAP+ staining (), upper panels). However, when 3-MA was added during osteoclastic differentiation process, marked reduction in osteoclast number was found (), middle panels). Moreover, after induction of KLF2 using GGTI298, remarkable reduction in osteoclast differentiation was observed (), lower panels). The number of osteoclasts as a percentage of total cells (%) was also counted in presence or absence of the 3-MA and GGTI298 (15 different fields from 3 independent experiments) and graphically shown. Evaluation revealed that approximately 4.12, 24.45, and 37.12% became TRAP+ during osteoclast differentiation at day 2, 4, and 6 respectively. After addition of 3-MA, the number of TRAP+ cells (%) was significantly reduced to 1.12, 1.54, and 4.51 at days 2, 4, and 6 respectively. After addition of GGTI298, the number of TRAP+ cells (%) was also significantly reduced to 1.87, 1.12, and 2.30, at days 2, 4, and 6 respectively ()). In addition, we also assessed the number of osteoclast cells after KLF2 over-expression and knockdown during the course of differentiation ()). In EV and Ad- KLF2 infected cells, showed that 3, 28. 62, 43.25% and 2.6, 10.22, 25.25% are TRAP+ cell (%) at day 2, 4, and 6 respectively; whereas 5.8, 29.19, 45.48% and 9, 45.46, 56.54% for are TRAP+ cell (%) at day 2, 4, and 6 respectively in NS and siKlf2-transfected cells ()). Therefore, these results are indicating that KLF2 might play an important role in reducing osteoclastic differentiation.
Figure 3. Induction of KLF2 and reduction of autophagy inhibited osteoclastic differentiation. (a) TRAP staining was performed to determine differentiated osteoclasts from RAW264.7 cells in presence or absence of 3-MA (an autophagy inhibitor), or GGTI298 (a KLF2 inducer) during the course of osteoclastic differentiation. Undifferentiated cells were used as a control. (b) TRAP+ cells were visualized in Klf2 overexpressed (Ad-Klf2/EV) or Klf2 knockdown (NS or siKlf2) RAW264.7 cells during the course of osteoclast differentiation.(c) Bar graphs showing the cumulative data in percentage of TRAP+ cells present per high power field of image. Each experiment was performed at lest 3 times and 15 fields were counted/experiments. (d) Bar graphs represent the quantification of TRAP+ cells in Klf2 over-expressed (Ad-Klf2/EV) or Klf2 knockdown (siKlf2/NS) RAW264.7 cells during the course of differentiation. Each experiment was performed at least 3 times and 15 fields were counted/experiment. Data represent the Mean±SEM.
Effect of KLF2 on monocyte proliferation and senescence
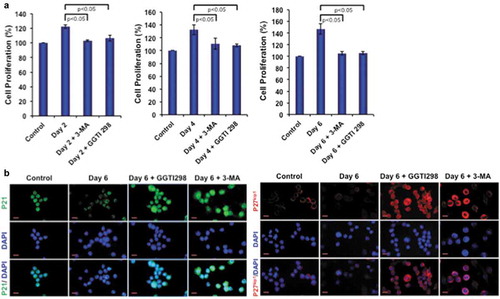
We next tested the autophagy inhibitor 3-MA and KLF2 inducer GGTI298 in monocytes to determine how they affect in osteoclastic differentiation of these cells. Importantly, both molecules reduced monocyte proliferation during osteoclastogenesis ()). We further tested the reason for reduced proliferation and found that both inhibition of autophagy and induction of KLF2 significantly induced monocyte senescence by upregulating p21 and p27kip1 molecules ()). These results confirm that KLF2 modulates autophagy by inducing cell senescence.
Figure 4. 3-MA and GGTI298 reduce cell proliferation by inducing cell senescence. (a) Cell proliferation was determined during osteoclastic differentiation after addition of 3-MA or GGTI298, and results are presented graphically. (b) Cellular senescence was detected with immunocytochemical staining with p21 and p27kip1 after differentiation of osteoclasts (day 6) in presence of GGTI298 or 3-MA and representative images were shown.
Effect of K/BxN serum-induced arthritis on autophagic molecules
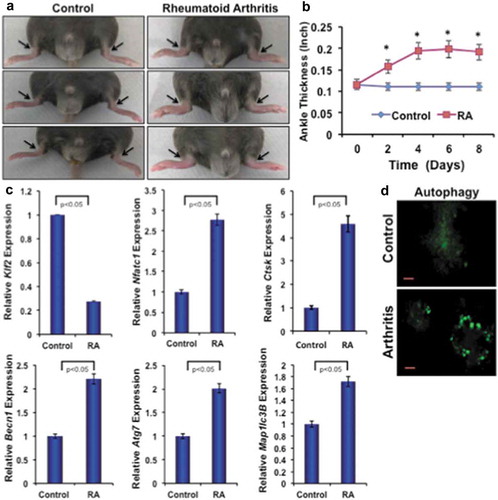
To investigate the effect of inflammatory arthritis on autophagic molecules, K/BxN-serum-induced arthritis was generated in C57BL/6 male mice. ) shows representative images of arthritic inflammation after 8 days of induction. ) shows the measurement of ankle thickness during the course of RA, and showed significantly higher ankle thickness in mice with RA compared to control mice. Real-time PCR analysis of bone marrow monocytes revealed a significant reduction in expression level of KLF2 and concomitantly increased level of arthritis-related molecule Nfatc1 and Ctsk in arthritic animals compared to controls confirming arthritis development. Importantly, there were significantly increased levels of autophagy-related gene expressions, such as Becn1, Atg7 and Map1lc3B in bone marrow monocytes of arthritic mice compared to control ()). Osteoclastic differentiation of bone marrow precursor cells revealed that autophagic vesicle formation was distinct and remarkably greater in mice with RA compared to control ()). These results indicate that autophagy is highly prominent in mice with RA, and may play essential roles in RA pahogenesis.
Figure 5. Arthritis reduces KLF2 and induces expression of osteoclast- and autophagy-related molecules. (a) Images of K/BxN serum-induced arthritic inflammation of limbs in C57/BL6 male mice. (b) Measured ankle thickness during the course of arthritis development shown graphically. Arrowheads indicate the location of measured area (ankle). (c) Expression levels of osteoclast- and autophagy-related molecules from bone marrow monocytes from RA and control mice are shown graphically after correcting with the corresponding internal control β-Actin expressions. (d) Autophagic vesicles are detected with MDC staining in differentiated osteoclasts (Day 6) from the bone marrow precursor cells of mice after induction of RA or without induction of RA as a control.
Effect of KLF2 modulation on beclin1 in monocytes
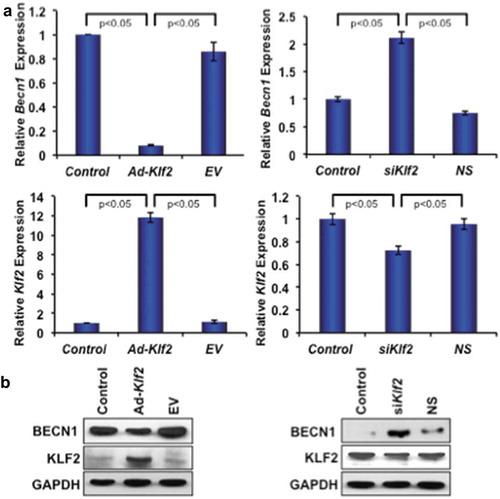
To investigate the effect of KLF2 in autophagic gene expression, the Becn1 gene was investigated using both loss-of-function and gain-of-function of Klf2 approaches. Klf2 overexpression significantly reduced the expression of both Becn1 gene and protein (), left panels) in RAW264.7 cells. Conversely, Klf2 knockdown significantly increased the levels of both Becn1 gene and proteins (), right panels) indicating that KLF2 might regulate BECN1, a molecule of the autophagy process, in monocytes.
Figure 6. KLF2 inversely regulates Beclin1 gene and protein expression. (a) Quantitative PCR analysis of Becn1 gene expression (left, upper panel) is shown graphically after over-expression of Klf2 (left lower panel) in RAW264.7 cells; and similarly expression of Becn1 gene (right, upper panel) is presented after knockdown of KLF2 (right, lower panel) in RAW264.7 cells. (b) BECN1 protein expression is depicted after overexpressing KLF2 (lower, left panel) and knocking off KLF2 (lower, right panel) in RAW264.7 cells. The levels of GAPDH were depicted as internal controls.
Epigenetic regulation of beclin1 promoter after modulation of KLF2
After establishing that Becn1 expression is inversely correlated with Klf2 expression, we further investigated the epigenetic mechanism of Becn1 regulation. From the UCSC genome browser we found that enrichment sites for epigenetic marks are located at + 0.5 kb (upstream) and – 0.1 kb (downstream) of the mouse Becn1 transcriptional start site (TSS). To understand the role of histone modifications in regulating Becn1 in the context of osteoclastic differentiation, the occupancy of histone acetylation marks (H3K9Ac and H4K8Ac) were analyzed by ChIP and quantitative PCR methods. Analysis revealed that the knockdown of Klf2 significantly increased the enrichment of active histone marks, H3K9Ac and H4K8Ac (), left panels) at two specific locations from the TSS of Becn1 compared to control. Conversely, over-expression of Klf2 significantly decreased the enrichment of active histone marks, H3K9Ac and H4K8Ac (), right panels) at both locations from the TSS of Becn1 compared to control. In addition, we have tested the status of the Becn1 promoter region after osteoclastic differentiation of monocytes. Analysis revealed that osteoclastic differentiation significantly increased the enrichment of active histone marks H3K9Ac and H4K8Ac ()) at both specific locations from the TSS of Becn1 compared to undifferentiated control cells. These data indicate that the absence or reduction of Klf2 promotes Becn1 expression via enrichment of the active histone marks H3K9Ac and H4K8Ac.
Figure 7. KLF2 regulates Beclin1 gene epigenetically. Autophagy signaling pathway molecule Becn1 was analyzed using ChIP-quantitative PCR method after loss-of-function and gain-of-function of Klf2 in RAW264.7 cells. Active marks of Becn1 gene for both H3K9 acetylation (a) and H4K8 acetylation (b) were evaluated in two different promoter sites, and shown graphically. (c) H3K9 and H4K8 acetylation were also assessed after osteoclastic differentiation (on Day 6 of RAW264.7 cells), and evaluated in both promoter sites, and shown graphically. (d) KLF2 binding on Becn1 promoter regions was evaluated by KLF2-ChIP analysis in osteoclastic differentiated cells.
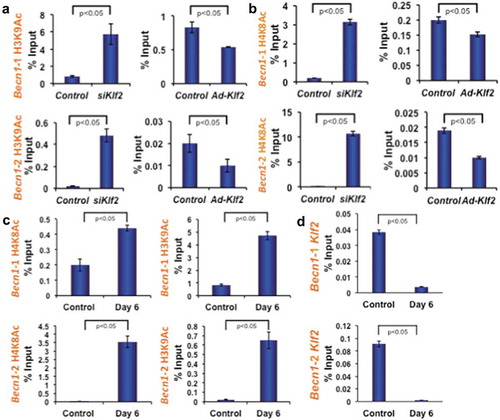
To further examine whether KLF2 is involved in regulating Becn1 expression through binding to its promoter region, we next performed KLF2-ChIP analysis in osteoclast-differentiated cells keeping undifferentiated cells as a control. Indeed, in control cells KLF2 binding was detected at the promoter region of Becn1. However, KLF2 binding was significantly reduced in osteoclast-differentiated cells ()). Taken together these data suggest that decreased level of KLF2 binding resulted in increased levels of H3K9Ac and H4K8Ac during osteoclast differentiation.
Discussion
Osteoclasts differentiated from monocytes are critically important in regulation of bone homeostasis, and dysregulation in the process may lead to various pathologies in the cartilage and bones. The molecular processes occurring during monocyte to osteoclastic differentiation are not completely understood. Autophagy is induced during monocyte differentiation and is pivotal for this process, and inhibition of autophagy during differentiation leads to apoptosis [Citation17,Citation18]. The differentiation of osteoclasts from monocytes is a complex phenomenon, which requires organelles and turnover of intracellular protein, and autophagy plays major role in regulating this process [Citation19]. More than 30 critical genes, including Atg, Map1lc3b, Becn1, Atg7, Atg12, and p62 (also known as SQSTM1/sequestome1), have been shown to participate in the different stages of the autophagy activation process [Citation20]. Autophagy is essential for cellular energy generation and recycling of metabolic precursors and is required for cell survival. However, it is not known how this process is regulated during myeloid cell differentiation. We previously showed that KLF2 critically regulates myeloid cell activation and function as well as differentiation [Citation11]. Reports suggest that autophagy and KLF2 share common activation and regulatory pathways in the endothelium [Citation12]. Another study has shown the involvement of the Klf gene family in regulation of autophagy in human embryonic kidney (HEK293) cell, where KLF2 was downregulated after rapamycin-induced autophagy [Citation13]. The downregulation of KLF2 is possibly due to its degradation in a p62-dependent manner [Citation21,Citation22]. The current study focuses on delineating role of KLF2 in regulation of autophagy in myeloid cell differentiation.
It is well established that induction of autophagy is essential for osteoclastic differentiation of monocytes [Citation17]. With our initial findings, we also confirmed that autophagy is increased during osteoclastic differentiation as evidenced by increased levels of autophagy related marker proteins. Furthermore, we observed that autophagy could be inhibited by using specific inhibitors, such as, 3-MA. It was reported that 3-MA inhibits autophagy during osteoclastic differentiation by inhibiting phosphatidylinositol 3-kinase (PtdIns3K) pathway [Citation23]. Interestingly, when the level of KLF2 was increased in monocytes after treating with GGTI298, osteoclastic differentiation was significantly decreased despite induction of differentiation with standard osteoclastic differentiation inducers. A previous report showed that inhibition of protein geranylgeranylation with GGTI298 significantly induced KLF2 levels by inhibiting the processing of geranylgeranylated Rap1A [Citation24]. It was evident that GGTI298 plays a versatile role in regulating autophagy and apoptosis in cancer cells as well as noncancerous cells. Specifically, GGTI298 induced p53-dependent autophagy and apoptosis in primary human airway smooth muscle (HASM) cells [Citation25]. In addition, statins, class of lipid lowering drugs that induce KLF2, also induced autophagy in prostate cancer cells [Citation26]. However, GGTI298, a KLF2 inducer, plays the opposite role during osteoclastic differentiation in myeloid cells. We found that GGTI298 induced KLF2 in monocytes and reduced autophagy during osteoclast differentiation, which is consistent with all previous reports of KLF2-mediated inactivation of immune cells and endothelial cells [Citation11,Citation27–Citation30]. However, the molecular mechanisms by which GGTI298 plays a different role in cancer cells and during osteoclastic differentiation in myeloid cells is not clear. It is very likely that KLF2 regulates activation and function of various immune cells [Citation2], and here our data provide evidence of regulating autophagy in myeloid cells, whereas the role of KLF2 is not known in cancer cells. It could be cell and disease specific regulation of autophagy by KLF2.
We next investigated the involvement of KLF2 in autophagy more specifically to determine whether autophagy inhibition has any effect on KLF2. Indeed, 3-MA, a potent inhibitor of autophagy increased KLF2 expression during osteoclastic differentiation of monocytes. In general, it was seen that the level of KLF2 is decreased during immune cell activation and differentiation [Citation31]. However, 3-MA overcame the differentiation-mediated loss of KLF2 expression. It is shown that inhibition of mitogen-activated protein kinase and PtdIns3K pathways enhanced receptor tyrosine kinase that triggered increment of KLF2 expression [Citation32]. It is possible that a similar pathway was also involved in autophagy inhibitor mediated induction of KLF2 in myeloid cells, as 3-MA specifically inhibits PtdIns3K. Importantly, 3-MA induces KLF2, which mediates senescence (p27kip1 and p21 molecules) in the myeloid cells, which was further confirmed by forced induction of KLF2 by GGTI298. These results are in agreement with previous report of KLF2-mediated quiescence of T cells [Citation30].
Besides inflammation, osteoclast-mediated cartilage and bone erosion is a primary feature in RA, and osteoclasts are critically responsible for those features. To investigate association of KLF2 and autophagic molecules in arthritis, K/BxN serum-induced RA was examined in mice. Our findings revealed that the level of KLF2 is reduced and autophagy-related molecules are concomitantly increased in monocytes after induction of arthritis, confirming that autophagy is prominent in RA and might play essential roles in RA pathogenesis by inducing osteoclastogenesis.
Over the years several important regulators of autophagy have been identified, including BECN1, which initiates the autophagy process [Citation33]. In the active autophagy process, ATG7 promotes in the elongation of the isolation membrane, which culminates in conversion of a soluble form of microtubule-associated protein LC3B-I to a phosphatidyl ethanolamine-conjugated membrane-bound form LC3B-II. We have focused on BECN1 to specifically determine the regulation of KLF2 in the context of autophagy. Although BECN1 is expressed in many of the human and murine cells, and required for TNFSF11/RANKL-induced osteoclast differentiation [Citation34], transcriptional regulation of Becn1 during osteoclast differentiation is yet to be defined. We show here that KLF2 knockdown and over-expression inversely regulate BECN1 expression at both the gene and protein level, confirming that KLF2 indeed regulates the autophagy process. Previous studies have proposed several mechanisms of BECN1 regulation including sumoylation of BECN1 through vacuolar protein sorting (Vps) 34 protein, which is necessary for generation of the autophagosome in autophagy [Citation35,Citation36].
In addition, several studies have shown that epigenetic modifications such as genomic DNA methylation, histone acetylation and miRNA contribute to the pathogenesis of RA [Citation37–Citation39]. It was also reported that, KLF2 is a key transcription factor that governs the expression of anti-inflammatory genes and inhibit inflammatory genes expression including matrix-metalloproteinase (Mmp) 9 and Nfkb [Citation40]. We have also previously shown that KLF2 inhibits the transcriptional activity of Nfkb by limiting the recruitment of transcriptional coactivator and acetyltransferases CBP and P300 in RAW264.7 cells [Citation11]. CBP and P300 harbor histone acetyltransferase activity, which activate transcription by acetylating specific lysine residues on histones but also on non-histone proteins such as TF or transcription co-regulators [Citation41,Citation42]. Moreover, KLF2 likewise capable of associating with GCN5-PCAF, a H3K9 acetyltransferase, to inhibit the acetyltransferase activity therefore, inhibiting the inflammatory gene expression [Citation11]. Like H3K9Ac, CBP-P300 and GCN5-PCAF also recruit H4K8Ac, a significant mark for the inflammatory genes such as, Nfkb and Tnf-α expression and activation [Citation43]. These evidences suggest that KLF2 inhibits inflammatory genes including Nfkb [Citation11], which is an activator of Nfatc1 expression, consequently facilitating osteoclastic differentiation [Citation44]. Moreover, elevated level H3K9Ac and H4K8Ac facilitated the recruitment of RNA polymerase II and elongation of the osteoclast specific gene such as Tnfsf11/Rankl [Citation45]. On the basis of these we hypothesized that KLF2 may regulate the Becn1 expression through enrichment of H3K9Ac and H4K8Ac marks. To verify our hypothesis, we analyzed H3K9Ac and H4K8Ac occupancy around TSS region of Becn1 gene with specific primers. The primers are designed from the promoter regions and binding sites of H3K9Ac and H4K8Ac around TSS regions (Figure S1).
ChIP analysis revealed that during osteoclastic differentiation Becn1 expression was increased, which is also associated with increased H3K9Ac and H4K8Ac occupancy on around TSS region of Becn1 gene. Interestingly, we observed that the increased expression of KLF2 is associated with decreased level of H3K9Ac and H4K8Ac on Becn1 promoters. Furthermore, KLF2-ChIP analysis revealed that during osteoclastic differentiation KLF2 binding was decreased on Becn1 promoter regions. These data confirm that KLF2 expression was not only reduced in differentiated osteoclast cells but also binding efficiency of KLF2 was decreased on Becn1 promoter, which resulted in activation of Becn1gene through enrichment of acetylation of H3K9 and H4K8 molecules. These annotations established that KLF2 negatively regulate Becn1 via altering the recruitment of H3K9Ac and H4K8Ac thus inhibit autophagy formation and repress osteoclastic differentiation. For the first time our observations provide critical insight into their regulatory mechanisms of KLF2-mediated autophagy during osteoclastogenesis.
Conclusion
In summary, we provide evidence that autophagy is an important process for osteoclastic differentiation, and KLF2 critically controls autophagy through epigenetic regulation of Becn1. Gaining critical insight of this process will provide clues for future management of inflammatory autoimmune diseases by regulating autophagy through modulating KLF2.
Materials and methods
Reagents and antibodies
Monocytic cell line (RAW264.7) was obtained from American Type Culture Collection, ATCC® TIB-71. Soluble (s) TNFSF11/RANKL (315–11-100UG) and M-CSF (315–02-100UG) were obtained from Pepro Tech Incorporation. The tartrate-resistant acid phosphatase (TRAP) Assay Kit (387A-1KT), Imprint Chromatin Immunoprecipitation kit (17–295), monodansylcadaverine (MDC) stain (D4008), GGTI298 (G5169), and 3-MA (M9281) were obtained from Sigma-Aldrich Corporation. Lipofectamine 2000 (11668019), and DAPI (D1306) were purchased from Invitrogen Corporation. Antibodies for BECN1 (3495S), ATG3 (3415S), ATG5 (12994S), LC3B (12741S), CDKN1B/p27 Kip1 (2552S) and GAPDH (2118S) were purchased from Cell Signaling Technology. Antibody for CDKN1A/p21 (sc-6246) was purchased from Santa Cruz Biotechnology. The KLF2 antibodies were purchased from Abcam, ab203591 and Santa Cruz Biotechnology, sc-28675.
Osteoclast differentiation
RAW264.7 cells were cultured in DMEM (11885–084) supplemented with 10% fetal bovine serum (FBS) (10438–026) and 100 U ml−1 penicillin-streptomycin (15140–122) all from GIBCO, Thermo Fisher Scientific, incubated in 5% CO2 at 37°C. Cells were harvested and sub-cultured according to experimental requirements. To induce osteoclastic differentiation, RAW264.7 cells were cultured in DMEM containing 10% heat inactivated FBS in the presence of 20 ng/ml CSF1/MCSF and 40 ng/ml sTNFSF11/RANKL. Cells were also differentiated in presence or absence of 3-MA or GGTI298. Fresh medium was replaced every two days interval in presence or absence of stimulators or inhibitors.
In vitro cell proliferation assay
To determine the non-toxic doses of 3-MA and GGTI298, various concentrations of 3-MA and GGTI298 in RAW264.7 cells were used. In brief, cells were seeded in 48-well plates in complete DMEM containing 10% FBS and 100 U ml−1 penicillin-streptomycin. Then, cells were differentiated into osteoclasts in the presence of CSF1/MCSF (20 ng/ml) and sTNFSF11/RANKL (40 ng/ml). Simultaneously, cells were also treated with nontoxic doses of predetermined 3-MA (3 mM) and GGTI298 (2.5 µM) for 2, 4, and 6 days during the course of differentiation.
TRAP staining
Differentiated osteoclasts were determined by TRAP staining following the manufacturer’s protocol. Briefly, monocytes were cultured on the cover slips in a 6-well plate for differentiation into osteoclasts in presence or absence of 3-MA or GGTI298. In addition, to confirm effect of KLF2 on osteoclastic differentiation, we used adenoviral overexpression approach (Ad-Klf2), and knocked down of Klf2 using siRNA transfection method. On day 2, 4 and 6 of the culture, coverslip was removed from plate and cells were fixed with 4% paraformaldehyde in PBS for 20 min at room temperature and then washed with PBS. Next, 5 μl of sodium nitrite solution and 5 μl Fast Garnet GBC base solution were mixed for each coverslip, and incubated for 30 s. After incubation, 5 μl of acetate solution, 10 μl of naphthol AS-BI phosphate solution, 20 μl of tartrate solution and 450 μl of deionized water (pre-warmed to 37°C) were mixed. This solution was added to a well and incubated for 1 h at 37°C in water bath protected from light. Finally, the cover slips were rinsed with deionized water thoroughly, mounted on a glass slide, and examined under a light microscope, (Olympus Corporation of the Americas, Waltham, MA, ix81). TRAP-positive cells (purple) containing at least three nuclei were counted as an osteoclasts cell.
Acidic vesicular organelles staining
To determine the presence of autophagic vesicles in osteoclast cells, RAW264.7 cells were grown on cover slips inserted into a 6-well plate and induced to differentiate into osteoclasts with CSF1/MCSF and sTNFSF11/RANKL in the presence or absence of 3-MA or GGTI298. In addition, to confirm effect of KLF2 on formation of autophagic vesicle, we used adenoviral overexpression approach (Ad-Klf2), and knocked down of Klf2 using siRNA transfection method. During the course of differentiation, at day 2, 4, and 6, cells were stained with auto fluorescent compound MDC dye following manufacturer’s protocol. In, brief, cells were incubated with 50 mmol/l concentration of MDC at 37°C for 15 min and washed with PBS. Finally, the cells were mounted on a glass slide, viewed under a fluorescence microscope (Olympus Corporation of the Americas, Waltham, MA, ix81), and images were captured digitally.
Western blot analysis
Western blot was performed to determine the levels of the autophagic proteins, BECN1, ATG3, ATG5, and LC3B, along with KLF2, keeping GAPDH as an internal control in RAW264.7 cells during the course of differentiation in presence or absence of 3-MA or GGTI298 or adenoviral overexpression of KLF2. The cells were lysed in 100 μl pre-cooled RIPA lysis buffer (Millipore Sigma Aldrich Corporation, 20–188) for 30 min on ice and centrifuged at 12,000 g for 10 min. The supernatant was collected and protein concentration was estimated with Bradford’s reagent (Bio-Rad Incorporation, 5000006) using bovine serum albumin (BSA) (Sigma Aldrich Corporation, A7906-10G) as a standard. Equal amounts of protein (40 μg) were separated by SDS-PAGE gels electrophoretically and transferred to polyvinylidene difluoride membrane (Bio-Rad Incorporation, 1620115). After blocking with 5% BSA for 1 h at room temperature, the membranes were probed with primary antibodies for 12–16 h at 4°C. Then membranes were incubated with appropriate HRP (horseradish peroxidase)-labeled secondary antibodies (Cell Signaling Technology, 7074, and 7076) for 2 h at room temperature. Immunoreactive protein bands were visualized by enhanced chemiluminescence (ECL, Amersham Pharmacia Biotechnology, RPN2232), and the band detections were within the linear range.
Over-expression and knockdown of KLF2
Klf2 over-expression was induced in RAW264.7 cells using adenoviral constructs of Klf2 (Ad-Klf2, used 1:100 MOI), empty vector (EV) as control, which were generated by the Harvard Gene Therapy Initiative (Harvard Medical School, Boston, MA, a kind gift from Mukesh K. Jain, Case Western Reserve University, Cleveland), in the presence of polybrene (Millipore Sigma Aldrich Corporation, 107689, final concentration, 8 ng/ml), as described in our earlier studies [Citation11]. Conversely, Klf2 knockdown was performed with mouse Klf2 sequence specific siRNA, keeping non-specific siRNA as control (Dharmacon Incorporation, ROLDA-000003), and transfected with Lipofectamine 2000 (Thermo Fisher Scientific, 11668019) using 60 nmol/liter concentrations as described earlier [Citation11].
RNA extraction and real-time PCR
Total RNA was extracted by TRIzol reagent (Invitrogen Corporation, 15596026), and cDNA was prepared using PrimeScript reverse transcription kit according to the manufacturers’ protocols. Real-time PCR amplification reactions were performed with the SYBR Green PCR Kit (Applied Biosystem, 4309155). The relative expression of each target gene was quantified by calculating Ct (threshold cycle) values and normalized by β-Actin levels. Each sample was analyzed in triplicate. We used the following primer sets purchased from Sigma Aldrich Corporation: for Becn1, 5ʹ-TTT TCT GGA CTG TGT GCA GC-3ʹ (forward), 3ʹ -GCTTTTGTCCACTGCTCCTC-5ʹ (reverse); Map1lc3b, 5ʹ-GTCAGATCGTCTGGCTCGG-3ʹ (forward), 5ʹ-TGCAAGCGCCGTCTGATTAT-3ʹ (reverse); Atg7, 5ʹ-TTGAGCGGCGACAGCATTA3ʹ (forward), 5ʹ-TGAGGAAAGCCTCATGGCAG-3ʹ(reverse); β-Actin 5ʹ-GGCACCACACCTTCTACAATG-3ʹ (forward), 5ʹ-GGGGTGTTGAAGGTCTCAAAC-3ʹ (reverse); Ctsk 5ʹ- ATGTGAACCATGCAGTGTTGGTGG-3ʹ (forward)’ 5ʹ-ATGCCGCAGGCGTTGTTCTTATTC-3ʹ(reverse); Nfatc1 5ʹ-AGATGGTGCTGTCTGGCCATAACT-3ʹ(forward), 5ʹ-TGCGGAAAGGTGGTATCTCAACAA-3ʹ (reverse).
Immunofluorescence staining
To determine the cellular senescence after osteoclastic differentiation in presence or absence of 3-MA or GGTI298, immunofluorescence analysis was performed for p27Kip1 and p21 molecule. In brief, RAW264.7 cells were grown on sterile coverslips inserted into a 6-well plate. After 24 h of culture, cells were induced to osteoclastic differentiation with CSF1/MCSF and sTNFSF11/RANKL in presence or absence of 3-MA or GGTI298. After 6 days of differentiation, cells were fixed with 4% paraformaldehyde (Santa Cruz Biotechnology, sc-281692) for 30 min. After washing with PBS cells were permeabilized with 0.1% Triton X-100 (Sigma Aldrich Corporation, T8787) and blocked with 1% BSA. Then, cells were incubated with 200 μl of primary antibody (1:200) overnight at 4°C. After washing with PBS, cells were incubated with 200 μl of secondary anti-rabbit or anti-mouse antibodies (Alexa Fluor 488, A11001 or Alexa Fluor 594, A21235; 1:2000 dilution; Invitrogen Corporation) for 45 min in the dark. After incubation, cells were washed thrice with PBS (GIBCO Thermo Fisher Scientific, 70013–032) and mounted with 4, 6-diamidino-2-phenylindole, dihydrochloride (DAPI, Invitrogen Corporation, D1306) on glass slides and sealed with transparent nail varnish. Slides were viewed under fluorescence microscope and images were captured digitally using an Olympus ix81 microscope with Slidebook 5.0 × 64 software.
Chromatin immunoprecipitation (chIP) and quantitative PCR
ChIP analysis was performed by using Imprint® Chromatin Immunoprecipitation Kit (Sigma Aldrich Corporation, CHP1 96RXN). Briefly, after chromatin cross-linking with 1% formaldehyde and DNA shearing, chromatin-protein complexes were immunoprecipitated from Ad-KLF2, EV (control), siKlf2, siRNA nonspecific (siNS), undifferentiated RAW264.7 cells (control) and 6-day differentiated RAW264.7 cells with antibodies against H3K9Ac (Millipore Sigma Aldrich Corporation, 07–352) and H4K8Ac (Millipore Sigma Aldrich Corporation, 07–328). Antibody against goat IgG (Abcam, ab37373) was used as a negative control. ChIP was also performed using antibody against KLF2 (Abcam, ab203591). Quantitative PCR analysis was performed with the primers described in Table S1 and Figure S1. Values obtained from the ChIP assay were normalized to the background obtained from the precipitation with respective control antibodies. Percent (%) input was analyzed by following standard formula. Each experiment was performed in triplicate at least 3 times.
K/BxN serum-induced arthritis development in mice
To collect the arthritic serum for induction of inflammatory arthritis, K/BxN mice were generated by crossing KRN, TCR-transgenic B6 mice (kind gift from Dr. Diane Mathis, Harvard Medical School, Boston, MA) with NOD mice (Jackson Laboratory) following established protocol [Citation46]. K/BxN serum was collected from 8-week-old arthritic K/BxN mice and pooled for each experiment. Each mouse (n = 6, C57BL/6 background 6–8 weeks old, male) was induced by intra-peritoneal injection of 150 μl of K/BxN serum on days 0 and 2 following an earlier established protocol [Citation47]. Equal amounts of PBS were injected to the control mice (n = 6). Mice were observed and ankle thickness was measured every day, and mice were finally sacrificed on day 8 following the first injection of K/BxN serum.
Murine bone marrow isolation
Hind limbs were used for the bone marrow (BM) isolation after termination of experiments. In brief, the mouse was euthanized and placed onto a sterile surgical pad. Then, sterilized the mouse abdomen and hind limbs with 70% ethanol. Next, opened abdominal cavity with blunt-end sterile scissors and removed surface muscles and identified the pelvic-hip joint. Dissected off the hind leg (femur) above the pelvic-hip joint and tibia from the hind leg below the knee joint. Then, removed both ends of the clean femur bones with sharp sterile scissors. Using a 23-guage needle and 10 cc syringes with ice cold Hank’s balanced salt solution (Thermo Fisher Scientific, 14025076) flushed out the bone marrow, and placed in a 50 ml falcon tube in ice. Isolated BM cells were centrifuge at 478 x g for 5 min at 4°C and suspended the cell pellet in 1 ml RBC lysis buffer (for each mouse sample). Finally, cells were centrifuge at 478 x g for 5 min at 4°C. These BM cells were used for isolation of RNA and subjected to osteoclast differentiation.
Statistical analysis
All experiments were performed at least 3 times in triplicate, and the results were displayed as mean ± SEM. Statistical analyses were performed using GraphPad Prism 5.0 for Windows (GraphPad Software, San Diego, CA, USA). In the statistical analysis, a one-way ANOVA was used for Dunnett’s multiple-comparison test.
Supplemental Material
Download Zip (259.1 KB)Disclosure statement
No potential conflict of interest was reported by the authors.
Supplementary material
Supplemental material for this article can be accessed here.
Additional information
Funding
Related Research Data
References
- Imboden JB. The immunopathogenesis of rheumatoid arthritis. Annu Rev Pathol. 2009;4:417–434.
- Jha P, Das H. KLF2 in regulation of NF-kappaB-mediated immune cell function and inflammation. Int J Mol Sci. 2017;18(11):2383.
- Lin NY, Stefanica A, Distler JH. Autophagy: a key pathway of TNF-induced inflammatory bone loss. Autophagy. 2013;9(8):1253–1255.
- Das G, Shravage BV, Baehrecke EH. Regulation and function of autophagy during cell survival and cell death. Cold Spring Harb Perspect Biol. 2012;4(6). DOI:10.1101/cshperspect.a008813
- Choi Y, Bowman JW, Jung JU. Autophagy during viral infection - a double-edged sword. Nat Rev Microbiol. 2018;16(6):341–354.
- Rubinsztein DC, Codogno P, Levine B. Autophagy modulation as a potential therapeutic target for diverse diseases. Nat Rev Drug Discov. 2012;11(9):709–730.
- Mizushima N. Autophagy: process and function. Genes Dev. 2007;21(22):2861–2873.
- Katagiri T, Takahashi N. Regulatory mechanisms of osteoblast and osteoclast differentiation. Oral Dis. 2002;8(3):147–159.
- Valenti MT, Dalle Carbonare L, Mottes M. Role of autophagy in bone and muscle biology. World J Stem Cells. 2016;8(12):396–398.
- Shi J, Wang L, Zhang H, et al. Glucocorticoids: dose-related effects on osteoclast formation and function via reactive oxygen species and autophagy. Bone. 2015;79:222–232.
- Das H, Kumar A, Lin Z, et al. Kruppel-like factor 2 (KLF2) regulates proinflammatory activation of monocytes. Proc Natl Acad Sci U S A. 2006;103(17):6653–6658.
- Guixe-Muntet S, de Mesquita FC, Vila S, et al. Cross-talk between autophagy and KLF2 determines endothelial cell phenotype and microvascular function in acute liver injury. J Hepatol. 2017;66(1):86–94.
- Hsieh PN, Zhou G, Yuan Y, et al. A conserved KLF-autophagy pathway modulates nematode lifespan and mammalian age-associated vascular dysfunction. Nat Commun. 2017;8(1):914.
- Park JH, Lee NK, Lee SY. Current understanding of RANK signaling in osteoclast differentiation and maturation. Mol Cells. 2017;40(10):706–713.
- Cai ZY, Yang B, Shi YX, et al. High glucose downregulates the effects of autophagy on osteoclastogenesis via the AMPK/mTOR/ULK1 pathway. Biochem Biophys Res Commun. 2018. DOI:10.1016/j.bbrc.2018.04.052
- Sul OJ, Park HJ, Son HJ, et al. Lipopolysaccharide (LPS)-induced autophagy is responsible for enhanced osteoclastogenesis. Mol Cells. 2017;40(11):880–887.
- Zhang Y, Morgan MJ, Chen K, et al. Induction of autophagy is essential for monocyte-macrophage differentiation. Blood. 2012;119(12):2895–2905.
- Xu R, Shi G, Xu L, et al. Simvastatin improves oral implant osseointegration via enhanced autophagy and osteogenesis of BMSCs and inhibited osteoclast activity. J Tissue Eng Regen Med. 2018;12(5):1209–1219.
- Shapiro IM, Layfield R, Lotz M, et al. Boning up on autophagy: the role of autophagy in skeletal biology. Autophagy. 2014;10(1):7–19.
- Cao QH, Liu F, Yang ZL, et al. Prognostic value of autophagy related proteins ULK1, Beclin 1, ATG3, ATG5, ATG7, ATG9, ATG10, ATG12, LC3B and p62/SQSTM1 in gastric cancer. Am J Transl Res. 2016;8(9):3831–3847.
- Guo L, Huang JX, Liu Y, et al. Transactivation of Atg4b by C/EBPbeta promotes autophagy to facilitate adipogenesis. Mol Cell Biol. 2013;33(16):3180–3190.
- Wang Z, Cao L, Kang R, et al. Autophagy regulates myeloid cell differentiation by p62/SQSTM1-mediated degradation of PML-RARalpha oncoprotein. Autophagy. 2011;7(4):401–411.
- Wang K, Niu J, Kim H, et al. Osteoclast precursor differentiation by MCPIP via oxidative stress, endoplasmic reticulum stress, and autophagy. J Mol Cell Biol. 2011;3(6):360–368.
- Parmar KM, Nambudiri V, Dai G, et al. Statins exert endothelial atheroprotective effects via the KLF2 transcription factor. J Biol Chem. 2005;280(29):26714–26719.
- Ghavami S, Mutawe MM, Schaafsma D, et al. Geranylgeranyl transferase 1 modulates autophagy and apoptosis in human airway smooth muscle. Am J Physiol Lung Cell Mol Physiol. 2012;302(4):L420–428.
- Parikh A, Childress C, Deitrick K, et al. Statin-induced autophagy by inhibition of geranylgeranyl biosynthesis in prostate cancer PC3 cells. Prostate. 2010;70(9):971–981.
- Sen-Banerjee S, Feinberg M, Watanabe M, et al. The Kruppel-like factor KLF2 inhibits PPAR gamma expression and adipogenesis. J Biol Chem. 2003;278(4):2581–2584.
- Sen-Banerjee S, Mir S, Lin Z, et al. Kruppel-like factor 2 as a novel mediator of statin effects in endothelial cells. Circulation. 2005;112(5):720–726.
- Kuo CT, Veselits ML, Leiden JM. LKLF: A transcriptional regulator of single-positive T cell quiescence and survival [see comments]. Science. 1997;277(5334):1986–1990.
- Buckley AF, Kuo CT, Leiden JM. Transcription factor LKLF is sufficient to program T cell quiescence via a c-Myc-dependent pathway. Nat Immunol. 2001;2(8):698–704.
- Das M, Lu J, Joseph M, et al. Jain MK and Das H.: kruppel-like factor 2 (KLF2) regulates monocyte differentiation and functions in mBSA and IL-1β-induced arthritis. Curr Mol Med. 2012;12(2):113–125.
- Marschall JS, Wilhelm T, Schuh W, et al. MEK/Erk-based negative feedback mechanism involved in control of Steel Factor-triggered production of Kruppel-like factor 2 in mast cells. Cell Signal. 2012;24(4):879–888.
- Kang R, Zeh HJ, Lotze MT, et al. The beclin 1 network regulates autophagy and apoptosis. Cell Death Differ. 2011;18(4):571–580.
- Chung YH, Jang Y, Choi B, et al. Beclin-1 is required for RANKL-induced osteoclast differentiation. J Cell Physiol. 2014;229(12):1963–1971.
- Yang Y, Fiskus W, Yong B, et al. Acetylated hsp70 and KAP1-mediated Vps34 SUMOylation is required for autophagosome creation in autophagy. Proc Natl Acad Sci U S A. 2013;110(17):6841–6846.
- Cuervo AM. The plasma membrane brings autophagosomes to life. Nat Cell Biol. 2010;12(8):735–737.
- Araki Y, Mimura T. The histone modification code in the pathogenesis of autoimmune diseases. Mediators Inflamm. 2017;2017:2608605.
- Chung YL, Lee MY, Wang AJ, et al. A therapeutic strategy uses histone deacetylase inhibitors to modulate the expression of genes involved in the pathogenesis of rheumatoid arthritis. Mol Ther. 2003;8(5):707–717.
- Chen XM, Huang QC, Yang SL, et al. Role of micro RNAs in the pathogenesis of rheumatoid arthritis: novel perspectives based on review of the literature. Medicine (Baltimore). 2015;94(31):e1326.
- Boon RA, Horrevoets AJ. Key transcriptional regulators of the vasoprotective effects of shear stress. Hamostaseologie. 2009;29(1):39–40, 41–33.
- Ogryzko VV, Schiltz RL, Russanova V, et al. The transcriptional coactivators p300 and CBP are histone acetyltransferases. Cell. 1996;87(5):953–959.
- Bannister AJ, Kouzarides T. The CBP co-activator is a histone acetyltransferase. Nature. 1996;384(6610):641–643.
- Huang J, Wan D, Li J, et al. Histone acetyltransferase PCAF regulates inflammatory molecules in the development of renal injury. Epigenetics. 2015;10(1):62–72.
- Boyce BF, Xiu Y, Li J, et al. NF-kappaB-mediated regulation of osteoclastogenesis. Endocrinol Metab (Seoul). 2015;30(1):35–44.
- Bishop KA, Coy HM, Nerenz RD, et al. Mouse Rankl expression is regulated in T cells by c-Fos through a cluster of distal regulatory enhancers designated the T cell control region. J Biol Chem. 2011;286(23):20880–20891.
- Kouskoff V, Korganow AS, Duchatelle V, et al. Organ-specific disease provoked by systemic autoimmunity. Cell. 1996;87(5):811–822.
- Jacobs JP, Ortiz-Lopez A, Campbell JJ, et al. Deficiency of CXCR2, but not other chemokine receptors, attenuates autoantibody-mediated arthritis in a murine model. Arthritis Rheum. 2010;62(7):1921–1932.