
ABSTRACT
Mitochondrial dynamics is highly implicated in a plethora of cellular processes including apoptosis and mitophagy. However, little is known about the scope and precise functions of mitochondrial dynamics proteins for mitochondrial quality control and cellular homeostasis. Whether mitochondrial dynamics proteins serve in cellular processes reliant on mitochondrial fission-fusion is still not fully explored. MIEF1/MiD51 (mitochondrial elongation factor 1) is known to promote mitochondrial fission via the recruitment of GTPase protein DNM1L/DRP1 (dynamin 1 like), but the fundamental understandings of MIEF1 for mitochondrial-dependent cellular processes are largely elusive. Here, we report novel roles of MIEF1 in responding to apoptotic stimuli and mitochondrial damage. Given our result that staurosporine (STS) treatment induced the degradation of MIEF1 via the ubiquitin-proteasome system (UPS), we are motivated to explore the role of MIEF1 in apoptosis. MIEF1 loss triggered the imbalance of BCL2 family members on the mitochondria, consequently initiating the translocation of BAX onto the mitochondria, catalyzing the decrease of mitochondrial membrane potential and promoting the release of DIABLO/SMAC (diablo IAP-binding mitochondrial protein) and CYCS (cytochrome c, somatic). We further demonstrate that MIEF1 deficiency impaired mitochondrial respiration and induced mitochondrial oxidative stress, sensitizing cells to PINK1-PRKN-mediated mitophagy. The recruitment of PRKN to depolarized mitochondria modulated the UPS-dependent degradation of MFN2 (mitofusin 2) and FIS1 (fission, mitochondrial 1) specifically, to further promote mitophagy. Our findings uncover a bridging role of MIEF1 integrating cell death and mitophagy, unlikely dependent on mitochondrial dynamics, implying new insights to mechanisms determining cellular fate.
Abbreviations: ActD: actinomycin D; BAX: BCL2 associated X, apoptosis regulator; BAK1: BCL2 antagonist/killer 1; BCL2L1: BCL2 like 1; BMH: 1,6-bismaleimidohexane; CCCP: carbonyl cyanide 3-chlorophenylhydrazone; CHX: cycloheximide; CQ: chloroquine; CYCS: cytochrome c, somatic; DIABLO: diablo IAP-binding mitochondrial protein; DKO: double knockout; DNM1L/DRP1: dynamin 1 like; FIS1: fission, mitochondrial 1; GFP: green fluorescent protein; IP: immunoprecipitation; MFN1: mitofusin 1; MFN2: mitofusin 2; MG132: carbobenzoxy-Leu-Leu-leucinal; MIEF1/MiD51: mitochondrial elongation factor 1; MIEF2/MiD49: mitochondrial elongation factor 2; MOMP: mitochondrial outer membrane permeabilization; MTR: MitoTracker Red; OA: oligomycin plus antimycin A; OCR: oxygen consumption rate; OMM: outer mitochondrial membrane; PARP: poly(ADP-ribose) polymerase; PI: propidium iodide; PINK1: PTEN induced kinase 1; PRKN: parkin RBR E3 ubiquitin protein ligase; ROS: reactive oxygen species; SD: standard deviation; STS: staurosporine; TNF: tumor necrosis factor; UPS: ubiquitin-proteasome system; VDAC1: voltage dependent anion channel 1.
KEYWORDS:
Introduction
Adapting to a variety of physiological demands, mitochondria converge stresses and respond to maintain cellular homeostasis [Citation1–Citation3]. Paradoxically, mitochondria are also essential in the regulation of apoptotic cell death [Citation4,Citation5]. Apoptosis is a genetically encoded cell-suicide program [Citation6–Citation8], and dysregulation of apoptosis is highly implicated in diverse pathologies, including cancer and neurodegenerative diseases [Citation9,Citation10]. The balance between pro-apoptotic and anti-apoptotic proteins of BCL2 family governs a key step in the commitment of cells to apoptosis, by regulating mitochondrial outer membrane permeabilization (MOMP) [Citation4,Citation11,Citation12]. In response to apoptotic stimuli, cytosolic BAX (BCL2 associated X, apoptosis regulator) is activated, undergoing structural reformation, and homo-oligomerizes on outer mitochondrial membrane (OMM) whereby BAK1 (BCL2 antagonist/killer 1) also self-oligomerizes. The assembled complexes of mitochondrial BAX and BAK1 then form pores on OMM, releasing intermembrane space proteins, including DIABLO (diablo IAP-binding mitochondrial protein) and CYCS (cytochrome c, somatic) [Citation13,Citation14]. The escape of DIABLO and CYCS from the mitochondria into the cytosol activates downstream caspases, which cleave a number of proteins leading to the dismantling of whole cell during apoptosis [Citation15,Citation16].
Mitochondria are highly dynamic organelles undergoing continuous fission and fusion [Citation17–Citation19]. In concert with cell fate, mitochondrial dynamics is closely related to apoptosis [Citation20,Citation21]. In particular, the most prevalent mechanism is that mitochondrial fission accelerates apoptosis whereas mitochondrial elongation is thought to protect cells against death. Accumulated evidence indicates that mitochondrial morphology becomes fragmented and that DNM1L, a mitochondrial fission GTPase protein, co-localizes with BAX and BAK1 at the onset of apoptosis [Citation22–Citation26]. However, it remains unclear how mitochondrial dynamics regulates MOMP. Some studies found that mitochondrial fission-fusion imbalance by depleting DNM1L fails to interfere with apoptosis programming [Citation27–Citation30], bringing into question that whether mitochondrial fission is preliminary for apoptosis. Thus, more characterization of mitochondrial dynamics proteins in the regulation of cell death requires to be studied.
Mitochondrial-associated apoptosis results in gross production of reactive oxygen species (ROS) inevitably [Citation31]. However, in addition to apoptotic cell death sentences, cells can also utilize an alternative pathway to remove aberrant mitochondria, which is mediated by the selective autophagy, known as ‘mitophagy’ [Citation32–Citation34]. The most principle mitophagic pathway is the PINK1-PRKN-dependent route. Upon loss of mitochondrial membrane potential, the PINK1 (PTEN induced kinase 1) stabilizes on OMM [Citation35–Citation37], phosphorylating ubiquitin and PRKN (parkin RBR E3 ubiquitin protein ligase), which promotes the E3 ligase activity of PRKN, leading to further deposition of ubiquitin and PRKN accumulation onto the mitochondria [Citation38,Citation39]. PRKN subsequently mediates the ubiquitination and degradation of mitochondrial resident proteins, including MFN1 (mitofusin 1), MFN2 and VDAC1 (voltage dependent anion channel 1) via the ubiquitin-proteasome pathway [Citation40–Citation43]. This feed-forward mechanism essentially triggers the engulfment of mitochondria by ubiquitin adaptors, resulting in mitochondrial clearance through lysosomal degradation [Citation44–Citation46]. Physiologically, PINK1-PRKN-mediated mitophagy is highly pronounced in pathogenicity of neuronal diseases, particularly Parkinson disease [Citation47,Citation48]. Mutations of PINK1 and PRKN have been found in Parkinson disease, suggesting the underlying physiological importance of PINK1-PRKN-dependent mitophagy. It is intensively studied that in cultured cells, acute mitochondrial damage and toxification are required to induce the PINK1-PRKN pathway. The mitochondrial uncoupler carbonyl cyanide 3-chlorophenylhydrazone (CCCP) is widely used to depolarize mitochondria, triggering the translocation of PRKN onto damaged mitochondria. However, very little is known about the threshold level of ‘vulnerability’ of mitochondria to toxins, which may prime cells to mitophagy.
MIEF1 is an outer mitochondrial membrane protein, containing a single-pass transmembrane domain at the N-terminus, which anchors the protein to the mitochondria, with the bulk of the protein facing the cytosol. MIEF1 was simultaneously identified with MIEF2, which similarly mediates the mitochondrial fission machinery via DNM1L [Citation49,Citation50]. Overexpression of MIEF1 or MIEF2 sequesters excessive inactive DNM1L on OMM, prohibiting mitochondrial fission. Conversely, depletion of MIEF1 or MIEF2 abolishes the oligomerization of DNM1L on the mitochondria, resulting in mitochondrial elongation or collapse [Citation49–Citation52]. Thus, the levels of MIEF1 or MIEF2 are critical for the regulation of mitochondrial dynamics. Of note, balance of mitochondrial fission and fusion serves to myriad physiological routes including cell death and mitophagy. Particularly, different roles of MIEF1 on apoptosis have been reported. MIEF1 deficiency was found to sensitize cells to apoptotic stimuli [Citation50] whereas that the double knockout (DKO) of MIEF1 and MIEF2 was reported to protect cells against intrinsic apoptosis progression though mitochondrial cristae remodelling [Citation53]. Thus, uncertainty concerning the precise roles of MIEF1 remains and the bona fide function of MIEF1 on mitochondria needs to be further addressed.
Here, we observe that canonical intrinsic apoptotic stimulus, STS, induced the specific degradation of MIEF1 via the UPS, closely linking the expression level of MIEF1 with apoptosis. We demonstrate that MIEF1 deficiency sensitized cytosolic BAX to translocate onto the mitochondria, mediated by the re-localization of BCL2L1 (BCL2 like 1). Consequently, overexpressed BAX assembled and oligomerized on OMM to induce MOMP, releasing DIABLO and CYCS, to facilitate cell death, in the absence of ectopic apoptotic stimuli. Strikingly, we additionally uncover a novel role of MIEF1, in which the depletion of MIEF1 primed cells to a rapid burst of PRKN recruitment upon loss of mitochondrial membrane potential and triggered the onset of PINK1-PRKN-dependent mitophagy via the promoted degradation of MFN2 and FIS1. Our results indicate critical roles of MIEF1 on governing mitochondrial quality control, integrating cell death and mitophagy.
Results
STS destabilized MIEF1 via the ubiquitin-proteasome pathway
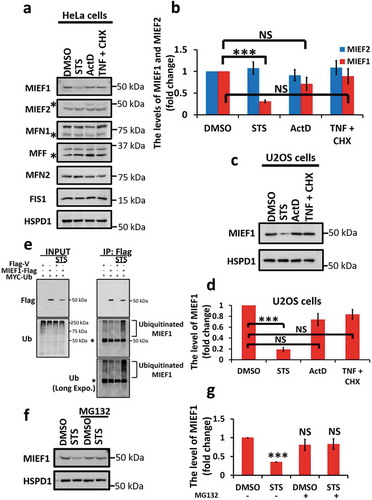
Mitochondria play critical roles in responding to both intrinsic and extrinsic apoptotic stimuli to regulate cellular turnover [Citation54,Citation55]. To investigate the relationship between mitochondrial dynamics and apoptosis, we first sought to examine the expression levels of proteins involved in mitochondrial dynamics in HeLa cells, following the treatment of a range of different apoptotic stimuli, including STS, actinomycin D (ActD) and a combination of TNF/TNF-α (tumor necrosis factor) and cycloheximide (CHX). Given the existence of a non-specific band close to the size of MIEF1 in the cytosolic fraction detected by the commercial antibody, we extracted mitochondrial fractions for analysis. STS was found to markedly decrease the protein level of MIEF1 by 0.69 ± 0.03-fold, while the expression levels of other OMM proteins, including MIEF2, MFN1, MFN2, MFF and FIS1, remained unchanged (). The reduction in MIEF1 protein level following STS treatment was not cell type-specific, as a similar loss of 0.81 ± 0.04-fold was confirmed in U2OS cell line (). To test whether caspase activity contributes to the decrease of MIEF1 protein level, we applied a pan-caspase inhibitor, Q-VD-OPH, to inhibit the catalytic activity of caspases (Fig. S1A). Q-VD-OPH was unable to recover the suppression of MIEF1 level upon STS treatment, indicating that STS regulates the protein level of MIEF1, likely upstream of MOMP. To determine if the effect of STS on MIEF1 stability relies on the UPS, we enriched the level of MIEF1-Flag using anti-Flag beads following STS treatment. A substantial increase in the level of poly-ubiquitination was detected in MIEF1-Flag immunoprecipitate (), suggesting that STS down-regulates MIEF1 via the UPS. This conclusion is supported by the data showing that the proteasomal inhibitor, MG132, was able to stabilize and rescue the level of MIEF1 following STS induction ().
Figure 1. Staurosporine (STS) induces selective degradation of MIEF1 via the ubiquitin-proteasome pathway. (a) HeLa cells were treated with DMSO, 100 nM STS, 0.3 µM actinomycin D (ActD) or 20 ng/ml tumor necrosis factor (TNF) plus 3 μg/ml cycloheximide (CHX) for 16 h. Mitochondrial fractions of cells were then subjected to immunoblotting. Asterisks indicate non-specific bands. (b) Quantification of the levels of MIEF2 and MIEF1 in (a) is shown. Averages are shown as quantified by densitometry from 3 independent experiments. The levels of MIEF2 or MIEF1 proteins were normalized to HSPD1. Error bars represent standard deviation (SD). ***P < 0.001, NS, not significant. (c) Mitochondrial fractions of U2OS cells treated as indicated were analyzed by immunoblotting. (d) The levels of MIEF1 in U2OS cells were quantified by densitometry from 3 independent experiments. Bars indicate mean ± SD. ***P < 0.001, NS, not significant. (e) HeLa cells were transiently transfected with Flag-tagged vector or MIEF1 and MYC-tagged Ubiquitin for 24 h. After treatment with 100 nM STS and 1 μM MG132 for 16 h, cells were lysed and subjected to immunoprecipitation (IP) with anti-Flag antibody. IP products and cell lysates were detected with anti-Flag and anti-Ub. Asterisks indicate non-specific bands. (f) Mitochondrial fractions of HeLa cells treated as indicated were subjected to SDS-PAGE. (g) MIEF1 level normalized to the HSPD1 expression is presented. Bar chart represents data from 3 independent experiments as in (f). Error bars indicate SD. ***P < 0.001, NS, not significant.
Loss of MIEF1 sensitized cells to apoptotic stimuli
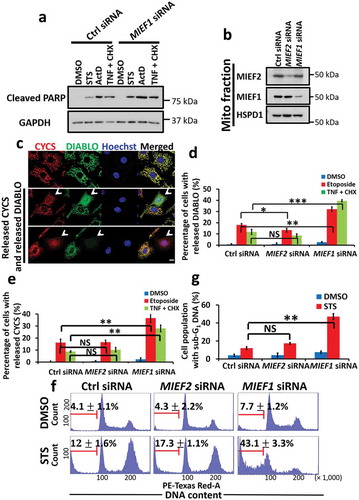
Given the correlation between STS treatment and the suppressed level of MIEF1, we then sought to characterize the role of MIEF1 in apoptosis. Remarkably, MIEF1 knockdown promoted apoptosis, as measured by the increase of cleaved PARP, in response to both intrinsic and extrinsic stimuli (). In contrast, the ectopic expression of MIEF1 was found to antagonize apoptosis following apoptotic stimuli (Fig. S2A). The percentage of cells exhibiting released DIABLO and CYCS was also increased following the incubation with the intrinsic apoptotic inducer, etoposide, or the extrinsic toxin, the combination of TNF and CHX, when cells were depleted of MIEF1 versus those treated with control or MIEF2 siRNA (). Similarly, analyses of MIEF1 siRNA-treated cells by flow cytometry revealed an enhanced sub-G1 population () and propidium iodide (PI) uptake (Fig. S2B and C), confirming the susceptibility of MIEF1 deficiency to cell death. Furthermore, sensitization to apoptosis was also detected in MCF7 cells with MIEF1 loss, following the treatment with actinomycin D or etoposide (Fig. S2D-F), reaching to the same conclusion that MIEF1 is important to protect cells from apoptosis.
Figure 2. MIEF1 deficiency sensitizes cells to apoptosis. (a) HeLa cells were transiently transfected with control or MIEF1 siRNA for 48 h prior to the indicated treatment for further 16 h. Cells were lysed and subjected to SDS-PAGE and immunoblotted using respective antibodies. (b) MIEF2 and MIEF1 silencing was detected in HeLa cells by immunoblotting. (c) Representative images to show the unrelease or release (indicated by white arrowheads) of CYCS (red) and DIABLO (green). The release of CYCS and DIABLO was induced by 20 ng/ml TNF plus 3 μg/ml CHX for 16 h. Hoechst, blue. Scale bar: 10 µm. (d and e) HeLa cells transfected with control, MIEF2 or MIEF1 siRNA were treated with 10 µg/ml etoposide or 20 ng/ml TNF plus 3 μg/ml CHX for 16 h. Quantification of the percentage of cells displaying DIABLO release (d) or CYCS release (e) is shown. Bars represent mean ± SD. n > 150 cells from 3 independent experiments. *P < 0.05, **P < 0.01, ***P < 0.001, NS, not significant. (f) Cells transfected with the indicated siRNA were treated with 100 nM STS for 16 h and fixed. DNA fragmentation was detected by PI staining. The percentage of sub-G1 population (in which cellular DNA is cleaved as fractional at the late stage of apoptosis) is shown as mean ± SD. (G) Quantification of sub-G1 population is shown from 3 independent experiments as in (f). Bas indicate mean ± SD. **P < 0.01, NS, not significant.
MIEF1 deficiency triggered the translocation and oligomerization of BAX on mitochondria
BAX is considered as a pro-apoptotic effector, required for mitochondrial-mediated apoptosis [Citation13,Citation56]. Inactive BAX resides predominantly in the cytosol whereas activated BAX is recruited and assembled as foci on OMM where it mediates MOMP. In an attempt to investigate the function of MIEF1 on BAX translocation, we silenced various OMM proteins and visualized the subcellular localization of GFP-tagged BAX. Interestingly, knockdown of MIEF1 specifically resulted in GFP-BAX translocation onto the mitochondria, decreased mitochondrial membrane potential (indicated by MitoTracker Red), and release of DIABLO ( and Fig. S3A). Increases of BAX translocation were obtained using two independent siRNAs targeting MIEF1 (Fig. S3B-D). The proportion of cells with clustered BAX on mitochondria was significantly increased from 1.8 ± 0.3% in control siRNA-transfected cells to 35.1 ± 2.1% in cells transfected with MIEF1 siRNA #1 and 31.7 ± 1.9% of cells transfected with MIEF1 siRNA #2 respectively. However, knockdown of other genes involved in mitochondrial dynamics, including FIS1, MFF, DNM1L, MIEF2, MFN1 and MFN2, was unable to induce BAX recruitment, suggesting the exclusive regulation of MIEF1 on BAX ( and Fig. S3A). In MIEF1-silenced HeLa cells, abundant GFP-BAX translocation was associated with more efficient DIABLO and CYCS release (). Furthermore, elevated oligomerization of BAX on mitochondria in MIEF1-depleted cells was confirmed by 1,6-bismaleimidohexane (BMH) cross-linking (). Of note, in addition to BAX, loss of MIEF1 also induced BAK1-mediated depolarization of mitochondria (Fig. S3E-G), highlighting the critical role of MIEF1 for mitochondrial-dependent apoptosis, in response to pro-apoptotic effectors BAX and BAK1. As expected, the re-expression of MIEF1-MYC (Mus musculus) reversed the accumulation of BAX in MIEF1-depleted HeLa cells (). Along with this line, we sought to determine the translocation of endogenous BAX by apoptotic stimuli TNF plus CHX (). Of note, the translocation of endogenous BAX was increased from 15.1 ± 1.0% in cells transfected with control siRNA to 56.8 ± 2.26% in cells silenced by MIEF1 siRNA, supporting the role of MIEF1 in governing the shuffling of BAX between cytosol and mitochondria. Collectively, here we demonstrate that MIEF1 loss drove BAX translocation and oligomerization on mitochondria. Subsequently, MOMP led to the release of DIABLO and CYCS to initiate apoptosis.
Figure 3. MIEF1 regulates BAX. (a) HeLa cells were transfected with the indicated siRNA for 24 h. Cells were then transfected with GFP-tagged BAX (green) for further 24 h. Cells were incubated with MitoTracker Red (MTR, red) for 15 min and hereafter fixed and immunostained for DIABLO (cyan). Hoechst, blue. Scale bar: 10 µm. Arrowheads indicate cells with BAX translocation. (b) Quantification of GFP-BAX translocation onto mitochondria as shown in (a). Bars represent the mean ± SD. ***P < 0.001. n > 150 cells for each group from 3 independent experiments. (c) HeLa cells were transfected with the indicated siRNA for 24 h and GFP-tagged BAX (green) for further 24 h, then fixed and immunostained for DIABLO (red) and CYCS (cyan). Hoechst, blue. Scale bar: 10 µm. Arrowheads indicate cells with BAX translocation. (d) Quantification of GFP-BAX translocation onto mitochondria as in (c). Bars represent the mean ± SD. ***P < 0.001, NS, not significant. n > 150 cells for each group from 3 independent experiments. (e) Cells were treated with control or MIEF1 siRNA for 48 h before transfection with Flag-tagged BAX for further 24 h. The oligomerization of Flag-BAX in mitochondrial fraction was determined via crosslinking using 2 mM BMH. (f) Quantification of Flag-BAX monomer as shown in (e). Flag-BAX monomer was normalized to TUBB (cytosol) or TIMM23 (mitochondria). Cytosolic or mitochondrial Flag-BAX monomer was expressed as a percentage of total Flag-BAX monomer. Data are means ± SD (n = 3). *P < 0.05. (g) The ratio of BAX dimer or trimer to monomer in mitochondrial fraction was quantified from 3 independent experiments as in (e). Bars indicate means ± SD. *P < 0.05. (h) HeLa cells were transfected with control or MIEF1 siRNA for 24 h before transfection with MYC-tagged vector or Mief1 (Mus musculus) plus GFP-tagged BAX (green) for further 24 h, then fixed and immunostained for DIABLO (red) and MYC (cyan). Hoechst, blue. Scale bar: 10 µm. Arrowheads indicate cells with BAX translocation. (i) Scoring of the GFP-BAX translocation onto mitochondria as in (h). Error bars represent SD. ***P < 0.001. n > 150 cells for each group from 3 independent experiments.
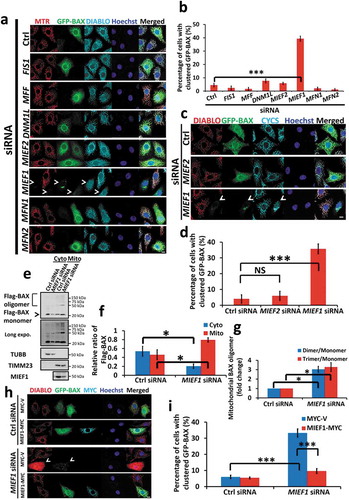
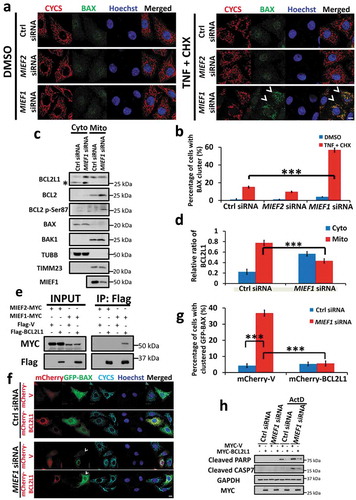
Figure 4. BAX translocation induced by MIEF1 loss is mediated by BCL2L1 retranslocation. (a) HeLa cells were transfected with siRNA as indicated for 48 h. Then cells were treated with 20 ng/ml TNF plus 3 μg/ml CHX for further 16 h. Cells were hereafter fixed and immunostained for CYCS (red) and endogenous BAX (green). Hoechst, blue. Scale bar: 10 µm. Arrowheads indicate cells with BAX translocation on mitochondria. (b) The translocation of endogenous BAX was quantified from 3 independent experiments as in (a). Error bars represent SD. ***P < 0.001. n > 150 cells for each group from 3 independent experiments. (c) Cells were transfected with control or MIEF1 siRNA for 72 h. Cytosolic and mitochondrial fractions were extracted and BCL2 family members were detected by immunoblotting. Asterisk indicates a non-specific band. (d) The quantification of BCL2L1 in (c) is shown. BCL2L1 was normalized to TUBB (cytosol) or TIMM23 (mitochondria). Cytosolic or mitochondrial BCL2L1 was expressed as a percentage of total BCL2L1. Data are means ± SD (n = 3). ***P < 0.001. (e) HeLa cells were co-transfected with the indicated plasmids. After 24 h, cells were extracted and co-immunoprecipitated with anti-Flag beads followed by immunoblotting with anti-MYC and anti-Flag antibodies respectively. (f) HeLa cells were transfected with control or MIEF1 siRNA for 24 h. Cells were then transfected with mCherry-tagged vector or BCL2L1 (red) plus GFP-BAX (green) for further 24 h. Cells were fixed and immunostained with anti-CYCS antibody (cyan). Hoechst, blue. Scale bar: 10 µm. (g) Scoring of the GFP-BAX translocation onto mitochondria as in (f). Bar represents mean ± SD. ***P < 0.001. n > 100 cells for each group from 3 independent experiments. (h) HeLa cells were transfected with control or MIEF1 siRNA for 24 h before transfection with MYC-tagged vector or BCL2L1 for further 24 h. Hereafter, cells were treated with DMSO or 0.3 µM actinomycin D for 16 h. Lysates were analyzed by SDS-PAGE and immunoblotting.
MIEF1 regulated BAX via BCL2L1, but independently on DNM1L
Given the close relationship between apoptosis and mitochondrial dynamics, we considered the role of DNM1L in BAX translocation upon MIEF1 depletion. When we silenced MIEF1 in the DNM1L knock-down cells, we found that DNM1L deficiency failed to interfere BAX translocation in MIEF1-depleted cells, although evidence of elongated mitochondria was apparent (Fig. S4A-C). In agreement of this finding, we observed no appreciable reduction of BAX recruitment following MIEF1 knockdown in cells expressing a dominant-negative mutant of DNM1L (DNM1LK38A) (Fig. S4D and E), illustrating that the modulation of BAX recruitment upon MIEF1 loss is independent on mitochondrial dynamics.
Next, we hypothesized that MIEF1 deficiency may confer sensitivity to apoptosis via triggering an imbalance of BCL2 family members. To test this, we analyzed the levels of anti-apoptotic modulators, including BCL2L1 and BCL2 in the mitochondrial fraction of MIEF1-depleted cells. We found that elevated level of mitochondrial BCL2L1 translocated to the cytosol in MIEF1-silenced cells (). In addition, mitochondrial BCL2 was phosphorylated at the Ser87 residue, indicative of suppressed anti-apoptotic potential [Citation57]. However, somewhat surprisingly, we failed to detect the translocation of endogenous BAX to mitochondria upon MIEF1 depletion in basal conditions without ectopic apoptotic stimulus, although this is consistent with a previous report [Citation53]. We reasoned that reduced mitochondrial BCL2L1 show little effect on altering the localization of endogenous BAX, which is at a low level on mitochondria. However, when an excessive level of BAX is present, for instance, in the case when BAX is overexpressed, the reduction of mitochondrial BCL2L1 mediated by MIEF1 deficiency would be sufficient to recruit cytosolic BAX onto mitochondria. This may explain our earlier observation whereby MIEF1 depletion was capable to induce apoptosis when we simultaneously overexpressed BAX, but in the absence of ectopic stimuli (). To further clarify the relationship between BCL2L1 and MIEF1 in the regulation of BAX, we validated the interaction of BCL2L1 with MIEF1 but not with MIEF2, by co-immunoprecipitation (), suggesting a selective regulation between MIEF1 and BCL2L1, which may account for the translocation of BAX in MIEF1-depleted cells. Consistent with this proposition, overexpression of mCherry-BCL2L1, which localized exclusively on mitochondria, substantially inhibited the oligomerization of mitochondrial BAX and the activation of caspase (). Taken together, our data elucidate that MIEF1 may govern the level of mitochondrial BCL2L1, which subsequently regulates the translocation of excessive BAX onto mitochondria for apoptosis commitment, while this specific function of MIEF1 on BAX is independent on DNM1L-mediated mitochondrial fission.
MIEF1 depletion facilitated PINK1-PRKN-mediated mitophagy
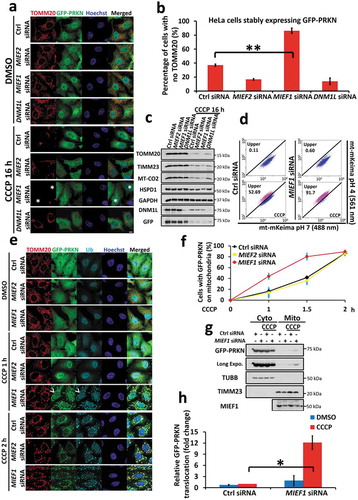
Based on the concomitant regulation between pro-death and pro-survival pathways, among which mitochondria play critical roles, we sought to determine the importance of MIEF1 in mitochondrial self-defence, specifically ‘mitophagy’. Induction of PINK1-PRKN-mediated mitophagy is known to occur in mammalian cells upon mitochondrial toxin. To this end, we transfected HeLa cells stably expressing GFP-PRKN (referred to as HeLa:GFP-PRKN), with siRNA targeting MIEF2, MIEF1 or DNM1L and monitored mitophagy following CCCP-induced mitochondrial depolarization (, Fig. S5A and B). Strikingly, mitophagy was dramatically enhanced by MIEF1 silencing, as evidenced by the loss of mitochondrial proteins, analyzed from immunofluorescence and immunoblotting. To further confirm this, we utilized HeLa cells stably expressing YFP-PRKN and mt-mKeima, and examined the ratio of acidified mitophagosome, as a quantitative indicator of mitophagy by flow cytometry [Citation46]. Upon silencing MIEF1, we observed an increase in the proportion of CCCP-induced mitophagy from 50.3 ± 2.2% of control siRNA transfected cells to 92.3 ± 3.6% ( and Fig. S5C). Higher sensitivity to PINK1-PRKN-dependent mitophagy was also detected in MIEF1-depleted cells in response to other mitophagy inducers including oligomycin plus antimycin A (OA) and valinomycin (Fig. S5D), despite of our earlier observation that these toxins, in contrast to STS, were unable to induce appreciable degradation of MIEF1 in HeLa cells not expressing PRKN (Fig. S1B). To ensure that we were observing on-target effects of MIEF1 siRNA, we again applied an additional MIEF1 siRNA (MIEF1 siRNA #2) to HeLa:GFP-PRKN cells and found consistent results, confirming that mitophagy sensitization was due to the specific depletion of MIEF1 (Fig. S5E-G). Corroborating our data of mitophagy, HeLa:GFP-PRKN cells depleted of MIEF1 also displayed increased PRKN recruitment kinetics over early stages of CCCP treatment (). In line with this result, we observed increased recruitment of GFP-PRKN onto mitochondria responding to OA and Valinomycin treatment (Fig. S5H-J), although we failed to detect the boost of PINK1 stability by MIEF1 loss (Fig. S5K). Taken together, our results demonstrate that MIEF1 deficiency confers sensitivity to PRKN translocation and mitophagy, induced by loss of mitochondrial membrane potential.
Figure 5. MIEF1 loss primes cells to PINK1-PRKN-dependent mitophagy. (a) HeLa cells stably expressing GFP-PRKN (green) were transfected with the indicated siRNA for 48 h. Cells were then treated with DMSO or 10 µM CCCP for 16 h, followed by immunostaining with anti-TOMM20 antibody (red). Hoechst, blue. Scale bar: 10 µm. Asterisks indicate mitophagic cells. (b) PRKN-mediated mitophagy shown as in (a) was quantified. Data represent mean ± SD. **P < 0.01. n > 150 cells for each group from 3 independent experiments. (c) Total cell lysates treated as in (a) were subjected to SDS-PAGE and immunoblotting. (d) HeLa cells stably expressing YFP-PRKN and mt-mKeima were transfected with control or MIEF1 siRNA for 48 h. Cells were then treated with DMSO or 10 µM CCCP for further 16 h, followed by flow cytometry analysis. (e) HeLa cells stably expressing GFP-PRKN (green) transfected with the indicated siRNA for 48 h were treated with DMSO or 5 µM CCCP for the indicated time. Cells were then fixed and immunostained for TOMM20 (red) and Ubiquitin (cyan). Hoechst, blue. Scale bar, 10 µm. Arrowheads indicate PRKN translocation. (f) Quantification of PRKN recruitment onto mitochondria as in (e). Data points represent mean ± SD. n > 150 cells for each group from 3 independent experiments. (g) Immunoblotting analysis of cytosolic or mitochondrial fractions as in (e) treated with 5 µM CCCP for 0 h or 1.5 h, respectively. (h) Quantitative analysis of (g). GFP-PRKN was normalized to TUBB (cytosol) or TIMM23 (mitochondria). Data are presented as percentage of total GFP-PRKN, normalized to mitochondrial fraction of control siRNA group upon CCCP treatment. Error bar indicates SD from 3 independent replicates. *P < 0.05.
Overexpression of MIEF1 conferred resistance to PINK1-PRKN-dependent mitophagy
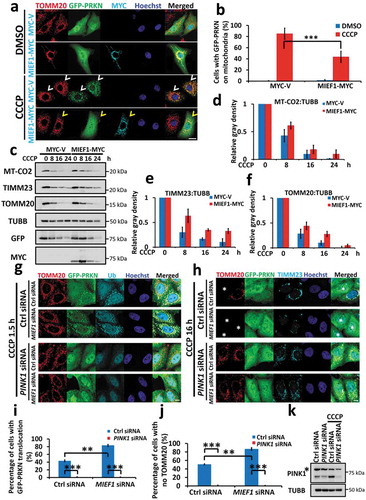
Given the effect of MIEF1 on PINK1-PRKN-mediated mitophagy, we hypothesized that the level of MIEF1 is relevant to mitochondrial homeostasis, in which overexpression of MIEF1 may suppress mitophagy. To investigate this, we studied the translocation of PRKN at the early stages of CCCP treatment within 1.5 h. Ectopic expression of Mief1 was indeed able to block the recruitment of PRKN onto depolarized mitochondria () and slowed the degradation of mitochondrial proteins, including mitochondrial DNA-encoded MT-CO2, mitochondrial inner membrane protein TIMM23 and outer mitochondrial membrane protein TOMM20, compared with vector-expressing cells (), suggesting the antagonistic effect of MIEF1 on mitophagy. However, loss of PINK1 significantly abolished PRKN recruitment and mitophagy, even in MIEF1-deficient cells (), implying an essential requirement of PINK1 for MIEF1 regulated-mitophagy. Thus, we concluded that the level of MIEF1 is crucial for the on-pathway kinetics of PINK1-PRKN-mediated mitophagy.
Figure 6. Overexpression of MIEF1 impedes PINK1-PRKN-mediated mitophagy. (a) HeLa cells were transfected with MYC-tagged vector or Mief1 (cyan) plus GFP-tagged PRKN for 24 h. Cells were then treated with DMSO or 5 µM CCCP for 1.5 h, followed by immunostaining with anti-TOMM20 (red) and anti-MYC (cyan) antibodies. Hoechst, blue. Scale bar: 10 µm. Cells with PRKN translocation induced by 1.5 h CCCP treatment are displayed with white arrowheads, whereas cells with no PRKN translocation under CCCP treatment are displayed with yellow arrowheads. (b) PRKN translocation onto mitochondria shown as in (a) was quantified. Data represent mean ± SD. ***P < 0.001. n > 100 cells for each group from 3 independent experiments. (c) HeLa cells stably expressing GFP-PRKN were transfected with MYC-tagged vector or Mief1 for 24 h. Then cells were treated with 10 µM CCCP for the indicated time. Total cell lysates were subjected to SDS-PAGE and immunoblotting. (d–f) The respective amounts of indicated mitochondrial proteins as in (c) were quantified from 3 independent experiments. Protein levels were normalized to TUBB without CCCP treatment. Error bars indicate SD. (g and h) HeLa cells stably expressing GFP-PRKN were transfected with the control or PINK1 siRNA for 24 h. Cells were transfected with control or MIEF1 siRNA for further 48 h. Mitochondria were visualized by immunostaining for TOMM20 (red) following 5 µM CCCP treatment for 1.5 h (g) or 10 µM CCCP for 16 h (h). Asterisks indicate mitophagic cells. (i and j) Recruitment of GFP-PRKN onto mitochondria in (g) or mitophagy percentage in (h) was scored from 3 independent experiments. Data represent mean ± SD. **P < 0.01, ***P < 0.001. n > 150 cells for each group. (k) PINK1 silencing was detected in HeLa: GFP-PRKN cells by immunoblotting. Asterisk indicates a non-specific band.
Loss of MIEF1 drove mitophagy via the degradation of MFN2 and FIS1
Mechanistically, PRKN and ubiquitin accumulation during mitophagy serves for the degradation of the OMM proteins, including MFN1, MFN2 and VDAC1 [Citation40,Citation58]. Given the modulation of MIEF1 on PRKN recruitment and mitophagy, we sought to investigate the levels of OMM proteins in MIEF1-depleted cells. Notably, selective reductions of MFN2 and FIS1 were facilitated by MIEF1 loss, following short exposure to CCCP treatment, but not in control or MIEF2 knockdown cells (). However, the addition of a proteasome inhibitor, MG132, prevented the degradation of MFN2 and FIS1 sensitized by MIEF1 deficiency. In contrast, no effect of autophagy inhibitor chloroquine (CQ) was observed (), indicating that at the early stage (CCCP treatment for 1.5 h), MIEF1 depletion resulted in rapid degradation of MFN2 and FIS1 via the UPS. To address this issue further, we enriched the level of Flag-tagged MFN2 or FIS1 in MIEF1-deficient cells and found a greatly burst of ubiquitination at the early phase of CCCP-induced PRKN translocation ( and Fig. S6A). Moreover, MG132 was able to abolish PRKN recruitment at the early stage (CCCP treatment for 1.5 h) and mitophagy at the late step (CCCP treatment for 16 h), in MIEF1 siRNA-treated cells (Fig. S6B-D), revealing the close relationship between the UPS and mitophagy, which is likely dependent on the degradation of MFN2 and FIS1.
Figure 7. MIEF1 regulates PINK1-PRKN-mediated mitophagy via MFN2 and FIS1. (a) HeLa cells stably expressing GFP-PRKN were transfected with the indicated siRNA for 70 h. Cells were then treated with DMSO or 5 µM CCCP for 1.5 h, followed by immunoblotting analysis of mitochondrial proteins. Asterisks indicate non-specific bands. (b and c) The average levels of the MFN2 (b) or FIS1 (c) were normalized to the level of TOMM20, presented with SD indicated by error bars from 3 independent experiments as in (a). *P < 0.05, **P < 0.01, NS, not significant. (d) HeLa cells stably expressing GFP-PRKN were transfected with the indicated siRNA for 70 h. Cells were treated with 5 µM CCCP, applied for 1.5 h. MG132 or CQ was added 4 h prior and with CCCP. Whole-cell lysates were immunoblotted. (e and f) The average levels of the MFN2 (e) or FIS1 (f) were normalized to the level of TOMM20. Error bars indicate SD from 3 independent experiments as in (d). **P < 0.01, NS, not significant. (g and h) HeLa cells stably expressing GFP-PRKN were transfected with control or MIEF1 siRNA for 24 h. Flag-tagged vector or Mfn2 (g), Flag-tagged vector or FIS1 (h) was transiently transfected into cells for further 24 h. Co-IP using anti-Flag beads was performed following CCCP treatment in the presence of MG132 for 1.5 h. Cell lysates and co-IP products were subjected to SDS-PAGE and detected by immunoblotting. (i and j) HeLa cells were transfected with the indicated plasmids. After 24 h, cells were treated with 5 µM CCCP for further 1.5 h, extracted and subjected to co-IP using anti-Flag beads followed by immunoblotting. (k) HeLa cells stably expressing GFP-PRKN (green) were transfected with control, FIS1 or MFN2 siRNA for 24 h and then transfected with control or MIEF1 siRNA for further 24 h. Cells were treated with DMSO or 10 µM CCCP for 16 h, hereafter fixed and immunostained for TOMM20 (red) and TIMM23 (cyan). Hoechst, blue. Scale bar: 10 µm. Cells displayed with asterisks indicate mitophagic cells. (l) FIS1 and MFN2 silencing of (k) was detected in HeLa cells stably expressing GFP-PRKN by immunoblotting. (m) PRKN-mediated mitophagy shown as in (k) was quantified. Data represent mean ± SD. ***P < 0.001, NS, not significant. n > 150 cells for each group from 3 independent experiments.
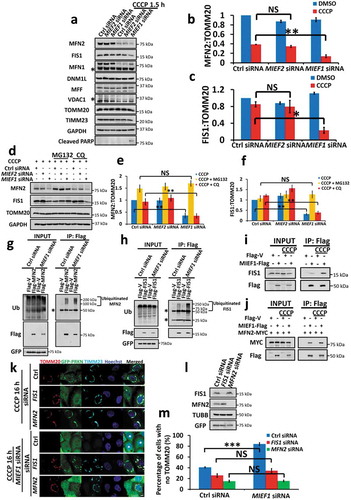
Then we considered the specific regulation of MIEF1 on MFN2 and FIS1. MIEF1, but not MIEF2, was found to specifically interacts with endogenous FIS1 by immunoprecipitation (Fig. S6E). Moreover, short exposure to CCCP treatment (1.5 h) resulted in a marked increase in bindings between MIEF1 and FIS1 ( and Fig. S6F), as well as between MIEF1 and MFN2 ( and Fig. S6G). However, no apparent change in the association of MIEF1 and MFN1 was observed in the presence of CCCP (Fig. S6H and I). When we turned to silence FIS1 and MFN2, the sensitivity to mitophagy induced by MIEF1 deficiency was severely abrogated from 83.9 ± 2.5% to 34.4 ± 4.0% or 15.5 ± 1.5%, respectively (). Conceivably, the quantitative ratiometric measurement of mt-mKeima assay additionally showed that MFN2 deficiency led to significantly decreased mitophagic cells with a proportion from 91.15 ± 1.76%, coupled with MIEF1 loss, to 49.73 ± 9.0% upon 16 h treatment of CCCP at 10 µM (Fig. S7), further demonstrating that the regulation of FIS1 and MFN2 mediated by UPS pathway is preliminary for mitophagy.
Interestingly, MFN2 has been described as a mitochondria-ER tether [Citation59]. Mechanistically, reduction in mitochondria-ER contacts by the loss of MFN2 promotes mitophagy, given by the mt-mKeima assay of U2OS cells at 20 µM CCCP for 4 h. Nevertheless, our results indicate that MFN2 is critical for mitophagy in which the depletion of MFN2 abrogates mitophagy at 10 µM CCCP for 16 h (). To address this discrepancy, we reasoned that there would exist a specific response implicated by MFN2, adapting to different stages of mitophagy. As expected, we indeed observed distinctive regulation of MFN2 on the progression of PINK1-PRKN-dependent mitophagy (Fig. S7). At early onset of mitophagy (10 µM CCCP for 2 h), the ratio of mitophagy was enhanced from 6.59 ± 0.7% in cells transfected with control siRNA to 22.0 ± 3.5% in MFN2 siRNA treated cells, substantiating the function of MFN2 as mitochondria-ER tether in the early phase of PINK1-PRKN-mediated mitophagy [Citation59]. On contrary, at the late stage of PINK1-PRKN-dependent mitophagy (10 µM CCCP for 16 h), MFN2 deficiency robustly abrogated the population of cells with acidified mt-mKeima, comparing with cells transfected with control siRNA (reduced from 65.18 ± 3.72% to 44.74 ± 5.08%) or cells silenced by MIEF1 (decreased from 91.15 ± 1.76% to 49.73 ± 9.0%), concordant with our observations using immunofluorescence (). These data demonstrate that MFN2 may play important roles in alternative pathways during the progressing of mitophagy. Taken together, our results strongly suggest that, the ubiquitination and degradation of MFN2 and FIS1 via the UPS, which is sensitized by MIEF1 loss, enables mitochondrial elimination.
Deficiency of MIEF1 impairs mitochondrial respiration, coupled with accumulation of mitochondrial ROS
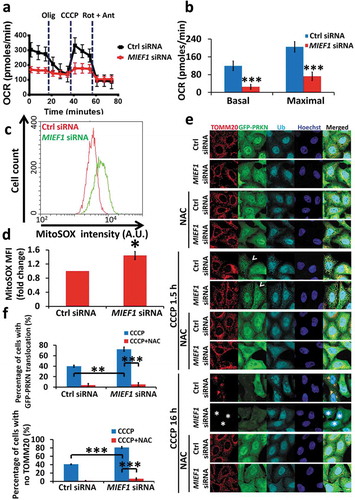
Given the effect of MIEF1 loss on PINK1-PRKN-mediated mitophagy, we next determined the effect of MIEF1 depletion on mitochondrial dysfunction. Transfection of MIEF1 siRNA into HeLa cells resulted in aberrant mitochondrial metabolism as evidenced by dramatic reductions of basal and maximal oxygen consumption rate (OCR) (). Oxidative stress is thought to be the key integrating mitochondrial defects and mitophagy [Citation60,Citation61]. Hereby we posited the possibility that MIEF1 loss may trigger the overproduction of mitochondrial ROS, which subsequently prime cells to PINK1-PRKN-mediated mitophagy. Using MitoSOX to measure mitochondrial ROS, we observed a 0.44 ± 0.11-fold increase in ROS production upon knocking down MIEF1 in HeLa cells stably expressing HA-PRKN (). To verify the impact of mitochondrial ROS due to MIEF1 loss on PINK1-PRKN-mediated mitophagy, we applied the ROS scavenger N-acetyl-L-cysteine (NAC), a well-known antioxidant, to assess the progression of mitophagy [Citation62,Citation63]. In the presence of NAC in HeLa:GFP-PRKN cells, both PRKN translocation (CCCP treatment for 1.5 h) and mitophagy (CCCP treatment for 16 h) upon MIEF1 silencing were profoundly diminished (), revealing that mitochondrial oxidative stress, arising from MIEF1 loss, facilitates PINK1-PRKN-dependent clearance of depolarized mitochondria.
Figure 8. Lack of MIEF1 leads to mitochondrial respiration dysfunction and accumulated mitochondrial ROS. (a) Representative oxygen consumption rate (OCR) over time is shown of HeLa cells transfected with control or MIEF1 siRNA for 72 h. Oligomycin at 1 µM, CCCP at 0.5 µM, rotenone at 1 µM plus antimycin A at 1 µM, respectively, were injected at the indicated time. (b) Compiled analyses of basal and maximal OCR are shown. Error bars indicate SD. ***P < 0.001. n = 8 for each group from 3 independent experiments. (c) HeLa cells stably expressing HA-PRKN were transfected with control or MIEF1 siRNA for 72 h. Cells were stained with MitoSOX Red dye and subjected to FACS analysis. Histograms of cell counts versus MitoSOX Red fluorescence are shown. (d) Quantification of MitoSOX mean fluorescence intensity (MFI) from 3 experiments as in (c). Error bars indicate SD. *P < 0.05. (e) HeLa cells stably expressing GFP-PRKN were transfected with control or MIEF1 siRNA for 48 h. Cells were pre-treated with DMSO or 2 mM NAC for 4 h, followed by CCCP treatment with or without NAC for further 1.5 h or 16 h. Cells were fixed and stained against TOMM20 (red) and Ubiquitin (cyan). Hoechst, blue. Scale bar: 10 µm. Arrowheads indicate PRKN translocation. Cells displayed with asterisks indicate mitophagic cells. (f) Quantification of PRKN translocation at 1.5 h or mitophagy at 16 h following CCCP treatment. Data are from 3 independent experiments of (e). Error bars indicate SD. **P < 0.01, ***P < 0.001.
Given the activation of the cleavage of PARP we observed in HeLa cells stably expressing GFP-PRKN associated with MIEF1 silencing (), it is tempting for us to examine the role of NAC in PINK1-PRKN-dependent cell death at the early onset of mitophagy (Fig. S8A and B). Of note, NAC significantly inhibited cell death, albeit which could be sensitized by MIEF1 deficiency, relying on PRKN. We next attempted to address whether the accumulation of mitochondrial ROS accounts for BAX-mediated apoptosis. Surprisingly, unlike HeLa cells stably expressing HA-PRKN (), the mitochondrial ROS of HeLa cells devoid of PRKN, was not observed to increase by MIEF1 loss (Fig. S8C). Correspondingly, neither BAX translocation nor the cleavage of PARP, sensitized by MIEF1 deficiency, was ablated by NAC (Fig. S8D-G), substantiating the notion that mitochondrial oxidative stress by MIEF1 loss is permissive in PRKN-specific manner and selectively contributes to PINK1-PRKN-dependent mitophagy.
Discussion
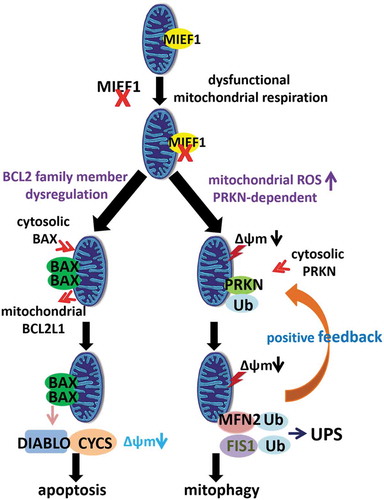
Our current study clarifies the precise and specific roles of MIEF1 concerning mitochondria-associated processes, including mitochondria-dependent apoptosis and PINK1-PRKN-mediated mitophagy (). Our observation that the intrinsic apoptotic stimulus STS induced UPS-dependent degradation of MIEF1 motivates us to investigate the function of MIEF1 in apoptosis. Of note, previous studies have reported perplexing results for MIEF1 in cell death. Overexpression of MIEF1 was reported to lead to a decrease of PARP cleavage in response to STS treatment, while conversely, RNAi-mediated silencing of MIEF1 increases apoptosis [Citation50]. However, an independent study claimed that mief1 and mief2 DKO cells are resistant to intrinsic apoptosis via mitochondrial cristae remodelling, dependent on DNM1L [Citation53]. Here we characterize the specific autonomous regulation by MIEF1 on BAX-mediated cell death, which we find is independent of DNM1L-mediated mitochondrial fission and not observed for MIEF2. Interestingly, depletion of MIEF1 promotes BCL2L1 dissociation from mitochondria, which in turn facilitates the recruitment of cytosolic BAX onto mitochondria, whereby excessive BAX is available. Consequently, accumulated BAX in the absence of MIEF1 initiates MOMP, releasing CYCS and DIABLO to activate caspases for apoptosis progression. The reasonable interpretations of controversial outcomes between our findings here using siRNA versus mief1 and mief2 DKO cells may result from distinct methods used to induce apoptosis. We investigated the localization of overexpressed GFP-BAX without ectopic stimulus, whereas the effect of mief1 and mief2 DKO on mitochondrial cristae structure was examined responding to intrinsic apoptotic stimulus, in particular, actinomycin D at high dose [Citation53]. Moreover, the bona fide effect of MIEF2 on apoptosis is largely elusive and it is possible that the combinatory functions of MIEF2 and MIEF1 are distinct from MIEF1 itself. Clearly, more needs to be learned about the complicated mechanism integrating mitochondrial dynamics and BAX-mediated apoptosis in the absence of exogenous stressors.
Figure 9. Hypothetical model of MIEF1 governing cellular homeostasis via BAX-mediated cell death and PINK1-PRKN-dependent mitophagy.
Accompanying our findings that lack of MIEF1 impairs mitochondrial respiration, we elaborate that loss of MIEF1 autonomously triggered mitochondrial oxidative stress in a PRKN-specific route, preferentially favouring PINK1-PRKN-mediated mitochondrial elimination by autophagy. Although it was reported that the downregulation of MIEF1 by RNA interfering in COS7 cells inhibits PINK1-PRKN-dependent mitophagy [Citation64], the discrepancy in between could possibly stem from specific responses between distinct cell types. Furthermore, our conclusion that mitophagy was provoked by MIEF1 loss in HeLa cells stably expressing GFP-PRKN upon CCCP treatment, is complementary with analyses applied with additional mitochondrial toxins including OA and valinomycin, whereas the clearance of CCCP-mediated depolarized mitochondria, was specifically studied in COS7 cells from the previous study. Alternatively, ‘overproducing PRKN’ in COS7 cells was performed by transient transfection [Citation64]. However, in comparison with our data performed in HeLa cells stably expressing PRKN, the differential levels of PRKN could also possibly account for the incongruency.
In the current study we propose a model in which MIEF1 regulates PRKN recruitment onto depolarized mitochondria and governs the ubiquitination and degradation of MFN2 and FIS1 for mitophagy. We show that MIEF1 loss, specifically, initiates PRKN translocation following short-term exposure to CCCP, and further accelerates the degradation of MFN2 and FIS1 through the UPS pathway, positively regulating mitochondrial elimination. In contrast, a high level of MIEF1 governs the recruitment of PRKN, and protects the clearance of mitochondrial proteins, most likely via direct physiological interactions between MIEF1 and MFN2, or MIEF1 and FIS1, upon decreased mitochondrial membrane potential. Thus, we demonstrate that the level of MIEF1, but not MIEF2, is critical for the feed-forward mechanism of PINK1-PRKN-mediated mitophagy.
The notion that MFN2, as a mitochondria-ER tether, negatively regulates PINK1-PRKN-mediated mitophagy, has been revealed [Citation59]. Although a large body of work has elucidated the mechanistic details of PINK1-PRKN-mediated mitophagy in response to CCCP-induced depolarization [Citation35–Citation37,Citation40], it has been an open question whether cells respond differentially during distinct stages of mitophagy progressing. Strikingly, to our knowledge, our findings here, for the first time, provide an additional understanding of MFN2 in differentially regulating PINK1-PRKN-mediated mitophagy at the early versus late stages. Our results support that MFN2, at the early onset of mitochondrial depolarization, gates mitophagy through governing mitochondria-ER tether [Citation59]. Furthermore, we uncovered that, MFN2, at the late stage of CCCP treatment, is vital for mitophagy. Particularly, the degradation of MFN2 via the UPS pathway drives mitophagy. Notably, the turnover of MFN2 is primed by MIEF1 loss, suggesting the pivotal function of MIEF1 on PINK1-PRKN-mediated mitophagy.
In addition, with a respect to the role of FIS1 in mitophagy, our observation corelates with previous findings of FIS1 on PINK1-PRKN-dependent mitophagy, in which low levels of FIS1 abrogates mitophagy [Citation44,Citation65]. However, in our study, the UPS-mediated regulation of FIS1 is highly pronounced, shedding light on additional layer of understanding on mitophagy. To a rough approximation, it has been proposed that mitochondrial fission favours mitophagy, which requires reduced size of mitochondria suitable for autophagosomal engulfment. In contrast, mitochondrial elongation protects cells to escape from mitophagy [Citation66,Citation67]. However, in regard of this issue, here we illustrate that sensitization of MIEF1 deficiency to the PINK1-PRKN-mediated mitophagic route is likely to be independent on mitochondrial dynamics, based on that similar effects were not observed when we silenced MIEF2 or DNM1L. Moreover, fused mitochondria are indeed apparent in MIEF1-depleted cells. Our data therefore support the proposition that MIEF1 regulates mitochondrial quality control in a pathway distinct from its role on mitochondrial morphology. Greater insights into how the turnover of MFN2 and FIS1, but not other OMM proteins, contributes to the progression of mitophagy, need to be further addressed.
To summarize, our study uncovers the importance of MIEF1 as a bridging player integrating BAX-mediated cell death and PINK1-PRKN-dependent mitophagy by switching on distinct responsive mechanisms (). As a gatekeeper of mitochondrial homeostasis, MIEF1 governs and protects mitochondria from commitment to apoptosis or mitophagy. The unexpected roles of M1EF1 on mitochondrial homeostasis exemplify a further understanding of cellular responses over and above mitochondrial dynamics. Of note, MIEF1 may work by several mechanisms, through inducing mitochondrial dysfunction or interacting with specific OMM proteins, such as BCL2L1 and FIS1, but evidence for a unifying mechanism explaining all the known effects of MIEF1 still needs to be further established, including the precise role of MIEF1 at the intersection of apoptosis and mitophagy. Therefore, our illustration here about the roles of MIEF1 on both cell death and mitophagy is likely to stimulate a better prospect linking these two. Greater insights into the impacts among OMM proteins on fine-tuning mitochondrial behaviors will allow for a better understanding of mitochondrial homeostasis. Further studies of how the dysregulation of MIEF1 in cell death or PINK1-PRKN-mediated mitophagy paradigm is implicated in disease pathologies, such as cancer and neurodegenerative diseases, remain to be clarified.
Materials and methods
Antibodies
Anti-BAK1 (Sigma-Aldrich, B5897), anti-BAX (Santa Cruz Biotechnology, sc-493), anti-BCL2 (Santa Cruz Biotechnology, sc-7382), anti-BCL2L1 (Santa Cruz Biotechnology, sc-8392), anti-cleaved CASP7 (Asp198, D6H1; Cell Signalling Technology, 8438), anti-cleaved PARP (Asp214, D64H10; Cell Signalling Technology, 5625), anti-CYCS (BD Bioscience, 556433), anti-DIABLO (Abcam, ab32023), anti-DNM1L (BD BioScience, 611112), anti-FIS1 (GeneTex, 111010), anti-FLAG (Sigma-Aldrich, F3165), anti-GAPDH (Santa Cruz Biotechnology, sc-47724), anti-GFP (Santa Cruz Biotechnology, sc-9996), anti-HSPD1 (Santa Cruz Biotechnology, sc-1052), anti-MFF (Abcam, 139026), anti-MFN1 (Santa Cruz Biotechnology, sc-50330), anti-MFN2 (Santa Cruz Biotechnology, sc-100560), anti-MIEF1 (Proteintech, 20164–1-AP), anti-MIEF2 (Proteintech, 16413–1-AP), anti-MT-CO2 (Abcam, ab79393), anti-MYC (Sigma Aldrich, C3956), anti-p-BCL2 (Ser 87; Santa Cruz Biotechnology, sc-16323-R), anti-TIMM23 (BD BioScience, 611222), anti-TOMM20 (Santa Cruz Biotechnology, sc-17764), anti-TUBB (Sigma-Aldrich, T2200), anti-Ubiquitin (Santa Cruz Biotechnology, sc-8017) and anti-VDAC1 (Santa Cruz Biotechnology, sc-8828).
Plasmids
Mief2-MYC (Mus musculus; 4596, David Chan’s lab) and Mief1-MYC (Mus musculus; 44598, David Chan’s lab) were purchased from Addgene. MIEF1-GFP was kindly provided by Dr. Michael T. Ryan (Monash University, Australia) and then subcloned into the c-Flag pcDNA3 vector (Addgene, 20011, Stephen Smale’s lab). MYC-BAX, MYC-BCL2L1, MYC-DNM1LK38A, Mfn1-MYC and Mfn2-MYC were kindly provided by Dr. Victor Chun-Kong Yu (National University of Singapore, Singapore) and then subcloned into Flag-pXJ 40, mCherry-pXJ40 or GFP-pXJ40 vectors (kind gifts from Dr. Low Boon Chuan, National University of Singapore, Singapore). GFP-PRKN was kindly provided by Dr. Kah-Leong Lim (National University of Singapore, Singapore) and subcloned into MYC-pXJ 40 (A kind gift from Dr. Low Boon Chuan, National University of Singapore, Singapore).
RNA interference
Oligonucleotides for siRNA were synthesized by Sigma-Aldrich.
Control siRNA: 5ʹ -UUCUCCGAACGUGUCACGU- 3ʹ; DNM1L siRNA: 5ʹ – UUCAAUCCGUGAUGAGUAUGCUUUUCUUC – 3ʹ; FIS1 siRNA: 5ʹ -AACGAGCUGGUGUCUGUGGAG- 3ʹ; MFF siRNA: 5ʹ -AACGCUGACCUGAACAAGGA- 3ʹ; MFN1 siRNA: 5ʹ -CUUCCUAAGUGUUGAAGGA- 3ʹ; MFN2 siRNA: 5ʹ – GUGAUGUGGCCCAACUCUA- 3ʹ; MIEF1 siRNA #1: 5ʹ – GCCAAGCAAGCUGCUGUGGACAUAU- 3ʹ; MIEF1 siRNA #2: 5ʹ – GAGAAACUUCUUACUUACUACCGGA- 3ʹ; MIEF2 siRNA: 5ʹ – ACUUUCGGAGCAAGUUCCCGGAACU- 3ʹ; PINK1 siRNA: 5ʹ -GACGCUGUUCCUCGUUAUGAA- 3ʹ.
Cell culture, transfection and treatments
HeLa (ATCC® CCL-2™) and HEK 293T cells (ATCC® CRL-11268™) were purchased from ATCC. HeLa cells stably expressing GFP-PRKN HeLa cells were kindly provided by Dr. Kah-Leong Lim (National University of Singapore, Singapore). HeLa cells stably expressing HA-PRKN was a kind gift from Dr. Bin Xiao of Dr. Eng-King Tan’s group (National Neuroscience Institute, Singapore). HeLa cells stably expressing YFP-PRKN and mt-mKeima were kindly supported by Dr. Richard J. Youle (Biochemistry Section, Surgical Neurology Branch, National Institute of Neurological, USA). Dulbecco’s Modified Eagle Medium (DMEM) (Sigma-Aldrich, D5648) supplemented with 10% (v:v) foetal bovine serum (FBS) (GE Healthcare Hyclone, SV30160.03) was used to culture cells at 37°C under 5% CO2.
Lipofectamine 2000TM (Thermo Fisher Scientific, 11668019) and polyethylenimine (PEI; Sigma-Aldrich, 408727) methods were used to transfect siRNA or plasmids into HeLa cells at 70% confluence, according to the manufacturer’s instructions.
Staurosporine (Sigma-Aldrich, S6942), actinomycin D (Thermo Fisher Scientific, 11–805-017), CCCP (Sigma-Aldrich, C2759), CHX (Sigma-Aldrich, C7698), oligomycin (Merck Millipore, 495455), antimycin A (Sigma-Aldrich, A1410), valinomycin (Sigma-Aldrich, V0627), Q-VD-OPH (Sigma-Aldrich, SML0063) and PI (Thermo Fisher Scientific, BMS500PI) were used at the indicated doses. MitoTracker Red CMXRos (Thermo Fisher Scientific, M7512) was used at a final concentration of 100 nM. TMRM (tetramethylrhodamine; Thermo Fisher Scientific, T668) was used at a final concentration of 100 nM. MitoSOXTM (Thermo Fisher Scientific, M36008) was used at a final dose of 5 µM. BMH (Thermo Fisher Scientific, 22330) was used at a final concentration of 2 mM. For PRKN translocation studies, CCCP was used at a final dose of 5 µM for 1.5 h, whereas for mitophagy determination, CCCP was used at 10 µM for 16 h.
Immunoblotting and immunoprecipitation
Cells were collected and lysed in RIPA buffer (50 mM HEPES [1st BASE, BIO-1825], pH 7.4, 150 mM NaCl [1st BASE, BIO-1110], 1% NP-40 [Sigma-Aldrich, 74385], 0.1% SDS [1st BASE, BIO-2050], 0.25% sodium deoxycholate [Fluka, 30970], 1 mM EDTA [1st BASE, BIO-1050], supplemented with protease inhibitors, including 10 μg/ml aprotinin [Thermo Fisher Scientific, 78432], 1 mM phenylmethylsulfonyl fluoride [Sigma-Aldrich, P7626], 1 μM pepstatin A [MP Biomedicals, 0219536880], and 10 μM leupeptin [MERCK Millipore, E18]). Samples were boiled with buffer containing SDS at 95°C for 10 min and subsequently separated by SDS–PAGE and immunoblotted. Images were taken using Amersham Imager 600 (GE Healthcare Life Sciences, Singapore).
For immunoprecipitation, cells were transiently transfected with the indicated plasmids using the polyethylenimine (PEI) method for 24 h. Cells were collected and lysed in 1 ml NP-40 lysis buffer (50 mM Tris-HCl [1st BASE, BIO-1500], pH 7.4, 150 mM NaCl, 10 mM sodium pyrophosphate [1st BASE, BIO-1542], 2 mM EDTA and 5% NP-40, supplemented with protease inhibitors, including 10 μg/ml aprotinin, 1 mM phenylmethylsulfonyl fluoride, 1 μM pepstatin A, and 10 μM leupeptin) on ice for 10 min and centrifuged at 21,130 × g for 20 min at 4°C. FLAG M2 beads (Sigma-Aldrich, A2220) were incubated with the clarified lysates at 4°C for 3 h. After incubation, immune-complexes were washed 3 times with NP-40 lysis buffer and the bead-conjugated proteins were denatured in 2 × SDS loading buffer for 15 min at 95°C. Samples were then separated by SDS-PAGE and detected by immunoblotting.
Subcellular fractionation
For the extraction of mitochondrial membranes, cells cultured in 10 cm dishes were washed with PBS (137 mM NaCl, 2.7 mM KCl [1st BASE, BIO-1300], 8 mM Na2HPO4 [1st BASE, BIO-1540], and 2 mM KH2PO4 [1st BASE, BIO-1200]), and collected using pre-chilled mitochondrial extraction buffer 1 (220 mM D-Mannitol [Sigma-Aldrich, M4125], 70 mM sucrose [1st BASE, BIO-1090], 20 mM HEPES-KOH [Sigma-Aldrich, P5958], pH 7.5, 1 mM EDTA, 0.5 mM phenylmethylsulfonyl fluoride, 2 mg/ml BSA [Sigma-Aldrich, A2153], supplemented with protease inhibitors including 10 μg/ml aprotinin, 1 μM pepstatin A, and 10 μM leupeptin). Cells were passed through a 25-G syringe 20 times on ice. The homogenised cells were centrifuged at 1,000 × g for 15 min at 4°C. The supernatant was further centrifuged at 10,000 × g for another 10 min at 4°C to pellet the mitochondria. The supernatant fraction was retained as the cytosolic fraction. The mitochondrial pellets were resuspended in RIPA buffer, and then subjected to SDS-PAGE and immunoblotting [Citation68].
Immunofluorescence, fluorescence microscopy, and microscope image acquisition
4% Paraformaldehyde (Sigma-Aldrich, P6148) in PBS was used to fix cells at room temperature for 10 min, hereafter cells were washed with PBS for 3 times, permeabilized, and blocked in 3% BSA in PBS containing 0.2% Triton X-100 (Sigma-Aldrich, X100) for 1 h. Primary antibodies were diluted in 3% BSA for overnight incubation. Cells were washed with PBS and subsequently incubated with Alexa Fluor–conjugated secondary antibodies (Thermo Fisher Scientific, Alexa Fluor® 488, A-11001 or A-11034; Alexa Fluor® 568, A-11004 or A-11011; Alexa Fluor® 633, A-21052 or A-21071). Nucleus was labelled with Hoechst 33342 (Thermo Fisher Scientific, H3570) at room temperature for 10 min. Coverslips were then mounted onto glass slides using FluorSaveTM (Calbiochem, 345789–20).
Confocal images were captured via a laser scanning confocal microscope (Olympus FV3000, Center of BioImaging Sciences, National University of Singapore) through a 63 ×, 1.4 NA objective lens or a spinning disc microscope (VolocityTM [PerkinElmer], Center of BioImaging Sciences, National University of Singapore) through a 100 ×, 1.4 NA objective lens using excitation wavelengths at 405, 488, 561, or 640 nm. Live-cell imaging was conducted in a chamber at 37°C with 5% CO2.
Flow cytometry analysis
Cells were pre-treated with 10 nM TMRM or 5 µM MitoSOXTM for 15 min, after which cells were trypsinized and resuspended in PBS. Flow cytometry was performed using BD LSR Fortessa or Cytoflex LX (Yong Loo Lin School of Medicine, National University of Singapore), and results were analyzed using SummitTM 4.3 or CytExpert 2.1, respectively. 10,000 events were recorded for each experiment and results shown are representative of 3 independent experiments.
For PI labelling, floating and attached cells were harvested following STS treatment, washed with PBS, and fixed in 70% ethanol (Sigma-Aldrich, 16368) at −20°C for 1 h. DNA was stained with 50 μg/ml PI in PBS containing 100 μg/ml RNaseA (Thermo Fisher Scientific, EN0531). Flow cytometry was performed using BD LSR Fortessa or Cytoflex LX and the results were analyzed with Summit 4.3 or CyExpert. 10,000 events were recorded for each experiment and results shown are representative of 3 independent experiments.
For the mt-mKeima-based mitophagy assay, HeLa cells stably expressing mt-mKeima and YFP-PRKN were transfected with control or MIEF1 siRNA for 48 h. Cells were further treated with CCCP as indicated. Cells were harvested and analyzed for flow cytometry refereeing to previous reports [Citation46,Citation69].
Seahorse analysis
Oxygen consumption rate (OCR) was measured using Seahorse XF96 equipment (Seahorse Bioscience Inc., Institute of Molecular and Cell Biology, Singapore). HeLa cells (25,000 per well) were seeded 24 h prior to measurement. Cell plates were equilibrated in a non-CO2 incubator at 37°C for 1 h. Oligomycin (1 µM; Agilent, 103015–100), CCCP (0.5 µM; Sigma-Aldrich, C2759), rotenone (1 µM; Agilent, 103015–100) and antimycin (1 µM; Agilent, 103015–100) were subsequently injected into cells at the indicated time points.
Statistical analysis
For quantification, values were obtained from 3 independent experiments, shown as mean ± SD. Statistical data were processed in GraphPad Prism software or Excel. Analyses were calculated using the two-sided unpaired Student’s t test. *P < 0.05, **P < 0.01 and ***P < 0.001 were considered significant.
Supplemental Material
Download MS Word (5.7 MB)Acknowledgments
We thank all members of Y.-C.L. laboratory for valuable discussion. We would like to thank the Center of BioImaging Sciences (CBIS) at National University of Singapore for technical support. We are particularly grateful for several plasmids and cell line from Dr. Kah-Leong Lim (National University of Singapore, Singapore). We thank Dr. Victor Chun-Kong Yu (National University of Singapore, Singapore) for several plasmids. We thank the help of Dr. Boon Seng SOH’s group (Institute of Molecular and Cell Biology, Singapore) for the Seahorse assay. We appreciate Dr. David C. Chan (California Institute of Technology, USA) and Dr. Richard J. Youle (Biochemistry Section, Surgical Neurology Branch, National Institute of Neurological, USA) for their insightful perspectives on this project. Additionally, we are grateful for Dr. Kerry McLaughlin for helping edit this manuscript. This work is financially supported by grants MOE Tier 2 (MOE2017-T2-1-131) and Tier 1 (R-154-000-A15-114) from the Ministry of Education, Singapore to Y.-C.L.
Disclosure statement
No potential conflict of interest was reported by the authors.
Supplementary Material
Supplemental data for this article can be accessed here.
Additional information
Funding
Related Research Data
References
- Chan DC. Fusion and fission: interlinked processes critical for mitochondrial health. Annu Rev Genet. 2012;46:265–287.
- Youle RJ, van der Bliek AM. Mitochondrial fission, fusion, and stress. Science. 2012;337(6098):1062–1065.
- Shutt TE, McBride HM. Staying cool in difficult times: mitochondrial dynamics, quality control and the stress response. Biochim Biophys Acta. 2013;1833(2):417–424.
- Liu X, Kim CN, Yang J, et al. Induction of apoptotic program in cell-free extracts: requirement for dATP and cytochrome c. Cell. 1996;86(1):147–157.
- Sorrentino G, Mioni M, Giorgi C, et al. The prolyl-isomerase Pin1 activates the mitochondrial death program of p53. Cell Death Differ. 2013;20(2):198–208.
- Ellis HM, Horvitz HR. Genetic control of programmed cell death in the nematode C. elegans. Cell. 1986;44(6):817–829.
- Hengartner MO, Horvitz HR. C. elegans cell survival gene ced-9 encodes a functional homolog of the mammalian proto-oncogene bcl-2. Cell. 1994;76(4):665–676.
- Yuan J, Shaham S, Ledoux S, et al. The C. elegans cell death gene ced-3 encodes a protein similar to mammalian interleukin-1 beta-converting enzyme. Cell. 1993;75(4):641–652.
- Brown JM, Attardi LD. The role of apoptosis in cancer development and treatment response. Nat Rev Cancer. 2005;5(3):231–237.
- Honig LS, Rosenberg RN. Apoptosis and neurologic disease. Am J Med. 2000;108(4):317–330.
- Hockenbery D, Nuñez G, Milliman C, et al. Bcl-2 is an inner mitochondrial membrane protein that blocks programmed cell death. Nature. 1990;348(6299):334–336.
- Brunelle JK, Letai A. Control of mitochondrial apoptosis by the Bcl-2 family. J Cell Sci. 2009;122(Pt 4):437–441.
- Gross A, Jockel J, Wei MC, et al. Enforced dimerization of BAX results in its translocation, mitochondrial dysfunction and apoptosis. Embo J. 1998;17(14):3878–3885.
- Wei MC, Zong WX, Cheng EH, et al. Proapoptotic BAX and BAK: a requisite gateway to mitochondrial dysfunction and death. Science. 2001;292(5517):727–730.
- Zou H, Henzel WJ, Liu X, et al. Apaf-1, a human protein homologous to C. elegans CED-4, participates in cytochrome c-dependent activation of caspase-3. Cell. 1997;90(3):405–413.
- Li P, Nijhawan D, Budihardjo I, et al. Cytochrome c and dATP-dependent formation of Apaf-1/caspase-9 complex initiates an apoptotic protease cascade. Cell. 1997;91(4):479–489.
- Santel A, Fuller MT. Control of mitochondrial morphology by a human mitofusin. J Cell Sci. 2001;114(Pt 5):867–874.
- Hermann GJ, Thatcher JW, Mills JP, et al. Mitochondrial fusion in yeast requires the transmembrane GTPase Fzo1p. J Cell Biol. 1998;143(2):359–373.
- Mozdy AD, McCaffery JM, Shaw JM. Dnm1p GTPase-mediated mitochondrial fission is a multi-step process requiring the novel integral membrane component Fis1p. J Cell Biol. 2000;151(2):367–380.
- Wasiak S, Zunino R, McBride HM. Bax/Bak promote sumoylation of DRP1 and its stable association with mitochondria during apoptotic cell death. J Cell Biol. 2007;177(3):439–450.
- Neuspiel M, Zunino R, Gangaraju S, et al. Activated mitofusin 2 signals mitochondrial fusion, interferes with Bax activation, and reduces susceptibility to radical induced depolarization. J Biol Chem. 2005;280(26):25060–25070.
- Frank S, Gaume B, Bergmann-Leitner ES, et al. The role of dynamin-related protein 1, a mediator of mitochondrial fission, in apoptosis. Dev Cell. 2001;1(4):515–525.
- Karbowski M, Lee Y-J, Gaume B, et al. Spatial and temporal association of Bax with mitochondrial fission sites, Drp1, and Mfn2 during apoptosis. J Cell Biol. 2002;159(6):931–938.
- Cassidy-Stone A, Chipuk JE, Ingerman E, et al. Chemical inhibition of the mitochondrial division dynamin reveals its role in Bax/Bak-dependent mitochondrial outer membrane permeabilization. Dev Cell. 2008;14(2):193–204.
- Germain M, Mathai JP, McBride HM, et al. Endoplasmic reticulum BIK initiates DRP1-regulated remodelling of mitochondrial cristae during apoptosis. Embo J. 2005;24(8):1546–1556.
- Lee YJ, Jeong S-Y, Karbowski M, et al. Roles of the mammalian mitochondrial fission and fusion mediators Fis1, Drp1, and Opa1 in apoptosis. Mol Biol Cell. 2004;15(11):5001–5011.
- Parone PA, James DI, Da Cruz S, et al. Inhibiting the mitochondrial fission machinery does not prevent Bax/Bak-dependent apoptosis. Mol Cell Biol. 2006;26(20):7397–7408.
- Estaquier J, Arnoult D. Inhibiting Drp1-mediated mitochondrial fission selectively prevents the release of cytochrome c during apoptosis. Cell Death Differ. 2007;14(6):1086–1094.
- Wakabayashi J, Zhang Z, Wakabayashi N, et al. The dynamin-related GTPase Drp1 is required for embryonic and brain development in mice. J Cell Biol. 2009;186(6):805–816.
- Ishihara N, Nomura M, Jofuku A, et al. Mitochondrial fission factor Drp1 is essential for embryonic development and synapse formation in mice. Nat Cell Biol. 2009;11(8):958–966.
- Chen Q, Vazquez EJ, Moghaddas S, et al. Production of reactive oxygen species by mitochondria: central role of complex III. J Biol Chem. 2003;278(38):36027–36031.
- Kissova I, Deffieu M, Manon S, et al. Uth1p is involved in the autophagic degradation of mitochondria. J Biol Chem. 2004;279(37):39068–39074.
- Lemasters JJ. Selective mitochondrial autophagy, or mitophagy, as a targeted defense against oxidative stress, mitochondrial dysfunction, and aging. Rejuvenation Res. 2005;8(1):3–5.
- Anding AL, Baehrecke EH. Autophagy in cell life and cell death. Curr Top Dev Biol. 2015;114:67–91.
- Narendra D, Tanaka A, Suen D-F, et al. Parkin is recruited selectively to impaired mitochondria and promotes their autophagy. J Cell Biol. 2008;183(5):795–803.
- Narendra, DP, Jin SM, Tanaka A, et al. PINK1 is selectively stabilized on impaired mitochondria to activate Parkin. PLoS Biol. 2010;8(1):e1000298.
- Vives-Bauza C, Zhou C, Huang Y, et al. PINK1-dependent recruitment of Parkin to mitochondria in mitophagy. Proc Natl Acad Sci USA. 2010;107(1):378–383.
- Pickrell AM, Youle RJ. The roles of PINK1, parkin, and mitochondrial fidelity in Parkinson’s disease. Neuron. 2015;85(2):257–273.
- Okatsu K, Koyano F, Kimura M, et al. Phosphorylated ubiquitin chain is the genuine Parkin receptor. J Cell Biol. 2015;209(1):111–128.
- Tanaka A, Cleland MM, Xu S, et al. Proteasome and p97 mediate mitophagy and degradation of mitofusins induced by Parkin. J Cell Biol. 2010;191(7):1367–1380.
- Chen Y, Dorn GW 2nd. PINK1-phosphorylated mitofusin 2 is a Parkin receptor for culling damaged mitochondria. Science. 2013;340(6131):471–475.
- Narendra D, Kane LA, Hauser DN, et al. p62/SQSTM1 is required for Parkin-induced mitochondrial clustering but not mitophagy; VDAC1 is dispensable for both. Autophagy. 2010;6(8):1090–1106.
- Geisler S, Holmström KM, Skujat D, et al. PINK1/Parkin-mediated mitophagy is dependent on VDAC1 and p62/SQSTM1. Nat Cell Biol. 2010;12(2):119–131.
- Yamano K, Fogel AI, Wang C, et al. Mitochondrial Rab GAPs govern autophagosome biogenesis during mitophagy. Elife. 2014;3:e01612.
- Nezich CL, Wang C, Fogel AI, et al. MiT/TFE transcription factors are activated during mitophagy downstream of Parkin and Atg5. J Cell Biol. 2015;210(3):435–450.
- Lazarou M, Sliter DA, Kane LA, et al. The ubiquitin kinase PINK1 recruits autophagy receptors to induce mitophagy. Nature. 2015;524(7565):309–314.
- Schapira AH. Mitochondrial complex I deficiency in Parkinson’s disease. Adv Neurol. 1993;60:288–291.
- Exner N, Lutz AK, Haass C, et al. Mitochondrial dysfunction in Parkinson’s disease: molecular mechanisms and pathophysiological consequences. Embo J. 2012;31(14):3038–3062.
- Palmer CS, Osellame LD, Laine D, et al. MiD49 and MiD51, new components of the mitochondrial fission machinery. EMBO Rep. 2011;12(6):565–573.
- Zhao J, Liu T, Jin S, et al. Human MIEF1 recruits Drp1 to mitochondrial outer membranes and promotes mitochondrial fusion rather than fission. Embo J. 2011;30(14):2762–2778.
- Loson OC, Song Z, Chen H, et al. Fis1, Mff, MiD49, and MiD51 mediate Drp1 recruitment in mitochondrial fission. Mol Biol Cell. 2013;24(5):659–667.
- Palmer CS, Elgass KD, Parton RG, et al. Adaptor proteins MiD49 and MiD51 can act independently of Mff and Fis1 in Drp1 recruitment and are specific for mitochondrial fission. J Biol Chem. 2013;288(38):27584–27593.
- Otera H, Miyata N, Kuge O, et al. Drp1-dependent mitochondrial fission via MiD49/51 is essential for apoptotic cristae remodeling. J Cell Biol. 2016;212(5):531–544.
- Norbury CJ, Hickson ID. Cellular responses to DNA damage. Annu Rev Pharmacol Toxicol. 2001;41:367–401.
- Hirsch T, Marchetti P, Susin SA, et al. The apoptosis-necrosis paradox. Apoptogenic proteases activated after mitochondrial permeability transition determine the mode of cell death. Oncogene. 1997;15(13):1573–1581.
- Lindsten T, Ross AJ, King A, et al. The combined functions of proapoptotic Bcl-2 family members bak and bax are essential for normal development of multiple tissues. Mol Cell. 2000;6(6):1389–1399.
- De Chiara G, Marcocci ME, Torcia M, et al. Bcl-2 Phosphorylation by p38 MAPK: identification of target sites and biologic consequences. J Biol Chem. 2006;281(30):21353–21361.
- Sarraf SA, Raman M, Guarani-Pereira V, et al. Landscape of the PARKIN-dependent ubiquitylome in response to mitochondrial depolarization. Nature. 2013;496(7445):372–376.
- McLelland, GL, Goiran T, Yi W, et al. Mfn2 ubiquitination by PINK1/parkin gates the p97-dependent release of ER from mitochondria to drive mitophagy. Elife. 2018;7:e32866.
- Xiao B, Goh J-Y, Xiao L, et al. Reactive oxygen species trigger Parkin/PINK1 pathway-dependent mitophagy by inducing mitochondrial recruitment of Parkin. J Biol Chem. 2017;292(40):16697–16708.
- Xiao, B, Deng X, Lim GG, et al. Superoxide drives progression of Parkin/PINK1-dependent mitophagy following translocation of Parkin to mitochondria. Cell Death Dis. 2017;8(10):e3097.
- Dingley S, Chapman KA, Falk MJ. Fluorescence-activated cell sorting analysis of mitochondrial content, membrane potential, and matrix oxidant burden in human lymphoblastoid cell lines. Methods Mol Biol. 2012;837:231–239.
- Woo CC, Hsu A, Kumar AP, et al. Thymoquinone inhibits tumor growth and induces apoptosis in a breast cancer xenograft mouse model: the role of p38 MAPK and ROS. PLoS One. 2013;8(10):e75356.
- Buhlman L, Damiano M, Bertolin G, et al. Functional interplay between Parkin and Drp1 in mitochondrial fission and clearance. Biochim Biophys Acta. 2014;1843(9):2012–2026.
- Rojansky R, Cha MY, Chan DC. Elimination of paternal mitochondria in mouse embryos occurs through autophagic degradation dependent on PARKIN and MUL1. Elife. 2016;5.
- Nowikovsky K, Reipert S, Devenish RJ, et al. Mdm38 protein depletion causes loss of mitochondrial K+/H+ exchange activity, osmotic swelling and mitophagy. Cell Death Differ. 2007;14(9):1647–1656.
- Twig G, Elorza A, Molina AJA, et al. Fission and selective fusion govern mitochondrial segregation and elimination by autophagy. Embo J. 2008;27(2):433–446.
- Xiao L, Xian H, Lee KY, et al. Death-associated protein 3 regulates mitochondrial-encoded protein synthesis and mitochondrial dynamics. J Biol Chem. 2015;290(41):24961–24974.
- Yamano, K, Wang C, Sarraf SA, et al. Endosomal Rab cycles regulate Parkin-mediated mitophagy. Elife. 2018;7:e31326