
ABSTRACT
GBM (glioblastoma multiforme) is the most common and aggressive brain tumor with no curative options available. Therefore, it is imperative to develop novel potent therapeutic drugs for GBM treatment. Here, we show that regorafenib, an oral multi-kinase inhibitor, exhibits superior therapeutic efficacy over temozolomide, the first-line chemotherapeutic agent for GBM treatment both in vitro and in vivo. Mechanistically, regorafenib directly stabilizes PSAT1 (phosphoserine aminotransferase 1), a critical enzyme for serine synthesis, to trigger PRKAA-dependent autophagy initiation and inhibit RAB11A-mediated autophagosome-lysosome fusion, resulting in lethal autophagy arrest in GBM cells. Maintenance of PSAT1 at a high level is essential for regorafenib-induced GBM suppression. Together, our data provide novel mechanistic insights of regorafenib-induced autophagy arrest and suggest a new paradigm for effective treatment of GBM.
Abbreviations: 3-MA: 3-methyladenine; ACACA: acetyl coenzyme A carboxylase alpha; ACTB/β-actin: actin, beta; AMPK: adenosine monophosphate-activated protein kinase; ATG5: autophagy related 5; CTSD: cathepsin D; DN-: dominant-negative; GBM: glioblastoma multiforme; LAMP1: lysosomal-associated membrane protein 1; MAP1LC3B/LC3B: microtubule associated protein 1 light chain 3 beta; PIK3C3/VPS34: phosphatidylinositol 3-kinase catalytic subunit type 3; PRKAA/AMPKα: protein kinase AMP-activated catalytic subunit alpha; PSAT1: phosphoserine aminotransferase 1; SQSTM1/p62: sequestosome 1; TKIs: tyrosine kinase inhibitors.
Introduction
GBM (glioblastoma multiforme) is a highly malignant type of brain tumor characterized by aggressive growth and treatment resistance [Citation1]. Despite recent advances in the management of GBM including surgical resection, radiotherapy, and adjuvant chemotherapy with temozolomide [Citation2], currently no treatment is curative for GBM and nearly all patients recur inevitably [Citation1,Citation3,Citation4]. Thus, there is an urgent medical need to develop novel therapeutics for effective treatment of GBM.
Autophagy is an adaptive process by which aggregated proteins or damaged organelles are sequestered by double-membrane autophagosomes and degraded in autolysosomes, allowing cells to cope with stress and preserve cellular homeostasis under physiological conditions [Citation5]. Autophagy is recognized as a context-dependent process that entails multiple phenotypes in cancer cells [Citation6-Citation9]. Previously we have identified cytoprotective [Citation10], cytotoxic [Citation11], and cytostatic [Citation12] forms of autophagy induced by antitumor agents in various cancer models including GBM. The diverse roles of autophagy in cancer treatment have attracted considerable interest in the clinical setting.
The relevance of autophagy in GBM is supported by the deregulated autophagic activity in GBM cells and the potential prognostic value of autophagy-related proteins in GBM patients [Citation13]. Notably, the occurrence of autophagy has been documented in GBM in response to temozolomide, the first-line chemotherapeutic agent for GBM treatment, and is proposed to confer a compromised therapeutic response [Citation14,Citation15]. These findings imply autophagy modulation as a rational strategy for GBM treatment [Citation7]. However, the effect of autophagy inhibition in combination with temozolomide on GBM varies considerably depending on the inhibitor category. In detail, inhibition at an early stage of the autophagy pathway counters temozolomide-induced GBM cell demise [Citation16-Citation18], whereas impairing autophagic degradation at a late stage enhances anti-GBM effects of temozolomide [Citation15-Citation19]. Thus, unravelling the rational basis of the autophagy mechanism and developing novel autophagy-modulating strategies may pave new therapeutic avenues for effective treatment of GBM.
In this study, we show that regorafenib displays a potent anticancer effect for GBM. Regorafenib binds and stabilizes PSAT1 (phosphoserine aminotransferase 1), which contributes to autophagy initiation by activating PRKAA (protein kinase AMP-activated catalytic subunit alpha) and impairing autophagosome-lysosome fusion through RAB11A inhibition, synergistically causing autophagosome accumulation and growth arrest of GBM cells. This dual regulatory mechanism underlying PSAT1-induced autophagy arrest accounts for the superior anti-GBM effect of regorafenib compared with temozolomide. Collectively, our findings shed new light on the role of autophagy arrest in cancer therapy and demonstrate the therapeutic potential of regorafenib for GBM treatment.
Results
Regorafenib inhibits GBM cell growth in vitro and in vivo
Amplification of RTKs (receptor tyrosine kinases) is recognized as a key feature of GBM [Citation20-Citation22], implicating RTKs as rational targets for GBM treatment. As such, a small-molecule library of TKIs (tyrosine kinase inhibitors) was used to screen for a possible therapeutic intervention. Among these TKIs, regorafenib, an orally active multi-kinase inhibitor, was identified as the most effective candidate agent in suppressing GBM cell growth (Fig. S1A-C). Recently, regorafenib was approved by US-FDA for the treatment of CRC (metastatic colorectal cancer), HCC (hepatocellular carcinoma), and advanced GIST (gastrointestinal stromal tumors) [Citation23-Citation25]. Regorafenib for treating GBM patients has not been approved and only limited information is available.
Further validation analyses on cell growth and proliferation in various GBM cell lines were performed to confirm the anti-GBM activity of regorafenib. As expected, regorafenib treatment for 24 h markedly decreased the growth of various GBM cell lines, whereas the growth of immortalized BV2 microglial cells and NHA cells (normal human astrocytes) was only marginally affected (Figure 1(a) and S1D). Compared with CRC and HCC cells, GBM cells were proved to be more sensitive to regorafenib treatment (Fig. S1E and F). The LDH (lactate dehydrogenase) release assay was performed to detect the cytotoxicity of regorafenib [Citation26]. As shown in ), regorafenib treatment promoted cell death in GBM U87 and U251 cells. Congruent with these observations, regorafenib significantly inhibited GBM cell proliferation as evidenced by EdU incorporation ()) and colony formation assay ()). Together, these results suggest that regorafenib significantly inhibits GBM cell growth in vitro.
Figure 1. Regorafenib inhibits the growth of GBM cells in vitro and in vivo and has no obvious systemic toxicity in mice. (a) The MTT assay of U87, U251, U118, H4, BV2, C6 cells and primary GBM cells treated with indicated concentrations of regorafenib for 24 h. Primary GBM cells were obtained from brain tumor tissues from GBM patients. (b) Analysis of LDH (lactate dehydrogenase) release in supernatants of U87 and U251 cells treated with indicated concentrations of regorafenib for 24 h. (c) Analysis of EdU incorporation in GBM cells treated with the indicated concentrations of regorafenib for 24 h. (d) Quantification of clone numbers of U87 cells and U251 cells treated with the indicated concentration of regorafenib for 48 h. Cell proliferation rate was determined by colony formation assay. (e) Representative images of isolated U87 tumor xenografts of mice in cohorts treated with vehicle or regorafenib (20 mg/kg/day). Treatment was initiated 24 h after tumors reached 150 mm3. Scale bar: 2 cm. (f) The weight of individual tumors in (e). (g) Tumor volume was determined at the indicated time points. (h) MKI67 expression of tumors in (e) was detected by IHC. Scale bar: 25 μm. (i) Relative intensity of MKI67 staining in (h). (j) Representative MRI image of tumors in the GBM orthotopic mouse model. Mice were treated with vehicle or regorafenib (20 mg/kg/day) for 15 days. (k) Kaplan-Meier curves of GBM orthotopic mice from (j). (l) U87 cells expressing mCherry were implanted into the brain of 3dpf flk:eGFP Casper zebrafish followed by treatment with or without 5 μM regorafenib for 3 days. The zebrafish were then monitored by stereo microscope. (m) Body weights of mice in (e) measured at the indicated time points. Scale bar: 250 μm. (n) H&E staining of the heart, liver, lung, spleen, and kidney in mice treated with vehicle or regorafenib (20 mg/kg/day). Scale bar: 100 μm. Data are means ± s.d. and are representative of 3 independent experiments. *P < 0.05, **P < 0.01; ***P < 0.001.
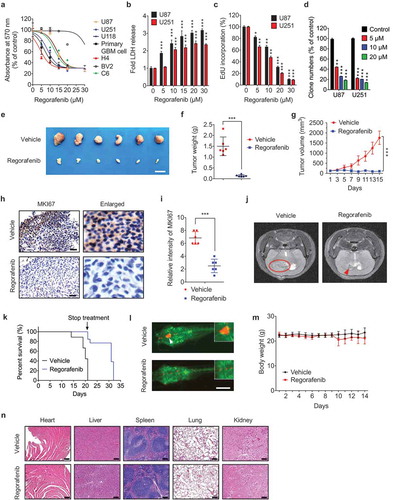
To evaluate the growth inhibition effect and toxicity of regorafenib against GBM in vivo, a GBM xenograft model was generated by subcutaneously inoculating GBM cells into nude mice. As shown in -), a marked reduction in the size, weight, and growth rate of GBM xenografts was observed in regorafenib-treated mice compared with the control group. In addition, regorafenib treatment resulted in weaker MKI67 staining compared with the control group ( and )). We further investigated the anti-GBM effect of regorafenib in an orthotopic xenograft mice model, and MRI (magnetic resonance imaging) analysis showed a marked reduction of GBM size in the regorafenib-treated mice at day 15 ()). Importantly, regorafenib treatment significantly prolonged survival in mice ()). These findings were further validated by a zebrafish orthotopic GBM model ()). Moreover, regorafenib had no significant effect on the body weight ()) or the pathological features of critical organs ()), suggesting regorafenib had no obvious toxic or adverse effects in mice. Collectively, these results indicate that regorafenib displays potent anti-GBM effects both in vitro and in vivo.
Regorafenib induces autophagosome accumulation in GBM cells by driving autophagy initiation and blocking autophagosome-lysosome fusion
We next explored the mechanism by which regorafenib inhibits the growth of GBM cells. Given its known role in apoptosis induction in HCC and CRC cells [Citation27,Citation28], we first investigated whether regorafenib inhibited GBM cell growth via apoptosis by TUNEL assay and detecting cleaved CASP3 levels. Interestingly, although apoptosis induction in GBM cells was observed only after prolonged treatment (48 h), regorafenib had no obvious effect on apoptosis after 24 h treatment (Fig. S2A and B). These data suggest that apoptosis is not the primary driving force in mediating regorafenib-induced GBM inhibition.
To further determine the mechanism underlying regorafenib-induced GBM suppression, we used inhibitors of four different forms of cell death and evaluated their effects on cell growth during regorafenib treatment. Combination of CQ (chloroquine, an inhibitor of autophagosome-lysosome fusion) with regorafenib enhanced the inhibitory effect on cell growth (Fig. S3A). While other inhibitors, including z-VAD-FMK (an apoptosis inhibitor), ferrostatin-1 (a ferroptosis inhibitor), and necrostatin-1 (a necroptosis inhibitor), had no significant effect on cell growth in the presence of regorafenib (Fig. S3A). Further, TMT (tandem mass tags)-based quantitative proteomics analysis also confirmed a marked alteration in autophagy-related proteins, including PRKAA, MAP1LC3B/LC3B, and SQSTM1/p62 (P = 0.00026) (Fig. S3B, and Table S1). Indeed, LC3B-II accumulation was observed in GBM cells and xenografts in response to regorafenib treatment (Figure 2(a) and S3C-G). Consistently, there was a significant accumulation of autophagic vesicles and LC3B puncta in regorafenib-treated cells compared with control cells, as evidenced by transmission electronic microscopy ( and )) and LC3B immunofluorescence staining, respectively (Fig. S3H and I). Together, these results suggest that autophagy may play a major role in mediating regorafenib-triggered GBM growth inhibition.
Figure 2. Regorafenib induces autophagy initiation and blocks autophagosome-lysosome fusion in GBM cells. (a) Immunoblotting analysis of LC3B expression in GBM cells treated with indicated concentrations of regorafenib for 24 h. (b) Autophagic vesicles detected by transmission electron microscope in U87 cells treated with or without 20 μM regorafenib for 24 h. Scale bar: 2 μm. N, nucleus. Arrows, autophagic vesicles. (c) The amount of autophagic vesicles in (b). (d) Co-immunoprecipitation analysis of the interaction between BECN 1 and BCL2 in GBM cells treated with or without 20 μM regorafenib for 24 h. (e) Immunoblotting analysis of LC3B expression in GBM cells treated with or without 20 μM regorafenib in the presence or absence of 5 mM 3-MA for 24 h. (f) Immunoblotting analysis of LC3B expression in GBM cells transfected with siScramble or siATG5 for 24 h, followed by treatment with or without 20 μM regorafenib for another 24 h. (g) Immunofluorescence analysis of the colocalization of endogenous LC3B and LAMP1 in U251 cells treated with or without 20 μM regorafenib for 24 h. Cells were incubated with serum- and glucose-free medium (starvation) for 2 h as positive control. Scale bar: 10 μm. (h) The amount of co-localized puncta of LC3B and LAMP1 in (g). (i) Immunofluorescence analysis of cells transiently transfected with tandem mRFP-GFP-tagged LC3B and treated with or without 20 μM regorafenib for 24 h. Scale bar: 10 μm. (j) Quantification of the ratio of red puncta indicating AL (autolysosome) versus yellow puncta indicating AP (autophagosome) in (i). (k) Representative images of GBM cells incubated with BODIPY-conjugated bovine serum (DQ-BSA, red) for 1 h and followed by 20 μM regorafenib treatment for 24 h, or incubation with serum- and glucose-free medium (starvation). Scale bar: 20 μm. (l) Immunoblotting analysis of ubiquitinated proteins in GBM cells treated with or without 20 μM regorafenib for 24 h. (m) U87 cells transfected with tandem mRFP-GFP-tagged LC3B for 24 h were subjected to live-cell microscopy. Small panels show the life time of the GFP-LC3B signal indicated by an arrow in the whole cell image. Times represents minutes post glucose- and serum-starvation or 20 μM regorafenib treatment for 2 h. Scale bar: 5 μm. Data are means ± s.d. and are representative of 3 independent experiments. *P < 0.05, **P < 0.01; ***P < 0.001.
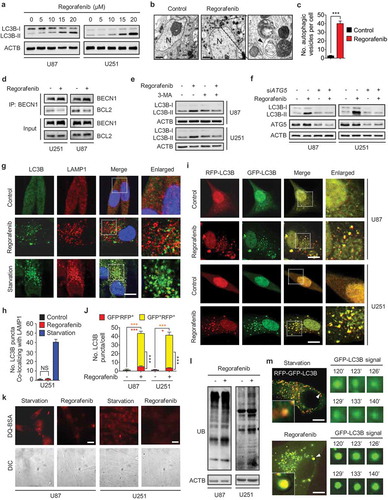
The initiation of autophagy requires dissociation of BECN1/Beclin 1 from BCL2 and subsequent binding with PIK3C3/VPS34 (PtdIns3K) [Citation5,Citation29]. We found regorafenib treatment led to the disruption of the BECN1-BCL2 interaction ()). 3-MA (3-methyladenine), an inhibitor of PIK3C3 [Citation30], prominently counteracted the elevation of LC3B-II levels ()) and the accumulation of endogenous LC3B puncta (Fig. S3J and K) in regorafenib-treated cells. In addition, ATG5 knockdown reduced regorafenib-promoted LC3B-II accumulation ()). These results suggest that regorafenib initiates autophagy in GBM cells.
In addition to autophagy initiation, the elevated LC3B-II levels may also be a consequence of blocked autophagic flux with defective degradation capacity [Citation30]. We thus examined the levels of autophagy-specific substrate SQSTM1 [Citation31], and found SQSTM1 was accumulated in both regorafenib-treated cells (Fig. S4A) and tumor xenografts (Fig. S3E) along with the increase in LC3B-II levels, implying an impairment of autophagic flux. To determine whether the impaired autophagic flux is a result of the failure in autophagosome-lysosome fusion or the decreased capacity for autolysosomal degradation, colocalization of LC3B (autophagosome marker) with LAMP1 (lysosomal-associated membrane protein 1, lysosome marker) in regorafenib-treated cells was examined. Using starvation as a positive control [Citation30], we found LC3B rarely colocalized with LAMP1 in regorafenib-treated U251 ( and )) and U87 cells (Fig. S4B and C), suggesting that regorafenib might block the fusion of autophagosomes with lysosomes. To confirm this observation, a tandem mRFP-GFP-tagged LC3B construct was used [Citation30]. As shown in and ), the number of LC3B puncta was markedly increased in regorafenib-treated cells, with a large proportion of puncta exhibiting RFP+GFP+ signal (autophagosomes) rather than RFP+GFP− signal (autolysosomes), suggesting an increase in autophagosome accumulation and a decrease in autolysosome formation. In line with these data, using a highly self-quenched DQ-BSA (BODIPY-conjugated bovine serum albumin), we found decreased DQ-BSA fluorescence due to blocked proteolytic degradation in regorafenib-treated cells () and S4D). Consequently, regorafenib-induced autophagosome accumulation resulted in an increase of ubiquitinated protein conjugates ()). To further substantiate whether regorafenib could prevent autophagosomes from reaching lysosomes, we used live cell imaging to track the fluorescent signal of tandem mRFP-GFP-tagged LC3B. As shown in ), the starvation-induced GFP+ signal (autolysosomes) gradually quenched with time, while regorafenib-treated cells retained the GFP signal, indicating rare autophagosome-lysosome fusion under regorafenib treatment. Taken together, these findings demonstrate that regorafenib induces massive autophagosome accumulation (-)) by driving autophagy initiation ()) and blocking autophagosome-lysosome fusion ()), leading to autophagy arrest.
Regorafenib inhibits GBM cell growth by promoting autophagosome accumulation
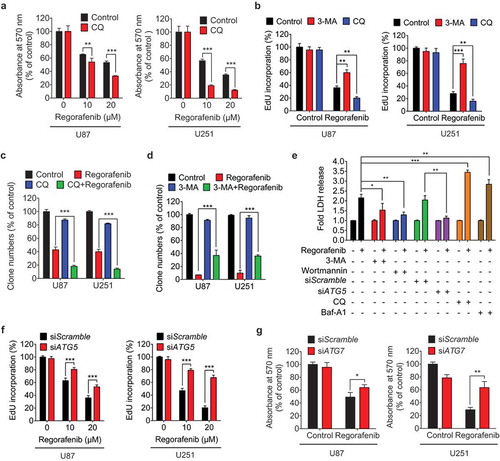
To determine the role of autophagy in mediating the anti-GBM effect of regorafenib, GBM cells were treated with regorafenib in combination with CQ or Baf-A1 (CQ or bafilomycin A1, two inhibitors of autophagosome-lysosome fusion), 3-MA or wortmannin (two PIK3C3 inhibitors), or siATG5 and siATG7, respectively [Citation30]. CQ, which disrupts autophagosome-lysosome fusion and causes autophagosome accumulation, significantly aggravated regorafenib-induced growth inhibition as evidenced by MTT (Figure 3(a)), EdU incorporation ()) and colony formation assay ()). By contrast, 3-MA or wortmannin, which inhibits autophagy initiation and subsequent autophagosome formation, markedly restored cell growth in regorafenib-treated GBM cells (,d,e)). These findings were further strengthened by the observations that Baf-A1 potentiated regorafenib-induced GBM cell death ()), whereas knockdown of ATG5 or ATG7 was capable of reducing the sensitivity of GBM cells to regorafenib treatment (-g)). Of note, among the TKIs tested, regorafenib led to the most prominent accumulation of both LC3B-II and SQSTM1 (Fig. S4E), implying a potential connection between autophagosome accumulation and GBM suppression. Overall, these results suggest that regorafenib inhibits GBM cell growth by promoting autophagosome accumulation.
Figure 3. Regorafenib inhibits GBM cell growth by promoting autophagosome accumulation. (a) The MTT assay of GBM cells treated with indicated concentrations of regorafenib in the presence or absence of 5 μM CQ (chloroquine) for 24 h. (b) EdU assay of GBM cells treated with or without 5 mM 3-MA, or 5 μM CQ in the presence or absence of 20 μM regorafenib for 24 h. (c) Quantification of clone numbers of GBM cells treated with or without 5 μM CQ, in the presence or absence of 20 μM regorafenib for 24 h. (d) Quantification of clone numbers of GBM cells treated with or without 5 mM 3-MA, in the presence or absence of 20 μM regorafenib for 72 h. (e) LDH release in the supernatant of U87 cells treated with or without 20 μM regorafenib in the presence or absence of siATG5, 5 μM CQ, 100 nM Baf-A1, 5 mM 3-MA, or 200 nM wortmannin for 24 h. (f) EdU assay of GBM cells transfected with siScramble, or siATG5 for 24 h, followed by treatment with or without 20 μM regorafenib for another 24 h. (g) The MTT assay of GBM cells transfected with siScramble or siATG7 for 24 h, followed by treatment with or without 20 μM regorafenib for another 24 h. Data are means ± s.d. and are representative of 3 independent experiments. *P < 0.05, **P < 0.01; ***P < 0.001.
Regorafenib stabilizes PSAT1 through directly binding to PSAT1
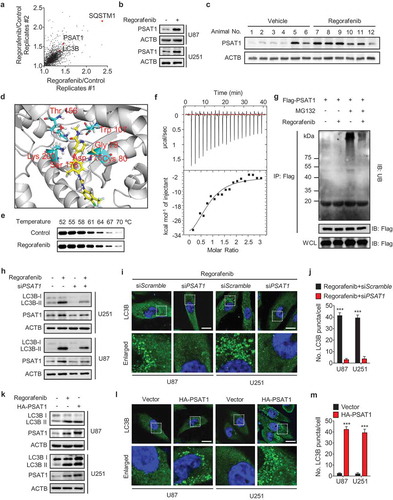
We interrogated the global protein expression profiles in response to regorafenib using the TMT-based quantitative proteomics analysis and found that the protein level of PSAT1 was significantly enhanced after regorafenib treatment (Figure 4(a)), which is consistent with the immunoblotting results in vitro and in vivo (,c) and S5A). Moreover, regorafenib treatment also upregulated the PSAT1 mRNA level (Fig. S5B). We then performed docking analysis and found that regorafenib had a potential binding affinity with PSAT1 ()). The cellular thermal shift assay showed that PSAT1 was physically engaged and stabilized against thermal changes under regorafenib treatment (). This potential interaction was further confirmed by ITC (isothermal titration calorimetry) analysis using a recombinant human PSAT1 ()). To further explore the mechanism underlying regorafenib-induced PSAT1 expression, we investigated the effect of regorafenib on the ubiquitin-mediated degradation of PSAT1. As shown in ), regorafenib treatment markedly reduced the ubiquitin-conjugated level of PSAT1. Taken together, our results demonstrate that regorafenib physically binds to PSAT1 and protects it against ubiquitin-mediated degradation.
Figure 4. Regorafenib induces autophagosome accumulation by stabilizing PSAT1. (a) Changes in protein abundance in U87 cells treated with DMSO or 20 μM regorafenib were analyzed by TMT label-based quantitative mass spectrometry. Each dot represents a distinct protein from 2 replicated experiments. (b) Immunoblotting analysis of PSAT1 expression in GBM cells treated with or without 20 μM regorafenib for 24 h. (c) Immunoblotting analysis of PSAT1 in tumor xenografts obtained from vehicle- or regorafenib (20 mg/kg/day)-treated mice. (d) Superposition of the regorafenib binding domains of human PSAT1 (gray, PDB accession 3E77). Residues are labelled in red. (e) Cellular thermal shift assay showing PSAT1 target engagement by regorafenib in U251 cells. (f) Isothermal titration calorimetry analysis of regorafenib binding with recombinant human PSAT1. (g) HEK 293 cells were transfected with Flag-PSAT1 for 24 h and then treated with regorafenib and MG132 for another 6 h. The ubiquitination of PSAT1 was detected by immunoblotting after co-immunoprecipitation. (h) GBM cells were transfected with siScramble or siPSAT1 for 24 h, followed by treatment with or without 20 μM regorafenib for another 24 h. The protein levels of LC3B and PSAT1 were analyzed by immunoblotting. (i) GBM cells were treated as in (h). The LC3B puncta were analyzed by immunofluorescence. Scale bar: 20 μm. (j) The number of LC3B puncta in (i). (k) GBM cells were transfected with empty vector or HA-PSAT1 plasmid for 48 h, or treated with 20 μM regorafenib for 24 h. The protein levels of LC3B and PSAT1 were analyzed by immunoblotting. (l) GBM cells were transfected with vector or HA-PSAT1 plasmid for 48 h. The formation of endogenous LC3B puncta was analyzed by immunofluorescence. Scale bar: 20 μm. (m) The number of LC3B puncta in (l). Data are means ± s.d. and are representative of 3 independent experiments. *P < 0.05, **P < 0.01; ***P < 0.001.
The elevated PSAT1 expression is required for regorafenib-induced autophagosome accumulation in GBM cells
Next, we investigated whether PSAT1 is involved in regorafenib-regulated autophagy in GBM cells using loss- and gain-of-function experimental settings. As shown in -j), knockdown of PSAT1 markedly reduced regorafenib-induced LC3B-II overexpression and LC3B puncta accumulation. In addition, exogenous PSAT1 expression resulted in elevation of LC3B-II level and accumulation of LC3B puncta ()), to a similar level observed in cells treated with regorafenib alone (Fig. S3H and I). These results were further strengthened by the rare colocalization of LC3B with LAMP1 in PSAT1-overexpressing cells (Fig. S5C and D), suggesting a role of PSAT1 in preventing autophagosome-lysosome fusion. This impeded autolysosome formation caused by PSAT1 overexpression resulted in impaired autophagic degradation, as evidenced by accumulated ubiquitinated proteins and elevated SQSTM1 levels (Fig. S5E). Together, these data suggest that regorafenib inhibits the fusion of autophagosomes with lysosomes by upregulating PSAT1.
PSAT1-mediated PRKAA activation triggers regorafenib-induced autophagy initiation
It has been recently reported that a tricarboxylic acid cycle intermediate α-KG (α-ketoglutarate) could enhance the activity of PRKAA [Citation32]. Considering that PSAT1 is an anaplerotic source of α-KG production [Citation33], we presumed that regorafenib-induced PSAT1 upregulation may activate PRKAA by inducing α-KG production. Indeed, we found that regorafenib enhanced the level of α-KG (Fig. S6A), which contributed to the increase of PRKAA phosphorylation and LC3B-II accumulation (Fig. S6B).
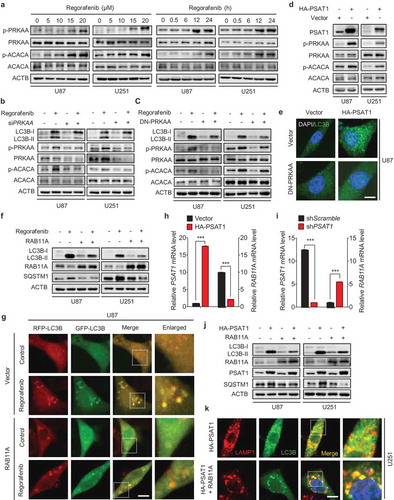
To elucidate the mechanism of regorafenib-induced autophagy initiation, we determined the phosphorylation status of AMP-activated protein kinase (AMPK), a canonical upstream signal of autophagy [Citation34,Citation35]. As shown in ), we found that the phosphorylation levels of PRKAA (Thr 172) and ACACA/ACC1 (acetyl coenzyme A carboxylase alpha, a downstream target of AMPK) were enhanced by regorafenib treatment in a dose- and time-dependent manner. Knockdown of PRKAA by siPRKAA significantly reduced LC3B-II levels in regorafenib-treated cells ()). These observations were further strengthened by using a DN-PRKAA (dominant negative mutant of PRKAA) in regorafenib-treated cells () and S6C). These results suggest that PRKAA activation is required for autophagy initiation induced by regorafenib. Notably, overexpression of PSAT1 promoted the phosphorylation of PRKAA and ACACA ()), indicating that PSAT1 could activate AMPK signaling. To further determine the role of PRKAA in PSAT1-mediated autophagy, PSAT1-overexpressing GBM cells were subjected to siPRKAA or DN-PRKAA treatment. The increased LC3B lipidation and LC3B puncta accumulation induced by PSAT1 overexpression were markedly counteracted by siPRKAA (Fig. S6D) or DN-PRKAA () and S6E-G) treatment. Taken together, these results demonstrate that regorafenib initiates the autophagy process through PSAT1-mediated PRKAA activation.
Figure 5. PSAT1 is involved in PRKAA activation and RAB11A downregulation in regorafenib-treated GBM cells. (a) Immunoblotting analysis of PRKAA and ACACA levels, as well as the phosphorylation levels of PRKAA (Thr172) and ACACA (Ser 79) in cells treated with or without regorafenib at different time points and doses as indicated. (b) Cells were transfected with siScramble or siPRKAA for 24 h, followed by treatment with or without 20 μM regorafenib for another 24 h. Protein levels of LC3B, p-PRKAA (Thr172), PRKAA, p-ACACA (Ser 79) and ACACA was detected by immunoblotting analysis. (c) Cells were transfected with empty vector or DN-PRKAA for 24 h, followed by treatment with or without 20 μM regorafenib for another 24 h. Protein levels of LC3B, p-PRKAA (Thr172), PRKAA, p-ACACA (Ser 79) and ACACA was detected by immunoblotting analysis. (d) Immunoblotting analysis of PSAT1, PRKAA, and ACACA levels, as well as the phosphorylation levels of PRKAA (Thr172) and ACACA (Ser 79) in cells transfected with empty vector or HA-PSAT1 plasmid for 48 h. (e) Immunofluorescence analysis of the endogenous LC3B puncta in U87 cells co-transfected with HA-PSAT1 and DN-PRKAA plasmids for 48 h. Scale bar: 10 μm. (f) Cells were transfected with empty vector or RAB11A plasmid for 24 h, followed by treatment with or without 20 μM regorafenib for another 24 h. Protein levels of LC3B, SQSTM1 and RAB11A were detected by immunoblotting analysis. (g) U87 cells expressing tandem mRFP-GFP-tagged LC3B were treated as in (f). LC3B puncta was examined by immunofluorescence analysis. Scale bar: 10 μm. (h) qPCR analysis of the mRNA levels of PSAT1 and RAB11A in cells transfected with empty vector or HA-PSAT1 plasmid. (i) qPCR analysis of the mRNA levels of PSAT1 and RAB11A in cells transfected with shScramble or shPSAT1 plasmid. (j) Immunoblotting analysis of LC3B, RAB11A, PSAT1 and SQSTM1 expression in GBM cells transfected with HA-PSAT1 plasmid, in combination with empty vector or RAB11A plasmid for 48 h. (k) Immunofluorescence analysis of the colocalization of endogenous LC3B and LAMP1 in GBM cells transfected with HA-PSAT1 plasmid in combination with empty vector or RAB11A plasmid. Scale bar: 10 μm. Data are means ± s.d. and are representative of 3 independent experiments. *P < 0.05, **P < 0.01; ***P < 0.001.
PSAT1-mediated RAB11A downregulation is required for regorafenib-inhibited autophagosome-lysosome fusion
To gain mechanistic insights of the regorafenib-induced impairment of autophagosome-lysosome fusion, we first investigated the effect of regorafenib treatment on the lysosomal mass. As shown in Fig. S7A, the lysosomal content, identified by LysoTracker staining, showed no obvious change in response to regorafenib treatment. Next, we detected the LGALS3/galectin 3 puncta and its lysosomal translocation to further evaluate the lysosome damage in GBM cells after regorafenib treatment [Citation36]. As shown in Fig. S7B, no obvious formation of LGALS3 puncta and lysosomal translocation were observed in regorafenib-treated cells, suggesting that regorafenib treatment has no obvious effect on lysosome damage. In addition, the expression of CTSD (cathepsin D) and LAMP2 (lysosome-associated membrane protein-2), two key lysosomal proteins, showed no substantial differences in regorafenib-treated cells compared with controls (Fig. S7C). These results suggest that regorafenib treatment has no obvious effect on lysosomal mass or activity.
We then examined the expression levels of autophagosome-lysosome fusion-associated proteins, including MYO1C, SNAP29, VPS41, DCTN, RAB7 and RAB11A [Citation37,Citation38]. Among them, the expression of RAB11A was decreased in response to regorafenib treatment, whereas others exhibited no significant changes (Fig. S7D). We asked whether RAB11A plays a role in regorafenib-inhibited autolysosome formation. As shown in ), overexpression of RAB11A compromised regorafenib-induced LC3B lipidation and SQSTM1 accumulation. Moreover, we observed a significant decrease of RFP+GFP+ signal (autophagosome) and increase of RFP+GFP− signal (autolysosome) in RAB11A-overexpressing GBM cells (), S7E and F). These data reveal that regorafenib impairs autophagosome-lysosome fusion by downregulating RAB11A.
To further explore the role of PSAT1 in regorafenib-induced downregulation of RAB11A, we examined RAB11A levels by knocking down or overexpressing PSAT1. PSAT1 overexpression reduced RAB11A mRNA ()) and protein levels (Fig. S7G), while PSAT1 knockdown increased RAB11A mRNA ()). We then evaluated the role of RAB11A in PSAT1-impeded fusion of autophagosomes with lysosomes, and found that the increased SQSTM1 level and reduced colocalization of LAMP1 and LC3B caused by PSAT1 overexpression could be markedly counteracted by overexpressing RAB11A (,k) and S7H, I). Collectively, our results suggest that regorafenib impairs the fusion of autophagosomes with lysosomes through PSAT1-mediated RAB11A downregulation.
PSAT1 is required for regorafenib-induced GBM suppression
Since PSAT1 contributes to regorafenib-induced autophagosome accumulation, we next determined whether upregulation of PSAT1 was involved in regorafenib-induced GBM suppression. Indeed, regorafenib treatment resulted in growth inhibition of GBM cells, which could be markedly rescued by PSAT1 knockdown, as evidenced by LDH release ()) and colony formation assay (), S8A and B) in different GBM cell lines. To corroborate these observations, we subcutaneously injected U87 cells stably expressing shPSAT1 or scrambled shRNA into nude mice. In agreement with the in vitro results, PSAT1 knockdown significantly compromised regorafenib-inhibited tumor growth ( and )). These in vitro and in vivo findings indicate that PSAT1 upregulation is required for the anti-GBM effect of regorafenib.
Figure 6. PSAT1 is required for regorafenib-induced GBM suppression and is downregulated in human GBM. (a) U87 cells stably expressing shScramble or shPSAT1 were treated with indicated concentrations of regorafenib for 24 h. LDH release in the supernatants of U87 cells was measured. (b) U87 cells stably expressing shScramble or shPSAT1 were treated with indicated concentrations of regorafenib for 48 h. Survival fraction values of U87 cells were then quantified. (c) U87 cells stably expressing shScramble or shPSAT1 were subcutaneously inoculated into nude mice. Photograph of isolated tumors derived from mice treated with vehicle or regorafenib (20 mg/kg/day) for 7 days. (d) Tumor weights of mice in (c) at time of sacrifice. (e) Immunohistochemistry staining of PSAT1 in normal brain and different grades of glioblastoma. Scale bar: 50 μm. (f) The relative mRNA levels of PSAT1 in different grades glioma patients from the TCGA-GBM dataset. (g) Immunohistochemistry analysis of PSAT1, LC3B and SQSTM1 levels in GBM tissues. Scale bar: 25 μm. (h-j) Correlation of PSAT1, LC3B and SQSTM1 immunostaining intensity in the tissue array. (k) Kaplan–Meier analysis of percent survival based on PSAT1 expression in TCGA-GBM dataset. Z-score = (intensity G – mean intensityG1 … Gn)/SDG1 … Gn, G stands for any gene and G1… Gn stands for the aggregate measure of all values of staining intensity. Data are means ± s.d. and are representative of 3 independent experiments. *P < 0.05, **P < 0.01; ***P < 0.001.
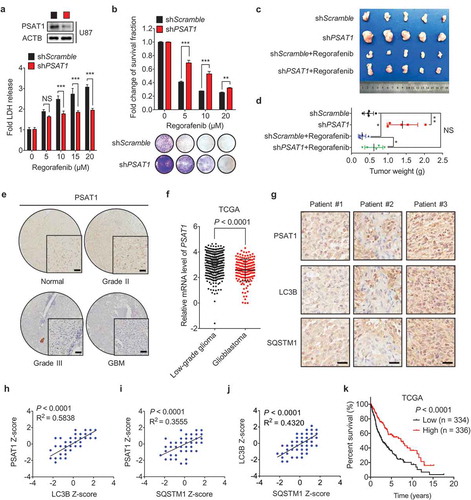
Interestingly, tumor xenografts with PSAT1 knockdown alone clearly grew at an accelerated rate than the shScramble control group, implying PSAT1 might play an important role in suppressing GBM growth. To test this hypothesis, we examined the expression of PSAT1 using GBM tissue microarrays (see details in Table S2). Indeed, IHC analysis revealed decreased expression of PSAT1 in GBM specimens compared with normal tissues (), S8C and H), which is consistent with the Oncomine data analysis (Fig. S8D). In addition, PSAT1 was expressed at much lower levels in high-grade GBM tumors compared with low-grade tumors, as demonstrated by IHC analysis of GBM tissue microarrays ()), TCGA data ()) and Oncomine data analysis (Fig. S8E and F). More importantly, the level of PSAT1 in GBM tissues positively correlated with LC3B and SQSTM1 levels, respectively (-j)). Furthermore, low PSAT1 levels significantly correlated with reduced OS (overall survival) of GBM patients () and S8G). These data suggest that PSAT1 acts as a negative regulator in GBM growth and progression. Collectively, our findings demonstrate that PSAT1 is required for regorafenib-induced GBM suppression.
Regorafenib exhibits superior anti-GBM efficacy over temozolomide
Temozolomide, the first-line chemotherapeutic drug for GBM, frequently encounters drug resistance in human patients [Citation2]. Previous studies have reported that temozolomide induces cytoprotective autophagy with unimpeded autophagic flux in GBM cells [Citation39], while our results demonstrate that regorafenib blocks autophagic flux contributing to GBM growth inhibition. In this regard, we compared the anti-GBM effects of regorafenib, temozolomide, and combinatorial treatment. Reconciling with the different effect of regorafenib and temozolomide on autophagic flux, regorafenib induced higher levels of LC3B-II than temozolomide, while only a slight increase of LC3B-II levels was observed in combinatorial treatment ()). Moreover, 20 μM regorafenib showed much better effect on GBM growth inhibition than 500 μM temozolomide, and the cytotoxic effect of regorafenib was only slightly potentiated by temozolomide ( and )). We then evaluated the effect of regorafenib, temozolomide or combination treatment on GBM growth in the subcutaneous xenograft tumor model. Consistent with the results in vitro, regorafenib treatment significantly reduced tumor growth compared with temozolomide ()). Combination treatment of regorafenib with temozolomide showed no significant difference in tumor reduction compared with regorafenib monotherapy ()). To further confirm these findings, we compared the anti-tumor effect of regorafenib and temozolomide in the orthotopic xenograft mice model of human GBM. As shown in ), regorafenib significantly prolonged the survival time of mice bearing orthotopic GBM xenografts, with a median survival of 38 days compared with 27 days in the temozolomide-treated group and 24 days in the control group. Taken together, these data suggest that regorafenib exhibits superior anti-GBM efficacy.
Figure 7. Regorafenib exhibits superior anti-GBM efficacy to temozolomide in vitro and in vivo. (a) Immunoblotting analysis of LC3B in GBM cells treated with or without 20 μM regorafenib, in combination with or without 500 μM temozolomide for 24 h. (b) GBM cells were treated with 20 μM regorafenib or 500 μM temozolomide for 48 h, followed by crystal violet staining and quantification of survival fraction. (c) EdU incorporation assay of GBM cells treated as in (a). (d-f) Nude mice were subcutaneously inoculated with U87 cells and treated with regorafenib (20 mg/kg/day) alone or in combination with or without temozolomide (10 mg/kg/day) for 14 days. Photograph of isolated tumor xenografts (d). Tumor weights at time of sacrifice (e). Tumor volumes measured at indicated time points (f). (g) Kaplan-Meier analysis of percent survival in mice treated with control, temozolomide (10 mg/kg/day), or regorafenib (20 mg/kg/day). (h-k) The MTT assay (h), EdU incorporation (i), LDH release in supernatants (j) and fold change of survival fraction (k) of U138 cells treated with indicated concentrations of regorafenib or temozolomide for 24 h. (l) Immunoblotting analysis of LC3B, SQSTM1, PSAT1, and ubiquitinated proteins in U138 cells treated with indicated concentrations of regorafenib for 24 h. Data are means ± s.d. and are representative of 3 independent experiments. *P < 0.05, **P < 0.01; ***P < 0.001.
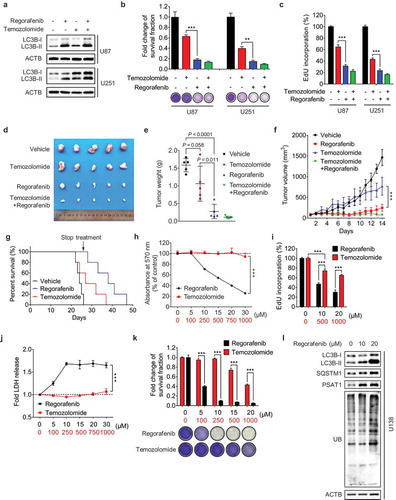
We then determined whether temozolomide-resistant GBM cells were sensitive to regorafenib treatment. As shown in -k), regorafenib markedly inhibited the growth of temozolomide-resistant U138 cells in a dose-dependent manner. Notably, compared with the temozolomide-sensitive cells (such as U87, U251 etc.) ()), regorafenib treatment at the same dose (10 μM or 20 μM) resulted in a comparable effect on growth inhibition in temozolomide-resistant cells (-k)). In addition, regorafenib-treated temozolomide-resistant cells also showed LC3B-II accumulation, PSAT1 upregulation and an increase of ubiquitinated proteins ()), which may account for the sensitivity of regorafenib in temozolomide-resistant GBM cells. Taken together, our results suggest that regorafenib is an alternative therapeutic agent for treating temozolomide-resistant GBM.
Discussion
Regorafenib was approved by US-FDA for the treatment of metastatic CRC in 2012, advanced GIST in 2013 and HCC in 2017, due to its pro-apoptotic effects [Citation24,Citation25,Citation27,Citation28]. In this study, we found that regorafenib also has a potent anticancer effect against GBM, extending its clinical implications. Interestingly, regorafenib treatment for 24 h has no obvious effect on apoptosis induction of GBM cells, which may be attributed to the apoptosis-resistant phenotype of GBM cells [Citation40]. These findings suggest that other growth inhibition mechanisms, rather than apoptosis, are involved in regorafenib-induced GBM suppression.
In recent years, the roles of autophagy in therapeutic responses have attracted considerable attention. However, whether autophagy benefits or restrains the therapeutic efficacy is context-dependent. For example, some anticancer agents (including paclitaxel and 5-fluorouracil) have been shown to provoke cytoprotective autophagy, and autophagy inhibitors render tumor cells vulnerable to these chemotherapeutic agents [Citation41,Citation42]. On the other hand, pharmacological induction of autophagy can also be cytotoxic, and inhibition of autophagy favors tumor cell growth [Citation12]. In most cases, each of these autophagy-modulating therapies occurs under conditions of accelerated autophagic flux. However, little is known whether autophagy arrest with impaired autophagic flux plays a role in cancer therapy. Our data reveal that regorafenib blocks autophagic flux to suppress GBM cell growth, suggesting a cytotoxic role of autophagy arrest in chemotherapy. Interestingly, regorafenib induces autophagy arrest by proceeding autophagy initiation and blocking autophagosome-lysosome fusion simultaneously, which consequently causes massive accumulation of autophagosomes (Fig. S9). Inhibiting autophagosome formation counteracts regorafenib-induced GBM suppression, while blocking autophagosome-lysosome fusion aggravates the sensitivity of GBM cells to regorafenib, supporting a causal role for autophagosome accumulation in anti-GBM effect of regorafenib.
We demonstrate that regorafenib exerts a markedly superior effect on GBM suppression compared with the most used first-line drug temozolomide. If these findings are successfully translated into clinical practice, it is plausible that regorafenib may be an alternative therapeutics for treating GBM. However, this new therapeutic concept warrants validation in further preclinical models (such as patient-derived xenograft model) and well-designed clinical trials. Mechanistically, regorafenib provokes autophagosome accumulation, whereas temozolomide preserves autophagic flux, allowing the consumption of autophagosomes [Citation43-Citation45]. Preclinical studies have shown that pharmacological inhibition of autophagy by HCQ (hydroxychloroquine) enhances the therapeutic effect of temozolomide [Citation16,Citation18,Citation19], probably due to the incurred lethal autophagy arrest. Moreover, autophagy initiation by temsirolimus (a derivative of rapamycin targeting mTOR) combined with blockage of the autophagosome/lysosome fusion by HCQ, exhibits significant antitumor activity in melanoma [Citation46,Citation47]. This raises an interesting question whether inducing autophagy initiation plus inhibiting autolysosome formation can be an optional therapeutic strategy. However, a phase I/II clinical study has reported that high dose of HCQ exposure could be more effective for cancer treatment, but the application of high dose of HCQ is precluded by dose-limiting toxicity [Citation48]. Given the function of regorafenib in inducing autophagy arrest, the monotherapy of agents like regorafenib, which could induce autophagy arrest, may represent a rational alternative to HCQ in GBM treatment. In addition, it should be noted that residual autophagosome flux remains under regorafenib treatment, because Baf-A1 or CQ treatment further increased autophagosome flux (data not shown) and enhanced the anti-GBM effect of regorafenib (-c,e).
Notably, a majority of GBM patients exhibit high levels of MGMT (O6-methylguanine methyltransferase), which confers robust resistance to temozolomide-induced apoptosis [Citation49,Citation50]. Our data show that, regorafenib still exhibits significant cytotoxic efficacy in temozolomide-resistant GBM cells by promoting autophagy arrest rather than inducing apoptosis. Therefore, manipulating autophagy arrest may represent a rational strategy for overcoming therapeutic resistance to pro-apoptosis agents. However, the mechanism underlying autophagy arrest-mediated cell death remains unclear. Interestingly, regorafenib inhibits the activation and lysosomal translocation of mTOR (data not shown), which is required for the amino acid efflux from lysosome to cytoplasm [Citation51], implying that lysosome function maybe involved in the regorafenib-induced cell death. Moreover, autosis, a new form of non-apoptotic regulated cell death, has recently been reported to be autophagic gene-dependent and might be involved in autophagy-related cell death. Autosis is regulated by Na+, K+-ATPase and featured with unique morphological changes such as endoplasmic reticulum and perinuclear space expansion [Citation52,Citation53]. It is of particular interest to investigate whether autosis is involved in regorafenib-mediated GBM suppression in the future.
PSAT1, a rate-limiting enzyme in serine biosynthesis, has been reported to facilitate tumor progression in several types of cancer, including colon, breast and lung cancer and esophageal squamous cell carcinoma [Citation54-Citation58]. However, the role of PSAT1 in GBM progression remains unclear. In addition to serine synthesis, PSAT1 also contributes to the anaplerotic generation of α-KG, a key TCA cycle metabolite [Citation54,Citation59]. Reduction of α-KG to D-2-hydroxyglutarate caused by IDH (isocitrate dehydrogenase) mutation (found in most secondary GBMs) has been reported to facilitate GBM tumorigenesis [Citation3,Citation60,Citation61]. These findings raise the possibility that PSAT1 may be involved in regulating GBM growth. Indeed, we found that PSAT1 is expressed at low levels in human GBM tissues and correlates with tumor grades, in contrast to the observations that PSAT1 is overexpressed in several other cancer types [Citation55-Citation58]. This difference, which warrants further investigation, might be due to different biological functions of PSAT1 (contributing to serine synthesis or α-KG generation), or distinct PSAT1-associated metabolic demands of brain tumors.
One of the most exciting findings of our study is that temozolomide-resistant GBM is sensitive to regorafenib treatment. As temozolomide resistance is frequently encountered in GBM patients and no effective therapeutics is available to circumvent the drug resistance. Discovery of regorafenib as a potent anti-GBM agent and effective for treating temozolomide-resistant tumors provides a new therapeutic option for treating GBM. In summary, our study demonstrates that regorafenib inhibits GBM growth through PSAT1-mediated autophagy arrest. These findings provide new insights into the mechanism of action of regorafenib in tumor suppression, and offer a promising strategy for GBM therapy by stimulating autophagy arrest.
Materials and methods
Cell culture
U87, U118, U138, H4, C6, HEK293T, SK-HEP-1, Hep3B, HepG2, DLD-1, HCT116, SW480, SW620 cells were obtained from the American Type Culture Collection (HTB-14, HTB-15, HTB-16, HTB-148, CCL-107, CRL-3216, HTB-52, HB-8064, HB-8065, CCL-221, CCL-247, CCL-228, CCL-227). U251, BEL-7404, and BEL-7402 were obtained from the Cell Bank of the Institute of Culture Collection of the Chinese Academy of Sciences (TCHu 58, TCHu 64, TCHu10). BV2 and NHA cells were obtained from Fenghbio (CL20004, CL0112). All cell lines are cultured according to the guidelines. STR (short tandem repeat) analysis was performed for each of these cell lines. Primary GBM cells were separated from GBM patient tissues and cultured in Dulbecco’s modified Eagle’s medium (Thermo Fisher Scientific, 12800017) supplemented with 10% FBS (HyClone, SH30088.03) in a humid incubator with 5% CO2 at 37°C. All experimental procedures regarding primary GBM cells were approved by the Research Ethics Board of the West China Hospital of Sichuan University.
Reagents
The following antibodies were used: anti-LC3B (Novus Biologicals, NB100-233), anti-SQSTM1 (MBL International Corporation, PM045), anti-PSAT1 (Novus Biologicals, NBP1-32920), anti-PRKAA/AMPKα (Cell Signaling Technology, 5832), anti-phospho-PRKAA/AMPKα (Thr172) (Cell Signaling Technology, 2535), anti-ACACA (Cell Signaling Technology, 4190), anti-phospho-ACACA (Ser79) (Cell Signaling Technology, 11818), anti-RAB11A (Santa Cruz Biotechnology, sc-16691), anti-CTSD (Cell Signaling Technology, 2284), anti-LAMP2 (Cell Signaling Technology, 49067), anti-MYO1C (Santa Cruz Biotechnology, sc-136544), anti-SNAP29 (Santa Cruz Biotechnology, sc-135564), anti-VPS41 (Santa Cruz Biotechnology, sc-377046), anti-DCTN (Santa Cruz Biotechnology, sc-365274), anti-RAB7 (Cell Signaling Technology, 9367), anti-MKI67 (Abcam, ab15580), anti-LAMP1 (Santa Cruz Biotechnology, sc-19992), anti-ubiquitin (Cell Signaling Technology, 3936). Secondary antibodies were obtained from for Santa Cruz Biotechnology: goat anti-rabbit IgG-HRP (sc-2004), goat anti-mouse IgG-HRP (sc-2005).
The target sequences of siPSAT1 were designed and chemically synthesized as: 5‘-GCCGCACTCAGTGTTGTTAGA-3’, 5‘-GCTGTTCCAGACAACTATAAG-3’, 5‘-GCAGAAGAAGCCAAGAAGTTT-3’. The target sequences of siATG5 were designed and chemically synthesized by Genepharma as: 5‘-GCAACUCUGGAUGGGAUUG-3’. The target sequences of siATG7 were designed and chemically synthesized as: 5‘-CAGUGGAUCUAAAUCUCAAACUGAU-3’. TKIs, regorafenib (HY-13308), chloroquine (HY-17589), 3-methyladenine (HY-19312), bafilomycin A1 (HY-100558) were purchased from Med Chem Express. Lipofectamine 3000 (L3000015) and DAPI (62248) were purchased from Thermo Fisher Scientific.
Animal studies
BALB/c nude mice and NOD/SCID mice at 5 weeks of age were purchased from HFK Bioscience Co., Ltd. For the orthotopic brain tumor model, 1 × 10⁶ U87 cells were suspended in PBS (Thermo Fisher Scientific, 10010023) and intracranially engrafted in brains of BALB/c nude mice or NOD/SCID mice at 6 weeks of age. For the subcutaneous GBM xenograft model, 1 × 10⁷ U87 cells were injected subcutaneously into the mouse in 100 μl of PBS. 10 days post-injection of GBM cells, mice were randomly grouped and intraperitoneally injected with 0.1 ml of vehicle (10% ricinus oil, 5% DMSO, 10% ethanol, 75% physiological saline), regorafenib (20 mg/kg/day), or temozolomide (10 mg/kg/day), respectively. All animal studies were approved by the Institutional Animal Care and Treatment Committee of Sichuan University.
For the zebrafish xenograft model of human GBM, Tg (flk1:eGFP) zebrafish were used. In detail, 0.5 × 10³ U87 cells stably expressing mCherry were microinjected into the brain of 3dpf (days post fertilization) zebrafish, which were anesthetized with 0.04 mg/ml tricaine (Sigma-aldrich, 886-86-2). Zebrafish with mCherry fluorescent signal were examined next day and randomly divided into four groups. 3 days post-microinjection, zebrafish were treated with vehicle or 5 μM regorafenib for 8 h/day, with the treatment lasting for 3 days. The mCherry fluorescent signal was detected using a stereo microscope.
Tissue microarray and immunohistochemistry
TMAs (tissue microarrays) comprising 3 normal brain tissues and 77 glioma tissues were used to evaluate protein expression by immunohistochemistry. Intensity of staining was graded using following criteria: 0 for none, 1–4 for weak, 5–8 for indicated positive and 9–12 for strong positive. Z-score was calculated using the following formula: Z-score = (intensity G – mean intensityG1 … Gn)/SDG1 … Gn, G stands for any gene and G1… Gn stands for the aggregate measure of all values of staining intensity. The intensity of protein expression was determined independently by 2 investigators.
Immunoblotting and immunoprecipitation
Protein lysates were prepared with RIPA buffer (Thermo Fisher Scientific, 89900) and quantified by BCA Protein Assay (Thermo Fisher Scientific, 23250). Next, SDS-PAGE was performed to separate protein, followed by transferring protein onto PVDF membranes (EMD Millipore, ISEQ00010) and then blocked with skimmed milk in TBST (Thermo Fisher Scientific, 28360). After incubation in primary and secondary antibodies, immunoreactivity was detected by ECL (EMD Millipore, WBKLS0500). For immunoprecipitations, cell lysates and indicated antibodies (1 μg) were subjected to rotation overnight at 4°C. Protein A-Sepharose beads (40 μl; GE Healthcare, 17–0963-03) were added for 3 h, followed by centrifugation, washed 4 times and boiled with loading buffer for immunoblotting analysis.
Quantitative RT-PCR
Total RNA was obtained using Trizol (Thermo Fisher Scientific, 15596018), and the total cDNA was generated using the PrimeScript™ RT reagent Kit with gDNA Eraser (Takara, RR047A). Bio-Rad iTaq Universal SYBR Green Supermix (1725271) was then used to quantitative the mRNA level of indicated gene. Primer pairs used for PSAT1 were: forward 5‘- GGGAATTGCTAGCTGTTCCAG-3’, reverse 5‘-TCAGCACACCTTCCTGCTTT-3’, Primer pairs used for RAB11A were forward 5‘-CAGCAGGGCAAGAGCGATA-3’, reverse 5‘-AGCCATCGCTCTACATTTTCA-3’.
Immunofluorescence
Cells were seeded onto the glass cover slips in 24-well plates. After treatment, cells were fixed with 4% paraformaldehyde in PBS for 30 min. The slides were then washed three times with PBS and incubated with 0.4% Triton X-100 (Sigma-aldrich, 9002-93-1) and 5% goat serum (Sigma-aldrich, G9023) for 30 min. Cells were incubated with indicated primary antibody overnight at 4°C and subsequently incubated with secondary antibody (Invitrogen, 35552 for DyLight 488-conjugated goat anti-rabbit IgG and 35511 for DyLight 594-conjugated goat anti-mouse IgG) at 37°C for 1 h. Nuclei were finally stained with DAPI for 10 min. For DQ-BSA assay, cells were pre-probed with DQ-BSA Red (10 μg/ml; Thermo Fisher Scientific, D-12051) for 1 h and then treated with 20 μM regorafenib for 24 h. After treatment, cells were fixed with 4% paraformaldehyde (Sigma-aldrich, 158127) in PBS for 30 min. Images were visualized using confocal laser scanning microscopy (Carl Zeiss Microimaging).
TEM (transmission electron microscopy)
Transmission electron microscopy analysis was used to visualize autophagic vesicles. Briefly, U87 cells were fixed in 0.1% glutaraldehyde. After dehydration, ultrathin sections were prepared using a Sorvall MT5000 microtome. Lead citrate and/or uranyl acetate were used to stain the samples. Autophagic vesicles were analyzed by Philips EM420 electron microscopy.
ITC (isothermal titration calorimetry)
The microCal iTC200 calorimeter was used to evaluate the interaction of regorafenib and PSAT1. Regorafenib (240 μM, dissolved in 20 mM Tris-HCl, pH 7.5, and 10 mM NaCl) was titrated into 8 μM rHsPSAT1. The data were fitted in the Origin 7 with the one site-binding model.
Cellular thermal shift assay
Cells grown in the 100 mm dishes were harvested in PBS after regorafenib (20 μM, 6 h) or DMSO treatment. Cells were then subpackaged into 8 PCR tubes, heated at 49, 52, 55, 58, 61, 64, 67, 70°C for 5 min. Next, 3 cycles of freeze-thawing with liquid nitrogen was performed and the samples were centrifugated at 17,000 g for 10 min. Finally, the soluble fractions were analyzed by immunoblotting with anti-PSAT1 antibody.
Measurement of cell proliferation
The long-term effects of regorafenib on GBM cell proliferation were analyzed with a colony formation assay. Briefly, cells were fixed with 4% paraformaldehyde in PBS for 30 min and stained with crystal violet. After washing three times with ddH2O, samples were diluted with 0.1% SDS (Sigma-aldrich, L5750). Absorbance was measured at 570 nm. Cell proliferation was detected using the EdU incorporation assay kit (RiboBio Co., Ltd, C10310). Cells seeded onto 24-well plate were treated as indicated for 24 h and labeled with 10 μM EdU for another 24 h. Cells were then fixed with 4% paraformaldehyde in PBS and stained with reaction cocktail. DAPI was subsequently used for nuclear staining, followed by imaging with a fluorescence microscope.
TMT (tandem mass tags)-labeled proteomics analysis
The TMT-labeled proteomics analysis was performed following the manufacturer’s protocol of TMTsixplex Isobaric Label Reagent Set (Thermo Fisher Scientific, 90061). Briefly, U87 cells treated with DMSO or 20 μM regorafenib for 24 h were harvested and lysed, and subsequently reduced and alkylated with TCEP and IAM. The lysates were then digested with trypsin and labeled with TMT. After labelling, samples were pooled, dried, desalted and then analyzed using a Thermo Scientific Q Exactive plus Hybrid Quadrupole-Orbitrap Mass Spectrometer coupled to Thermo EASY-nLC 1000 Nano HPLC System. Proteins were identified and quantified using Proteome Discoverer 1.2 software (Thermo Scientific).
MRI (magnetic resonance imaging)
A 7T MRI scanner (BRUKER BIOSPEC 70/30, Ettlingen, Germany) was used to visualize the tumor xenografts in mice brain. Mice were anesthetized after 10-daytreatment and placed on the fixation system for imaging. For dead mice, the mouse brain was collected and fixed with 4% paraformaldehyde in PBS before imaging. The following sequence parameters were used: TR (repetition time) = 448.83 ms; TE (echo time) = 14 ms; FA (flip angel) = 180°; matrix size = 256 × 256; FOV (field of view) = 100 × 100 mm; slice thickness = 0.8 mm; spacing between slices = 0.8 mm; number of averages = 2.
Lentiviral transduction
PSAT1-silenced GBM cells were generated by lentiviral infection. HEK293T cells were co-transfected with pSPAX2, pMD2.G and shPSAT1, or the corresponding control shRNA pLKO.1 plasmid. Supernatants of HEK293T were then collected at 24–72 h and filtered (0.45 μm filter). GBM cells were subsequently transduced and selected with DMEM medium containing puromycin (2 μg/ml; Sigma-aldrich, 58–58-2) for 2 weeks. For subcutaneous xenografts, PSAT1-silenced U87 cells were injected into mice within 2 weeks post-selection.
Statistical analysis
Statistical analysis was performed using GraphPad Prism 6.0 software. 2-tailed Student t test was used to analyze statistical differences. Pearson correlation and linear regression were used to determine the concordance. Data were shown as means ± s.d. and significance was described as follows: *, P < 0.05, **, P < 0.01; ***, P < 0.001.
Supplemental Material
Download QuickTime Video (1.5 MB)Supplemental Material
Download QuickTime Video (1.6 MB)Supplemental Material
Download Zip (3.8 MB)Acknowledgments
The authors thank Prof. Mien-Chie Hung for revising the manuscript and his valuable suggestions. We also thank Dr. Chenjiang Zhao and Dr. Xiaolin Ai for establishing the zebrafish xenograft model of human GBM. This work was supported by the Chinese NSFC (81430071, 81602194, 81790251, 81821002 and 81672381) and National 973 Basic Research Program of China (2013CB911300).
Disclosure statement
No potential conflict of interest was reported by the authors.
Supplementary material:
Supplemental data for this article can be accessed here.
Related Research Data
References
- Tanaka S, Louis DN, Curry WT, et al. Diagnostic and therapeutic avenues for glioblastoma: no longer a dead end? Nat Rev Clin Oncol. 2013 Jan;10(1):14–26. PubMed PMID: 23183634.
- Stupp R, Mason WP, van Den Bent MJ, et al. Radiotherapy plus concomitant and adjuvant temozolomide for glioblastoma. N Engl J Med. 2005 Mar 10;352(10):987–996. PubMed PMID: 15758009.
- Aldape K, Zadeh G, Mansouri S, et al. Glioblastoma: pathology, molecular mechanisms and markers. Acta Neuropathol. 2015 Jun;129(6):829–848. PubMed PMID: 25943888.
- Osuka S, Van Meir EG. Overcoming therapeutic resistance in glioblastoma: the way forward. J Clin Invest. 2017 Feb 01;127(2):415–426. PubMed PMID: 28145904; PubMed Central PMCID: PMCPMC5272196.
- Green DR, Levine B. To be or not to be? How selective autophagy and cell death govern cell fate. Cell. 2014 Mar 27;157(1):65–75. PubMed PMID: 24679527; PubMed Central PMCID: PMCPMC4020175.
- Levy JMM, Towers CG, Thorburn A. Targeting autophagy in cancer. Nat Rev Cancer. 2017 Sep;17(9):528–542. PubMed PMID: 28751651.
- Galluzzi L, Bravo-San Pedro JM, Levine B, et al. Pharmacological modulation of autophagy: therapeutic potential and persisting obstacles. Nat Rev Drug Discov. 2017 Jul;16(7):487–511. PubMed PMID: 28529316.
- Mathew R, White E. Autophagy in tumorigenesis and energy metabolism: friend by day, foe by night. Curr Opin Genet Dev. 2011 Feb;21(1):113–119. PubMed PMID: 21255998; PubMed Central PMCID: PMC3039840.
- Galluzzi L, Pietrocola F, Bravo-San Pedro JM, et al. Autophagy in malignant transformation and cancer progression. Embo J. 2015 Apr 1;34(7):856–880. PubMed PMID: 25712477; PubMed Central PMCID: PMC4388596.
- Wang K, Liu R, Li J, et al. Quercetin induces protective autophagy in gastric cancer cells: involvement of Akt-mTOR- and hypoxia-induced factor 1alpha-mediated signaling. Autophagy. 2011 Sep;7(9):966–978. PubMed PMID: 21610320.
- Liu R, Li J, Zhang T, et al. Itraconazole suppresses the growth of glioblastoma through induction of autophagy: involvement of abnormal cholesterol trafficking. Autophagy. 2014 Jul;10(7):1241–1255. PubMed PMID: 24905460; PubMed Central PMCID: PMC4203550.
- Dou Q, Chen HN, Wang K, et al. Ivermectin induces cytostatic autophagy by blocking the PAK1/Akt axis in breast cancer. Cancer Res. 2016 Aug 01;76(15):4457–4469. PubMed PMID: 27302166.
- Miracco C, Cosci E, Oliveri G, et al. Protein and mRNA expression of autophagy gene Beclin 1 in human brain tumours. Int J Oncol. 2007 Feb;30(2):429–436. PubMed PMID: 17203225.
- Yan Y, Xu Z, Dai S, et al. Targeting autophagy to sensitive glioma to temozolomide treatment. J Exp Clin Cancer Res. 2016 Feb 2;35:23. PubMed PMID: 26830677; PubMed Central PMCID: PMCPMC4736617.
- Zanotto-Filho A, Braganhol E, Klafke K, et al. Autophagy inhibition improves the efficacy of curcumin/temozolomide combination therapy in glioblastomas. Cancer Lett. 2015 Mar 28;358(2):220–231. PubMed PMID: 25542083.
- Lee SW, Kim HK, Lee NH, et al. The synergistic effect of combination temozolomide and chloroquine treatment is dependent on autophagy formation and p53 status in glioma cells. Cancer Lett. 2015 May 01;360(2):195–204. PubMed PMID: 25681668.
- Bonora M, Wieckowsk MR, Chinopoulos C, et al. Molecular mechanisms of cell death: central implication of ATP synthase in mitochondrial permeability transition. Oncogene. 2015 Mar 19;34(12):1608. PubMed PMID: 25790189.
- Golden EB, Cho HY, Jahanian A, et al. Chloroquine enhances temozolomide cytotoxicity in malignant gliomas by blocking autophagy. Neurosurg Focus. 2014 Dec;37(6):E12. PubMed PMID: 25434381.
- Geng Y, Kohli L, Klocke BJ, et al. Chloroquine-induced autophagic vacuole accumulation and cell death in glioma cells is p53 independent. Neuro Oncol. 2010 May;12(5):473–481. PubMed PMID: 20406898; PubMed Central PMCID: PMCPMC2940627.
- Snuderl M, Fazlollahi L, Le LP, et al. Mosaic amplification of multiple receptor tyrosine kinase genes in glioblastoma. Cancer Cell. 2011 Dec 13;20(6):810–817. PubMed PMID: 22137795.
- Lin R, Elf S, Shan C, et al. 6-Phosphogluconate dehydrogenase links oxidative PPP, lipogenesis and tumour growth by inhibiting LKB1-AMPK signalling. Nat Cell Biol. 2015 Nov;17(11):1484–1496. PubMed PMID: 26479318; PubMed Central PMCID: PMCPMC4628560.
- Szerlip NJ, Pedraza A, Chakravarty D, et al. Intratumoral heterogeneity of receptor tyrosine kinases EGFR and PDGFRA amplification in glioblastoma defines subpopulations with distinct growth factor response. Proc Natl Acad Sci U S A. 2012 Feb 21;109(8):3041–3046. PubMed PMID: 22323597; PubMed Central PMCID: PMCPMC3286976.
- Bruix J, Qin S, Merle P, et al. Regorafenib for patients with hepatocellular carcinoma who progressed on sorafenib treatment (RESORCE): a randomised, double-blind, placebo-controlled, phase 3 trial. Lancet. 2017 Jan 07;389(10064):56–66. PubMed PMID: 27932229.
- Demetri GD, Reichardt P, Kang YK, et al. Efficacy and safety of regorafenib for advanced gastrointestinal stromal tumours after failure of imatinib and sunitinib (GRID): an international, multicentre, randomised, placebo-controlled, phase 3 trial. Lancet. 2013 Jan 26;381(9863):295–302. PubMed PMID: 23177515; PubMed Central PMCID: PMCPMC3819942.
- Grothey A, Van Cutsem E, Sobrero A, et al. Regorafenib monotherapy for previously treated metastatic colorectal cancer (CORRECT): an international, multicentre, randomised, placebo-controlled, phase 3 trial. Lancet. 2013 Jan 26;381(9863):303–312. PubMed PMID: 23177514.
- Shchors K, Massaras A, Hanahan D. Dual targeting of the autophagic regulatory circuitry in gliomas with repurposed drugs elicits cell-lethal autophagy and therapeutic benefit. Cancer Cell. 2015 Oct 12;28(4):456–471. PubMed PMID: 26412325.
- Tai WT, Chu PY, Shiau CW, et al. STAT3 mediates regorafenib-induced apoptosis in hepatocellular carcinoma. Clin Cancer Res. 2014 Nov 15;20(22):5768–5776. CCR-14-0725. PubMed PMID: 25248379.
- Chen D, Wei L, Yu J, et al. Regorafenib inhibits colorectal tumor growth through PUMA-mediated apoptosis. Clin Cancer Res. 2014 Jul 01;20(13):3472–3484. PubMed PMID: 24763611; PubMed Central PMCID: PMCPMC4079733.
- Pattingre S, Tassa A, Qu X, et al. Bcl-2 antiapoptotic proteins inhibit Beclin 1-dependent autophagy. Cell. 2005 Sep 23;122(6):927–939. PubMed PMID: 16179260.
- Klionsky DJ, Abdelmohsen K, Abe A, et al. Guidelines for the use and interpretation of assays for monitoring autophagy (3rd edition). Autophagy. 2016;12(1):1–222. PubMed PMID: 26799652; PubMed Central PMCID: PMCPMC4835977.
- Moscat J, Diaz-Meco MT. p62 at the crossroads of autophagy, apoptosis, and cancer. Cell. 2009 Jun 12;137(6):1001–1004. PubMed PMID: 19524504; PubMed Central PMCID: PMCPMC3971861.
- Jin L, Chun J, Pan C, et al. The PLAG1-GDH1 axis promotes anoikis resistance and tumor metastasis through CamKK2-AMPK signaling in LKB1-Deficient lung cancer. Mol Cell. 2018 Jan 4;69(1):87–99 e7. PubMed PMID: 29249655; PubMed Central PMCID: PMCPMC5777230.
- Hwang IY, Kwak S, Lee S, et al. Psat1-Dependent fluctuations in alpha-ketoglutarate affect the timing of ESC differentiation. Cell Metab. 2016 Sep 13;24(3):494–501. PubMed PMID: 27476977.
- Kim J, Kundu M, Viollet B, et al. AMPK and mTOR regulate autophagy through direct phosphorylation of Ulk1. Nat Cell Biol. 2011 Feb;13(2):132–141. PubMed PMID: 21258367; PubMed Central PMCID: PMCPMC3987946.
- Mihaylova MM, Shaw RJ. The AMPK signalling pathway coordinates cell growth, autophagy and metabolism. Nat Cell Biol. 2011 Sep;13(9):1016–1023. PubMed PMID: 21892142; PubMed Central PMCID: PMC3249400.
- Aits S, Kricker J, Liu B, et al. Sensitive detection of lysosomal membrane permeabilization by lysosomal galectin puncta assay. Autophagy. 2015;11(8):1408–1424. PubMed PMID: 26114578; PubMed Central PMCID: PMCPMC4590643.
- Xia Q, Wang H, Hao Z, et al. TDP-43 loss of function increases TFEB activity and blocks autophagosome-lysosome fusion. Embo J. 2016 Jan 18;35(2):121–142. PubMed PMID: 26702100; PubMed Central PMCID: PMCPMC4718457.
- Miettinen TP, Bjorklund M. Mevalonate pathway regulates cell size homeostasis and proteostasis through autophagy. Cell Rep. 2015 Dec 22;13(11):2610–2620. PubMed PMID: 26686643; PubMed Central PMCID: PMCPMC4709259.
- Koukourakis MI, Mitrakas AG, Giatromanolaki A. Therapeutic interactions of autophagy with radiation and temozolomide in glioblastoma: evidence and issues to resolve. Br J Cancer. 2016 Mar 01;114(5):485–496. PubMed PMID: 26889975; PubMed Central PMCID: PMCPMC4782209.
- Krakstad C, Chekenya M. Survival signalling and apoptosis resistance in glioblastomas: opportunities for targeted therapeutics. Mol Cancer. 2010 Jun 01;9:135.
- Sun Y, Jiang Y, Huang J, et al. CISD2 enhances the chemosensitivity of gastric cancer through the enhancement of 5-FU-induced apoptosis and the inhibition of autophagy by AKT/mTOR pathway. Cancer Med. 2017 Oct;6(10):2331–2346. PubMed PMID: 28857517; PubMed Central PMCID: PMCPMC5633556.
- Guo Y, Huang C, Li G, et al. Paxilitaxel induces apoptosis accompanied by protective autophagy in osteosarcoma cells through hypoxia-inducible factor-1alpha pathway. Mol Med Rep. 2015 Sep;12(3):3681–3687. PubMed PMID: 26017247.
- Jiang C, Shen F, Du J, et al. Upregulation of CASC2 sensitized glioma to temozolomide cytotoxicity through autophagy inhibition by sponging miR-193a-5p and regulating mTOR expression. Biomed Pharmacother. 2018 Jan;97:844–850. PubMed PMID: 29136760.
- Briceno E, Reyes S, Sotelo J. Therapy of glioblastoma multiforme improved by the antimutagenic chloroquine. Neurosurg Focus. 2003 Feb 15;14(2):e3. PubMed PMID: 15727424.
- Sotelo J, Briceno E, Lopez-Gonzalez MA. Adding chloroquine to conventional treatment for glioblastoma multiforme: a randomized, double-blind, placebo-controlled trial. Ann Intern Med. 2006 Mar 7;144(5):337–343. PubMed PMID: 16520474.
- Xie X, White EP, Mehnert JM. Coordinate autophagy and mTOR pathway inhibition enhances cell death in melanoma. PLoS One. 2013;81:e55096. PubMed PMID: 23383069; PubMed Central PMCID: PMCPMC3559441.
- Rangwala R, Chang YC, Hu J, et al. Combined MTOR and autophagy inhibition: phase I trial of hydroxychloroquine and temsirolimus in patients with advanced solid tumors and melanoma. Autophagy. 2014 Aug;10(8):1391–1402. PubMed PMID: 24991838; PubMed Central PMCID: PMCPMC4203516.
- Rosenfeld MR, Ye X, Supko JG, et al. A phase I/II trial of hydroxychloroquine in conjunction with radiation therapy and concurrent and adjuvant temozolomide in patients with newly diagnosed glioblastoma multiforme. Autophagy. 2014 Aug;10(8):1359–1368. PubMed PMID: 24991840; PubMed Central PMCID: PMCPMC4203513.
- Wick W, Platten M. Understanding and targeting alkylator resistance in glioblastoma. Cancer Discov. 2014 Oct;4(10):1120–1122. PubMed PMID: 25274683.
- Wick W, Weller M, van Den Bent M, et al. MGMT testing–the challenges for biomarker-based glioma treatment. Nat Rev Neurol. 2014 Jul;10(7):372–385. PubMed PMID: 24912512.
- Abu-Remaileh M, Wyant GA, Kim C, et al. Lysosomal metabolomics reveals V-ATPase- and mTOR-dependent regulation of amino acid efflux from lysosomes. Science. 2017 Nov 10;358(6364):807–813. PubMed PMID: 29074583; PubMed Central PMCID: PMCPMC5704967.
- Liu Y, Shoji-Kawata S, Sumpter RM Jr., et al. Autosis is a Na+,K+-ATPase-regulated form of cell death triggered by autophagy-inducing peptides, starvation, and hypoxia-ischemia. Proc Natl Acad Sci U S A. 2013 Dec 17;110(51):20364–20371. PubMed PMID: 24277826; PubMed Central PMCID: PMCPMC3870705.
- Liu Y, Levine B. Autosis and autophagic cell death: the dark side of autophagy. Cell Death Differ. 2015 Mar;22(3):367–376. PubMed PMID: 25257169; PubMed Central PMCID: PMCPMC4326571.
- Yang M, Vousden KH. Serine and one-carbon metabolism in cancer. Nat Rev Cancer. 2016 Oct;16(10):650–662. PubMed PMID: 27634448.
- Vie N, Copois V, Bascoul-Mollevi C, et al. Overexpression of phosphoserine aminotransferase PSAT1 stimulates cell growth and increases chemoresistance of colon cancer cells. Mol Cancer. 2008 Jan 25;7:14. PubMed PMID: 18221502; PubMed Central PMCID: PMCPMC2245978.
- Yang Y, Wu J, Cai J, et al. PSAT1 regulates cyclin D1 degradation and sustains proliferation of non-small cell lung cancer cells. Int J Cancer. 2015 Feb 15;136(4):E39–50. PubMed PMID: 25142862.
- Liu B, Jia Y, Cao Y, et al. Overexpression of phosphoserine aminotransferase 1 (PSAT1) predicts poor prognosis and associates with tumor progression in human esophageal squamous cell carcinoma. Cell Physiol Biochem. 2016;39(1):395–406. PubMed PMID: 27372650.
- De Marchi T, Timmermans MA, Sieuwerts AM, et al. Phosphoserine aminotransferase 1 is associated to poor outcome on tamoxifen therapy in recurrent breast cancer. Sci Rep. 2017 May 18;7(1):2099. PubMed PMID: 28522855; PubMed Central PMCID: PMCPMC5437008.
- Altman BJ, Stine ZE, Dang CV. From Krebs to clinic: glutamine metabolism to cancer therapy. Nat Rev Cancer. 2016 Oct;16(10):619–634. PubMed PMID: 27492215; PubMed Central PMCID: PMCPMC5484415.
- Yan H, Parsons DW, Jin G, et al. IDH1 and IDH2 mutations in gliomas. N Engl J Med. 2009 Feb 19;360(8):765–773. PubMed PMID: 19228619; PubMed Central PMCID: PMCPMC2820383.
- Dang L, Su SM. Isocitrate dehydrogenase mutation and (R)-2-Hydroxyglutarate: from basic discovery to therapeutics development. Annu Rev Biochem. 2017 Jun 20;86:305–331.