
ABSTRACT
Recent studies indicate a causative relationship between defects in autophagy and dopaminergic neuron degeneration in Parkinson disease (PD). However, it is not fully understood how autophagy is regulated in the context of PD. Here we identify USP24 (ubiquitin specific peptidase 24), a gene located in the PARK10 (Parkinson disease 10 [susceptibility]) locus associated with late onset PD, as a novel negative regulator of autophagy. Our data indicate that USP24 regulates autophagy by affecting ubiquitination and stability of the ULK1 protein. Knockdown of USP24 in cell lines and in human induced-pluripotent stem cells (iPSC) differentiated into dopaminergic neurons resulted in elevated ULK1 protein levels and increased autophagy flux in a manner independent of MTORC1 but dependent on the class III phosphatidylinositol 3-kinase (PtdIns3K) activity. Surprisingly, USP24 knockdown also improved neurite extension and/or maintenance in aged iPSC-derived dopaminergic neurons. Furthermore, we observed elevated levels of USP24 in the substantia nigra of a subpopulation of idiopathic PD patients, suggesting that USP24 may negatively regulate autophagy in PD.
Abbreviations: Bafilomycin/BafA: bafilomycin A1; DUB: deubiquitinating enzyme; iPSC: induced pluripotent stem cells; MTOR: mechanistic target of rapamycin kinase; MTORC1: MTOR complex 1; nt: non-targeting; PD: Parkinson disease; p-ATG13: phospho-ATG13; PtdIns3P: phosphatidylinositol 3-phosphate; RPS6: ribosomal protein S6; SNPs: single nucleotide polymorphisms; TH: tyrosine hydroxylase; USP24: ubiquitin specific peptidase 24
Introduction
Macroautophagy (from here referred to as autophagy) is a catabolic process mediating turnover of bulk cytoplasmic constituents including organelles and protein aggregates in a lysosome-dependent manner [Citation1]. Although under some circumstances, especially when lysosomal degradation is blocked, autophagy may contribute to cell death [Citation1], under most physiological and pathological conditions it is a protective mechanism. In fact, autophagy has been shown to play an essential function in protecting organisms from a variety of diseases, including neurodegeneration [Citation2,Citation3] and aging [Citation4].
Parkinson disease (PD) is the second most common age-associated neurodegenerative disease. It is caused by progressive degeneration and death of dopaminergic neurons in the substantia nigra [Citation5] leading to disruption of motor control and manifestations such as tremors, bradykinesia and gait dysfunction [Citation6]. Recent studies indicate a causative relationship between defects in autophagy and PD. In animal models inhibition of autophagy in dopaminergic neurons causes protein aggregation and progressive neuronal loss, leading to decrease in dopamine levels and age-dependent motor deficits [Citation7,Citation8]. Furthermore, dopaminergic neurons with inhibited autophagy become sensitized to stress conditions, which may contribute to PD-like symptoms induced by drugs and environmental toxins [Citation9]. On the other hand, increasing autophagy in dopaminergic neurons is protective in both genetic and neurotoxin-induced PD models [Citation10,Citation11]. Consistent with these data, defects in autophagy are observed in both idiopathic and familial PD patients. Wild-type forms of several genes involved in familial PD, including PRKN/PARK2 (parkin RBR E3 ubiquitin protein ligase), PINK1, LRRK2 and SNCA/α-synuclein [Citation12–Citation16] regulate autophagy. Conversely, disease associated mutations in many of these genes directly lead to autophagy defects. This is thought to contribute to accumulation of pathological protein aggregates and defective organelles such as depolarized mitochondria, and subsequent neuronal cell death [Citation17]. Thus, modulation of autophagy represents an attractive prevention and intervention strategy against PD. However, better understanding of the mechanisms contributing to perturbation of autophagy in both familial and idiopathic PD will be necessary for development of safe and effective treatments.
USP24 (ubiquitin specific peptidase 24) is a poorly characterized gene located on chromosome 1p in the PARK10 (Parkinson disease 10 [susceptibility]) locus associated with late-onset PD [Citation18–Citation22]. Consistent with a potential function for USP24 in PD, non-synonymous single nucleotide polymorphisms (SNPs) in the coding region of this gene affect predisposition to and/or age of onset of PD in diverse populations [Citation20–Citation22]. Based on its sequence, USP24 protein is a deubiqiuitinating enzyme (DUB). Recent data indicate that it may be involved in regulation of DNA damage responses in cancer cells, at least in part by regulating protein stability of p53 [Citation23,Citation24]. However, the mechanism by which USP24 or the PARK10 locus may affect predisposition to PD remains unknown.
In a high-throughput screen of human genome-wide siRNA library we previously identified USP24 as one of the candidate genes involved in mediation and regulation of cellular autophagy [Citation25,Citation26]. Here we demonstrate that USP24 is a negative regulator of autophagy flux. Our data indicate that inhibition of USP24 results in increased stability of the ULK1 (unc-51 like autophagy activating kinase 1) protein, an essential autophagy mediator downstream of MTOR and the adenosine monophosphate-activated protein kinase (AMPK) [Citation27–Citation29]. Increased ULK1 kinase complex activity in turn results in augmented activity of the class III phosphatidylinositol 3-kinase (PtdIns3K) and increased autophagy flux. Importantly, USP24 is able to regulate autophagy in many cell types, including human dopaminergic neurons derived from induced-pluripotent stem cells (iPSC), the cell type most affected in PD. Furthermore, our data demonstrate elevated levels of USP24 in some cases of idiopathic PD, suggesting that USP24 may negatively regulate autophagy in PD.
Results
Ubiquitin-specific peptidase 24 (USP24) is a negative regulator of autophagy
In order to identify genes regulating and mediating mammalian autophagy, we previously performed a high-throughput screen of human genome-wide siRNA library. We identified a total of 236 genes, whose knockdown led to increase or decrease in the levels of cellular autophagy based on quantification of the GFP-LC3 puncta [Citation25,Citation26]. One of the identified hits was the PARK10 gene USP24. The extent of autophagosome accumulation following USP24 knockdown was similar to that observed after knockdown of the known negative regulator of autophagy, MTOR (mechanistic target of rapamycin kinase), suggesting USP24 as a putative negative regulator of autophagy (Figure S1(a)).
In order to confirm the screen data, we used three independent siRNAs to knockdown USP24 in human H4 neuroglioma cells. All three siRNAs led to significant decrease in USP24 mRNA (-b)) and protein expression as compared to non-targeting (nt) siRNA control (-d)). Knockdown of USP24 also led to increase in levels of the autophagosome-associated lipidated form of LC3 (LC3-II) [Citation30] (,e)), confirming increase in autophagy. None of the USP24 siRNAs caused decrease in cell viability as compared to nt, suggesting induction of autophagy following knockdown of USP24 is not associated with cell death (Figure S1(b-c)). In agreement with previous reports indicating that USP24 may de-ubiquitinate the pro-apoptotic BH3 protein BAX [Citation31], we also observed a decrease in BAX protein levels in USP24 knockdown cells (Figure S1(d-e)). Similar data were obtained in HeLa and HEK 293 cells (data not shown).
Figure 1. USP24 is a negative regulator of autophagy. (a) Semi-quantitative RT-PCR demonstrating knockdown of USP24 mRNA with 3 independent siRNA oligonucleotides (# 3, 6, 7, nt – non-targeting siRNA control) in H4 cells 72h after transfection. (b) Quantification of USP24:ACTB from figure (a). (c) Western blot demonstrating decreased USP24 protein levels and accumulation of LC3-II following USP24 knockdown in H4 cells. (d) Quantification of USP24:ACTB from figure (c). (e) Quantification of LC3-II:ACTB from figure (c). (f) Representative images of stable GFP-LC3 expressing H4 cells 72h following USP24 siRNA knockdown demonstrating accumulation of GFP-LC3 positive autophagosomes. Images were acquired at 20X; bar: 25 μm. (g) Quantification of autophagosome intensity per cell area from figure (f). All data are presented as ±SEM. *p < 0.05, **p < 0.01, ***p < 0.001. n = 4–18 (median cell number 568.5/group).
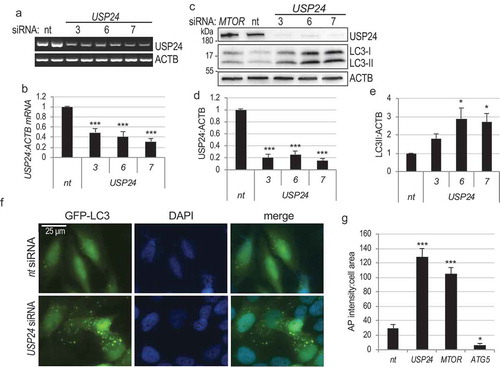
The ability of USP24 to regulate autophagy was confirmed in H4 cells stably expressing the GFP-LC3 reporter. Similar to MTOR, knockdown of USP24 led to significant accumulation of GFP-LC3 positive autophagosomes as compared to nt controls (-g) and S1(f)). As a control for dependence of GFP-LC3 puncta formation on autophagy machinery, knockdown of the essential autophagy mediator ATG5 significantly decreased the GFP-LC3 autophagosomes. () and S1(f)). These data confirm that USP24 is a negative regulator of autophagy in mammalian cells.
USP24 regulates autophagy flux upstream of lysosomes
Accumulation of autophagosomes can be caused by an increase in autophagy initiation or a result of decrease in autophagosome degradation [Citation30]. In order to distinguish between these two possibilities, we performed an autophagy flux assay using lysosomal ATPase inhibitor, bafilomycin A1 (bafilomycin), which blocks lysosomal acidification. USP24 knockdown led to an increase in LC3-II levels as compared to nt control, that were further augmented by bafilomycin treatment (100 nM for 2 or 4 h) (-b) and S2(a-b)). These data suggest that USP24 knockdown increases formation of autophagosomes upstream of the lysosomes.
Figure 2. USP24 regulates autophagy flux upstream of the lysosomes. (a) Accumulation of LC3-II following USP24 knockdown is further increased in the presence of autophagy inhibitor bafilomycin (BafA). H4 cells were transfected with indicated siRNA for 72h and treated with BafA (100 nM) for 4–6 h; nt – non-targeting siRNA. (b) Quantification of LC3-II:ACTB from figure (a). (c) Representative images of H4 GFP-LC3 cells following USP24 knockdown ± BafA treatment demonstrating increased accumulation of GFP-LC3 autophagosomes. Images were acquired at 20X; bar: 25 μm. (d) Quantification of autophagosome intensity from figure (c). (e) Rate of autophagosome-lysosome fusion in increased following USP24 knockdown. Representative images of stable H4 mCHerry-GFP-LC3 dual reporter cells with USP24 knockdown, ± bafilomycin treatment. pH neutral autophagosomes are positive for both GFP and mCherry; acidified autolysosomes are positive for mCherry only. Treatment with BafA was used as a control for dependence on lysosomal acidification. Images were acquired at 60X; bar: 10 μm (f) Quantification of mCherry:GFP intensity from figure (e). Increased mCherry:GFP ratio is indicative of higher autophagy flux. (g) Stability assay demonstrating increased rate of SQSTM1 (p62) protein degradation in cells with USP24 knockdown. Cells were treated with cycloheximide (50 μg/μL) to inhibit protein synthesis. (h) Quantification of SQSTM1:ACTB from figure (g), for the 3-hour time point. All data are presented as ±SEM. *p < 0.05, **p < 0.01, ***p < 0.001. n = 4–9 (median cell number for 20X images 568.5/group median cell number for 60X images 21.5/group).
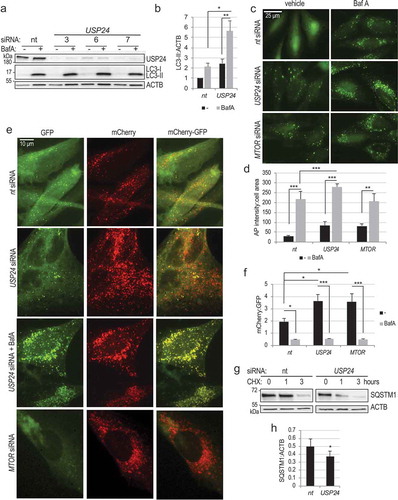
We confirmed results of the flux assay in H4 GFP-LC3 cells. Blocking lysosomal function with bafilomycin led to significant increase in accumulation of GFP-LC3 positive autophagosomes in USP24 knockdown cells, indicating that USP24 is negatively regulating autophagy flux without affecting lysosomal degradation (-d)).
Additionally, we used a tandem mCherry-GFP-LC3 reporter to evaluate autophagy flux. This assay takes advantage of the fact that GFP but not mCherry fluorescence is pH sensitive. Therefore, while pH-neutral autophagosomes are both red and green, pH drop upon fusion with lysosomes causes quenching of the GFP signal and appearance of red-only autolysosomes. USP24 knockdown resulted in significant increase in the ratio of mCherry to GFP signal as compared to nt controls, indicating increased conversion of autophagosomes to autolysosomes (-f)). This was prevented by addition of bafilomycin, confirming dependence on low lysosomal pH.
Finally, we evaluated the ability of USP24 knockdown to increase autophagic degradation. Knockdown of USP24 increased the rate of degradation of the autophagy adaptor protein SQSTM1/p62 (-h)). It also decreased steady state protein levels of SQSTM1 and OPTN, as assessed by western blot and immunofluorescence (Figure S2(c-f)). Decrease in SQSTM1 levels following USP24 knockdown was attenuated in the presence of bafilomycin, confirming dependence on lysosomal degradation ((g-h)). SQSTM1 mRNA levels were not altered in USP24 knockdown cells (Figure S2(i)). All together our data identify USP24 as a negative regulator of autophagy flux.
p53 is not required for regulation of autophagy by USP24
USP24 has been reported to deubiquitinate p53 and thus regulate cellular response to DNA damage [Citation24]. Since p53 can be involved in the regulation of autophagy [Citation32], we investigated whether p53 is necessary for regulation of autophagy by USP24. Knockdown of USP24 failed to prevent stabilization of p53 following etoposide treatment of H4 cells (Figure S3(a)), suggesting that in this cell type USP24 may be dispensable for DNA damage responses or that the very low residual USP24 protein may be sufficient. Levels of TP53 mRNA were also not affected by USP24 knockdown (Figure S3(b)).
To determine if USP24 can regulate autophagy in the absence of p53, we used TP53 deficient K562 human myelogenous leukemia cells. Following USP24 knockdown we observed an increase in the LC3-II levels as well as a decrease in SQSTM1 (Figure S3(c-d)). Accumulation of LC3-II was further enhanced following lysosomal inhibition with bafilomycin (Figure S3(c-d)). Therefore, p53 is not required for induction of autophagy following USP24 knockdown.
USP24 regulates autophagy upstream of the class III PtdIns3K
MTOR complex 1 (MTORC1) kinase is an upstream negative regulator of autophagy in response to nutrient deprivation and other extracellular stimuli [Citation33]. In order to determine whether USP24 functions upstream or downstream of MTOR, we investigated the effects of USP24 knockdown on phosphorylation of the MTORC1 target, the ribosomal protein S6 (RPS6). Unlike MTOR, knockdown of USP24 failed to affect intensity of immunostaining with antibodies against phospho-RPS6 (). Similar results were obtained by western blot against phospho-RPS6 (Figure S4(a)), suggesting that USP24 regulates autophagy downstream or independently of the MTORC1 complex. Knockdown of USP24 was also unable to further increase levels of autophagy in cells treated with MTOR inhibitor, rapamycin (100 nM for 4 hours) (Figure S4(b-c)), consistent with function downstream of MTOR.
Figure 3. USP24 regulates the class III PtdIns3K activity. (a) Representative images of phosopho-RPS6 (P-RPS6) staining in H4 cells following USP24 knockdown, MTOR knockdown, or treatment with 100 nM rapamycin, demonstrating that USP24 does not regulate MTORC1 activity. (b) Quantification of P-RPS6 intensity from (a) (2 independent experiments, 6–12 replicates). (c) Representative images of H4 cells stably expressing the FYVE-dsRed reporter following USP24 knockdown, demonstrating increased accumulation of the class III PtdIns3K product, PtdIns3P. All images were acquired at 20X; bar: 25 μm. (d) Quantification of FYVE-dsRed accumulation in cells with USP24 knockdown from a representative experiment (4–8 replicates). (e) Western blot demonstrating that LC3-II accumulation in USP24 knockdown cells is attenuated following inhibition of the class III PtdIns3K with spautin (20 μM). (f) Quantification of LC3-II:ACTB from figure (e). (g) Representative fluorescence images demonstrating attenuated accumulation of autophagosomes in H4 GFP-LC3 cells with USP24 knockdown after spautin treatment. All images were acquired at 20X; bar: 25 μm. (h) Quantification of autophagosome intensity from figure (g). All data are presented as ±SEM. *p < 0.05, **p < 0.01, ***p < 0.001. n = 3–8 (median cell number 421/group).
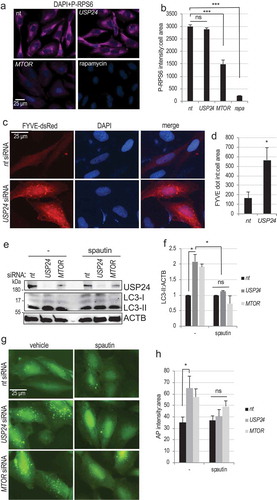
The class III PtdIns3K is an essential upstream regulator of cellular autophagy [Citation1]. Its activity is negatively regulated by MTORC1 and is necessary for autophagosome formation. In order to investigate the effect of USP24 on class III PtdIns3K activity, we utilized H4 cells stably expressing FYVE-dsRED reporter, which binds the class III PtdIns3K product, phosphatidylinositol 3-phosphate (PtdIns3P). USP24 knockdown lead to a significant increase in FYVE-dsRed puncta formation as compared to nt control (-d) and S4(d)). These data suggest that USP24 knockdown stimulates PtdIns3P production.
To determine if activity of the class III PtdIns3K is necessary for the ability of USP24 to regulate autophagy, we treated H4 cells with inhibitors of the class III PtdIns3K activity, spautin and 3-MA. USP24 knockdown lead to increase in the LC3-II levels, which was attenuated in the presence of spautin (20 μM for 5 hours) (-f)) or 3-MA (10 mM for 5 hours) (Figure S4(e)). This was further confirmed by imaging of H4 GFP-LC3 cells, where spautin treatment prevented accumulation of GFP-LC3 positive autophagosomes following USP24 knockdown (-h)). Consistently, in the original screen [Citation25] USP24 knockdown failed to upregulate autophagy in cells overexpressing BCL-2, which binds and inhibits activity of the class III PtdIns3K subunit BECN1 [Citation34] (Figure S4(f)). Together, our data indicate that USP24 regulates autophagy via the class III PtdIns3K but downstream or independently of MTOR.
USP24 regulates stability and activity of ULK1
Since USP24 is a deubiquitinating enzyme, we hypothesized that it may regulate activity of the class III PtdIns3K by affecting the stability of its components. However, we did not detect any changes in protein expression levels of any of the core components of the class III PtdIns3K complex (BECN1, PIK3C3/VPS34, ATG14, data not shown) upon USP24 knockdown. Since stability of the subunits of this complex is coordinately regulated [Citation35], it is unlikely that levels of other components are significantly affected by USP24.
The class III PtdIns3K activity can be positively regulated by the ULK1 protein kinase complex, an essential mediator of autophagy downstream of the MTOR and AMPK pathways [Citation27–Citation29]. Consistent with the involvement of this kinase, knockdown of USP24 led to increase in the levels of the ULK1 protein (-b)). Additionally, we detected increased auto-phosphorylation of the complex subunit ATG13 (,c)), indicating increased kinase activity of the ULK1 complex upon USP24 knockdown.
Figure 4. USP24 regulates protein stability of ULK1. (a) Western blot demonstrating increased levels of ULK1 and phospho-ATG13 (P-ATG13) in cells with USP24 knockdown. (b) Quantification of ULK1:ACTB from figure (a). (c) Quantification of P-ATG13:ACTB from figure (a). (d) Real time q-PCR quantification of ULK1:GAPDH mRNA expression following USP24 knockdown (e) Protein stability assay illustrating that USP24 knockdown decreases the rate of ULK1 degradation. Cells were treated with cycloheximide (50μg/μL) to inhibit protein synthesis. (f) Quantification of ULK1:ACTB from figure (e) at 0 and 3-hour time points. (g) IP demonstrating increased ubiquitination of ULK1 after USP24 knockdown. (h) Quantification of the ubiquitin (HA):ULK1 in figure (g). (i) Western blot demonstrating decreased levels of LC3-II in H4 cells with USP24 knockdown treated with ULK1 inhibitor MRT67307 (10 μM, 4 h) and BafA (100 nM, 3 h), as compared to BafA treatment alone. (j) Quantification of LC3-II:ACTB in BafA and BafA+MRT67307 conditions from figure (i). (k) Western blot demonstrating decreased levels of LC3-II in Hela cells with USP24 knockdown treated with MRT67307 (10 μM, 4 h) and BafA (100 nM, 3 h) as compared to BafA treatment alone. (l) Quantification of LC3-II:ACTB in BafA and BafA+MRT67307 conditions from figure (k). (m) Representative fluorescent images demonstrating attenuated accumulation of autophagosomes in H4 GFP-LC3 cells with USP24 knockdown after MRT68921 treatment. All images were acquired at 20X; bar: 25 μm. (n) Quantification of autophagosome intensity from figure (m). All data are presented as ±SEM. *p < 0.05, **p < 0.01, ***p < 0.001. n = 3–14 (median cell number 43/group).
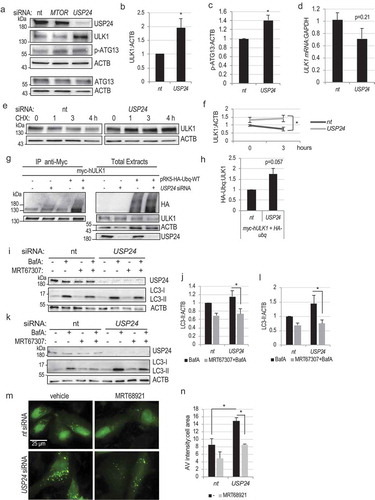
Real time qPCR data revealed no significant change in ULK1 mRNA levels following knockdown of USP24. In fact, we observed a trend towards lower ULK1 mRNA levels in USP24 knockdown cells, however this failed to reach significance (p = 0.21, )). These data indicate that the observed increase in ULK1 protein levels following USP24 knockdown is not due to transcriptional upregulation.
To determine whether increase in the ULK1 protein is caused by its increased stability, we investigated the rate of its degradation. USP24 knockdown decreased degradation of the ULK1 protein in the presence of protein synthesis inhibitor, cycloheximide (-f)). Therefore, stability of ULK1 protein increases in the absence of USP24. ULK1 protein stability and activity are positively regulated by TRAF6-dependent K63 ubiquitination [Citation36]. To determine if USP24 may affect ULK1 ubiquitination we immunoprecipitated myc-tagged ULK1 from HeLa cells co-expressing HA-tagged ubiquitin. We detected increased levels of ULK1 ubiquitination following USP24 knockdown as compared to nt controls (-h)). These data suggest USP24 regulates ULK1 protein stability by affecting its ubiquitination.
To verify that the ability of USP24 to regulate autophagy is dependent on ULK1 function, we treated H4 cells with inhibitors of ULK1 kinase activity, MRT67307 or MRT68921 [Citation28]. As expected, both drugs decreased ULK1 activity as assessed by ATG13 phosphorylation (Figure S4(g)). Both inhibitors attenuated induction of autophagy following USP24 knockdown (-j) and S4(h-i)) as assessed by LC3-II western blot, confirming that ULK1 activity was required. Similar data were obtained in HeLa cells (-l)). Furthermore, MRT68921 attenuated accumulation of autophagosomes in USP24 knockdown GFP-LC3 H4 cells (-n)), further confirming dependence on ULK1 activity.
USP24 can regulate autophagy in human dopaminergic neurons
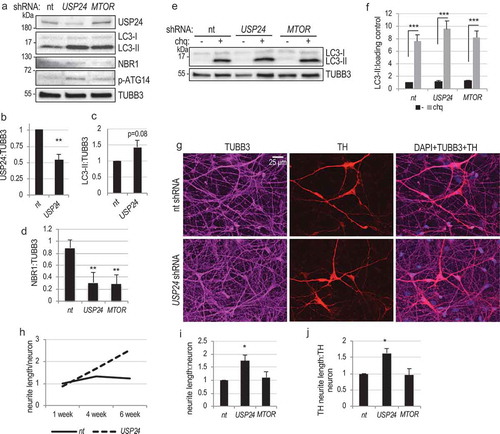
Our data indicate that USP24 is a negative regulator of autophagy. To determine if this may be relevant to PD, we assessed the ability of USP24 to regulate autophagy in iPSC-derived dopaminergic neurons, the cell type most relevant to PD [Citation37–Citation39]. Transduction of iPSC-derived dopaminergic neurons [Citation39,Citation40] with USP24 shRNA lentivirus led to approximately 50% decrease in USP24 protein expression (-b)). This was accompanied by an increase in the levels of LC3-II (,c)) and a decrease in the autophagy adaptor protein, NBR1 (,d)). Accumulation of LC3-II following knockdown of USP24 was further enhanced by the treatment with lysosomal inhibitor chloroquine (-f)). Therefore, USP24 negatively regulates autophagy flux in human iPSC-derived dopaminergic neurons, similarly to what we observed in cell lines. Similar to cell lines, we also observed increase in activating phosphorylation of the class III PtdIns3K subunit ATG14 ()), indicating that USP24 likely regulates autophagy in iPSC-derived neurons through the ULK1-class III PtdIns3K pathway.
Figure 5. USP24 regulates autophagy and neurite length in human iPSC-derived dopaminergic neurons. (a) Western blot illustrating the changes in LC3-II, NBR1, and phospho-ATG14 (P-ATG14) in human iPSC-derived dopaminergic neurons following USP24 knockdown. Dopaminergic precursor cells were differentiated into dopaminergic neurons for 2 wk, transduced with indicated lentiviral shRNAs and evaluated after an additional week in culture. (b) Quantification of USP24:tubulin levels from figure (a). (c) Quantification of LC3-II:tubulin levels from figure (a) (d) Quantification of NBR1:tubulin levels from figure (a) (2 independent experiments; 4–6 replicates) (e and f) Levels of LC3-II following USP24 knockdown are further increased with 100 μM chloroquine (chq) treatment (overnight). (e) Western blot illustrating change in LC3-II levels in human iPSC-derived dopaminergic neurons following USP24 knockdown. (f) Quantification of LC3-II:loading control from figure (e) (4–6 replicates). (g) Representative images of human iPSC-derived neurons at 6 wk after lentiviral transduction, showing increased neurite density in cultures with USP24 knockdown. Cells were transduced with indicated shRNAs; after additional 6 wk cultures were fixed and stained with antibodies against TUBB3/tubulin B3/TUJ1; all neurons) and TH (tyrosine hydroxylase; dopaminergic neurons). Images were acquired at 20X; bar: 25 μm. (h) Quantification of length of neuronal processes over time after lentiviral transduction with indicated shRNAs. All data are normalized to nt shRNA at 1-week time point. Statistical analysis at 1-week time point is presented in Figure S4 and at 6-weeks in (i-j). (i) Quantification of neurite length:neuron from figure (h) at 6-week time point. Data are normalized to nt shRNA at 6-week time point. (j) Quantification of neurite length:neuron for the dopaminergic neurons (TH positive) at 6-week time point. Data are normalized to nt shRNA at 6-week time point. All data are presented as ±SEM. *p < 0.05, **p < 0.01, ***p < 0.001 n = 3–10 (median cell number 634/group).
Long-term knockdown of USP24 increases length of neuronal processes
Since PD is an age-related disease, we investigated the influence of inhibiting USP24 on long-term neuronal cell viability and health. Differentiated iPSC-derived dopaminergic neurons were transduced with USP24 or control nt shRNA and evaluated for up to 6 additional weeks in culture. In young neurons (1 wk after transduction) we did not observe any differences in total cell numbers, numbers of all neurons (stained with TUBB3/TUJ1) or numbers of dopaminergic neurons (stained with antibodies against tyrosine hydroxylase – TH) (Figure S5(a-b)). There were also no significant differences in cell or neuron numbers between the groups as neurons aged (evaluated at 4 and 6 wk after transduction), confirming that similarly to cell lines knockdown of USP24 in iPSC-derived neurons has no negative influence on cell viability () and S5(c-d)).
The length of neuronal processes decreases over time in iPSC-derived dopaminergic neurons from PD patients as compared to healthy controls [Citation41]. Therefore, we evaluated influence of USP24 knockdown on maintenance of neuronal processes. We observed no differences in average neurite lengths between groups of all (TUBB3+) or dopaminergic (TH+) neurons at 1 wk after transduction () and S5(e-f)). Neurite length in neurons transduced with nt shRNA increased slightly at 4 wk, then stabilized and remained unchanged at 6 wk ()). However, the length of all TUBB3+ neurites as well as of TH+ neurites continued to increase throughout duration of the experiment in the USP24 knockdown cultures, becoming significantly greater at 6-weeks (-j)). This suggests that inhibition of USP24 may increase long-term neurite outgrowth and/or maintenance.
Expression of USP24 is elevated in idiopathic PD patient substantia nigra
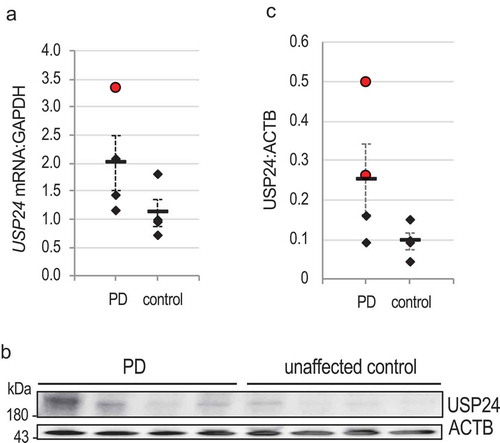
To determine if USP24 may be also involved in idiopathic PD, we evaluated its expression in the brains of PD patients as compared to age matched unaffected controls. Analysis of gene expression array data (NCBI GEO repository [Citation42–Citation44]) revealed increased expression of USP24 mRNA in affected brain regions from subpopulation of PD patients (Figure S6(a-b)). Consistently, quantification of our real time qPCR data confirmed significantly elevated USP24 mRNA expression in the substantia nigra of 1 out of 4 non-familial PD patients as compared to age matched unaffected controls ()). At the protein level, increase in USP24 was observed in 2 out of 4 PD patient substantia nigra as compared to controls (-c)). Therefore, elevated USP24 levels are observed in a subpopulation of idiopathic PD.
Figure 6. USP24 is differentially expressed in PD patient substantia nigra. (a) q-PCR quantification of USP24:GAPDH mRNA expression in PD patient SN versus unaffected control substantia nigra. All data points correspond to individuals (n = 4); group means are indicated with horizontal lines; error bars are SE; red circle marks a major statistical outlier (defined as a value above Q1-Q3 outer fence) with significantly increased expression of USP24 mRNA (z-score = 4.6). (b) Western blot illustrating USP24 protein levels in 4 PD patient and 4 unaffected age matched control human substantia nigra. (c) Quantification of USP24:ACTB levels from figure (b). Red circles mark major statistical outliers with significantly increased USP24 protein expression (z-scores = 4.5 and 11.0).
Discussion
While dysregulation of autophagy has been clearly linked to PD etiology, the mechanisms by which levels of autophagy are altered in PD are not fully understood [Citation45]. Our data demonstrate that the PARK10 gene USP24 is a negative regulator of autophagy flux in cell lines and human iPSC-derived dopaminergic neurons. Together with altered expression of USP24 in PD substantia nigra, this suggests USP24 as a potential novel regulator of autophagy with relevance to PD.
Our data demonstrate that USP24 is an upstream negative regulator of autophagy, acting at the level of autophagosome formation rather than affecting lysosomal function. Furthermore, we determined that USP24 functions downstream or independently of MTOR and regulates autophagy via the ULK1-class III PtdIns3K pathway. Specifically, inhibition of USP24 leads to stabilization of the ULK1 protein and consequent increase in ULK1 kinase activity. As a DUB USP24 is responsible for removing polyubiquitin chains from target proteins [Citation46]. The ULK1-ATG13 and BECN1-PIK3C3/VPS34-AMBRA1 complexes necessary for initiation of autophagosome formation are linked together by a scaffold platform and known to cross regulate each other. When autophagy is induced by the inhibition of MTOR, AMBRA1 becomes dephosphorylated, leading to its activation and interaction with the ubiquitin ligase TRAF6. ULK1 is then ubiquitinated by the TRAF6/AMBRA1 complex with regulatory K-63 chains, leading to its stabilization and activation [Citation36]. ULK1 in turn further phosphorylates and activates components of both its own and the class III PtdIns3K complexes, resulting in a positive regulatory loop. Our data indicate that USP24 knockdown leads to increase in ULK1 ubiquitination, increased ULK1 protein stability and kinase activity. These data suggest that USP24 normally negatively regulates ubiquitination and stability of ULK1, therefore interrupting the positive feed-back amplifying induction of autophagy.
Dysregulation of the both major protein degradation pathways, the autophagy-lysosome system and the ubiquitin proteasome system, has been linked to neurodegeneration. Although initially the two pathways were thought to work independently, recent work has revealed many layers of both positive and negative interaction [Citation47–Citation49]. This includes a number of DUBs such as USP14 that have been implicated in regulation of autophagy and coordination of autophagy and proteasomal function [Citation49]. There is also substantial data demonstrating that ubiquitination and deubiquitination is involved in regulation of the class III PtdIns3K activity and several DUBs have been identified [Citation35,Citation50]. Much less is known about how removal of ubiquitin from ULK1 is controlled. To our knowledge, our data identify USP24 as the first candidate regulator of ULK1 deubiquitination, adding another layer of complexity to the control of ULK1 activity, initiation of cellular autophagy and its interaction with the ubiquitin-proteasome pathway in a context relevant to neurodegeneration. Further experiments will be necessary to determine if this regulation is direct and dependent of USP24 DUB activity.
Our iPSC neuron data demonstrate that USP24 is able to regulate autophagy not only in cell lines but also in human dopaminergic neurons, the cell type most relevant to PD. This suggests USP24 as a potential regulator of autophagy in the context of this disease. The USP24 gene is located on chromosome 1p in the PARK10 locus, which has been associated with PD predisposition and age of onset [Citation21]. Although a number of candidate genes have been identified in the PARK10 locus, the mechanisms of its involvement or a specific gene responsible for the association with PD has not been identified. Our data suggest that USP24 could be a possible candidate gene that, through its effects on cellular autophagy, could mechanistically link the PARK10 locus to the pathology of PD. Both coding and non-coding SNPs in the USP24 gene have been associated with predisposition to PD [Citation21]. Interestingly, some of these polymorphisms are also found in human lung cancer and have been shown to increase USP24 mRNA stability and consequently protein levels [Citation31]. Thus, PD-associated USP24 SNPs could similarly increase USP24 expression, leading to lowering of autophagy flux. Our data indicate that USP24 mRNA and protein levels are also elevated in the substantia nigra of a subset of idiopathic PD patients, suggesting that suppression of autophagy by USP24 could also occur in at least some cases of non-familial PD.
In addition to increasing levels of autophagy, USP24 knockdown also increased neurite length in long-term cultures of human iPSC-derived neurons. Since ULK1 is known to regulate axonal outgrowth in vitro and in vivo [Citation51–Citation53], the effect on neurite outgrowth and/or maintenance could be directly dependent on the increased levels and activity of ULK1 kinase observed following USP24 knockdown. Alternatively, since autophagy is necessary for the maintenance of neuronal health, the increased neurite length could be a result of increased levels of autophagy flux observed following USP24 knockdown. Since neurite length is negatively affected in iPSC-derived dopaminergic neurons from PD patients [Citation41], we hypothesize that inhibiting USP24 may be potentially beneficial for dopaminergic neurite maintenance in PD. However, future experiments will be necessary to evaluate the influence of USP24 on PD patient iPSC-derived neurons.
Materials & methods
Cell culture and treatments
Cell lines
H4 human neuroglioma cells [Citation25,Citation26] were cultured in DMEM (Gibco, 11995065) with 10% heat inactivated Newborn Calf Serum (Sigma-Aldrich, N4762-500ML) and 1% antibiotic-antimycotic (Thermo Fisher Scientific, 15240062). K562 cells were cultured in RPMI 1640 w/L-gln medium (Lonza, 12-702F), 10% fetal bovine serum (Gibco, 10082147), antibiotic-antimycotic (Thermo Fisher Scientific, 15240062). The following drugs were used: bafilomycin A1 (Sigma-Aldrich,B1793: 100 nM: 4–6 h), spautin 1 (R&D Systems, 5197; 20 μM; 4–6 h), rapamycin (Sigma-Aldrich, 37094; 100 nM; 4–6 h), etoposide (Enzo, BML-GR307; 50 μM; 1–6 h), 3-MA (Sigma-Aldrich, M9281; 10 mM; 2–6 h), MRT67307 (Sigma-Aldrich, SML0702-5MG; 10 μM; 1 or 4 h), MRT68921 (Sigma-Aldrich, SML1644-5M; 1 μM; 1 or 4 h). H4-mCherry-GFP-LC3 dual reporter cells were constructed by transducing H4 cells with a mCherry-GFP-LC3 (Addgene, plasmid 22418; Jayanta Debnath Lab) construct cloned into the lentiviral pLESIP vector with NheI and BamHI restriction sites (available through Addgene, plasmid 104941). Routine laboratory tests for mycoplasma were negative.
siRNA transfections
H4 cells were transiently transfected using reverse transfection with HiPerfect Transfection Reagent (Qiagen, 301705) following manufacturer’s instructions, with siRNA at 40 nM final concentration and 1:1 HiPerfect:siRNA vol:vol ratio. K562 cells were double transfected using Lipofectamine 2000 (Invitrogen, 11668027) following the manufacturer’s instructions, with 1ug plasmid and 50 nM final concentration siRNA with a 2:1 Lipofectamine:siRNA vol:vol ratio.
siRNAs
MTOR (Sigma-Aldrich, SASI_Hs01_00203144), MTOR (Dharmacon, D-003008–23) USP24 #3 (Dharmacon, D-006073–03), USP24 #6 (Dharmacon, D-006073–06), USP24 #7 (Dharmacon, D-006073–07), ATG5 (Dharmacon, D-004374–01); control siRNA: Non-Targeting siRNA #5 (Dharmacon, D-001210-05-05) MISSION siRNA Universal Negative Control #1 (Sigma-Aldrich, 45-SIC001).
Lentivirus
Lentivirus was produced in 293T cells following published protocol [Citation54]. Virus was precipitated with PEG-it Virus Precipitation Solution (System Biosciences, LV825A-1).
iPSC dopaminergic precursors culture and treatment
Cell culture and differentiation
Glass bottom plates (MatTek, P35G-1.0–14-C) were coated with Poly-L-ornithine hydrobromide (Sigma-Aldrich, P3655) followed by laminin (Life Technologies, 23017–015). Dopaminergic neuronal precursor cells kit was purchased from XCell Science (XCell Science,DK-001-1V). Cells were plated and differentiated according to the company’s instructions. For long-term cultures cells were maintained in DOPA maturation media with supplement provided in the kit (XCell Science, DM-001-SB50).
Lentiviral transduction
3 wk post-plating differentiated cells were transduced with the GFP-LC3 shRNA (0.5 μL) along with nt, USP24 or MTOR shRNA (0.5 μL), in the presence of 6 μg/mL polybrene (Millipore Sigma, TR-1003-G). Cells were cultured for 1, 3 or 6 wk post transduction, then fixed for staining or lysed for western blot analysis.
shRNA: nt (Sigma-Aldrich, SHC016), pooled USP24 (Sigma-Aldrich, SHCLNG-NM_015306; Clone IDs- 1624; 1023; 2314; 4671), MTOR (Sigma-Aldrich, SHCLNG-NM_004958). GFP-LC3 lentiviral construct was as described [Citation40].
Collecting cell lysates
Where indicated, cells were treated with 100 μM chloroquine overnight (Invitrogen, L10382- component B) before lysis. Samples were lysed in RIPA buffer (TEKnova, R3792) that had 1x mini EDTA-free Protease Inhibitor Cocktail (Sigma-Aldrich, 11836170001) and Phosphatase Inhibitor Cocktail 2 and 3 (Sigma-Aldrich, P5726-5ML; P0044-5ML). Cells were sonicated on ice and centrifuged at 4°C at 20,000 g for 20 min, followed by a BCA assay (Thermo Fisher Scientific, 23225) for protein concentrations.
PCR
Total RNA was extracted using RNeasy mini kit (Qiagen, 74104) followed by cDNA synthesis using the SuperScript III First Strand Synthesis System for RT-PCR (Invitrogen,18080–51). For semi-quantitative PCR the following primers were used: USP24 primers- USP24_4594_r (Integrated DNA Technologies, GCA-ACCCGGCGAATCTCAGCA), USP24_4275_f (Integrated DNA Technologies, CGGCTGCAGGACGGCTTGAT). Actin primers- actin_R (Integrated DNA Technologies, AGACA-GCACTGTGTTGGCTA), actin_F (Integrated DNA Technologies, GACCTGACAGACTACCTCAT). TP53 primers- p53-1234-R (Sigma-Aldrich, CATTCAGCTCTCGGAACATC-TC), p53-526-F (Sigma-Aldrich, GTCTGGGCTTCTTGCAT-TCT). SQSTM1/p62 primers- p62-1691-R (Sigma-Aldrich, CTGGAAGAAGGCAGAGAAACT), p62-1228-F (Sigma-Aldrich, GGAACAGATGGAGTCGGATAAC). For real time q-PCR the following primers were used: ULK1 (Thermo Fisher Scientific, Assay ID Hs00177504_m1) and GAPDH (Thermo Fisher Scientific, Assay ID Hs02786624_g1).
Western blot analysis
Western blotting was performed as described [Citation55,Citation56]. All cell lysates were prepared in Laemmli sample buffer (with Β-mercaptoethanol; Sigma-Aldrich, M6250-250ML), run out on a 4–20% SDS-PAGE gel (Bio-Rad, 4561096) and transferred to a PVDF membrane (Millipore Sigma, IPVH00010). The membranes were blocked in 5% non-fat milk (american bio, AB10109-01000) in TBS (Corning, 46-012-CM) with 0.05% tween 20 buffer (Thermo Fisher Scientific, BP337-500) for 1 h and then incubated with primary antibody overnight at 4°C. Primary antibodies were prepared in 1% BSA (Sigma-Aldrich, A7906-100G) in TBS with 0.05% tween 20. Membranes were incubated for 2 h in HRP-conjugated secondary antibodies (Seracare) in 5% milk at room temperature. The blots were developed using SuperSignal West Dura Extended Duration Substrate (Thermo Fisher Scientific, 34076), SuperSignal West Femto Maximum Sensitivity Substrate (Thermo Fisher Scientific, 34095), or SuperSignal West Pico Chemiluminescent Substrate (Thermo Fisher Scientific, 34080) and imaged on the ChemiDoc developer system (Bio-Rad). The band intensity was quantified by Image Lab Software (Bio-Rad). Primary antibodies: LC3 (Novus Biologicals, NB100-220; 1:1000), USP24 (Proteintech, 13126–1-AP, 1:1000), ACTB/β-Actin (Sigma-Aldrich, A1978; 1:10,000), SQSTM1 (BD Biosciences, 610832; 1:1000), ULK1 (Cell Signaling Technology, 8054; 1:1000), phospho-ATG13 (Rockland antibodies & assays, 600–401-C49S; 1:1000), NBR1 (Cell Signaling Technology, 9891; 1:1000), phospho-ATG14 (Cell Signaling Technology, 13155; 1:1000), TUBB3/tubulin B3 (TUJ1; BioLegend, 801202; 1:1000), SNCA/α-synuclein (Cell Signaling Technology, 2642; 1:1000), BAX (Cell Signaling Technology, 2772; 1:1000), OPTN (Proteintech, 10837-1-AP; 1:1000), TP53/p53 (Cell Signaling Technology, 9282; 1:1000), USP24 (Bethyl Laboratories, A300-938A; 1:1000), HA-Tag (Cell Signaling Technology, 3724S; 1:1000), ATG13 (Cell Signaling Technology, 13273S; 1:1000). Secondary antibodies: goat anti-rabbit IgG (H + L) (Seracare, 5450–0010; 1:2500) and goat anti-mouse IgG (H + L) (Seracare, 5450–0011; 1:2500).
Stability assay
Seventy-two h after siRNA transfection the cells were treated with 50 μg/mL cycloheximide (Sigma Aldrich, C1988) for 0, 1, 3 or 4 h and lysed for western blot analysis.
Immunoprecipitation (IP)
HeLa cells were transfected with siRNA as above, followed 48 h later by transfections with plasmids using Lipofectamine (Invitrogen, 11668027) and total 1ug of plasmid DNA per manufacturer’s instructions. After additional 24 h in culture cells were lysed in IP buffer, pre-cleared with with Pierce Protein A/G/Agarose Beads (Thermo Fisher Scientific, 20421) for 1 h and incubated with primary antibody rotating overnight at 4 degrees C. Agarose beads were added and incubated for 1–2 h rotating at 4 degrees C. Beads were washed 4 times and samples were eluted in Laemmli sample buffer followed by western blot analysis. The following plasmids were used: myc-hULK1 (Addgene, 31961; Do-Hyung Kim Lab) and pRK5-HA-Ubiquitin-WT (Addgene, 17608; Ted Dawson Lab). IP antibody: MYC-Tag (Cell Signaling Technology, 2276S; 1:1000).
Immunocytochemistry
Cells were cultured on glass coverslips or glass bottom chamber plates for the iPSC and fixed with 4% PFA. They were incubated in 8% FBS in PBS (Corning, 21–040-CMR) for 1 hour at room temperature followed by permeabilization with 0.2% saponin (Sigma-Aldrich, S7900) and addition of primary antibodies. Cells were incubated at 4°C overnight in the primary antibodies and in the secondary antibodies in the blocking solution + 0.2% saponin for 2 h at room temperature [Citation40]. Nuclei were stained with DAPI (Sigma-Aldrich, D9542). Primary antibodies: Tubulin B3 (TUBB3) TUJ1 (BioLegend, 801202; 1:200), Tyrosine Hydroxylase (Novus Biologicals, NB300-109; 1:200), Phospho-S6 (Cell Signaling Technology, 5364; 1:100). Secondary antibodies: Alexa Fluor 633 goat anti-rabbit IgG (H + L) (Invitrogen, A21071; 1:500), Alexa Fluor 546 goat anti-rabbit IgG (H + l) (Invitrogen, A11035; 1:500), Alexa Fluor 633 goat anti- mouse IgG (H + L) (Invitrogen, A21052; 1:500).
Image acquisition and quantification
All images were acquired on a fluorescent Nikon Ti-E inverted microscope at 20X (CFI Plan APO VC 20X NA 0.75 WD 1 mm) or at 60X (CFI Plan APO VC 60X NA 1.4 Oil) as z-stacks and focused using extended depth of focus module of the Nikon Elements software. All images within each experiment were acquired at the same microscope settings (magnification, exposure times, light source settings, etc). Images were quantified using automated unbiased algorithms (General Analysis + macros for automation) in Elements (NIS-Elements AR Analysis 4.2.01 64-bit) as described [Citation55]. Briefly, nuclei were identified using Spot Detection; cell area was identified using Detect Regional Maxima followed by global thresholding; intracellular puncta (GFP-LC3, FYVE-dsRed, etc) were identified using Spot Detection and normalized to cell area. All quantification measurements were performed on original unaltered images. Median cell number for 20x images was 494.75 analyzed cells/group and for 60x images 21.5 cells/group. All iPSC quantification was preformed blindly.
Cell viability
MTT assay
Cell viability was determined by a MTT assay (Invitrogen, V13154) according to the manufacturer’s instructions [Citation57]. Propidium iodide: Cell viability was determined by propidium iodide (PI) staining according to the manufacturer’s instructions (Thermo Fisher,00-6990-50), followed by FACS analysis [Citation58].
Human brain samples
A total of 8 de-identified substantia nigra samples (4 PD patient and 4 unaffected control) were obtained from the Maryland Brain Bank. The age of the PD patients ranged from 63 to 76 y old (average 72 y old) and comprised 3 males and 1 female. The age of the control donors ranged from 79 to 86 y old (average age of 83 y old), all male.
Western blot
Samples were re-suspended in RIPA buffer and homongenized on ice. Protein concentrations were normalized by BCA assay. Samples were diluted in appropriate amounts of RIPA and Laemmli sample buffer.
q-PCR
Total RNA was isolated using the RNeasy Mini Kit (Qiagen, QGN-74104) and converted into cDNA using the Verso™ cDNA Kit (Thermo Scientific, AB1453B) as per the manufacturers’ instructions. cDNA TaqMan® Universal Master Mix II (Applied Biosystems, 4440040) was used to perform quantitative real-time PCR amplification. Briefly, reactions were performed in duplicate by mixing 2 × TaqMan® Universal Master Mix II, 1μL of cDNA (corresponding to 50ng RNA/reaction) and 20 × TaqMan® Gene Expression Assay, in a final volume of 20μL. TaqMan® Gene Expression assays for the following genes were used for human: Gapdh (Applied Biosystems, Hs02786624_g1) and USP24 (Applied Biosystems, Hs00420009_m1). Reactions were amplified and quantified by using a QuantStudio 6 Flex (Applied Biosystems). The PCR profile consisted of 1 cycle at 50°C for 2 min and 95°C for 10 min, followed by 40 cycles at 95°C for 15 s and 60°C for 1 min. Gene expression was normalized to Gapdh, and the relative quantity of mRNA was calculated based on the comparative Ct method.
Statistical analysis
All results are expressed as mean ± SEM. Unless otherwise specified, each experiment was repeated independently at least 3 times; ‘n’ is the number of experimental replicates. Statistical analysis was performed on GraphPad Prism7 for Windows (GraphPad Software, La Jolla, CA). ANOVA followed by the appropriate post hoc (Tukey’s multiple comparisons test, Dunnett’s multiple comparison test, Newman-Keuls multiple comparisons test, or Holm-Sidak’s multiple comparisons test) was performed on experiments with more than 2 groups. For experiments with only 2 groups two-tailed unpaired Student’s t-test was performed. A p-value ≤ 0.05 was considered significant [Citation55,Citation59]. Statistical outliers were identified using the quartile method with values above Q3+(Q3-Q1)x3 considered significant (major outliers). Z-scores were calculated based on unaffected population mean and SD [Citation25].
Supplemental Material
Download Zip (2.5 MB)Acknowledgments
The original siRNA screen identifying USP24 as a regulator of autophagy was performed in the laboratory of Dr. Junying Yuan (Harvard Medical School, Boston, MA). We would like to thank Dr. Curt Civin and Dr. Tami Kingsbury (University of Maryland, Baltimore, MD) for the K562 cells and for technical advice on use and generation of lentivirus and on real-time qPCR and Mr. Niaz Khan for technical help with FACS analysis.
Disclosure statement
No potential conflict of interest was reported by the authors.
Supplemental material
Supplemental data for this article can be accessed here.
Additional information
Funding
Related Research Data
References
- Levine B, Klionsky DJ. Development by self-digestion: molecular mechanisms and biological functions of autophagy. Dev Cell. 2004 Apr;6(4):463–477. PubMed PMID: 15068787.
- Hara T, Nakamura K, Matsui M, et al. Suppression of basal autophagy in neural cells causes neurodegenerative disease in mice. Nature. 2006 Jun 15;441(7095):885–889. PubMed PMID: 16625204.
- Komatsu M, Waguri S, Chiba T, et al. Loss of autophagy in the central nervous system causes neurodegeneration in mice. Nature. 2006 Jun 15;441(7095):880–884. PubMed PMID: 16625205.
- Mizushima N, Levine B, Cuervo AM, et al. Autophagy fights disease through cellular self-digestion. Nature. 2008 Feb 28;451(7182):1069–1075. PubMed PMID: 18305538; eng.
- Lesage S, Brice A. Role of mendelian genes in “sporadic” Parkinson‘s disease. Parkinsonism Relat Disord. 2012 Jan;18 Suppl 1:S66–S70. PubMed PMID: 22166458; eng.
- Badger JL, Cordero-Llana O, Hartfield EM, et al. Parkinson‘s disease in a dish - using stem cells as a molecular tool. Neuropharmacology. 2014 Jan;76 Pt A:88–96. PubMed PMID: 24035919; eng.
- Sato S, Hattori N. Dopaminergic neuron-specific autophagy-deficient mice. Methods Mol Biol. 2018;1759:173–175. PubMed PMID: 29804260; eng.
- Sato S, Uchihara T, Fukuda T, et al. Loss of autophagy in dopaminergic neurons causes Lewy pathology and motor dysfunction in aged mice. Sci Rep. 2018 Feb 12;8(1):2813. PubMed PMID: 29434298; PubMed Central PMCID: PMCPMC5809579. eng.
- Castino R, Lazzeri G, Lenzi P, et al. Suppression of autophagy precipitates neuronal cell death following low doses of methamphetamine. J Neurochem. 2008 Aug;106(3):1426–1439. PubMed PMID: 18489716; eng.
- Hu ZY, Chen B, Zhang JP, et al. Up-regulation of autophagy-related gene 5 (ATG5) protects dopaminergic neurons in a zebrafish model of Parkinson‘s disease. J Biol Chem. 2017 Nov 3;292(44):18062–18074. PubMed PMID: 28928221; PubMed Central PMCID: PMCPMC5672032. eng.
- Hu X, Song Q, Li X, et al. Neuroprotective effects of Kukoamine A on neurotoxin-induced Parkinson‘s model through apoptosis inhibition and autophagy enhancement. Neuropharmacology. 2017 May 1;117:352–363. PubMed PMID: 28238714; eng.
- Tsika E, Moore DJ. Mechanisms of LRRK2-mediated neurodegeneration. Curr Neurol Neurosci Rep. 2012 Jun;12(3):251–260. PubMed PMID: 22441981; eng.
- Narendra D, Tanaka A, Suen DF, et al. Parkin is recruited selectively to impaired mitochondria and promotes their autophagy. J Cell Biol. 2008 Dec 1;183(5):795–803. PubMed PMID: 19029340; PubMed Central PMCID: PMC2592826. eng.
- Narendra DP, Jin SM, Tanaka A, et al. PINK1 is selectively stabilized on impaired mitochondria to activate Parkin. PLoS Biol. 2010 Jan;8(1):e1000298. PubMed PMID: 20126261; eng.
- Vives-Bauza C, Zhou C, Huang Y, et al. PINK1-dependent recruitment of Parkin to mitochondria in mitophagy. Proc Natl Acad Sci U S A. 2010 Jan 5;107(1):378–383. PubMed PMID: 19966284; eng.
- Geisler S, Holmstrom KM, Skujat D, et al. PINK1/Parkin-mediated mitophagy is dependent on VDAC1 and p62/SQSTM1. Nat Cell Biol. 2010 Feb;12(2):119–131. PubMed PMID: 20098416; eng.
- Vives-Bauza C, Przedborski S. Mitophagy: the latest problem for Parkinson‘s disease. Trends Mol Med. 2011 Mar;17(3):158–165. PubMed PMID: 21146459; eng.
- Hicks AA, Petursson H, Jonsson T, et al. A susceptibility gene for late-onset idiopathic Parkinson‘s disease. Ann Neurol. 2002 Nov;52(5):549–555. PubMed PMID: 12402251; eng.
- Oliveira SA, Li YJ, Noureddine MA, et al. Identification of risk and age-at-onset genes on chromosome 1p in Parkinson disease. Am J Hum Genet. 2005 Aug;77(2):252–264. PubMed PMID: 15986317; eng.
- Haugarvoll K, Toft M, Skipper L, et al. Fine-mapping and candidate gene investigation within the PARK10 locus. Eur J Hum Genet. 2009 Mar;17(3):336–343. PubMed PMID: 18854859; eng.
- Li Y, Schrodi S, Rowland C, et al. Genetic evidence for ubiquitin-specific proteases USP24 and USP40 as candidate genes for late-onset Parkinson disease. Hum Mutat. 2006 Oct;27(10):1017–1023. PubMed PMID: 16917932; eng.
- Wu YR, Chen CM, Chen YC, et al. Ubiquitin specific proteases USP24 and USP40 and ubiquitin thiolesterase UCHL1 polymorphisms have synergic effect on the risk of Parkinson‘s disease among Taiwanese. Clin Chim Acta. 2010 Jul 4;411(13–14):955–958. PubMed PMID: 20302855; eng.
- Zhang L, Lubin A, Chen H, et al. The deubiquitinating protein USP24 interacts with DDB2 and regulates DDB2 stability. Cell Cycle. 2012 Dec 1;11(23):4378–4384. PubMed PMID: 23159851; eng.
- Zhang L, Nemzow L, Chen H, et al. The deubiquitinating enzyme USP24 is a regulator of the UV damage response. Cell Rep. 2015 Jan 13;10(2):140–147. PubMed PMID: 25578727; PubMed Central PMCID: PMC4359050.
- Lipinski MM, Hoffman G, Ng A, et al. Multiple mTORC1 independent signaling pathways regulate autophagy through type III PI3 kinase under normal nutritional conditions. Dev Cell. 2010;18:1041–1052.
- Lipinski MM, Zheng B, Lu T, et al. A genome-wide analysis reveals differential regulation of autophagy in normal brain aging and in Alzheimer’s disease. Proc Natl Acad Sci U S A. 2010 Aug 10;107(32):14164–14169. PubMed PMID: 20660724; eng.
- Egan DF, Chun MG, Vamos M, et al. Small molecule inhibition of the autophagy kinase ULK1 and identification of ULK1 substrates. Mol Cell. 2015 Jul 16;59(2):285–297. PubMed PMID: 26118643; PubMed Central PMCID: PMCPMC4530630. eng.
- Petherick KJ, Conway OJ, Mpamhanga C, et al. Pharmacological inhibition of ULK1 kinase blocks mammalian target of rapamycin (mTOR)-dependent autophagy. J Biol Chem. 2015 May 1;290(18):11376–11383. PubMed PMID: 25833948; PubMed Central PMCID: PMCPMC4416842. eng.
- Wong PM, Puente C, Ganley IG, et al. The ULK1 complex: sensing nutrient signals for autophagy activation. Autophagy. 2013 Feb 1;9(2):124–137. PubMed PMID: 23295650; PubMed Central PMCID: PMCPMC3552878. eng.
- Klionsky DJ, Abdalla FC, Abeliovich H, et al. Guidelines for the use and interpretation of assays for monitoring autophagy. Autophagy. 2012 Apr;8(4):445–544. PubMed PMID: 22966490; PubMed Central PMCID: PMC3404883. eng.
- Wang SA, Wang YC, Chuang YP, et al. EGF-mediated inhibition of ubiquitin-specific peptidase 24 expression has a crucial role in tumorigenesis. Oncogene. 2016 Dec 19. DOI:10.1038/onc.2016.445. PubMed PMID: 27991932.
- Klionsky DJ, Abdelmohsen K, Abe A, et al. Guidelines for the use and interpretation of assays for monitoring autophagy (3rd edition). Autophagy. 2016;12(1):1–222. PubMed PMID: 26799652; PubMed Central PMCID: PMC4835977.
- Kim J, Kundu M, Viollet B, et al. AMPK and mTOR regulate autophagy through direct phosphorylation of Ulk1. Nat Cell Biol. 2011 Feb;13(2):132–141. PubMed PMID: 21258367; PubMed Central PMCID: PMC3987946.
- Pattingre S, Levine B. Bcl-2 inhibition of autophagy: a new route to cancer? Cancer Res. 2006 Mar 15;66(6):2885–2888. PubMed PMID: 16540632.
- Liu J, Xia H, Kim M, et al. Beclin1 controls the levels of p53 by regulating the deubiquitination activity of USP10 and USP13. Cell. 2011 Sep 30;147(1):223–234. PubMed PMID: 21962518; eng.
- Nazio F, Strappazzon F, Antonioli M, et al. mTOR inhibits autophagy by controlling ULK1 ubiquitylation, self-association and function through AMBRA1 and TRAF6. Nat Cell Biol. 2013 Apr;15(4):406–416. PubMed PMID: 23524951.
- Swistowski A, Peng J, Liu Q, et al. Efficient generation of functional dopaminergic neurons from human induced pluripotent stem cells under defined conditions. Stem Cells. 2010 Oct;28(10):1893–1904. PubMed PMID: 20715183; PubMed Central PMCID: PMC2996088. eng.
- Shaltouki A, Sivapatham R, Pei Y, et al. Mitochondrial alterations by PARKIN in dopaminergic neurons using PARK2 patient-specific and PARK2 knockout isogenic iPSC lines. Stem Cell Reports. 2015 May 12;4(5):847–859. PubMed PMID: 25843045; PubMed Central PMCID: PMC4437475.
- Awad O, Panicker LM, Deranieh RM, et al. Altered differentiation potential of Gaucher‘s disease iPSC neuronal progenitors due to Wnt/beta-catenin downregulation. Stem Cell Reports. 2017 Dec 12;9(6):1853–1867. PubMed PMID: 29198828.
- Awad O, Sarkar C, Panicker LM, et al. Altered TFEB-mediated lysosomal biogenesis in Gaucher disease iPSC-derived neuronal cells. Hum Mol Genet. 2015 Jul 28;24:5775–5788. PubMed PMID: 26220978.
- Sanchez-Danes A, Richaud-Patin Y, Carballo-Carbajal I, et al. Disease-specific phenotypes in dopamine neurons from human iPS-based models of genetic and sporadic Parkinson‘s disease. EMBO Mol Med. 2012 May;4(5):380–395. PubMed PMID: 22407749; eng.
- Moran LB, Duke DC, Deprez M, et al. Whole genome expression profiling of the medial and lateral substantia nigra in Parkinson‘s disease. Neurogenetics. 2006 Mar;7(1):1–11. PubMed PMID: 16344956; eng.
- Duke DC, Moran LB, Pearce RK, et al. The medial and lateral substantia nigra in Parkinson‘s disease: mRNA profiles associated with higher brain tissue vulnerability. Neurogenetics. 2007 Apr;8(2):83–94. PubMed PMID: 17211632; eng.
- Lewandowski NM, Ju S, Verbitsky M, et al. Polyamine pathway contributes to the pathogenesis of Parkinson disease. Proc Natl Acad Sci U S A. 2010 Sep 28;107(39):16970–16975. PubMed PMID: 20837543; PubMed Central PMCID: PMCPMC2947879. eng.
- Maiti P, Manna J, Dunbar GL. Current understanding of the molecular mechanisms in Parkinson‘s disease: targets for potential treatments. Transl Neurodegener. 2017;6:28. PubMed PMID: 29090092; PubMed Central PMCID: PMCPMC5655877. eng.
- Wang YC, Wang SA, Chen PH, et al. Variants of ubiquitin-specific peptidase 24 play a crucial role in lung cancer malignancy. Oncogene. 2016 Jul 14;35(28):3669–3680. PubMed PMID: 26568301; eng.
- Lenzi P, Lazzeri G, Biagioni F, et al. The autophagoproteasome a novel cell clearing organelle in baseline and stimulated conditions. Front Neuroanat. 2016;10:78. PubMed PMID: 27493626; PubMed Central PMCID: PMCPMC4955296. eng.
- Pasquali L, Ruggieri S, Murri L, et al. Does autophagy worsen or improve the survival of dopaminergic neurons? Parkinsonism Relat Disord. 2009 Dec;15 Suppl 4:S24–S27. PubMed PMID: 20123552; eng.
- Kim E, Park S, Lee JH, et al. Dual function of USP14 deubiquitinase in cellular proteasomal activity and autophagic flux. Cell Rep. 2018 Jul 17;24(3):732–743. PubMed PMID: 30021169; eng.
- Abrahamsen H, Stenmark H, Platta HW. Ubiquitination and phosphorylation of Beclin 1 and its binding partners: tuning class III phosphatidylinositol 3-kinase activity and tumor suppression. FEBS Lett. 2012 Jun 4;586(11):1584–1591. PubMed PMID: 22673570; eng.
- Ribas VT, Schnepf B, Challagundla M, et al. Early and sustained activation of autophagy in degenerating axons after spinal cord injury. Brain Pathol. 2014 Jul 8. DOI:10.1111/bpa.12170. PubMed PMID: 25040536.
- Tomoda T, Bhatt RS, Kuroyanagi H, et al. A mouse serine/threonine kinase homologous to C. elegans UNC51 functions in parallel fiber formation of cerebellar granule neurons. Neuron. 1999 Dec;24(4):833–846. PubMed PMID: 10624947; eng.
- Mochizuki H, Toda H, Ando M, et al. Unc-51/ATG1 controls axonal and dendritic development via kinesin-mediated vesicle transport in the Drosophila brain. PloS one. 2011 May 12;6(5):e19632. PubMed PMID: 21589871; PubMed Central PMCID: PMCPMC3093397. eng.
- Tan YS, Kim M, Kingsbury TJ, et al. Regulation of RAB5C is important for the growth inhibitory effects of MiR-509 in human precursor-B acute lymphoblastic leukemia. PloS one. 2014;9(11):e111777. PubMed PMID: 25368993; PubMed Central PMCID: PMC4219775.
- Sarkar S, Zhao Z, Aungst S, et al. Impaired autophagy flux is associated with neuronal cell death after TBI. Autophagy. 2014;10(12):2208–2222.
- Liu S, Li Y, Choi HMC, et al. Lysosomal damage after spinal cord injury causes accumulation of RIPK1 and RIPK3 proteins and potentiation of necroptosis. Cell Death Dis. 2018 Apr 23;9(5):476. PubMed PMID: 29686269; eng.
- Mosmann T. Rapid colorimetric assay for cellular growth and survival: application to proliferation and cytotoxicity assays. J Immunol Methods. 1983 Dec 16;65(1–2):55–63. PubMed PMID: 6606682; eng.
- Riccardi CNI. Analysis of apoptosis by propidium iodide staining and flow cytometry. Nat Protoc. 2006 Nov 9;1:1458–1461.
- Liu S, Sarkar C, Dinizo M, et al. Disrupted autophagy after spinal cord injury is associated with ER stress and neuronal cell death. Cell Death Dis. 2015 Jan 08;6:e1582. PubMed PMID: 25569099; PubMed Central PMCID: PMCPMC4669738.