
ABSTRACT
Cells are faced with various stresses during their growth and development, and autophagy is a degradative process in which cells can break down their own components to recycle macromolecules and provide energy under these stresses. For pathogenic fungi that utilize cell wall as the first barrier against external stress, the cell wall integrity (CWI) pathway also provides an essential role in responding to these stresses. However, the specific connection between autophagy and CWI remains elusive in either the model fungi including budding yeast Saccharomyces cerevisiae or the rice blast fungus Magnaporthe oryzae. Here, we provided evidence that the endoplasmic reticulum (ER) stress is highly induced during M. oryzae infection and that CWI MAP kinase kinase MoMkk1 (S. cerevisiae Mkk1/2 homolog) was subject to phosphorylation regulation by MoAtg1, the only identified kinase in the core autophagy machinery. We also identified MoMkk1 serine 115 as the MoAtg1-dependent phosphorylation site and this phosphorylation could activate CWI, similar to that by the conserved MAP kinase kinase kinase MoMck1 (S. cerevisiae Bck1 homolog). Together with the first report of MoMkk1 subjects to phosphorylation regulation by MoAtg1, we revealed a new mechanism by which autophagy coordinates with CWI signaling under ER stress, and this MoAtg1-dependent MoMkk1 phosphorylation is essential for the pathogenicity of M. oryzae.
Abbreviations: A/Ala: alanine; Atg: autophagy-related; Bck1: bypass of C kinase 1; co-IP: co-immunoprecipitation; CWI: cell wall integrity;DTT: dithiothreitol; ER: endoplasmic reticulum; GFP: green fluorescent protein; Mo: Magnaporthe oryzae; MAPK: mitogen-activated protein kinase; Mkk1: mitogen-activated protein kinase-kinase 1; MS: mass spectrometry; PAS: phagophore assembly site; RFP: red fluorescent protein; RT: room temperature; S/Ser: serine; Slt2: suppressor of the lytic phenotype 2; T/Thr: threonine; UPR: unfolded protein response; Y2H: yeast two-hybrid screen.
Introduction
In the less complex eukaryotic organisms such as fungi, the cell wall integrity (CWI) signaling pathway is one of the most pivotal transmission mechanisms to respond and adapt to diverse environmental conditions, including sudden changes in osmolality, pH, temperature, and nutrient availability [Citation1]. In the budding yeast Saccharomyces cerevisiae, the CWI pathway is activated through a family of cell surface sensors, including Slg1/Wsc1, Wcs2, Wsc3, Mid2, and Mtl1 that couple to the small G-protein Rho1 upon cell wall stress signals. Rho1 then activates the MAPK (Pkc1 [protein kinase C]-activated mitogen-activated protein kinase) cascade, including an upstream kinase MAP kinase kinase kinase (Bck1), a pair of redundant MAP kinase kinases (Mkk1 and Mkk2), and a MAP kinase (Slt2/Mpk1) [Citation2,Citation3]. The cascade subsequently regulates the nuclear localization and thus the activities of the transcription factors Rlm1 and SBF complex (Swi4 and Swi6) that govern the expression of cell wall biosynthetic genes and cell cycle, respectively [Citation4]. In the rice blast fungus Magnaporthe oryzae, a Pkc1 homolog was found to be essential for growth and development with extensive downstream targets such as the CWI pathway [Citation5]. The conserved components of the MAPK cascade MoMck1 (Bck1 homolog), MoMkk1 (Mkk1/2 homolog), and MoMps1 (Slt2/Mpk1 homolog) were all found to be important for normal CWI signaling and pathogenicity [Citation6–Citation8]. The CWI pathway and function remain largely conserved among other fungi, although the biological functions of specific components may be different among diverse species [Citation9–Citation14].
M. oryzae is hemi-biotrophic fungus undergoing an initial biotrophic stage prior to switching to a necrotrophic stage that promotes plant cell death [Citation15]. During the biotrophic stage of infection, the fungus synthesizes and secretes a repertoire of effector proteins to suppress plant immunity and manipulate host cell physiology for the next stages of infection [Citation16]. Meanwhile, most of secreted and transmembrane proteins are synthesized, folded and matured at the endoplasmic reticulum (ER) [Citation17]. However, as much as a third of newly synthesized proteins fail to achieve native structures correctly owing to imperfections in transcription, translation, post-translational modifications or protein folding [Citation18]. Thus, an inevitable consequence of the high rate of protein synthesis is the accumulation of misfolded proteins in ER. To counteract this, cells activate the unfolded protein response (UPR) pathway to degrade these misfolded proteins [Citation19].
Macroautophagy/autophagy is a highly conserved catabolic process in the eukaryotic cells, responsible for vacuolar (lysosomal) degradation of proteins, membranes and organelles according to functional and energetic needs under environmental stress or pathogen invasion [Citation20–Citation22]. Some key regulators in these two processes (the UPR pathway and autophagy) have been well studied in both human and S. cerevisiae [Citation23–Citation30], and the both processes are essential for the pathogenicity of M. oryzae [Citation31,Citation32].
Although connections between the CWI pathway, autophagy, and the UPR pathway were reported in S. cerevisiae [Citation1,Citation33–Citation36], the specific regulating mechanism remains obscure, especially for how the CWI pathway is linked to autophagy. Also unclear is how such interactions are involved in pathogenesis of the fungus. In M. oryzae, we previously found that ER stress induced by dithiothreitol (DTT) activates MoMps1 phosphorylation in the Momck1∆ but not the Momkk1∆ mutant strain, indicating that MoMkk1 might be a subject different from the conserved MAPK phosphorylation mechanism under ER stress [Citation8]. In this study, we found that the core autophagy-related (Atg) protein MoAtg1 phosphorylates MoMkk1 that has the capacity to activate CWI signaling. And, we also provided new evidence that autophagy coordinates with CWI signaling under ER stress to regulate M. oryzae pathogenicity.
Results
Endoplasmic reticulum stress is highly induced during M. oryzae infection
UPR is a cellular stress response related to ER stress. To test whether the UPR pathway is related to the M. oryzae infection process, we tested the alternative splicing reaction of MoHac1, a UPR transcription activator, during infection. The alternative splicing reaction and the state of MoHac1 (unspliced state and spliced state) can reflect the activity of the UPR pathway to some extent [Citation31]. Wild-type conidia (2 × 10⁵ spores/ml) were sprayed onto susceptible rice seedlings (Oryza sativa cv. CO-39). Infected rice leaves were collected in 2 and 8 h after inoculation for RNA extraction. Both RT-PCR and qRT-PCR analyses found that most of MoHac1 was in the unspliced state (uMoHAC1) at the hyphal stage ( and ). However, the spliced MoHac1 (sMoHAC1) was sharply increased at infection and upon DTT treatment ( and ). At the same time, we also found that the expression of several putative UPR-target genes, including MoSIL1, MoSCJ1, MoERV29, MoSEC61, MoPDI1, MoKAR2, and MoDER1, were all increased (). These findings suggested the presence of ER stress and UPR pathway activation during M. oryzae infection.
Figure 1. ER stress is highly induced during M. oryzae infection. (A) RT-PCR analysis of testing UPR-induced MoHAC1 splicing in M. oryzae. RT-PCR was performed using total RNAs extracted from the wild-type stain grown in liquid CM for 2 d and then treated with 10 μM DTT for another 4 h and harvested. For RNA extraction during infection stages, four milliliters of conidial suspension (2 × 10⁵ spores/ml) of Guy11 were sprayed on 2-week-old rice seedlings (Oryza sativa cv. CO39) and the infected leaves were collected and cooled with liquid nitrogen. (B) Expression of uMoHAC1 and sMoHAC1 were analyzed by qRT-PCR in both mycelial and infection stages (2 h and 8 h). ‘HY’: hyphae stage, ‘-’: hyphae without any treatment. (C) The relative expression levels of putative UPR-target genes were analyzed by qRT-PCR and normalized to that of ACTIN. Error bars represent the standard deviations and asterisks represent significant differences (p < 0.01).
Interaction patterns screening of the CWI kinase MoMkk1 under ER stress
Our previous studies have found that ER stress activates MoMps1 phosphorylation in the Momck1∆ mutant but not Momkk1∆ or Momps1∆ in M. oryzae [Citation8]. To explore the mechanism of MoMkk1 that activates CWI, we employed the co-immunoprecipitation (co-IP) approach to identify MoMkk1 interacting proteins upon DTT-induced ER stress.
We generated the MoMKK1-3× FLAG construct and introduced it into the wild-type strain. After verifying MoMkk1 expression, we immobilized it with the anti-FLAG M2 beads and analyzed proteins interacted with the tagged MoMkk1 by mass spectrometry (MS). Various proteins, including energy metabolism-related proteins, ribosomal proteins, phosphatase, histone acetyltransferase, autophagy proteins, cell cycle associated proteins, and hypothetical proteins with unknown function, were identified (Table S1). Intriguingly, we found that the autophagy-related protein serine/threonine-protein kinase Atg1 homolog (MoAtg1) was one of the proteins specifically induced by ER stress. Since Atg1 proteins are the key regulator of autophagy [Citation37,Citation38], we hypothesized that DTT-induced activation of the CWI pathway might be associated with the autophagy process in M. oryzae.
DTT imposed ER stress induces autophagy in M. oryzae
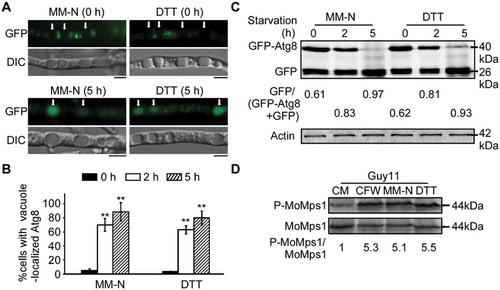
Previous studies showed that ER is critical for autophagosome formation and that UPR-autophagy crosstalk underlies the ER stress response [Citation39,Citation40]. To verify whether DTT stress induces autophagy in M. oryzae, we observed GFP-tagged MoAtg8, a widely used marker for nonspecific autophagy, in the hyphae treated with DTT. The vacuolar localized GFP-MoAtg8 increased significantly after nutrient starvation induction in the Guy11 strain and a similar increase was found when treated with 10 mM DTT for 4 h ( and ). The amount of free GFP measured by immunoblot was used to quantitate autophagy levels to the extent of free GFP compared with that of intact GFP-Atg8 and free GFP together. The autophagy level under DTT treatment almost matched to that of nutrient starvation since the proportion of free GFP increased gradually with prolonged DTT treatment time (). These results indicated that DTT treatment can induce autophagy in M. oryzae.
Figure 2. DTT imposed ER stress induces autophagy in M. oryzae. (A) The Guy11 (wild-type strain) expressing GFP-MoAtg8 was cultured in MM-N (nitrogen starvation minimal medium) or treated with 10 μM DTT for 0 or 5 h, and the autophagy intensity was observed by Axio Observer A1 Zeiss inverted microscope. The arrow points to the vacuoles. Scale bar: 5 μm. (B) Autophagy intensity was assessed by means of translocation of GFP-MoAtg8 into vacuoles (n = 100). Bars with asterisks represent significant differences (Duncan’s new multiple range method p < 0.01). (C) Immunoblotting was performed with anti-GFP and anti-β-Actin antibodies. The extent of autophagy was estimated by calculating the amount of free GFP compared to the total amount of intact GFP-Atg8 and free GFP (the numbers underneath the blot). (D) Immunoblots were performed with total proteins from hyphae of Guy11 strain without any treatment (CM) or treated with 1 mg/ml CFW, 10 μM DTT and MM-N (nutrient starvation condition). The phosphorylated MoMps1 was detected by binding of P-P44/42 antibody, and the total MoMps1 was detected by the P44/42 antibody as a control.
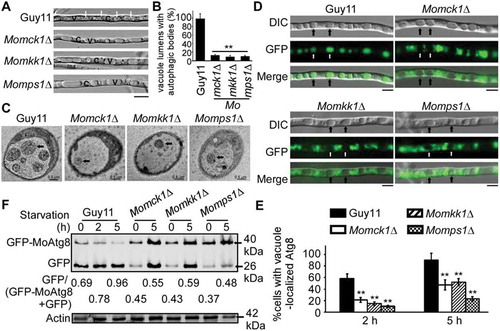
The CWI pathway is involved in autophagy
Since DTT- and starvation-induced autophagy can induce a high level of MoMps1 phosphorylation, which suggested a link between autophagy and the CWI pathway (), we tested if any of the core components of the CWI pathway (MoMck1, MoMkk1, MoMps1) are involved in autophagy. After incubating for 5 h in nitrogen-limiting medium (MM-N) containing 2 mM PMSF, the distribution of autophagic bodies in hyphal vacuole lumens were roughly observed by microscopy. The wild-type vacuole lumens were filled with autophagic bodies (marked by arrows), whereas the Momck1∆, Momkk1∆, and Momps1∆ mutants hardly accumulated any autophagic bodies ( and ). Further observation by electron microscopy confirmed that the autophagic bodies in the vacuole lumens were significantly decreased in the Momck1∆, Momkk1∆, and Momps1∆ mutants (). GFP-MoAtg8 was then respectively introduced into the three mutants to monitor the autophagy levels with the wild-type Guy11 strain as a control. The vacuolar localized GFP-MoAtg8 increased significantly following nutrient starvation induction in the Guy11 strain (2 h, 59%; 5 h, 88%) ( and ), however, the vacuolar GFP signal in the mutants were significantly reduced to 20% (Momck1∆ 2 h), 17% (Momkk1∆ 2 h), 12% (Momps1∆ 2 h) and 45% (Momck1∆ 5 h), 51% (Momkk1∆ 5 h), 22% (Momps1∆ 5 h), respectively ( and ). Further immunoblot assays confirmed that the autophagy levels in the three mutants were remarkably decreased (). Collectively, these data support that the CWI pathway has a pivotal role in regulating autophagy.
Figure 3. The CWI pathway is important for autophagy. (A) The vacuoles were filled with autophagic bodies in the wild-type Guy11 strain, whereas almost no autophagic body was evident in the vacuoles of Momck1∆, Momkk1∆, and Momps1∆ mutant strains under microscopic observation. The arrow points to the autophagic bodies. V: vacuole, C: cytoplasm. Scale bar: 5 μm. (B) Statistical analysis of vacuole lumens (n = 100) filled with autophagic bodies. Bars with asterisks represent significant differences (Duncan’s new multiple range method p < 0.01). (C) Transmission electron microscopic observation of hypha cultured in nitrogen starvation MM-N medium for 5 h. Scale bar: 0.5 μm. (D) The Guy11 (wild type), Momck1∆, Momkk1∆, and Momps1∆ mutant strains transformed with GFP-MoAtg8 were cultured in MM-N (nitrogen starvation minimal medium) for 5 h, and the autophagy intensity was observed by Axio Observer A1 Zeiss inverted microscope. The arrow points to the vacuole. Scale bar: 5 μm. (E) Autophagy intensity was assessed by means of translocation of GFP-MoAtg8 into vacuoles (n = 100). Bars with asterisks represent significant differences (Duncan’s new multiple range method p < 0.01). (F) Immunoblotting was performed with anti-GFP and anti-β-Actin antibodies. The extent of autophagy was estimated by calculating the amount of free GFP compared to the total amount of intact GFP-Atg8 and free GFP (the numbers underneath the blot).
MoAtg1 complex interacts with MoMkk1
Given the fact that the CWI pathway is related to autophagy and our preliminary findings that MoMkk1 might be the contact point of this crosstalk, we sought to identify the specific connection through screening 22 Atg proteins reportedly found in M. oryzae [Citation32] with MoMkk1 as a bait through yeast two-hybrid screen (Y2H). Several core Atg proteins were found to have strong interactions with MoMkk1, including members of Atg1 kinase-complex, the Atg12 conjugation system, the Atg8 conjugation system, and the integral membrane protein MoAtg9 (Fig. S1).
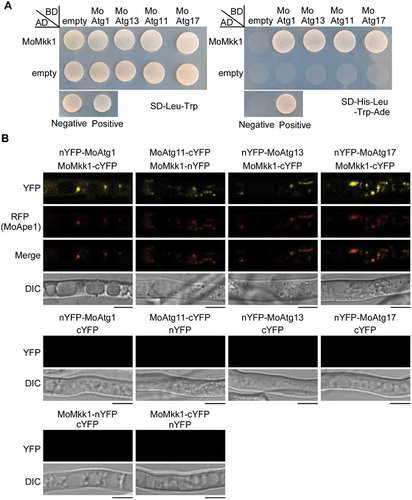
Since the CWI pathway is a conserved intrinsic signal transduction pathway whose regulation is governed by protein phosphorylation, we sought to focus on proteins of the Atg1-complex present in M. oryzae, including MoAtg1, MoAtg11, MoAtg13 and MoAtg17, that potentially related to kinase function. Bimolecular fluorescence complementation (BiFC) was also used to confirm the interactions between MoMkk1 and Atg1-complex members via Y2H (). MoMKK1-cYFP and nYFP-MoATG1, nYFP-MoATG13, nYFP-MoATG17, and MoATG11-nYFP fusion constructs were co-introduced into Guy11 protoplasts, respectively. Upon DTT treatment, the YFP signal was found in hyphae while the Ape1-RFP (Aminopeptidase Ape1 serves as an autophagic vesicle marker) marked the phagophore assembly site (PAS) (), where most Atg proteins are thought to locate during autophagy [Citation38,Citation41]. Furthermore, the GST-pull down assay showed that MoAtg1, MoAtg11 and MoAtg17, but not MoAtg13, were found in the elution fractions (Fig. S2). Together, these results indicated that MoMkk1 interacts with member proteins of the MoAtg1 complex and the interactions between MoMkk1 and MoAtg1, MoAtg11, and MoAtg17 could be direct.
Figure 4. MoAtg1 complex interacts with MoMkk1. (A) Yeast two-hybrid (Y2H) analysis of the interaction between MoMkk1 and MoAtg1 complex (MoAtg1, MoAtg11, MoAtg13, MoAtg17). The pGADT7 and pGBKT7 fused with specific genes were co-introduced into the yeast AH109 strain, and transformants were plated on SD-Leu-Trp as a control and on selective SD-Leu-Trp-His-Ade for 5 d. The pair of plasmids pGBKT7-Lam and pGADT7-T, empty pGADT7 and pGBKT7 were used as the negative controls. (B) BiFC assay for the patterns of MoMkk1-MoAtg1, MoMkk1-MoAtg11, MoMkk1-MoAtg13, MoMkk1-MoAtg17 in vivo. Strains expressing nYFP-MoAtg1 and empty cYFP, MoAtg11-cYFP and empty nYFP, nYFP-MoAtg13 and empty cYFP, nYFP-MoAtg17 and empty cYFP, MoMkk1-nYFP and empty cYFP, MoMkk1-cYFP and empty nYFP were used as negative controls. MoApe1-RFP was used as a phagophore assembly site (PAS) marker. Scale bar: 5 μm.
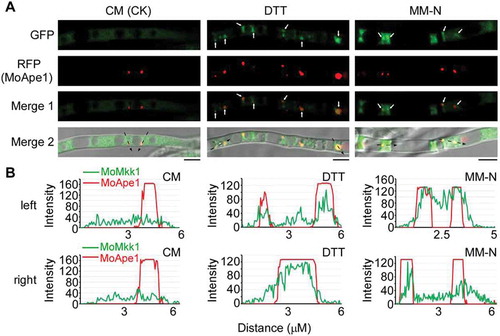
We also examined the subcellular localization of MoMkk1 under DTT and MM-N treatment to confirm that the interactions between MoMkk1 and Atg proteins were specific. MoMKK1-GFP and MoAPE1-RFP constructs were co-introduced into Guy11 protoplasts and the resulting transformants that successfully expressing MoMoMkk1-GFP and MoApe1-RFP were observed under fluorescence microscope. GFP signal was detected in the cytoplasm of the hyphae in nutrient-rich CM condition and presented in a relative steady-state distribution pattern with no accumulation at the Ape1-RFP marked PAS ( and ). Interestingly, during MM-N and DTT treatment, some of the GFP signal was obviously gathered to the PAS and could merge well with the RFP signal (, and Fig. S3), indicating that DTT and starvation treatment could induce MoMkk1 accumulation around PAS, providing the possibility for interaction with ATG proteins.
Figure 5. Subcellular localization of MoMkk1 under different conditions. (A) Confocal fluorescence microscope (Zeiss LSM710, 63x oil) observation under different conditions. Nutrient-rich condition (CM) was used for control. Dithiothreitol (DTT) and MM-N treatment for inducing autophagy. The white arrow points to the accumulation sites of MoMkk1 under DTT and MM-N treatment. The black arrow with dotted lines indicated the areas used for linescan graph analysis. MoApe1-RFP was used as a phagophore assembly site (PAS) marker. Scale bar: 5 μm. (B) Linescan graph analysis showing that MoMkk1-GFP presented in a relative steady-state distribution pattern in the cytoplasm under CM condition but obviously gathered to the PAS (MoApe1-RFP) under DTT and nutrient- starvation conditions. ‘left’ and ‘right’ indicated the left and right black arrow with dotted line in (A), respectively.
Overexpression of MoATG1, MoATG11, and MoATG17 suppresses the defect of ∆Momck1
We then wondered if the defect in the CWI pathway leads to mis-localization of MoAtg1 complex components to PAS. Hence, we constructed N-terminal tagged GFP-MoATG1, GFP-MoATG17, and C-terminal tagged MoATG11-GFP fusion constructs under the control of their respective native promoters. We then introduced them into wild-type Guy11, Momck1∆, and Momkk1∆ mutants, respectively. No difference in fluorescence was found for MoAtg1, MoAtg11, or MoAtg17 in CWI blocked mutants compared with the wild type. However, surprisingly, we found that the Momck1∆ mutant, but not the Momkk1∆ mutant, expressing MoATG1, MoATG11, or MoATG17, was completely normal in hyphae autolysis (). Expression analysis found that the level of MoATG1, MoATG11, or MoATG17 was upregulated in these corresponding Momck1∆/MoATG1, Momck1∆/MoATG11, and Momck1∆/MoATG17 mutant strains (Fig. S4), indicating overexpression of MoATG1, MoATG11, or MoATG17 could suppress the cell wall integrity defect in the Momck1∆ mutant. Consistent with this result, expression levels of MoATG1, MoATG11, and MoATG17 were also upregulated upon DTT treatment (Fig. S5A) and during infection (Fig. S5B).
Figure 6. Overexpression of MoATG1, MoATG11, or MoATG17 can restore defects in the Momck1∆ mutant. (A) Growth of the wild type (Guy11), CWI mutant strains (Momck1∆, Momkk1∆, Momps1∆), and MoAtg1 complex overexpression in Momck1∆ and Momkk1∆ mutants on complete medium (CM) for autolysis observation after 2 weeks’ incubation. (B) Statistical of conidia production on SDC medium cultured at 28°C for 7 d in the dark followed by 3 d of continuous illumination under fluorescent light. Asterisks denote statistical significances (p < 0.01). (C) Pathogenicity test on rice leaves. Unwounded rice leaves were incubated with different strains and leaf without any mycelium was used as a control (CK). Diseased leaves were photographed 5 d after inoculation. (D) Detection of the MoMps1 phosphorylation level. The key kinase of the CWI pathway MoMps1 (downstream of MoMkk1) was detected by binding of the P-P44/42 antibody, and the total MoMps1 was detected by the P44/42 antibody as control.
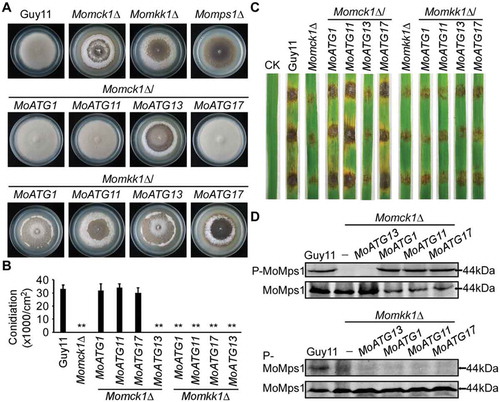
Moreover, overexpression of MoATG1, MoATG11, or MoATG17 in Momck1∆ was also found to suppress the defects of Momck1∆ in conidiation and virulence (, and Fig. S6). The phosphorylation levels of MoMps1 in these overexpression strains were also restored to the level of the wild-type strain (). We examined the expression levels of several MoMps1 downstream target genes, including MoMPG1, MoSWI6, and MoGSK1 [Citation42,Citation43], and found that the expression defect of these target genes was restored in these overexpression strains (Fig. S7), indicating that the activated MoMps1 phosphorylation in Momck1∆/MoATG1, Momck1∆/MoATG11, and Momck1∆/MoATG17 mutant strains might function in the similar way to the conserved CWI pathway. However, overexpression of MoATG1, MoATG11, or MoATG17 failed to suppress any defects in the Momkk1∆ mutant (). The above findings indicated that the activation of CWI signaling by the MoAtg1 complex is mediated by MoMkk1.
MoAtg1 phosphorylates MoMkk1 under overexpression conditions
To confirm whether the MoAtg1 complex phosphorylates MoMkk1, Mn2+-Phos-tag SDS PAGE was performed to detect MoMkk1 phosphorylation levels. MoMKK1-GFP fusion construct was respectively introduced into the Momck1∆/MoATG1, Momck1∆/MoATG11, and Momck1∆/MoATG17 overexpression stains and Momck1∆ mutant. Protein phosphorylation was visualized as slower migrating bands compared with the corresponding unphosphorylated proteins [Citation44,Citation45]. The MoMkk1-GFP protein was extracted and mobility shift was detected by immunoblotting with the anti-GFP antibody. Results showed an apparent band shift for MoMkk1-GFP in the presence of a phosphatase inhibitor, but not in phosphatase treated or in the Momck1∆ mutant (Fig. S8). The MoMkk1-GFP band in the Momck1∆/MoATG1, Momck1∆/MoATG11, and Momck1∆/MoATG17 overexpression stains migrated significantly slower than that in the Momck1∆ mutant ().
Figure 7. MoMkk1 is phosphorylated by MoAtg1 under overexpression of MoATG1, MoATG11, or MoATG17 conditions. (A) In vivo phosphorylation analysis of MoMkk1. MoMkk1-GFP proteins treated with phosphatase inhibitors were separated by Mn2+-Phos-tag SDS-PAGE and normal SDS-PAGE, respectively, and detected by the GFP antibody. The extent of MoMkk1 phosphorylation was estimated by calculating the amount of phosphorylated-MoMkk1 (P-MoMkk1) compared to the total amount of MoMkk1 (the numbers underneath the blot). (B) In vitro phosphorylation analysis by the fluorescence detection in tube (FDIT) method. Purified proteins of GST-MoMkk1, His-MoAtg1, His-MoAtg11, His-MoAtg17 were used for protein kinase reaction in the presence of 50 μM ATP in a kinase reaction buffer and then dyed with Pro-Q® Diamond Phosphorylation Gel Stain. Fluorescence signal at 590 nm (excited at 530 nm) was measured in a Cytation3 microplate reader (Biotek, Winooski, VT, USA). Asterisks denote statistical significances (p < 0.01). (C) MoMkk1 phosphorylation peptide (SGSFGPLDGR) in the Momck1∆/MoATG1 strain expressing MoMKK1 was identified by mass spectrometer analysis and the phosphorylated site was Ser-115.
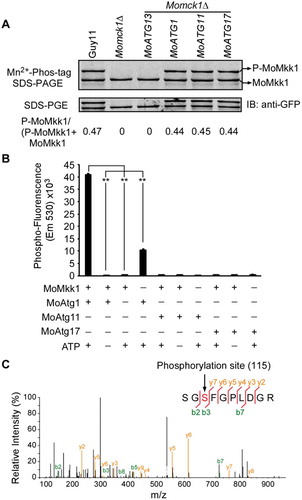
Since MoAtg1 is the only key Ser/Thr protein kinase among the components of the MoAtg1 complex [Citation37,Citation38], we wondered whether overexpression of MoATG1, MoATG11, or MoATG17, assists MoAtg1 to phosphorylate MoMkk1 directly. We detected the MoMps1 phosphorylation level by western blot using the antiphospho-p44/42 antibody in the MoATG1 deletion mutant (Moatg1∆) and an Atg1-kinase-dead mutant strain (blocking kinase activity and autophagy [Citation46]; Moatg1∆/MoATG1T225A) upon DTT treatment. Results showed that MoMps1 phosphorylation level was significantly increased, and the expression levels of MoMps1 target genes were correspondingly induced in Guy11 but not in the Moatg1∆ and Moatg1∆/MoATG1T225A mutants (Fig. S9 and Fig. S10). This indicated that the activation of CWI pathway under ER stress depends on MoAtg1 and its kinase activity in vivo. Meanwhile, we detected both MoMkk1 and MoMps1 phosphorylation levels in several other ATG gene knockout mutants which not included in MoAtg1 complex (including Moatg3∆, Moatg9∆, Moatg8∆, and Moatg26∆) and confirmed that there were no differences between these mutants and Guy11, in contrast to the Moatg1∆ mutant (Fig. S11), indicating a direct link between MoAtg1 and MoMkk1 phosphorylation in vivo. Further in vitro phosphorylation assay using protein gel-staining fluorescence dye [Citation47] of purified GST-MoMkk1, His-MoAtg1, His-MoAtg11, and His-MoAtg17 proteins showed that only MoAtg1, not MoAtg11, MoAtg13, or MoAtg17, could phosphorylate MoMkk1 ().
MoMkk1 S115 is important for the phosphorylation by MoAtg1
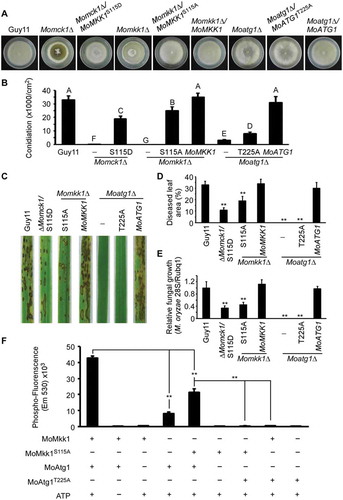
Since MoAtg1 could directly phosphorylate MoMkk1 to potentially activate the CWI pathway, we further identified the specific phosphorylation site(s) on MoMkk1. We purified the MoMkk1-GFP protein from the Momck1∆/MoATG1 and ∆Momck1 strains, respectively. After repeated tests, we found that serine 115 was phosphorylated in MoMkk1-GFP isolated from the Momck1∆/MoATG1 strain but not the Momck1∆ mutant (). To validate the MS results, we generated a phosphomimetic mutation of MoMkk1S115D that is constitutively activated. MoMkk1S115D-GFP was expressed in the Momck1∆ mutant and the function was verified by suppression of hyphal autolysis, conidiation, and virulence (-). We also detected the expression levels of several MoMps1 downstream target genes (MoMPG1, MoSWI6, and MoGSK1) and found that their expression defects were partially restored in the MoMkk1S115D strain (Fig. S12A). To explore if MoMkk1 S115 phosphorylation functioned not only under ER stress but also in normal conditions, we generated a constitutively unphosphorylated mutation construct MoMkk1S115A and expressed it in the Momkk1∆ mutant. Phenotypic analysis showed that the MoMkk1S115A strain was normal in the morphogenesis of aerial mycelia, but had certain defects in conidiation, virulence, and the activation of several target genes (- and Fig. S12B). This indicated that MoAtg1-dependent MoMkk1 phosphorylation functions not only under ER stress but also essential for the activation of downstream pathways in wild-type strains. Consistent with this reasoning, we also tested the phenotype of Moatg1∆/MoATG1T225A and found that it had a similar defect with that of the Moatg1∆ mutant (-). The constitutively unphosphorylated GST-MoMkk1S115A and Atg1-kinase-dead His-MoAtg1T225A fusion proteins were also obtained and used to test in vitro phosphorylation level through protein gel-fluorescence dye staining. Results showed a relatively low level of phosphorylation of MoMkk1S115A compared to the wild-type MoMkk1 by MoAtg1, and totally losing MoMkk1 phosphorylation by MoAtg1T225A (). Although additional phosphorylation sites on MoMkk1 may be present, these results collectively suggested that the kinase activity of MoAtg1 is essential for MoAtg1-dependent phosphorylation of MoMkk1.
Figure 8. MoAtg1-dependent MoMkk1 phosphorylation is essential for the development and virulence of M. oryzae. (A) Autolysis observation of wild type (Guy11), Momck1∆, Momck1∆/MoMKK1S115D, Momkk1∆, Momkk1∆/MoMKK1S115A, Momkk1∆/MoMKK1, Moatg1∆, Moatg1∆/MoATG1T225A, Moatg1∆/MoATG1 mutant strains on CM medium. (B) Statistical of conidia production on SDC medium cultured at 28°C for 7 d in the dark followed by 3 d of continuous illumination under fluorescent light. Different letters indicate statistically significant differences (Duncan’s new multiple range test, p < 0.01). -: no construct control; S115D: MoMKK1S115D; S115A: MoMKK1S115A; T225A: MoATG1T225A. (C) Pathogenicity analysis using rice spraying assays. Four milliliters of conidial suspension (5 × 10⁴ spores/ml) of each strain were used for spraying and photographed 7 d after inoculation. (D) Diseased leaf area analysis. Data are presented as a bar chart showing the percentage of lesion area analyzed by Image J. Error bars represent SD and asterisks represent significant differences (p < 0.01). (E) Severity of blast disease was evaluated by quantifying M. oryzae genomic 28S rDNA relative to rice genomic Rubq1 DNA (7 d post-inoculation). Mean values of three determinations with standard deviations are shown. The asterisks indicate a significant difference from the wild-type Guy11 (p < 0.01). (F) In vitro phosphorylation analysis of fluorescence detection in tube (FDIT) method. GST-MoMkk1, constitutively unphosphorylated GST-MoMkk1S115A, His-MoAtg1, and Atg1-kinase-dead His-MoAtg1T225A fusion protein were obtained for in vitro phosphorylation analysis. Asterisks denote statistical significances (p < 0.01).
Previous studies have shown that MAPKK (MAP kinase kinase) is activated by phosphorylation of two conserved Ser/Thr residues located between kinase subdomains VII and VIII [Citation48,Citation49] and mutations of these residues to the charged amino acid Asp resulted in constitutively activated activities [Citation50,Citation51]. Interestingly, these two residues (T369, T375) are also conserved in MoMKK1 of M. oryzae. We previously found that the MoMKK1T369D, T375D allele could partially rescue the phosphorylation defect of MoMps1 in Momck1∆ mutant [Citation8]. However, these conserved sites were not phosphorylated in the Momck1∆/MoATG1 strain (Fig. S13), indicating that MoAtg1-dependent MoMkk1 phosphorylation is independent of conserved MAPKKK-MAPKK cascade phosphorylation mechanism.
MoAtg1-dependent MoMkk1 phosphorylation is induced during infection
In the consideration of DTT induced ER stress and overexpression of MoATG1, MoATG11, or MoATG17 activating MoAtg1-dependent MoMkk1 phosphorylation and the fungus created an ER stress condition when attacking plants, we wondered if M. oryzae infection also induces similar phosphorylation processes. Using Mn2+-Phos-tag SDS-PAGE, we showed that phosphorylated MoMkk1 was significantly increased upon DTT treatment and during infection by Guy11. No phosphorylated MoMkk1 was detected in the Momck1∆ mutant during hyphae stage but increased phosphorylation during DTT treatment and infection (although partially) (). These results suggested that the MoAtg1-dependent MoMkk1 phosphorylation is induced by ER stress during infection. At the same time, we also detected phosphorylation of MoMps1 downstream of MoMkk1 in both the hyphae stage and during infection. Consistent with MoMkk1, the phosphorylation level showed similar increases in both Guy11 and ∆Momck1 mutant strains upon DTT treatment and during infection ().
Figure 9. MoAtg1-dependent MoMkk1 phosphorylation is induced during infection of M. oryzae. (A and C) Phosphorylation analysis of MoMkk1. MoMkk1-GFP proteins treated with phosphatase inhibitors were separated by Mn2+-Phos-tag SDS-PAGE and normal SDS-PAGE, respectively, and detected with the GFP antibody. The extent of MoMkk1 phosphorylation was estimated by calculating the amount of phosphorylated-MoMkk1 (P-MoMkk1) compared to the total amount of MoMkk1 (the numbers underneath the blot). (B and D) Detection of the MoMps1 phosphorylation level. The key kinase of the CWI pathway MoMps1 was detected by binding of the P-P44/42 antibody, and the total MoMps1 was detected by the P44/42 antibody as a control. HY, hyphal stage; HY+DTT, hyphae with DTT treatment; Inf, infection stage.
To further confirm if this infection-associated MoMkk1 phosphorylation depends on MoAtg1, we generated a double deletion mutant of MoMCK1 and MoATG1 (Momck1Moatg1∆∆) and an Atg1-kinase-dead mutant Momck1Moatg1∆∆/MoAtg1T225A (Fig. S14). Phosphorylation analysis of MoMkk1 and MoMps1 showed that both Momck1Moatg1∆∆ and Momck1Moatg1∆∆/MoAtg1T225A mutant strains totally lost the MoMkk1 phosphorylation upon DTT treatment and during infection ( and ), suggesting a direct link between MoAtg1 and MoMkk1 phosphorylation in vivo and Atg1 kinase activity is essential for the phosphorylation.
Overexpression of MoATG1, MoATG11, or MoATG17 enhances virulence
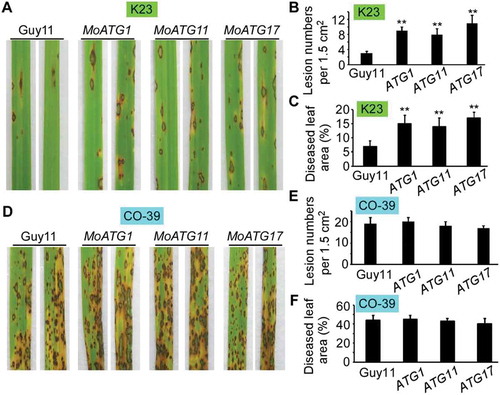
Since overexpression of MoAtg1 complex components (exception for MoATG13) completely restored the phosphorylation and virulence defect of the Momck1∆ mutant, we questioned if this overexpression could also enhance the virulence of the wild-type Guy11 strain. We then introduced the constitutively expressed N-terminal tagged GFP-MoAtg1 and GFP-MoAtg11, and the C-terminal tagged MoAtg17-GFP into Guy11, respectively. Transformants were selected and verified by PCR and qRT-PCR (Fig. S15). Virulence testing showed that there were no differences between wild type (Guy11) and MoATG1, MoATG11, or MoATG17 overexpression strains on CO-39 cultivar (, and ). However, on K23 cultivar, the wild-type strain caused few typical lesions (grey spots with brown margins), in contrast to the overexpression strains that caused not only more lesions but also larger lesion areas (-). This result demonstrated that overexpression of MoATG1, MoATG11, or MoATG17 that stimulate Atg1-dependent MoMkk1 phosphorylation could enhance infection of M. oryzae on rice.
Figure 10. Overexpression of MoATG1, MoATG11, or MoATG17 can enhance the infection of M. oryzae on rice. (A) Pathogenicity analysis of K23 rice using spraying assays. Four milliliters of conidial suspension (5 × 10⁴ spores/ml) of wild-type Guy11 and overexpressing MoATG1, MoATG11, or MoATG17 mutant strains were used for spraying and photographed 7 d after inoculation. (B) Quantification of lesion numbers (per 1.5 cm2) on susceptible rice spayed with conidia of the strains in (A). Error bars represent SD and asterisks represent significant differences (p < 0.01). (C) Diseased leaf area analysis. Data are presented as a bar chart showing percentage of lesion areas analyzed by Image J. Error bars represent SD and asterisks represent significant differences (p < 0.01). (D) Pathogenicity analysis of CO-39 rice using spraying assays. Four milliliters of conidial suspension (5 × 10⁴ spores/ml) of each strain were used for spraying and photographed 7 d after inoculation. (E) Quantification of lesion numbers (per 1.5 cm2) on susceptible rice spayed with conidia of the strains in (D). (F) Diseased leaf area analysis of the leaves in (D).
Discussion
The cell wall integrity (CWI) signaling pathway plays an important role in responding to the external stress and in fungal growth and pathogenicity [Citation1]. At the same time, autophagy recycling of the organelles, the membranes and other proteins is also essential for cell survival [Citation52]. Although a connection of CWI signaling and autophagy has been established in the budding yeast S. cerevisiae [Citation34], the specific mechanism remains unknown. In this study, we found that a core Atg protein, MoAtg1, can phosphorylate the CWI component MoMkk1 instead of MoMck1 (MAPKKK), under ER stress, and identified MoMkk1 as a key element linking autophagy to CWI signaling. Importantly, MoAtg1-activated MoMkk1 phosphorylation of the CWI pathway is essential for the virulence of M. oryzae.
Autophagy is one of the main mechanisms for the eukaryotic cells to replenish pools of biosynthetic precursors and energy sources by recycling cytosolic contents during starvation conditions [Citation53]. Both the autophagy process and its regulatory factors are conserved from yeasts to mammals [Citation54,Citation55]. Atg1, one of the first identified autophagy-specific proteins, is the only identified serine/threonine protein kinase among the core autophagic machinery [Citation56]. Although several Atg1 kinase targets have been described in S. cerevisiae, D. melanogaster, and mammalian cells [Citation57–Citation61], the mechanism by which Atg1 kinase regulates autophagy remains elusive. Here, we found that MoAtg1 could directly phosphorylate the CWI component MoMkk1 at serine 115. This MoAtg1-activated MoMkk1 phosphorylation happens under ER stress, which could replace the conserved function of MoMck1 to stimulate CWI signaling. Our phenotypic analysis involving the constitutively unphosphorylated mutation Momkk1∆/MoMKK1S115A further revealed that S115 phosphorylation not only activates the CWI pathway in Momck1∆ mutant, but also has an essential function for conidiation and virulence.
At the same time, we noticed that this MoAtg1-dependent MoMkk1 phosphorylation is independent of the conserved MAPKKK phosphorylation sites (T369, T375) [Citation48,Citation49], indicating that this MoAtg1-dependent phosphorylation pattern might be a new way of regulating CWI pathway. Our results also showed that, despite MoAtg1 and the conserved MoMck1 (MAPKKK) might activate MoMkk1 phosphorylation through different ways, MoMkk1 regulated downstream target genes in way similar to that the conserved CWI pathway did. This is due to the fact that the defect of MoMps1 target genes expression levels in Momck1∆/MoMKK1S115D mutant were partially restored.
In S. cerevisiae, Atg13 can bind to both Atg1 and the Atg17-Atg31-Atg29 subcomplex directly, whereas Atg11 works as a scaffold interacting with Atg1, Atg17, and Atg29 in growth and selective autophagy [Citation54]. However, we found that MoAtg1, MoAtg11, and MoAtg17, but not MoAtg13, directly interact with MoMkk1 (), which is consistent with that overexpression of MoATG1, MoATG11, or MoATG17, but not MoATG13, can rescue MoMps1 phosphorylation and target gene expressions.
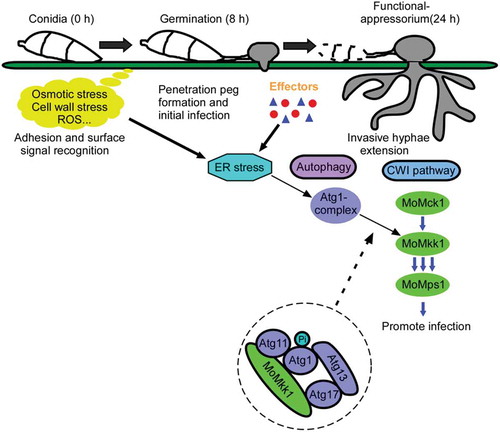
Figure 11. A model of M. oryzae utilizing MoAtg1-dependent MoMkk1 phosphorylation to stimulate the CWI signaling and enhance its infection on rice. During the infection of M. oryzae, it faces various stresses from both external environment and the rice, leading to the fungus synthesis a series of proteins (including several effectors) to resist the adversity. ER stress is then accumulated, accompanied by protein synthesis, to stimulate an essential Atg protein, MoAtg1, and activate MoAtg1-dependent MoMkk1 phosphorylation which finally enhance CWI signaling and promote the infection of the fungus.
Although autophagy is initially regarded as a survival response to stress, recent studies have revealed its significance in cellular and organismal homeostasis, development, and immunity [Citation62]. In plants, autophagy was found in the regulation of the hypersensitive response (HR) as part of effector-triggered immunity against oomycete, viral and bacterial pathogens [Citation20,Citation63–Citation66]. Current studies also found that bacteria could exploit autophagy for proteasome degradation to enhance virulence in plants [Citation67]. Here, we found that overexpression of MoATG1, MoATG11, or MoATG17 could suppress the defect of the Momck1∆ mutant and enhance infection of M. oryzae on rice. Meanwhile, we clarified that this overexpression led to a stimulation of MoMkk1 phosphorylation and CWI pathway activation, and virulence enhancement.
During the interaction between M. oryzae and the host, ER stress accumulates and then activates MoAtg1-MoMkk1 phosphorylation that help with infection, which is consistent with the finding that overexpression of MoATG1, MoATG11, or MoATG17 enhances virulence. These observations indicated that the CWI pathway is essential for infection and pathogenicity, and this MoAtg1-activated MoMkk1 phosphorylation can enhance this process. Although various ATG genes have been identified in M. oryzae and showed critical roles in autophagy, functional appressorium formation and successful infection [Citation32], this is the first time to show Atg proteins regulate the virulence of fungus through enhancing other signaling pathway under stress conditions.
We previously found that ER stress could activate the blocked CWI pathway in the ∆Momck1 mutant but not in Momkk1∆ and Momps1∆ mutants [Citation8], indicating that a putative protein kinase phosphorylating MoMkk1 instead of MoMck1 under DTT treatment. Through identifying MoMkk1 interacting proteins, in particular, protein kinases, we identified MoAtg1. In S. cerevisiae, it was found that Slt2-MAPK (CWI) and Hog1-MAPK (HOG) pathways are required for selective autophagy, but the specific mechanism is unknown [Citation34]. Meanwhile, ER stress is known to be an inducer of selective autophagy (ER-phagy) and the UPR signaling pathway is also involved in this autophagy regulation [Citation36,Citation68,Citation69]. There have been also reports showing that the UPR system has essential interconnections with the CWI pathway in filamentous fungi [Citation1]. Here, of particular interest is, we further expanded the knowledge by providing a model in which autophagy is linked to the CWI pathway through ER stress in M. oryzae.
In summary, studies of MoAtg1-dependent regulation of MoMkk1 phosphorylation revealed a novel mechanism through which autophagy coordinates with the CWI pathway under ER stress in order to enhance pathogenesis of M. oryzae. Given several core Atg proteins were found to interact with the CWI pathway components and the importance of the crosstalk between the two pathways in fungal virulence, it would be great to explore whether these Atg proteins are also subject to phosphorylation regulation by CWI signaling and these studies are currently underway.
Materials and methods
Strains and culture conditions
The M. oryzae Guy11 (the wild-type strain for M. oryzae we used in this study) strain was used as wild type (WT) in this study. All strains were cultured on complete medium (CM) (10 g D-glucose [Solarbio, G8150], 2 g peptone [Solarbio, P8450], 1 g yeast extract [Solarbio, LP0021], 1 g casamino acid [Sango Biotech, F505BA0020], 1 ml vitamin solution [0.01 g biotin {Sigma-Aldrich, B4501}, 0.01 g pyridoxine {Sigma-Aldrich, P5669}, 0.01 g thiamine {Sigma-Aldrich, T1270}, 0.01 g riboflavin {Solarbio, V8060}, 0.01 g p-aminobenzoic acid {Sigma-Aldrich, A9878}, 0.01 g nicotinic acid {Solarbio, N8060} in 1 L of distilled water], 1 ml trace elements [2.2 g ZnSO4•7H2O, 1.1 g H3BO3, 0.5 g MnCl2•4H2O, 0.5 g FeSO4•7H2O, 0.17 g CoCl2•6H2O, 0.16 g CuSO4•5H2O, 0.15 g Na2MnO4•2H2O, 5 g Na4EDTA {Brandt Chemical, 13,235–36-4} in 100 ml of distilled water, pH 5.8], 50 ml 20x nitrate salts [120 g NaNO3, 10.4 g KCl, 10.4 g MgSO4•7H2O, 30.4 g KH2PO4 in 1 L of distilled water] in 1 L of distilled water) for 3–15 d in the dark at 28°C [Citation70,Citation71]. For vegetative growth and autolysis, small agar blocks were cut from the edge of 7-d-old cultures and placed onto fresh media, followed by incubation in the dark at 28°C. The radial growth was measured after incubation for 7 d and strains for autolysis observation were kept for another 3 d. Mycelia were harvested from the liquid CM media with or without additional treatment for DNA, RNA and total protein extractions. For conidia production, strains were maintained on straw decoction and corn (SDC [a kind of semi-natural medium]: 100 g of straw [dry stem of rice], 40 g of corn powder [Solarbio, FA0100], 15 g of agar [Solarbio, A8190] in 1 L of distilled water) agar media at 28°C for 7 d in the dark followed by 3 d of continuous illumination under fluorescent light [Citation72].
Virulence assay
Conidia harvested from 10-d-old SDC agar cultures were filtered through two layers of Miracloth (EMD Millipore Corp., 475855-1R) and resuspended to a concentration of 5 × 10⁴ spores/ml in a 0.2% (w:v) gelatin (Solarbio, G8061) solution. Two-week-old seedlings of rice (Oryza sativa cv. CO39 and K23) was used for pathogenicity assays. For spray inoculation, 5 ml of conidial suspension of each treatment was sprayed onto rice with a sprayer. For detached mycelium inoculation, mycelia cultured in liquid CM for 2 d were washed in sterile water and then dropped onto the detached rice leaves. Inoculated plants were kept in a growth chamber at 28°C with 90% humidity and in the dark for the first 24 h, followed by a 12 h/12 h light/dark cycle. The disease severity was assessed at 7 d after inoculation.
Several methods were used to synthetically evaluate the disease severity, including lesion numbers, lesion area and relative fungal growth in rice leaves. For ‘relative fungal growth’ assay, total DNA was extracted from 1.5 g disease leaves and test by qRT-PCR (ChamQTM SYBR® qPCR Master Mix [Vazyme Biotech Company, Q311-02/03]) with M. oryzae 28S ribosomal gene (rDNA) and RUBQ1 (rice ubiquitin 2) primers [Citation73,Citation74].
Quantitative RT-PCR analysis
For qRT-PCR, total RNA was reverse transcribed into first-strand cDNA using the oligo (dT) primer and HiScript II Q RT SuperMix for qPCR (Vazyme Biotech Company, R233-01). The qRT-PCR was run on the Applied Biosystems 7500 Real Time PCR System with ChamQ SYBR® qPCR Master Mix (Vazyme Biotech Company, Q311-02/03). Normalization and comparison of mean Ct values were performed as previously described [Citation73].
Yeast two-hybrid assay
The bait constructs were generated by cloning CWI components (MoMCK1, MoMKK1 and MoMPS1) full-length cDNAs into pGADT7 (LMAI Biotechnology, LM1010) and the cDNA of 22 M. oryzae ATG genes were cloned into pGADT7 as the prey constructs [Citation32]. The resulting prey and bait constructs were confirmed by sequencing analysis and transformed in pairs into yeast strain AH109 (LMAI Biotechnology, LM1010) following the manufacturer’s recommended protocol (BD Biosciences Clontech). Transformants grown on synthetic dextrose medium lacking leucine and tryptophan (SD-Leu-Trp) were transferred to synthetic medium lacking leucine, tryptophan, adenine and histidine (SD-Leu-Trp-Ade-His). Yeast stains for positive and negative controls were provided by the BD library construction & screening kit.
Bimolecular fluorescence complementation (BiFC) assay
The MoMkk1-cYFP and MoAtg11-cYFP fusion constructs were generated by cloning the MoMKK1 and MoATG11 fragments into pHZ68 (BiFC vectors from Dr. J. R. Xu of Purdue University), respectively [Citation75]. Similarly, MoMkk1-nYFP, nYFP-MoAtg1, nYFP-MoAtg13 and nYFP-MoAtg17 fusion constructs were generated by cloning the MoMKK1, MoATG1, MoATG13 and MoATG17 fragment into pHZ65 (BiFC vectors from Dr. J. R. Xu of Purdue University). Construct pairs of nYFP-MoAtg1 and MoMkk1-cYFP, MoAtg11-cYFP and MoMkk1-nYFP, nYFP-MoAtg13 and MoMkk1-cYFP, nYFP-MoAtg17 and MoMkk1-cYFP were co-introduced into protoplasts of wild-type Guy11, respectively. Transformants resistant to both hygromycin (Solarbio® Life Sciences, H8080) and zeocin (Thermo Fisher Scientific, R25001) were isolated and confirmed by PCR analyses. MoApe1-RFP was used to mark PAS where most Atg proteins are located on under starvation conditions. YFP signals were examined with Zeiss LSM710, 63× oil.
GST-pull down
GST, GST-MoMkk1, His-MoAtg1, His-MoAtg11, His-MoAtg13, His-MoAtg17 were expressed in Escherichia coli BL21-CodonPlus (DE3) cells (Sigma-Aldrich, CMC0014). Cells were lysed in lysis buffer (50 mM Tris, pH 8.0, 50 mM NaCl, 1 mM PMSF [Beyotime Biotechnology, ST506-2]) with a sonicator (Branson). Samples were centrifuged (13,000 g, 10 min) and the supernatants were transferred to a new 1.5 ml tube and stored at −70°C. The GST and GST-MoMkk1 supernatants were then mixed with 30 μl glutathione Sepharose beads (GE Healthcare, 10265165) and incubated at 4°C for 2 h. Then the recombinant GST-MoMoMkk1 or GST- bound to glutathione Sepharose beads was incubated with E. coli cell lysate containing His-MoAtg1/11/13/17 at 4°C for another 4 h. Finally, the beads were washed with buffer (50 mM Tris, pH 8.0, 50 mM NaCl, 1 mM PMSF, 1% Triton X-100 [Sigma-Aldrich, T8787]) 5 times and eluted from the beads. Eluted proteins were analyzed by immunoblot (IB) with monoclonal anti-His (Abmart, 294166) and monoclonal anti-GST (Abmart, 284473) antibodies [Citation76,Citation77].
Protein extraction and western blot analysis
Strains were cultured in ample liquid nutrient-rich conditions (CM media) for 36 h and then moved into nutrition starvation conditions (MM-N media: 0.52 g KCl, 0.152 g MgSO4•7H2O, 1.52 g KH2PO4, 0.01 g VB1, 1 mL trace elements and 10 g D-glucose in 1 L of distilled water) or treated with different stress (Calcofluor white [CFW; Sigma-Aldrich, F3543], dithiothreitol [DTT; Sango Biotech, A620058]) for different hours before mycelia of each strain were harvested. For total protein extraction, mycelia were ground into a fine powder in liquid nitrogen and re-suspended in 1 ml lysis buffer (10 mM Tris-HCl, pH 7.5, 150 mM NaCl, 0.5 mM EDTA (Solarbio, E8030), 0.5% NP-40 [Sigma-Aldrich, IGEPAL® CA-630, I3021]) with 2 mM PMSF and proteinase inhibitor cocktail (Sigma-Aldrich, cOmpleteTM, 11836170001). The lysates were placed on the ice for 30 min and shaken once every 10 min for protein lysing. Cell debris was removed by centrifugation at 13, 000 g for 10 min at 4°C. The supernatant lysates were collected as total proteins. For GFP- tagged protein detection, samples were analyzed by 8% SDS-PAGE followed by western blotting with the anti-GFP antibody (mouse, 1:5000, Abmart, 293967) and the anti-mouse secondary antibody (1:10,000, LI-COR, IRDye®, C70301-02), followed by detection using the ODYSSEY infrared imaging system (application software Version 2.1). For detecting phosphorylated MoMps1 level, we used an anti-phospho-p44/42 MAP kinase antibody (Cell Signaling Technology, 4370) and the anti-p44/42 MAP kinase antibody (Cell Signaling Technology, 4695) was used as control.
Phosphorylation analysis through Phos-tag gel
The MoMkk1-GFP fusion construct was introduced into the wild type (Guy11), Momck1∆, Momck1∆/MoATG1, Momck1∆/MoATG11 and Momck1∆/MoATG17, Momck1Moatg1∆∆, Momck1Moatg1∆∆/MoATG1T225A, Moatg1∆, Moatg3∆, Moatg9∆, Moatg8∆, Moatg26∆ mutant strains. The total protein extracted from mycelium was resolved on 8% SDS-PAGE prepared with 50 µM acrylamide-dependant Phos-tag ligand and 100 µM MnCl2 as described [Citation44,Citation78]. Gel electrophoresis was performed with a constant voltage of 80 V for 3–6 h. Before transferring, gels were equilibrated in transfer buffer with 5 mM EDTA for 20 min two times and followed by transfer buffer without EDTA for another 20 min. Protein transfer from the Mn2+-phos-tagTM acrylamide (NARD institute Limited company, 18D-01) gel to the PVDF membrane (EMD Millipore Corp., ISEQ00010) was performed for ~36 h (depend on different proteins) at 80 V at 4°C, and then the membrane was analyzed by western blotting using the anti-GFP antibody.
In vitro phosphorylation analysis
The GST-MoMkk1, GST-MoMkk1S115A, His-MoAtg1, His-MoAtg11, His-MoAtg17, His-MoAtg1T225A were expressed in E. coli BL21-CodonPlus (DE3) cells (Sigma, CMC0014) and purified as described in the GST-pull down assays. The we used a rapid and cost-effective fluorescence detection in tube (FDIT) method to analyze protein phosphorylation in vitro [Citation47]. The Pro-Q® Diamond Phosphorylation Gel Stain (Thermo Fisher Scientific, P33301), known as a widely used phosphor-protein gel-staining fluorescence dye, was used in this assay. For protein kinase reaction, 2 μg MoMkk1 (MoMkk1S115A) was mixed with MoAtg1, MoAtg11, and MoAtg17 in a kinase reaction buffer (100 mM PBS [Beyotime Biotechnology, ST476], pH 7.5, 10 mM MgCl2, 1 mM ascorbic acid [Sigma-Aldrich, A5960]), with the appearance of 50 μM ATP (Sigma-Aldrich, FLAAS) at room temperature (RT) for 60 min, 10 folds of cold acetone was added to stop the reaction. For protein in tube staining, casein (Sango Biotech, T510256) were homogenized and suspended in Mili-Q water at the concentration of 0.2 μg/μl. For the staining duration time analysis, 10 μl of casein was mixed with 100 μl of Pro-Q® Diamond (Thermo Fisher Scientific, P33301) and kept in dark at RT for 1 h. Then the protein was precipitated with 10 volumes of cold acetone, kept in a − 20°C freezer and centrifuged at 13,200 g for 1 h at 4°C. Supernatant was carefully drained out and discarded without touching the protein pellet. The pellet was rinsed with 0.5 ml of cold acetone and centrifuge to remove the supernatant twice. The pellet was air-dried and dissolved in 200 μl of Mili-Q water and moved to a black 96 well plate (Corning, 3925). Fluorescence signal at 590 nm (excited at 530 nm) was measured in a Cytation3 microplate reader (Biotek, Winooski, VT, USA).
Transmission electron microscopy observation
Vegetative hyphae of the indicated strains were cultured in liquid complete medium (CM) for 30 h and treated with nutrient-starvation medium (MM-N) [Citation79]. For transmission electron microscopy observation, hyphae and conidia were fixed with 2.5% glutaraldehyde in phosphate buffer (NaH2PO4•H2O [Sigma-Aldrich, S9638], NaH2PO4•2H2O [Sigma-Aldrich, 71505], Na2HPO4, Na2HPO4•2H2O [Sigma-Aldrich, 71643], Na2HPO4•7H2O [Sigma-Aldrich, S9390], Na2HPO4•12H2O [Sigma-Aldrich, 71649], pH 7.0) for more than 4 h, followed by washing 3 times in the phosphate buffer and then fixed with 1% OsO4 (Sigma-Aldrich, 419494) in phosphate buffer (pH 7.0) for 1 h and washed 3 times again in the phosphate buffer. Then, the specimen was firstly dehydrated by a graded series of ethanol (30, 50, 70, 80, 90, 95 and 100%) for about 15–20 min for each step, transferred to absolute acetone for 20 min. Next, the specimen was placed in 1:1 mixture of absolute acetone and the final Spurr resin mixture (Sigma-Aldrich, 45346) for 1 h at RT; then transferred to 1:3 mixture of absolute acetone and the final resin mixture for 3 h and to final Spurr resin mixture for overnight. Specimen was placed in capsules contained embedding medium and heated at 70°C for 9 h. The specimen sections were stained by uranyl acetate and alkaline lead citrate for 15 min respectively and observed under transmission electron microscopy (Hitachi H-7650).
Mass spectrometric analysis
To identify phosphorylation sites of targeted proteins, samples were separated on 10% SDS-PAGE. The gel bands corresponding to the targeted protein were excised from the gel, reduced with 10 mM of DTT and alkylated with 55 mM iodoacetamide (Sigma-Aldrich, I1149). (Elution in liquid form was also used directly for digestion since the 1–150 aa on the N-terminal residues of MoMkk1 was difficult to cover). In gel digestion (or elution digestion) was carried out with the trypsin (Promega, V5113) or GLU-C (Wako, 050–05941) or chymotrypsin (Sigma-Aldrich, C6423) in 50 mM ammonium bicarbonate at 37°C overnight. The peptides were extracted using ultrasonic processing with 50% acetonitrile (Sigma-Aldrich, 271004) aqueous solution for 5 min and with 100% acetonitrile for 5 min. The extractions were then centrifuged in a speed to reduce the volume. A liquid chromatography–mass spectrometry (LC–MS) system consisting of a Dionex Ultimate 3000 nano-LC system (nano UHPLC, Sunnyvale, CA, USA), connected to a linear quadrupole ion trap Orbitrap (LTQ Orbitrap XL) mass spectrometer (ThermoElectron, Bremen, Germany), and equipped with a nanoelectrospray ion source (Thermo Fisher Scientific, Thermo Scientific Q Exactive, Massachusetts, USA) was used for our analysis. For LC separation, an Acclaim PepMap 100 column (C18.3 μm, 100 Å) (Dionex, Sunnyvale, CA, USA) capillary with a 15 cm bed length was used with a flow rate of 300 nL/min. Two solvents, A (0.1% formic acid [Sigma-Aldrich, 399388]) and B (aqueous 90% acetonitrile in 0.1% formic acid), were used to elute the peptides from the nanocolumn. The gradient went from 5% to 40% B in 80 min and from 40% to 95% B in 5 min, with a total run time of 120 min. The mass spectrometer was operated in the data-dependent mode so as to automatically switch between Orbitrap-MS and LTQ-MS/MS acquisition. Survey full scan MS spectra (from m/z 350 to 1800) were acquired in the Orbitrap with a resolution r = 60,000 at m/z 400, allowing the sequential isolation of the top ten ions, depending on signal intensity. The fragmentation on the linear ion trap used collision-induced dissociation at a collision energy of 35 V. Protein identification and database construction were processed using Proteome Discoverer software (1.2 version, Thermo Fisher Scientific, Waltham, MA, USA) with the SEQUEST model. For mass spectrometry analyzing the phosphorylation sites, we thank the Shanghai Applied Protein Technology Co., Ltd., for technological assistance.
Statistical analyses
Each result is presented as the mean ± SD of at least three replicated measurements. The significance of differences between treatments was statistically evaluated using SDs and one-way analysis of variance (ANOVA) in SPSS 2.0 (Chicago, IL, USA). Data for two specific different treatments were compared statistically using ANOVA, followed by an F-test if the ANOVA result was significant at p < 0.01 or p < 0.05 [Citation72].
Accession number
The genes from this article can be found in the GenBank database under the following accession numbers: MoMkk1 (MGG_06482), MoMck1 (MGG_00883), MoMps1 (MGG_04943), MoAtg1 (MGG_06393), MoAtg11 (MGG_04486), MoAtg13 (MGG_00454), MoAtg17 (MGG_07667), MoAtg8 (MGG_01062), MoMpg1 (MGG_10315), MoGsk1 (MGG_12122), MoSwi6 (MGG_09869), MoActin (MGG_03982).
Supplemental Material
Download PDF (922.7 KB)Acknowledgments
This research was supported by the key program of Natural Science Foundation of China (Grant No: 31530063, ZZ), the China National Funds for Innovative Research Groups (Grant No. 31721004 to ZZ) and Innovation Team Program for Jiangsu Universities (2017). We thank Dr. J. R. Xu of Purdue University for providing the ∆Momps1 mutant and pHZ65 and pHZ68 vectors, Dr. Xiaohong Liu and Dr. Fu-Cheng Lin of Zhejiang University for providing GFP-MoAtg8 plasmid, ∆Moatg1, ∆Moatg8 and ∆Moatg26 mutants.
Disclosure statement
No potential conflict of interest was reported by the authors.
Supplementary material
Supplemental data for this article can been accessed here.
Additional information
Funding
Related Research Data
References
- Malavazi I, Goldman GH, Brown NA. The importance of connections between the cell wall integrity pathway and the unfolded protein response in filamentous fungi. Brief Funct Genomics. 2014;13:456–470.
- Lee KS, Irie K, Gotoh Y, et al. A yeast mitogen-activated protein kinase homolog (Mpk1p) mediates signalling by protein kinase C. Mol Cell Biol. 1993;13:3067–3075.
- Martin H, Arroyo J, Sanchez M, et al. Activity of the yeast map kinase homolog Slt2 is critically required for cell integrity at 37-Degrees-C. Mol Gen Genet. 1993;241:177–184.
- Levin DE. Cell wall integrity signaling in Saccharomyces cerevisiae. Microbiol Mol Biol Rev. 2005;69:262–291.
- Penn TJ, Wood ME, Soanes DM, et al. Protein kinase C is essential for viability of the rice blast fungus Magnaporthe oryzae. Mol Microbiol. 2015;98:403–419.
- Xu JR, Staiger CJ, Hamer JE. Inactivation of the mitogen-activated protein kinase Mps1 from the rice blast fungus prevents penetration of host cells but allows activation of plant defense responses. Proc Natl Acad Sci U S A. 1998;95:12713–12718.
- Jeon J, Goh J, Yoo S, et al. A putative MAP kinase kinase kinase, MCK1, is required for cell wall integrity and pathogenicity of the rice blast fungus, Magnaporthe oryzae. Mol Plant Microbe Interact. 2008;21:525–534.
- Yin Z, Tang W, Wang J, et al. Phosphodiesterase MoPdeH targets MoMck1 of the conserved mitogen-activated protein (MAP) kinase signalling pathway to regulate cell wall integrity in rice blast fungus Magnaporthe oryzae. Mol Plant Pathol. 2016;17:654–668.
- Fujioka T, Mizutani O, Furukawa K, et al. MpkA-Dependent and -independent cell wall integrity signaling in Aspergillus nidulans. Eukaryot Cell. 2007;6:1497–1510.
- Hou Z, Xue C, Peng Y, et al. A mitogen-activated protein kinase gene (MGV1) in Fusarium graminearum is required for female fertility, heterokaryon formation, and plant infection. Mol Plant Microbe Interact. 2002;15:1119–1127.
- Kojima K, Kikuchi T, Takano Y, et al. The mitogen-activated protein kinase gene MAF1 is essential for the early differentiation phase of appressorium formation in Colletotrichum lagenarium. Mol Plant Microbe Interact. 2002;15:1268–1276.
- Kraus PR, Fox DS, Cox GM, et al. The Cryptococcus neoformans MAP kinase Mpk1 regulates cell integrity in response to antifungal drugs and loss of calcineurin function. Mol Microbiol. 2003;48:1377–1387.
- Mehrabi R, Van der Lee T, Waalwijk C, et al. MgSlt2, a cellular integrity MAP kinase gene of the fungal wheat pathogen Mycosphaerella graminicola, is dispensable for penetration but essential for invasive growth. Mol Plant Microbe Interact. 2006;19:389–398.
- Valiante V, Heinekamp T, Jain R, et al. The mitogen-activated protein kinase MpkA of Aspergillus fumigatus regulates cell wall signaling and oxidative stress response. Fungal Genet Biol. 2008;45:618–627.
- Fernandez J, Orth K. Rise of a cereal killer: the biology of Magnaporthe oryzae biotrophic growth. Trends Microbiol. 2018;26:582–597.
- Yi M, Valent B. Communication between filamentous pathogens and plants at the biotrophic interface. Annu Rev Phytopathol. 2013;51:587–611.
- Ron D, Walter P. Signal integration in the endoplasmic reticulum unfolded protein response. Nat Rev Mol Cell Biol. 2007;8:519–529.
- Schubert U, Anton LC, Gibbs J, et al. Rapid degradation of a large fraction of newly synthesized proteins by proteasomes. Nature. 2000;404:770–774.
- Romisch K. A cure for traffic jams: small molecule chaperones in the endoplasmic reticulum. Traffic. 2004;5:815–820.
- Liu Y, Schiff M, Czymmek K, et al. Autophagy regulates programmed cell death during the plant innate immune response. Cell. 2005;121:567–577.
- Noda T, Ohsumi Y. Tor, a phosphatidylinositol kinase homologue, controls autophagy in yeast. J Biol Chem. 1998;273:3963–3966.
- Dementhon K, Saupe SJ, Clave C. Characterization of IDI-4, a bZIP transcription factor inducing autophagy and cell death in the fungus Podospora anserina. Mol Microbiol. 2004;53:1625–1640.
- Suzuki H, Osawa T, Fujioka Y, et al. Structural biology of the core autophagy machinery. Curr Opin Struct Biol. 2017;43:10–17.
- Meusser B, Hirsch C, Jarosch E, et al. ERAD: the long road to destruction. Nat Cell Biol. 2005;7:766–772.
- Travers KJ, Patil CK, Wodicka L, et al. Functional and genomic analyses reveal an essential coordination between the unfolded protein response and ER-associated degradation. Cell. 2000;101:249–258.
- Cox JS, Shamu CE, Walter P. Transcriptional induction of genes encoding endoplasmic reticulum resident proteins requires a transmembrane protein kinase. Cell. 1993;73:1197–1206.
- Wang S, Kaufman RJ. The impact of the unfolded protein response on human disease. J Cell Biol. 2012;197:857–867.
- Klionsky DJ, Cregg JM, Dunn WA Jr., et al. A unified nomenclature for yeast autophagy-related genes. Dev Cell. 2003;5:539–545.
- Klionsky DJ. Autophagy: from phenomenology to molecular understanding in less than a decade. Nat Rev Mol Cell Bio. 2007;8:931–937.
- Yao Z, Delorme-Axford E, Backues SK, et al. Atg41/Icy2 regulates autophagosome formation. Autophagy. 2015;11:2288–2299.
- Tang W, Ru Y, Hong L, et al. System-wide characterization of bZIP transcription factor proteins involved in infection-related morphogenesis of Magnaporthe oryzae. Environ Microbiol. 2015;17:1377–1396.
- Kershaw MJ, Talbot NJ. Genome-wide functional analysis reveals that infection-associated fungal autophagy is necessary for rice blast disease. Proc Natl Acad Sci U S A. 2009;106:15967–15972.
- Levin DE. Regulation of cell wall biogenesis in Saccharomyces cerevisiae: the cell wall integrity signaling pathway. Genetics. 2011;189:1145–1175.
- Mao K, Wang K, Zhao M, et al. Two MAPK-signaling pathways are required for mitophagy in Saccharomyces cerevisiae. J Cell Biol. 2011;193:755–767.
- Mao K, Klionsky DJ. MAPKs regulate mitophagy in Saccharomyces cerevisiae. Autophagy. 2011;7:1564–1565.
- Schuck S, Gallagher CM, Walter P. ER-phagy mediates selective degradation of endoplasmic reticulum independently of the core autophagy machinery. J Cell Sci. 2014;127:4078–4088.
- Kamada Y, Funakoshi T, Shintani T, et al. Tor-mediated induction of autophagy via an Apg1 protein kinase complex. J Cell Biol. 2000;150:1507–1513.
- Nakatogawa H, Suzuki K, Kamada Y, et al. Dynamics and diversity in autophagy mechanisms: lessons from yeast. Nat Rev Mol Cell Biol. 2009;10:458–467.
- Senft D, Ronai ZA. UPR, autophagy, and mitochondria crosstalk underlies the ER stress response. Trends Biochem Sci. 2015;40:141–148.
- Axe EL, Walker SA, Manifava M, et al. Autophagosome formation from membrane compartments enriched in phosphatidylinositol 3-phosphate and dynamically connected to the endoplasmic reticulum. J Cell Biol. 2008;182:685–701.
- Suzuki K, Ohsumi Y. Current knowledge of the pre-autophagosomal structure (PAS). FEBS Lett. 2010;584:1280–1286.
- Qi Z, Wang Q, Dou X, et al. MoSwi6, an APSES family transcription factor, interacts with MoMps1 and is required for hyphal and conidial morphogenesis, appressorial function and pathogenicity of Magnaporthe oryzae. Mol Plant Pathol. 2012;13:677–689.
- Zhou T, Dagdas YF, Zhu X, et al. The glycogen synthase kinase MoGsk1, regulated by Mps1 MAP kinase, is required for fungal development and pathogenicity in Magnaporthe oryzae. Sci Rep. 2017;7:945.
- Li X, Gao CY, Li LW, et al. MoEnd3 regulates appressorium formation and virulence through mediating endocytosis in rice blast fungus Magnaporthe oryzae. PLoS Pathog. 2017;13.
- Li L, Chen X, Zhang S, et al. MoCAP proteins regulated by MoArk1-mediated phosphorylation coordinate endocytosis and actin dynamics to govern development and virulence of Magnaporthe oryzae. PLoS Genet. 2017;13:e1006814.
- Yeh YY, Wrasman K, Herman PK. Autophosphorylation within the Atg1 activation loop is required for both kinase activity and the induction of autophagy in Saccharomyces cerevisiae. Genetics. 2010;185:871–882.
- Jin X, Gou JY. A rapid and cost-effective fluorescence detection in tube (FDIT) method to analyze protein phosphorylation. Plant Methods. 2016;12:43.
- Zheng CF, Guan KL. Activation of MEK family kinases requires phosphorylation of two conserved Ser/Thr residues. Embo J. 1994;13:1123–1131.
- Johnson LN, Noble ME, Owen DJ. Active and inactive protein kinases: structural basis for regulation. Cell. 1996;85:149–158.
- Pages G, Brunet A, L’Allemain G, et al. Constitutive mutant and putative regulatory serine phosphorylation site of mammalian MAP kinase kinase (MEK1). Embo J. 1994;13:3003–3010.
- Shiozaki K, Shiozaki M, Russell P. Heat stress activates fission yeast Spc1/StyI MAPK by a MEKK-independent mechanism. Mol Biol Cell. 1998;9:1339–1349.
- Deng YZ, Ramos-Pamplona M, Naqvi NI. Autophagy-assisted glycogen catabolism regulates asexual differentiation in Magnaporthe oryzae. Autophagy. 2009;5:33–43.
- Hurley JH, Young LN. Mechanisms of autophagy initiation. Annu Rev Biochem. 2017;86:225–244.
- Wen X, Klionsky DJ. An overview of macroautophagy in yeast. J Mol Biol. 2016;428:1681–1699.
- Bento CF, Renna M, Ghislat G, et al. Mammalian autophagy: how does it work? Annu Rev Biochem. 2016;85:685–713.
- Matsuura A, Tsukada M, Wada Y, et al. Apg1p, a novel protein kinase required for the autophagic process in Saccharomyces cerevisiae. Gene. 1997;192:245–250.
- Papinski D, Schuschnig M, Reiter W, et al. Early steps in autophagy depend on direct phosphorylation of Atg9 by the Atg1 kinase. Mol Cell. 2014;53:471–483.
- Chen GC, Lee JY, Tang HW, et al. Genetic interactions between Drosophila melanogaster Atg1 and paxillin reveal a role for paxillin in autophagosome formation. Autophagy. 2008;4:37–45.
- Di Bartolomeo S, Corazzari M, Nazio F, et al. The dynamic interaction of AMBRA1 with the dynein motor complex regulates mammalian autophagy. J Cell Biol. 2010;191:155–168.
- Russell RC, Tian Y, Yuan H, et al. ULK1 induces autophagy by phosphorylating beclin-1 and activating VPS34 lipid kinase. Nat Cell Biol. 2013;15:741–750.
- Tang HW, Wang YB, Wang SL, et al. Atg1-mediated myosin II activation regulates autophagosome formation during starvation-induced autophagy. Embo J. 2011;30:636–651.
- Yin Z, Pascual C, Klionsky DJ. Autophagy: machinery and regulation. Microb Cell. 2016;3:588–596.
- Hofius D, Schultz-Larsen T, Joensen J, et al. Autophagic components contribute to hypersensitive cell death in Arabidopsis. Cell. 2009;137:773–783.
- Kwon SI, Cho HJ, Kim SR, et al. The Rab GTPase RabG3b positively regulates autophagy and immunity-associated hypersensitive cell death in Arabidopsis. Plant Physiol. 2013;161:1722–1736.
- Han S, Wang Y, Zheng X, et al. Cytoplastic glyceraldehyde-3-phosphate dehydrogenases interact with ATG3 to negatively regulate autophagy and immunity in Nicotiana benthamiana. Plant Cell. 2015;27:1316–1331.
- Haxim Y, Ismayil A, Jia Q, et al. Autophagy functions as an antiviral mechanism against geminiviruses in plants. eLife. 2017;6.
- Ustun S, Hafren A, Liu Q, et al. Bacteria exploit autophagy for proteasome degradation and enhanced virulence in plants. Plant Cell. 2018;30:668–685.
- Bernales S, McDonald KL, Walter P. Autophagy counterbalances endoplasmic reticulum expansion during the unfolded protein response. PLoS Biol. 2006;4:e423.
- Anding AL, Baehrecke EH. Cleaning house: selective autophagy of organelles. Dev Cell. 2017;41:10–22.
- Talbot NJ, Ebbole DJ, Hamer JE. Identification and characterization of Mpg1, a gene involved in pathogenicity from the rice blast fungus Magnaporthe-grisea. Plant Cell. 1993;5:1575–1590.
- Liu X, Yang J, Qian B, et al. MoYvh1 subverts rice defense through functions of ribosomal protein MoMrt4 in Magnaporthe oryzae. PLoS Pathog. 2018;14:e1007016.
- Qi Z, Liu M, Dong Y, et al. The syntaxin protein (MoSyn8) mediates intracellular trafficking to regulate conidiogenesis and pathogenicity of rice blast fungus. New Phytol. 2016;209:1655–1667.
- Guo M, Guo W, Chen Y, et al. The basic leucine zipper transcription factor Moatf1 mediates oxidative stress responses and is necessary for full virulence of the rice blast fungus Magnaporthe oryzae. Mol Plant Microbe Interact. 2010;23:1053–1068.
- Yin Z, Chen C, Yang J, et al. Histone acetyltransferase MoHat1 acetylates autophagy-related proteins MoAtg3 and MoAtg9 to orchestrate functional appressorium formation and pathogenicity in Magnaporthe oryzae. Autophagy. 2019;15:1234–1257.
- Zhao X, Mehrabi R, Xu JR. Mitogen-activated protein kinase pathways and fungal pathogenesis. Eukaryot Cell. 2007;6:1701–1714.
- Ma Z, Zhu L, Song T, et al. A paralogous decoy protects Phytophthora sojae apoplastic effector PsXEG1 from a host inhibitor. Science. 2017;355:710–714.
- Ma Z, Song T, Zhu L, et al. A Phytophthora sojae glycoside hydrolase 12 protein is a major virulence factor during soybean infection and is recognized as a PAMP. Plant Cell. 2015;27:2057–2072.
- Kinoshita E, Kinoshita-Kikuta E, Takiyama K, et al. Phosphate-binding tag, a new tool to visualize phosphorylated proteins. Mol Cell Proteomics. 2006;5:749–757.
- Zhong K, Li X, Le X, et al. MoDnm1 dynamin mediating peroxisomal and mitochondrial fission in complex with MoFis1 and MoMdv1 is important for development of functional appressorium in Magnaporthe oryzae. PLoS Pathog. 2016;12:e1005823.