
ABSTRACT
Macroautophagy/autophagy, a highly conserved dynamic process, is one of the major degradative pathways in cells. So far, over 40 autophagy-related (ATG) genes have been identified in Saccharomyces cerevisiae, most of which have homologs in more complex eukaryotes. Autophagy plays a crucial role in cell survival and maintenance, and its dysfunction is related to various diseases, indicating that the proper regulation of autophagy is important. Although the overall process of autophagy has been extensively studied, in particular with regard to the function of the Atg proteins, relatively little is known about the regulatory mechanisms that control autophagy activity. Spt5 is one of the transcriptional factors that is universally conserved across all domains. This protein can form a complex with Spt4, together playing a central role in transcription. In complex eukaryotic cells, the Spt4-Spt5 complex plays a dual role in gene regulation, acting both to delay transcription through promoter-proximal pausing, and to facilitate transcriptional elongation. In contrast, in S. cerevisiae, only the positive function of the Spt4-Spt5 complex has been identified. Here, we show for the first time that the Spt4-Spt5 transcription factor complex negatively regulates ATG genes in S. cerevisiae, inhibiting autophagy activity during active growth. Under autophagy-inducing conditions, the repression is released by Spt5 phosphorylation, allowing an upregulation of autophagy activity.
Abbreviations
AID: auxin-inducible degron; ATG: autophagy-related; ChIP: chromatin immunoprecipitation;Cvt: cytoplasm-to-vacuole targeting; DSIF: DRB sensitivity-inducible factor; NELF: negativeelongation factor; ORF: open reading frame; PA: protein A; PE: phosphatidylethanolamine;prApe1: precursor aminopeptidase I; RT-qPCR: real-time quantitative PCR; RNAP II: RNApolymerase II; TSS: transcription start site; WT: wild-type
Introduction
Autophagy, a term from the Greek words “auto” (self) and “phagein” (to eat), is a highly regulated degradative process that allows cells to break down their own components within the vacuole in yeast and plants, or the lysosome in more complex eukaryotes [Citation1,Citation2]. A basal level of autophagy is usually maintained in physiological conditions, while in response to different stimuli (e.g., nutrient limitation, hypoxia and other stress conditions), autophagy is induced. Depending on how substrates are transported, autophagy is divided into 2 main types (macroautophagy and microautophagy) in yeast, whereas additional types of autophagic pathways including chaperone-mediated autophagy, chaperone-assisted selective autophagy and endosomal microautophagy exist in mammals [Citation3]. Both macroautophagy and microautophagy have nonselective and selective modes: the nonselective process refers to the turnover of bulk cytoplasm, whereas the selective pathway can specifically target damaged or superfluous organelles, protein aggregates, invasive pathogens and other intracellular components [Citation4]. In this paper, we mainly focus on yeast nonselective macroautophagy (hereafter autophagy), in which random cytoplasm is first sequestered within the phagophore, a transient double-membrane structure. The phagophore then expands and matures into a large cytoplasmic double-membrane vesicle termed the autophagosome [Citation5]. Once completed, the outer membrane of the autophagosome fuses with the vacuole, allowing the inner membrane and cargo to become exposed to the lumenal contents of this organelle and degraded by resident hydrolases [Citation6]. The breakdown products are finally released back into the cytosol to recycle the macromolecular constituents, and to generate energy to maintain cell viability under unfavorable conditions [Citation7].
Our understanding of the molecular mechanism of auto-phagy has greatly been advanced by yeast genetic studies in the past 2 decades. So far, more than 40 autophagy-related (ATG) genes have been identified in yeast, and most of the corresponding protein products are important factors that function to initiate, complete and regulate autophagy [Citation8,Citation9]. Because most work has focused on the basic mechanism, how auto-phagy is regulated still remains largely unexplored. In particular, little is known about the complicated modulation of gene expression and specific transcriptional regulators of autophagy. The dysfunction of autophagy resulting from altered ATG gene expression is related to various human diseases, indicating the importance of proper regulation of autophagy at the transcription level [Citation10]. In S. cerevisiae, a dramatic increase in ATG8 and ATG41 mRNA transcripts occurs when autophagy is induced, leading to a significant rise in the corresponding protein levels. Moreover, the expression level of Atg8 correlates with autophagosome size, whereas that of Atg41 is related to the frequency of autophagosome formation [Citation11,Citation12]. These results suggest that transcriptional control—and especially that of ATG8 and ATG41—is important in modulating autophagy [Citation11,Citation13]. Our lab showed that the transcriptional regulator Ume6 can negatively modulate autophagy, by binding to the promoter region of ATG8 in growing conditions [Citation13]. Another recently published study showed that the positive transcriptional regulator Gcn4 regulates ATG41 during starvation-induced autophagy [Citation11]. Here, we decided to further investigate autophagy regulation through transcriptional modulation.
Transcription, accomplished by RNA polymerase II (RNAP II), is a dynamic and highly regulated process. The success of transcription requires contributions from different transcription accessory factors, one of which is the heterodimeric Spt4-Spt5 complex [Citation14]. This complex can tightly associate with RNAP II in a transcription-dependent manner, and many studies have identified its essential role in promoting transcription elongation [Citation14]. The homolog of the Spt4-Spt5 complex in complex eukaryotes, DRB sensitivity-inducible factor (DSIF, composed of SUPT4H1 and SUPT5H), also shows inhibitory activities in the early stage of transcription [Citation15]. DSIF works with another multi-subunit complex, the negative elongation factor (NELF) to impart a promoter-proximal pausing mechanism to regulate RNAP II activity [Citation16]. This repressive state can be overcome by the positive transcription elongation factor b (P-TEFb) complex, phosphorylating POLR2A/RPB1 (the largest subunit of RNAP II) and the DSIF-NELF complex, which not only causes dissociation of NELF from RNAP II but also changes the DSIF status to promote transcription elongation [Citation17–Citation19]. Because there is no clear evidence showing the presence of NELF in yeast, most studies have only focused on the positive role of the Spt4-Spt5 complex in this organism. A recently published study does point out that there is a pause in early elongation specific to S. pombe, which resembles promoter-proximal pausing in metazoans [Citation20], but it still remains an open question as to whether the Spt4-Spt5 complex can play a dual role in transcription in S. cerevisiae.
Here, we show that Spt4 may work as a negative transcriptional regulator of autophagy in S. cerevisiae. The deletion of SPT4 leads to an increase in both mRNA and protein levels of ATG8/Atg8 and ATG41/Atg41 in growing conditions, and these changes correlate with an upregulated level of autophagy. During starvation, we observe a higher level of Spt5 phosphorylation, and the Sgv1/Bur1-Bur2 kinase complex, a homolog of P-TEFb, is responsible for this modification. The dephosphorylation of Spt5 or a transient loss of this protein results in autophagy deficiency and a clear reduction in ATG41/Atg41 expression, suggesting that Spt4 and Spt5 may play a distinct role in regulating auto-phagy. Chromatin immunoprecipitation (ChIP) analysis indicates that the Spt4-Spt5 complex can interact with DNA regions downstream of the transcription start site (TSS) on ATG41 in an Spt4-dependent manner in growing conditions. Taking all of the data together, we show for the first time a negative function of Spt4 in budding yeast, and provide the first identification of a negative regulator of ATG41 expression. In addition, these studies also advance our understanding of the fine-tuned regulation of auto-phagy at the transcriptional level.
Results
Spt4 negatively regulates the transcription of ATG8 and ATG41 in growing conditions
The Spt4-Spt5 complex functions as a transcriptional factor, acting to promote transcription elongation in yeast. However, many regulatory factors have opposite effects on ATG genes relative to genes encoding proteins that function primarily during vegetative growth. Accordingly, we decided to examine the effect of mutations in Spt4 and Spt5 on ATG gene expression. SPT5 is an essential gene; we therefore started our analysis with an spt4∆ strain. Initially, we focused on ATG8 and ATG41, because these genes show the greatest increase in synthesis following autophagy induction. Furthermore, the Atg8 and Atg41 protein levels provide rapid indirect indicators for transcriptional induction of autophagy.
Protein extracts were prepared from cells in growing conditions and analyzed by western blot. When testing the protein level of Atg8, in both wild-type (WT) and mutant strains, we deleted the PEP4 gene. Pep4 is a key hydrolase needed to activate many vacuolar enzymes; pep4∆ cells are largely protease defective [Citation21]. It is important to use this background to monitor Atg8 protein levels. This is due to the fact that Atg8 (in the form conjugated to phosphatidylethanolamine [PE]) lines both sides of the phagophore and remains attached to the inner surface of the completed autophagosome; this portion of Atg8 is delivered to the vacuole and degraded, but this degradation is blocked in the absence of Pep4 [Citation12]. Thus, the WT strain we refer to in this experiment actually corresponds to pep4∆.
We observed a consistent increase in the Atg8 protein level (which was detected primarily as Atg8–PE) in growing conditions (SD-N, t = 0 h) in an spt4∆ strain relative to the WT control (). To determine the protein level of Atg41, we integrated a protein A (PA) epitope tag at the C terminus of ATG41 at the chromosomal locus. Moreover, we used a PEP4 WT strain to examine the Atg41 protein level because Atg41 is not degraded within the vacuole. As with Atg8, we observed a massive upregulation of Atg41 in growing conditions when SPT4 was deleted (). In contrast, upon starvation (SD-N, t = 2 h), the difference in Atg8 and Atg41 protein levels between WT and spt4∆ cells was not significant (), suggesting that the predominant negative effect of Spt4 on autophagy may take place in growing conditions; the protein level of Spt4 was similar under both growing and starvation conditions (Figure S1A), indicating that the increase in Atg8–PE and Atg41 in the WT strain relative to the spt4∆ mutant during starvation was not due to the loss of Spt4 in the former.
Figure 1. Spt4 negatively regulates ATG8/Atg8 and ATG41/Atg41 expression in growing conditions. (A-D) Analysis of Atg8 and Atg41 protein levels. Protein extracts were generated from (A) wild-type (TVY1, pep4∆) and spt4∆ (WXY100, pep4∆) cells, or (C) wild-type (ZYY108) and spt4∆ (WXY114) cells expressing Atg41-PA, after growth in YPD to mid-log phase (growing conditions) and shifted to SD-N medium for 2 h (nitrogen starvation). Western blots were probed with anti-Atg8, anti-PA and anti-Pgk1 (loading control) antisera or antibodies. (B and D) Quantitative analysis of Atg8 and Atg41 protein levels, respectively. The protein level of either Atg8 or Atg41-PA after 2 h of starvation was set as 1 and other values were normalized; the error bar represents the SEM of at least 3 independent experiments. N.S., not significant, ***, p < 0.005. (E) Wild-type (WLY176) and spt4∆ (WXY105) cells were cultured until mid-log phase and collected in growing conditions. mRNA levels were quantified by RT-qPCR. The mRNA level of different ATG genes and YAT1 (negative control) in spt4∆ cells were normalized to that of the corresponding genes in wild-type cells, which was set as 1. Error bars represent the SEM of at least 3 independent experiments; two-tailed t test was used for statistical significance. p values are reported for the comparison between WT and spt4∆ strains in growing conditions. **, p < 0.01; ***, p < 0.005.
Next, we examined the mRNA levels of ATG8, ATG41 and other ATG genes in both WT and spt4∆ cells, by real-time quantitative PCR (RT-qPCR; ). There was a relative increase of ATG8 and an especially significant ATG41 increase during the vegetative stage in spt4∆ cells, whereas no obvious change was observed for the other ATG genes that we examined. We used YAT1 as a control in this analysis (). YAT1 expression is downregulated in spt4∆ cells, presumably due to the loss of Spt4-dependent transcription elongation [Citation22]. As expected, we found a decrease in YAT1 expression in the absence of Spt4. We also examined the protein levels of some Atg proteins for which there was no obvious difference in gene expression in the spt4∆ cells, and observed no significant change in protein amount relative to the WT (Figure S1B–D). Therefore, in growing conditions, Spt4 acts as a negative regulator in modulating the expression of at least ATG8 and ATG41 at the transcriptional level, a phenotype that is opposite to the known positive transcriptional role of Spt4.
Cells lacking Spt4 display increased autophagy activity
To test whether Spt4 can regulate autophagy activity, we applied 3 different well-established assays to measure auto-phagy activity in WT and spt4∆ cells. First, we measured autophagy activity using the quantitative Pho8∆60 assay. In S. cerevisiae, PHO8 encodes a vacuolar phosphatase that is delivered to the vacuole through the secretory pathway, leading to the activation of phosphatase activity [Citation23]. We generated a truncated form of Pho8, Pho8∆60, which lacks the N-terminal transmembrane domain and can only transit to the vacuole through nonselective autophagy [Citation24]. Thus, by measuring the phosphatase activity in cells expressing only Pho8∆60, we can measure autophagy flux. A significant increase in autophagy activity was observed in spt4∆ cells in 2-h nitrogen-starvation conditions compared to the WT cells (). This upregulated autophagy activity could also be seen in the mutant cells after a longer period of starvation, although the difference relative to the WT was reduced; this change likely reflects the fact that the negative effect of Spt4 is blocked in WT cells under starvation conditions so that the greatest difference is seen shortly after shifting out of growing conditions.
Figure 2. Spt4 negatively regulates autophagy activity. (A) Autophagy activity was measured with the quantitative Pho8∆60 assay in WT (JMY347) and spt4∆ (WXY131) cells under growing conditions (+N) and after 2 or 4 h of nitrogen starvation (-N). Error bars represent the SEM of at least 3 independent experiments. *, p < 0.05; **, p < 0.01. (B-C) Autophagy activity was measured using the GFP-Atg8 processing assay. Wild-type (WXY112) and spt4∆ cells (WXY113) with CUP1 promoter-driven GFP-ATG8 were grown to mid-log phase in YPD and then starved (SD-N) for the indicated times. Samples from growing (YPD, 0 h) and starvation (SD-N, t = 1–2 h) conditions were collected. Proteins were analyzed by western blot with anti-YFP antibody and anti-Pgk1 (loading control) antiserum. The quantitative analysis of processed GFP is shown in (C), and the error bar represents the SEM of 3 independent experiments. The processed GFP after 2 h of starvation was set as 1, and other values were normalized. *, p < 0.05; **, p < 0.01. (D-E) Wild-type (WXY121) and spt4∆ (WXY122) cells with a deletion of VAC8 were collected in both growing (YPD) and starvation (SD-N, t = 30–60 min) conditions. The precursor (pr) and mature forms of Ape1 were separated by SDS-PAGE and detected with anti-Ape1 antiserum by western blot. Pgk1 was used as a loading control. The ratio of processed Ape1 was quantified in (E), and the error bar represents the SEM of 3 independent experiments. The maturation of prApe1 after 60 min of starvation has been set as 1, and other values were normalized. *, p < 0.05; ***, p < 0.005.
We then used the GFP-Atg8 processing assay. The principle behind this assay relies on the delivery of the population of GFP-Atg8 that is attached on the inner membrane of the autophagosome and exposed to the vacuolar hydrolases following autophagosome-vacuole fusion. Compared to Atg8, GFP is more resistant to degradation; thereby, free GFP is generated in the vacuole lumen, and the conversion of GFP-Atg8 into GFP can be a readout for nonselective autophagic degradation [Citation25]. Because we determined that Spt4 can influence ATG8/Atg8 expression, we used the exogenous CUP1 promoter to drive GFP-Atg8 expression, thus eliminating Spt4-dependent effects. We observed an increasing amount of GFP-Atg8 processing in both WT and spt4∆ cells after starvation (SD-N), with more free GFP detected in spt4∆ cells compared to the WT (), indicating an elevated level of autophagy activity in the mutant cells.
To further support the results from the previous 2 assays, we used another method to monitor autophagy, which relies on the processing of precursor aminopeptidase I (prApe1). Ape1 is a resident vacuolar hydrolase that is initially synthesized as a cytosolic precursor with an N-terminal propeptide. The prApe1 can be delivered to the vacuole through either macroautophagy or the cytoplasm-to-vacuole targeting (Cvt) pathway. Furthermore, this analysis can be conducted similar to a pulse-chase assay by taking advantage of the vac8∆ phenotype. In the absence of VAC8, prApe1 processing is blocked under vegetative conditions; upon starvation (that is, following autophagy induction), prApe1 is delivered to the vacuole through a process that still requires a receptor and scaffold protein for maximal efficiency [Citation26]. Following delivery, prApe1 is processed to a mature, lower molecular mass species; thereby, we can monitor vacuolar delivery by western blot. As expected, in WT (vac8∆) cells there was essentially no mature Ape1 in growing conditions (SD-N, t = 0), and a clear increase in this species with increasing time in starvation conditions (). We detected a higher level of prApe1 processing in spt4∆ vac8∆ cells with a faint band corresponding to mature Ape1 visible even at the 0 h time point, again suggesting an increase in auto-phagy activity.
Taken together, these results indicate that there is an elevated level of autophagy in spt4∆ cells, suggesting that Spt4 negatively regulates this process, and that the deletion of SPT4 releases this repressive effect.
Spt5 phosphorylation correlates with the upregulation of ATG41 expression and increased autophagy activity during starvation
After starvation, the protein levels of Atg8 and Atg41 in the WT strain are almost equivalent to those in the spt4∆ mutant (); this is not due to changes in the Spt4 protein level (Figure S1A). In addition, there was no further increase in the protein amounts in spt4∆ cells, indicating that there is probably a mechanism for the release of Spt4-dependent negative regulation when autophagy is induced. Spt4 is a small protein with limited known functions, but its partner, Spt5, is required for transcription; previous reports have shown that the phosphorylation of SUPT5H/Spt5 is especially critical for processive transcription elongation [Citation17]. Therefore, we decided to examine the phosphorylation status of yeast Spt5 under starvation conditions and determine whether this modification can reverse the negative effect of Spt4.
We first used an Spt5-PA strain to monitor the expression and mobility of Spt5 in both nutrient-rich and nutrient-deprived conditions. In +N conditions we detected a single band of the expected molecular mass (150 kDa) for Spt5-PA (). When we starved cells, we again saw a band of 150 kDa, and a second band displaying reduced mobility. The same experiment was repeated using strains in which Spt5 was tagged with GFP and MYC, and we observed the same result—a single band in +N conditions, and a second band of higher molecular mass under starvation conditions (). Liu et al. (2009) generated antisera specific for the phosphorylated form of a 6-amino-acid consensus sequence derived from 15 repeats in the C terminus of Spt5 (anti-p-Spt5) [Citation27]. Using this anti-p-Spt5 antibody, we detected a faint band in growing conditions, which became more intense after starvation, whereas the total protein amount of Spt5 remained at a similar level in both growing and starvation conditions (). To further examine the effect of Spt4 on regulation, we examined potential Spt5 phosphorylation in the spt4∆ strain. The phosphorylation of Spt5 was more obvious in spt4∆ cells than WT cells under growing conditions, and it was massively increased after starvation (). Using Spt5-PA and spt4∆ Spt5-PA strains, we detected a band shift of Spt5 in spt4∆ cells in growing conditions, similar to the level seen in WT cells following autophagy induction (). The above results suggest that Spt5 can be further phosphorylated under autophagy-inducing conditions, and there is an increased level of Spt5 phosphorylation in the absence of Spt4.
Figure 3. Spt5 phosphorylation is enhanced after starvation or in the absence of Spt4. (A) The protein A (PA)-, GFP- and MYC-tagged Spt5 strains (WXY102, WXY107, DGY047) were collected in growing (YPD, mid-log phase) and starvation (SD-N, t = 2 h) conditions. The samples were separated by SDS-PAGE and detected by western blot with anti-PA, anti-YFP or anti-MYC antibodies. Anti-Pgk1 antiserum was used to detect the loading control. (B) Wild-type (SEY6210) cells were grown to mid-log phase in growing conditions (YPD) and then starved (SD-N) for 2 h. Samples under these 2 conditions were collected and analyzed by western blot. An antibody specific for the phosphorylated form of Spt5 (anti-p-Spt5) was used to detect the phosphorylated band (upper blot). We also examined phosphorylation in a strain expressing Spt5 tagged with PA (WXY102); the total protein level of Spt5 was detected with anti-PA and the phosphorylation of Spt5 was monitored with the anti-p-Spt5 antibody (lower blot) (C) Samples from wild-type (WLY176) and spt4∆ (WXY105) strains were collected in both growing (YPD) and starvation (SD-N, t = 2 h) conditions for western blot analysis. Spt5 phosphorylation was monitored with the anti-p-Spt5 antibody. (D) The Spt5-PA level of wild-type (WXY102) and spt4∆ (WXY103) cells in growing (YPD) and starvation (SD-N) conditions was detected by western blot with anti-PA antibodies.
We next examined whether interfering with Spt5 phosphorylation would influence ATG expression and autophagy activity. Based on information from several previous studies [Citation27–Citation29], we decided to carry out site-directed mutagenesis on the last 7 serine residues (S1009, S1015, S1025, S1032, S1043, S1052, S1058) in the C terminus of Spt5. Conversion of these residues to alanine resulted in the generation of a nonphosphorylable mutant, Spt5[S7A]. A clear mobility difference was observed between WT and Spt5[S7A] cells after starvation, indicating the relative absence of phosphorylation of Spt5 in Spt5[S7A]-expressing cells (). We further applied the GFP-Atg8 assay to test autophagy activity, which showed a significantly decreased GFP-Atg8 processing in mutant cells after starvation (); therefore auto-phagy activity was reduced when Spt5 phosphorylation was blocked. As predicted based on these results, Spt5[S7A] cells exhibited decreased mRNA and protein levels of ATG41/Atg41 in the nutrient-deficient condition, whereas there was no difference under growing conditions (). However, the influence of Spt5 dephosphorylation on ATG8 mRNA level was not obvious, indicating that Spt5 may play a role primarily in regulating ATG41 (Figure S2A).
Figure 4. Dephosphoryaltion of Spt5 negatively modulates autophagy by downregulating ATG41 mRNA and protein levels after starvation. (A) Samples collected from cells expressing WT (DGY047) and nonphosphorylable Spt5 (DGY048) were analyzed by western blot. The phosphorylation of Spt5 was detected with the specific anti-p-Spt5 antibody. (B-C) Autophagy activity was measured by GFP-Atg8 processing in WT (DGY050) and Spt5[S7A] (DGY051) cells harboring endogenous GFP-ATG8 plasmids under growing conditions and after 2 h of starvation. The quantitative analysis of processed GFP after starvation (there is no processed GFP in the growing condition) is shown in (C), and the error bar represents the SEM of 3 independent experiments. The processed GFP of the WT strain after starvation was set as 1, and other values were normalized. ***, p < 0.005. (D) The mRNA level of ATG41 in WT (DGY047) and Spt5[S7A] (DGY048) cells was measured by RT-qPCR under growing conditions and starvation (SD-N, 1 h). The error bar represents the SEM of 3 independent experiments, and p values are reported for the comparison between the wild-type and Spt5[S7A] strains during starvation. N.S., not significant, ***, p < 0.005. (E) The anti-PA antibody was used to detect Atg41-PA in samples (WT, WXY127; Spt5[S7A], WXY128) collected from growing and starvation (SD-N, 2 h) conditions by western blot analysis.
![Figure 4. Dephosphoryaltion of Spt5 negatively modulates autophagy by downregulating ATG41 mRNA and protein levels after starvation. (A) Samples collected from cells expressing WT (DGY047) and nonphosphorylable Spt5 (DGY048) were analyzed by western blot. The phosphorylation of Spt5 was detected with the specific anti-p-Spt5 antibody. (B-C) Autophagy activity was measured by GFP-Atg8 processing in WT (DGY050) and Spt5[S7A] (DGY051) cells harboring endogenous GFP-ATG8 plasmids under growing conditions and after 2 h of starvation. The quantitative analysis of processed GFP after starvation (there is no processed GFP in the growing condition) is shown in (C), and the error bar represents the SEM of 3 independent experiments. The processed GFP of the WT strain after starvation was set as 1, and other values were normalized. ***, p < 0.005. (D) The mRNA level of ATG41 in WT (DGY047) and Spt5[S7A] (DGY048) cells was measured by RT-qPCR under growing conditions and starvation (SD-N, 1 h). The error bar represents the SEM of 3 independent experiments, and p values are reported for the comparison between the wild-type and Spt5[S7A] strains during starvation. N.S., not significant, ***, p < 0.005. (E) The anti-PA antibody was used to detect Atg41-PA in samples (WT, WXY127; Spt5[S7A], WXY128) collected from growing and starvation (SD-N, 2 h) conditions by western blot analysis.](/cms/asset/7c89975b-399f-4dd2-9a5a-56745fb0e12f/kaup_a_1659573_f0004_b.gif)
We also established a phosphomimetic form of the protein Spt5[S7E] by mutating the Spt5 serine residues in the C terminus to glutamate. We first measured autophagic activity in both Spt5[S7A] and Spt5[S7E] cells using the quantitative Pho8∆60 assay. Compared to WT cells, Spt5[S7A] showed a decrease of autophagy activity, whereas the Spt5[S7E] mutant exhibited upregulated autophagy activity after 4 h of starvation (Figure S2B). The GFP-Atg8 processing assay also indicated that autophagy activity was enhanced in Spt5[S7E] cells (Figure S2C,D). Because Spt5 phosphorylation is maintained at a basal level in growing conditions and is further upregulated after starvation, the most obvious phenotype of the phosphomimetic mutant should be observed in nutrient-rich conditions. In agreement with our hypothesis, the mRNA level of ATG41 showed a slight increase in the Spt5[S7E]-expressing cells in growing conditions, while the Atg41 protein level did not change compared to the WT in both growing and starvation conditions, suggesting that the slight increase in ATG41 mRNA level was not sufficient to drive a detectable upregulation of the protein level (Figure S2E,F). Thus, with the Spt5[S7E] mutant, a positive role in transcription elongation of other factors may account for the observed increase in autophagy activity.
Because SPT5 is an essential gene, we took advantage of an auxin-inducible degron (AID) system to generate an Spt5-inducible degradation strain [Citation30]. After 30 min of auxin treatment, Spt5 protein levels were undetectable in the Spt5-inducible degradation strain (Spt5-AID-MYC), which provided us with a method to conditionally control the expression of this protein (Figure S3A). With this strain, we used the GFP-Atg8 processing assay to test autophagy activity. We found that the autophagy activity decreased when Spt5 was temporally depleted (Figure S3B,C). Correspondingly, the expression of ATG41/Atg41 decreased when applying auxin treatment to the Spt5-AID strain (Figure S3D,E). Therefore, in contrast to Spt4, Spt5 appears to always play a positive role in regulating autophagy, which agrees with its essential role in transcription elongation.
We extended this analysis by examining an additional Spt5 mutant. In this case, we transformed centromeric plasmids expressing SPT5 WT and mutant (MUT; which contains an Spt5 derivative with 15 potentially phosphorylated C-terminal domain serine residues changed to alanine) into the Spt5-inducible degradation strain. These strains thus contain 2 copies of SPT5 after transformation; the application of auxin resulted in the degradation of the WT Spt5-AID-MYC. After starvation, WT cells treated with the chemical carrier DMSO and probed with the anti-p-Spt5 phospho-specific antiserum displayed 2 bands (Figure S4A). The upper band corresponded to the phosphorylated Spt5 from the WT chromosomally integrated Spt5-AID-MYC, whereas the lower band marked the position of phosphorylated Spt5 expressed from the plasmid; only the WT form of the latter protein, not the [S15A] version, was detected with the anti-p-Spt5 serum. After auxin treatment, Spt5-AID-MYC was completely degraded so that the only species of Spt5 that remained was derived from the plasmid. In the nutrient-depleted condition, we observed a decreased ATG41 mRNA level in mutant cells with auxin treatment whereas the ATG8 mRNA level showed no change (Figure S4B); this was similar to results from Spt5[S7A] cells ( and Figure S2A). Therefore, we conclude that Spt4 plays a negative role in regulating ATG41 in growing conditions, and that this inhibitory role is reversed by Spt5 phosphorylation when autophagy is induced.
The Sgv1/Bur1-Bur2 complex phosphorylates Spt5 after starvation
Yeast Sgv1/Bur1, which is similar in sequence to mammalian P-TEFb, can phosphorylate the C-terminal domain of both Spt5 and RNAP II under normal growth conditions [Citation27]. Sgv1 forms a complex with the regulatory protein Bur2, a divergent cyclin; the Sgv1-Bur2 complex together plays a role in regulating transcription [Citation31]. Although SGV1 is essential, BUR2 is not an essential gene. Therefore, we analyzed Spt5-PA phosphorylation in WT and bur2∆ cells. The band shift of Spt5 that was observed in the WT strain following autophagy induction disappeared in bur2∆ mutant cells (). The phosphorylated band was also absent in the mutant cells probed with the anti-p-Spt5 antibody (). Therefore, the Sgv1-Bur2 complex is responsible for the observed phosphorylation of Spt5 in starvation conditions. Because the deletion of BUR2 was sufficient to block the phosphorylation of Spt5, we further used the bur2∆ strain to examine its influence on ATG41. In the nutrient-deficient condition, both mRNA and protein levels of ATG41/Atg41 decreased when BUR2 was deleted (), which corresponded to our observations with the nonphosphorylable Spt5[S7A] mutant ().
Figure 5. The Sgv1-Bur2 complex is responsible for Spt5 phosphorylation after starvation, and Sgv1 is phosphorylated under starvation conditions by the Rim15 kinase. (A) Samples from the Spt5-PA wild-type (WXY102) and bur2∆ (WXY104) strains were collected in both growing (YPD) and starvation (SD-N) conditions for western blot analysis. Anti-PA antibody and anti-Pgk1 antiserum were used to detect the indicated proteins. (B) The Spt5 phosphorylation was detected with anti-p-Spt5 antibody in wild-type (WLY176) and bur2∆ (WXY115) samples collected from growing (YPD) and starvation (SD-N, t = 2 h) conditions. (C) The Atg41-PA level was probed with anti-PA antibody in wild-type (ZYY108) and bur2∆ (WXY116) cells from growing (YPD) and starvation (SD-N, t = 2 h) conditions. (D) The wild-type (WLY176) and bur2∆ (WXY115) cells were cultured until mid-log phase in growing conditions (YPD) and then shifted to starvation conditions (SD-N) for 1 h. The mRNA level of ATG41 was measured by RT-qPCR. The error bar represents the SEM of 3 independent experiments, and p values are reported for the comparison between the wild-type and bur2∆ strains during starvation. ***, p < 0.005. (E) The Sgv1-MYC wild-type (WXY117) and rim15∆ (WXY120) strains were grown in YPD to mid-log phase and then shifted to starvation conditions (SD-N) for 2 h. The samples were then collected and analyzed by western blot using antibodies to MYC. The samples from wild-type (WLY176) and rim15∆ (WXY123) cells were also collected and Spt5 phosphorylation was detected with the anti-p-Spt5 antibody. Pgk1 was used as the loading control. (F) The Atg41-PA wild-type (ZYY108) and rim15∆ (WXY124) cells were collected in both growing (YPD) and starvation (SD-N) conditions for western blot analysis. Anti-PA antibody and anti-Pgk1 antiserum were used to detect the indicated proteins. (G) RT-qPCR analysis of ATG41 mRNA level in WT (WLY176) and rim15∆ (WXY123) cells under growing and starvation conditions. The error bar represents the SEM of 3 independent experiments.
In addition, we extended our analysis on the regulation of Spt5 by examining potential connections with other kinases in regulating autophagy. Rim15 plays a crucial role in integrating many nutrient-regulatory signals, and previous work from our lab has found that Rim15 positively regulates autophagy activity [Citation32]. In rim15∆ cells, phosphorylation of the Sgv1 kinase was suppressed, and the phosphorylation of Spt5 was largely, but not completely, blocked under starvation conditions (), suggesting that Rim15 may function upstream of the Sgv1-Bur2 complex to control Spt5. However, mRNA and protein levels of ATG41/Atg41 showed no clear difference in the rim15∆ mutant, indicating that the partial block of Spt5 phosphorylation was not enough to affect ATG41 expression (). Atg1 is the only protein kinase in the core autophagy machinery [Citation33], and we further tested its potential effect on Spt5 phosphorylation. In atg1∆ cells, we could detect a partial decrease of the Spt5 phosphorylated band after starvation, but there was no significant change in ATG41 mRNA level (Figure S5A,B), which was similar to the phenotype of rim15∆ cells (). These results suggest that, after starvation, a small population of phosphorylated Spt5 may be sufficient to induce ATG41 expression.
Spt5 binds to ATG41 DNA in an Spt4-dependent manner
Based on the above experiments, the Spt4-Spt5 complex plays a major role in regulating ATG41/Atg41 expression. Thus, we decided to investigate the mechanism through which the Spt4-Spt5 complex regulates the transcription of ATG41. Because this complex is a transcription factor, we used a chromatin immunoprecipitation (ChIP) approach in both Spt5-PA and Spt4-PA strains to test whether this complex can directly bind to DNA. We designed several pairs of primers, each spanning approximately 130 to 170 nucleotides of different regions from the promoter to the open reading frame (ORF) of ATG41. The results showed that the +20 base pair (bp) and +110 bp regions in the ORF of ATG41 were highly enriched in the DNA fragments precipitated with Spt5-PA, suggesting that Spt5 might bind tightly to these regions when autophagy is not induced (). A similar enrichment was also observed in the Spt4-PA strain in growing conditions (). The relative accumulation of the Spt4-Spt5 complex at these 2 regions near the TSS presumably reflects the normal situation, and thus maintains low expression of ATG41 in growing conditions. In contrast, we did not observe an enrichment of ATG1 DNA bound to Spt5-PA and Spt4-PA (Figure S6A,B), in agreement with the lack of an effect of Spt4 on ATG1 expression ( and Figure S1D). In spt4∆ cells, the mRNA level of ATG41 increased dramatically (), indicating active transcription of ATG41 when Spt4 was absent. Accordingly, the increase in the enrichment of the ATG41 +20 bp and +110 bp regions with Spt5-PA ChIP went down in spt4∆ cells compared to WT cells, suggesting a release from the temporary “halting” at the early stage of ATG41 transcription (). Taken together, we propose that in nutrient-rich conditions, Spt4 acts negatively on Spt5, interfering with phosphorylation of the latter, and causing the complex to accumulate at regions near the ATG41 TSS; this regulation is part of the mechanism that functions to maintain a low, basal level of gene expression.
Figure 6. Spt5 binds to ATG41 DNA in an Spt4-dependent manner. (A-C) Chromatin immunoprecipitation (ChIP) was done in Spt5-PA (WXY102), Spt4-PA (WXY106) and spt4∆ Spt5-PA (WXY103) strains. The ChIP samples were collected in the growing condition (mid-log phase). RT-qPCR was used for quantitative analysis. The primers for ChIP cover different DNA regions from the promoters through the ORF in ATG41. “-” indicates upstream of the ATG start codon, and “+” indicates downstream of the ATG start codon. (A) RT-qPCR analysis of ChIP samples of the Spt5-PA (WXY102) strain. The values were normalized to the input. The error bars show the SEM of at least 3 independent experiments. p values in each region are reported for the comparison with the negative control, TFC1. ***, p < 0.005; N.S., not significant. (B) RT-qPCR analysis of ChIP samples of the Spt4-PA (WXY106) strain. The error bars show the SEM of at least 3 independent experiments: *, p < 0.05; N.S., not significant. (C) RT-qPCR analysis of ChIP samples of Spt5-PA (WXY102) and spt4∆ Spt5-PA (WXY103) cells. The values were normalized to the input DNA. TFC1 was used as a negative control and the error bars represent the SEM of at least 3 independent experiments. The significance analysis for spt4∆ strains was noted: N.S., not significant.
Discussion
When facing different environmental stress conditions, it is important to finely tune the magnitude of autophagy in order to maintain cell homeostasis and prevent diseases. The efficient response of autophagy requires the upregulation of many ATG genes, among which ATG8 and ATG41 display the most dramatic changes. Previous studies from our lab have identified 2 transcription factors in autophagy: Ume6 as a repressor of ATG8, and Gcn4 as an activator of ATG41 [Citation11,Citation13]. We found that the absence of Ume6 did not affect the level of Atg41 (Figure S7A). However, our understanding about the transcriptional regulation of even these genes is still limited. Here, we present data supporting a previously unknown negative role of Spt4 in regulating the expression of ATG8 and ATG41 in budding yeast. Furthermore, Spt4 is the first identified negative transcriptional regulator of ATG41, and this negative function was not due to a change of Gcn4 expression (Figure S7B).
The heterodimeric Spt4-Spt5 complex is a highly conserved transcription regulator, and it can tightly bind to the coiled domain of RNAP II in a transcription-dependent manner [Citation34]. Many studies have revealed the essential role of the Spt4-Spt5 complex in promoting transcription elongation, and, in more complex eukaryotes, further work on DSIF (the Spt4-Spt5 homolog), in conjunction with the NELF complex, has indicated the existence of a mechanism that pauses transcription at the early stage. Genome-wide studies have revealed that pausing is widespread in mammalian cells, defined by a temporary halt of transcription within ~100 nucleotides downstream of the TSS [Citation35]. The release from pausing relies on phosphorylation of the SUPT5H C terminus by the P-TEFb kinase, thereby changing the status of DSIF to positively regulate transcription elongation [Citation18]. Follow-up precision run-on sequencing (PRO-seq) studies have also identified a promoter-proximal pause-like phenomenon in fission yeast [Citation20].
However, in other organisms that lack NELF such as S. cerevisiae, currently there are no reports showing a role of the Spt4-Spt5 complex in transcriptional pausing; although PRO-Seq data provide an indication that Spt4 may have some negative role in transcription [Citation20]. Compared to the published large-scale genome studies, our data show that the Spt4-Spt5 complex may act in a gene-specific manner in budding yeast, with Spt4 having an additional and clear negative role for certain ATG genes under growing conditions. This type of regulation fits with the observation that stress-response genes, such as ATG genes are regulated in a manner that is opposite to most genes encoding proteins that function during vegetative growth [Citation36,Citation37]. The deletion of SPT4 leads to an increase of ATG8/Atg8 and ATG41/Atg41, and the change in ATG41 expression in particular facilitates an increase in autophagy activity. After starvation, we observed an enhanced phosphorylation of Spt5. Of note, Spt5 phosphorylation also increases when SPT4 is absent. Accordingly, the dephosphorylation of Spt5 results in a clear autophagy deficiency and a significant decrease in ATG41 expression, which demonstrates that Spt5 phosphorylation is important for regulating autophagy after starvation, with Spt4 having a largely negative role in regulation for ATG41. The deletion of BUR2, the regulatory partner of the Sgv1 kinase complex, blocks Spt5 phosphorylation and leads to a lower expression of ATG41/Atg41, further suggesting the importance of Spt5 phosphorylation in ATG41 transcription. In addition, both Spt4 and Spt5 can bind to the DNA region in the ORF of ATG41, whereas the absence of Spt4 prevents the accumulation of Spt5 at the ATG41 TSS, suggesting that Spt4 might influence the function of Spt5 by controlling its access to the Sgv1 kinase, and its subsequent interaction with DNA ().
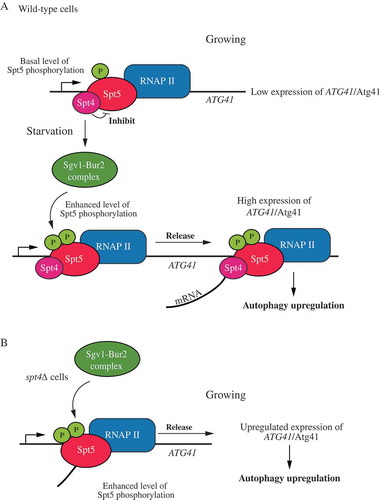
Figure 7. A model for Spt4-Spt5-dependent regulation of ATG41. (A) In wild-type cells under growing conditions, the Spt4-Spt5 complex may inhibit transcription of ATG41 through an Spt4-dependent interference with Spt5 phosphorylation, causing the complex to accumulate near the TSS. After starvation, phosphorylation of Spt5 by the Sgv1-Bur2 kinase complex releases the inhibitory effect of Spt4 on ATG41 transcription, and the Spt4-Spt5 complex participates in transcription elongation. (B) In spt4∆ cells, Spt5 does not accumulate near the TSS of ATG41, and transcription actively proceeds. Spt5 can also be more efficiently phosphorylated upon the deletion of SPT4.
There are still many remaining questions that await further analysis. For example, although Spt4 plays a negative role in regulating ATG8/Atg8 expression, and both Spt4 and Spt5 can bind to specific regions on ATG8 DNA (Figure S8A,B), Spt5 phosphorylation seems not to be the reason for ATG8 upregulation after starvation, because dephosphorylation of Spt5 causes no significant changes in the level of ATG8. However, the deletion of BUR2 leads to a decreased level of ATG8/Atg8 (Figure S8C,D). Therefore, there appears to be another unknown mechanism behind the Sgv1-Bur2 kinase complex to directly regulate ATG8. Moreover, compared to the very large increase (~10 fold) of the ATG41 mRNA level seen in spt4∆ cells, ATG8 exhibits a rather milder increase of ~2 fold. However, the ratio of upregulated protein level of Atg8 is similar to that of Atg41 in the spt4∆ mutant in vegetative conditions. Similarly, in the ume6∆ strain, the ATG8 mRNA level increases ~3 fold (Figure S8E), while the protein level shows a substantially more dramatic change [Citation13]. This leads us to propose that there are other downstream factors that influence the protein level of Atg8 after transcription. Another question that remains to be answered is how the Sgv1 kinase complex senses the starvation signal and further enhances the phosphorylation of Spt5. Rim15 seems to be a good candidate for phosphorylating Sgv1 when autophagy is induced, but its direct effect on ATG41 is not clear. Finally, our initial exploration of the negative function of Spt4 with regard to particular ATG genes was based on a raw large-scale PRO-seq analysis (data not shown), but it will also be important to determine what other genes that may affect autophagy, if any, are negatively regulated by Spt4.
Here, for the first time we have revealed a negative role of Spt4 within the Spt4-Spt5 complex in regulating transcription in budding yeast. Furthermore, Spt4 and Spt5 carry out different functions with regard to the regulation, in which Spt4 has a negative function in growing conditions whereas Spt5 is always required for efficient transcription. Because autophagy plays a crucial physiological role, and its dysfunction is associated with many diseases, our results can also advance an understanding of the transcriptional control of autophagy, which may provide new directions for future therapeutics.
Materials and methods
Yeast strains, media and culture conditions
Yeast strains used are listed in Table S1. We applied standard methods to generate gene deletions and/or for C-terminal tagging [Citation38,Citation39]. Yeast cells were grown in rich medium at 30°C (YPD: 1% [w:v] yeast extract, 2% [w:v] peptone, and 2% [w:v] glucose). Autophagy was induced upon nitrogen starvation by shifting mid-log phase cells from YPD to SD-N (0.17% yeast nitrogen base without ammonium sulfate or amino acids, and 2% [w:v] glucose) for the indicated times.
Antibodies and antisera
Anti-YFP antibody, which detects GFP, was from Clontech (JL-8; 63281), anti-PA antibody was from Jackson Immuno Research (323-005-024), anti-MYC was from Sigma (M4439), and anti-Pgk1 is a generous gift from Dr. Jeremy Thorner (University of California, Berkeley). Anti-p-Spt5 antibody was generously provided by Dr. Steven Hahn [Citation27]. Antibodies to Ape1, Atg1 and Atg8 were described previously [Citation40–Citation42].
Plasmids
GFP-Atg8(405) contains the GFP-Atg8 open reading frame with the endogenous ATG8 promoter. pCu-GFP-ATG8(405) was constructed by replacing the endogenous ATG8 promoter with the CUP1 promoter, containing the GFP-Atg8 open reading frame [Citation43]. These plasmids were linearized and integrated into the corresponding strains listed in Table S1. Plasmids expressing Flag-tagged WT Spt5 and Spt5[S15A] were provided by Dr. Steven Hahn [Citation27].
Real-time quantitative PCR
Yeast cells were cultured in YPD to mid-log phase and shifted to SD-N for autophagy induction. Total RNA was extracted with an RNA extraction kit (NucleoSpin RNA II; Clontech, 740955.50), and reverse transcription was undertaken using the High Capacity cDNA Reverse Transcription Kit (ThermoFisher Scientific, 4368814). RT-qPCR was performed using the Power SYBR Green PCR Mix (ThermoFisher Scientific, 4367659) or Radiant Green Lo-ROX qPCR kit (Alkali Scientific, QS1020). All primer information can be found in Table S2.
Auxin-inducible degron (AID) system and transcriptional inhibition
WLY176 cells were first transformed with the plasmid pNHK53 (ADH1p-OsTIR1-9MYC; National BioResource Project–Yeast [Japan]), and Spt5 was then tagged with AID-9MYC (Addgene, 99522; deposited by Dr. Helle Ulrich) by homologous recombination. The auxin-inducible degron (AID) refers to the 71–116 amino acids of the AT1G04250/ATIAA17 protein in plants. To control Spt5 protein levels, the cells were treated with 300 μM 3-indoleacetic acid (auxin; Sigma, I2886) or DMSO (vehicle) in the vegetative condition for 30 min to induce degradation of Spt5. Then the cells were shifted to SD-N for nitrogen starvation with application of auxin or DMSO. After 1 h of starvation and treatment, samples were collected for western blot and RNA extraction.
Chromatin immunoprecipitation (Chip)
ChIP was performed with some modifications from a method described previously [Citation44]. The strains that are used in the study are Spt5-PA (WXY102), Spt4-PA (WLY106) and spt4∆ Spt5-PA (WXY103). After yeast cells grew to OD600 ~ 0.8 in YPD medium, a final concentration of 1% formaldehyde was added to perform cross-linking and the cultures were shaken for 20 min at room temperature. Glycine was added to 0.2 M to stop cross-linking. Samples were then harvested, washed in PBS and resuspended in FA lysis buffer (50 mM HEPES, pH 7.5, 150 mM NaCl, 1 mM EDTA, 1% Triton X-100 [Sigma, T8787], 0.1% sodium deoxycholate [Sigma, D6750], 0.1% SDS). The cells were lysed with glass beads by being vortexed at 4°C, and then were centrifuged at 1000 x g for 1 min. The supernatant was collected for sonication (4 cycles of 25 s on, 59 s off, pulse at a power output of 20%) at 4°C. Sonicated samples were collected by centrifugation, and the supernatant was collected and then divided into input and IP fractions. Half of the IP fractions were incubated with IgG Sepharose 6 Fast Flow beads (Fisher Scientific, 45-000-173) while the other half were incubated with PA beads (“non-antibody” mock control) for 4 h at 4°C. After immunoprecipitation, the beads were washed with FA lysis buffer and wash buffer (10 mM Tris-HCl, pH 8.0, 0.25 M LiCl, 1 mM EDTA, 0.5% Nonidet P-40 [IGEPAL; Fisher Scientific, NC9983875], 0.5% sodium deoxycholate), resuspended in elution buffer (50 mM Tris-HCl, pH 7.5, 10 mM EDTA, 1% SDS) and incubated at 70°C for 12 min (with mixing by vortex every 3 min). With the addition of proteinase K (Fisher Scientific, NC9404543), reverse cross-linking was performed by incubation for 2 h at 42°C followed by 6 h at 65°C. The reverse cross-linked samples were then incubated with RNase A (Qiagen, 19,101) at 37°C for 30 min. The purified DNA was examined by RT-qPCR analysis, which was performed using the Power SYBR Green PCR Mix (ThermoFisher Scientific, 4367659). The information for all primers is listed in Table S2.
Other methods
Western blot, GFP-Atg8 processing, and prApe1 processing were described previously [Citation3].
Statistical analysis
Two-tailed Student’s t test and two-tailed paired Student’s t test were used to determine statistical significance.
Supplemental Material
Download PDF (2.3 MB)Acknowledgments
The authors thank Drs. Vivian Cheung and Isabel Wang for helpful comments and technical advice, and Dr. Steven Hahn for providing reagents.
Disclosure statement
No potential conflict of interest was reported by the authors.
Supplementary material
The supplemenatry data for this article can be accessed here
Additional information
Funding
Related Research Data
References
- Yang Z, Klionsky DJ. Eaten alive: a history of macroautophagy. Nat Cell Biol. 2010;12(9):814–822.
- Klionsky DJ, Cregg JM, Dunn WA, et al. A unified nomenclature for yeast autophagy-related genes. Dev Cell. 2003;5(4):539–545.
- Klionsky DJ, Abdelmohsen K, Abe A, et al. Guidelines for the use and interpretation of assays for monitoring autophagy (3rd edition). Autophagy. 2016;12(1):1–222.
- Feng Y, He D, Yao Z, et al. The machinery of macroautophagy. Cell Res. 2014;24(1):24–41.
- Baba M, Takeshige K, Baba N, et al. Ultrastructural analysis of the autophagic process in yeast: detection of autophagosomes and their characterization. J Cell Biol. 1994;124(6):903–913.
- Yang Z, Klionsky DJ. An overview of the molecular mechanism of autophagy. Curr Top Microbiol Immunol. 2009;335:1–32.
- He C, Klionsky DJ. Regulation mechanisms and signaling pathways of autophagy. Annu Rev Genet. 2009;43:67–93.
- Wen X, Klionsky DJ. An overview of macroautophagy in yeast. J Mol Biol. 2016;428(9 Pt A):1681–1699.
- Reggiori F, Klionsky DJ. Autophagic processes in yeast: mechanism, machinery and regulation. Genetics. 2013;194(2):341–361.
- Shintani T, Klionsky DJ. Autophagy in health and disease: a double-edged sword. Science. 2004;306(5698):990–995.
- Yao Z, Delorme-Axford E, Backues SK, et al. Atg41/Icy2 regulates autophagosome formation. Autophagy. 2015;11(12):2288–2299.
- Xie Z, Nair U, Klionsky DJ. Atg8 controls phagophore expansion during autophagosome formation. Mol Biol Cell. 2008;19(8):3290–3298.
- Bartholomew CR, Suzuki T, Du Z, et al. Ume6 transcription factor is part of a signaling cascade that regulates autophagy. Proc Natl Acad Sci U S A. 2012;109(28):11206–11210.
- Hartzog GA, Fu J. The Spt4-Spt5 complex: a multi-faceted regulator of transcription elongation. Biochim Biophys Acta. 2013;1829(1):105–115.
- Wada T, Takagi T, Yamaguchi Y, et al. DSIF, a novel transcription elongation factor that regulates RNA polymerase II processivity, is composed of human Spt4 and Spt5 homologs. Genes Dev. 1998;12(3):343–356.
- Yamaguchi Y, Takagi T, Wada T, et al. NELF, a multisubunit complex containing RD, cooperates with DSIF to repress RNA polymerase II elongation. Cell. 1999;97(1):41–51.
- Yamada T, Yamaguchi Y, Inukai N, et al. P-TEFb-mediated phosphorylation of hSpt5 C-terminal repeats is critical for processive transcription elongation. Mol Cell. 2006;21(2):227–237.
- Ni Z, Saunders A, Fuda NJ, et al. P-TEFb is critical for the maturation of RNA polymerase II into productive elongation in vivo. Mol Cell Biol. 2008;28(3):1161–1170.
- Chen Y, Yamaguchi Y, Tsugeno Y, et al. DSIF, the Paf1 complex, and Tat-SF1 have nonredundant, cooperative roles in RNA polymerase II elongation. Genes Dev. 2009;23(23):2765–2777.
- Booth GT, Wang IX, Cheung VG, et al. Divergence of a conserved elongation factor and transcription regulation in budding and fission yeast. Genome Res. 2016;26(6):799–811.
- Ammerer G, Hunter CP, Rothman JH, et al. PEP4 gene of Saccharomyces cerevisiae encodes proteinase A, a vacuolar enzyme required for processing of vacuolar precursors. Mol Cell Biol. 1986;6(7):2490–2499.
- Rondon AG, García-Rubio M, González-Barrera S, et al. Molecular evidence for a positive role of Spt4 in transcription elongation. Embo J. 2003;22(3):612–620.
- Klionsky DJ, Emr SD. Membrane protein sorting: biosynthesis, transport and processing of yeast vacuolar alkaline phosphatase. Embo J. 1989;8(8):2241–2250.
- Klionsky DJ. Monitoring autophagy in yeast: the Pho8Delta60 assay. Methods Mol Biol. 2007;390:363–371.
- Shintani T, Klionsky DJ. Cargo proteins facilitate the formation of transport vesicles in the cytoplasm to vacuole targeting pathway. J Biol Chem. 2004;279(29):29889–29894.
- Scott SV, Nice III DC, Nau JJ, et al. Apg13p and Vac8p are part of a complex of phosphoproteins that are required for cytoplasm to vacuole targeting. J Biol Chem. 2000;275(33):25840–25849.
- Liu Y, Warfield L, Zhang C, et al. Phosphorylation of the transcription elongation factor Spt5 by yeast Bur1 kinase stimulates recruitment of the PAF complex. Mol Cell Biol. 2009;29(17):4852–4863.
- Swaney DL, Beltrao P, Starita L, et al. Global analysis of phosphorylation and ubiquitylation cross-talk in protein degradation. Nat Methods. 2013;10(7):676–682.
- Holt LJ, Tuch BB, Villén J, et al. Global analysis of Cdk1 substrate phosphorylation sites provides insights into evolution. Science. 2009;325(5948):1682–1686.
- Morawska M, Ulrich HD. An expanded tool kit for the auxin-inducible degron system in budding yeast. Yeast. 2013;30(9):341–351.
- Wood A, Shilatifard A. Bur1/Bur2 and the Ctk complex in yeast: the split personality of mammalian P-TEFb. Cell Cycle. 2006;5(10):1066–1068.
- Yorimitsu T, Zaman S, Broach JR, et al. Protein kinase A and Sch9 cooperatively regulate induction of autophagy in Saccharomyces cerevisiae. Mol Biol Cell. 2007;18(10):4180–4189.
- Kamada Y, Funakoshi T, Shintani T, et al. Tor-mediated induction of autophagy via an Apg1 protein kinase complex. J Cell Biol. 2000;150(6):1507–1513.
- Tardiff DF, Abruzzi KC, Rosbash M. Protein characterization of Saccharomyces cerevisiae RNA polymerase II after in vivo cross-linking. Proc Natl Acad Sci U S A. 2007;104(50):19948–19953.
- Scheidegger A, Nechaev S. RNA polymerase II pausing as a context-dependent reader of the genome. Biochem Cell Biol. 2016;94(1):82–92.
- Hu G, McQuiston T, Bernard A, et al. The role of transcriptional ‘futile cycles’ in autophagy and microbial pathogenesis. Microb Cell. 2015;2(8):302–304.
- Gatica D, Hu G, Liu X, et al. The Pat1-Lsm complex stabilizes ATG mRNA during nitrogen starvation-induced autophagy. Mol Cell. 2019;73(2):314–324 e4.
- Longtine MS, McKenzie A, Demarini DJ, et al. Additional modules for versatile and economical PCR-based gene deletion and modification in Saccharomyces cerevisiae. Yeast. 1998;14(10):953–961.
- Gueldener U, Heinisch J, Koehler GJ, et al. A second set of loxP marker cassettes for Cre-mediated multiple gene knockouts in budding yeast. Nucleic Acids Res. 2002;30(6):e23.
- Klionsky DJ, Cueva R, Yaver DS. Aminopeptidase I of Saccharomyces cerevisiae is localized to the vacuole independent of the secretory pathway. J Cell Biol. 1992;119(2):287–299.
- Abeliovich H, Zhang C, Dunn WA, et al. Chemical genetic analysis of Apg1 reveals a non-kinase role in the induction of autophagy. Mol Biol Cell. 2003;14(2):477–490.
- Huang WP, Scott SV, Kim J, et al. The itinerary of a vesicle component, Aut7p/Cvt5p, terminates in the yeast vacuole via the autophagy/Cvt pathways. J Biol Chem. 2000;275(8):5845–5851.
- Geng J, Nair U, Yasumura-Yorimitsu K, et al. Post-Golgi Sec proteins are required for autophagy in Saccharomyces cerevisiae. Mol Biol Cell. 2010;21(13):2257–2269.
- Aparicio O, Geisberg JV, Sekinger E, et al. Chromatin immunoprecipitation for determining the association of proteins with specific genomic sequences in vivo. Curr Protoc Mol Biol. 2005; Chapter 21:Unit 21 3.