
ABSTRACT
N
6-methyladenosine (m6A), the most abundant internal modification on mRNAs in eukaryotes, play roles in adipogenesis. However, the underlying mechanism remains largely unclear. Here, we show that m6A plays a critical role in regulating macroautophagy/autophagy and adipogenesis through targeting Atg5 and Atg7. Mechanistically, knockdown of FTO, a well-known m6A demethylase, decreased the expression of ATG5 and ATG7, leading to attenuation of autophagosome formation, thereby inhibiting autophagy and adipogenesis. We proved that FTO directly targeted Atg5 and Atg7 transcripts and mediated their expression in an m6A-dependent manner. Further study identified that Atg5 and Atg7 were the targets of YTHDF2 (YTH N6-methyladenosine RNA binding protein 2). Upon FTO silencing, Atg5 and Atg7 transcripts with higher m6A levels were captured by YTHDF2, which resulted in mRNA degradation and reduction of protein expression, thus alleviating autophagy and adipogenesis. Furthermore, we generated an adipose-selective fto knockout mouse and find that FTO deficiency decreased white fat mass and impairs ATG5- and ATG7-dependent autophagy in vivo. Together, these findings unveil the functional importance of the m6A methylation machinery in autophagy and adipogenesis regulation, which expands our understanding of such interplay that is essential for development of therapeutic strategies in the prevention and treatment of obesity.
Abbreviations
3-MA: 3-methyladenine; ACTB: actin, beta; ATG: autophagy-related; Baf A1: bafilomycin A1; CEBPA: CCAAT/enhancer binding protein (C/EBP), alpha; CEBPB: CCAAT/enhancer binding protein (C/EBP), beta; FABP4: fatty acid binding protein 4, adipocyte; FTO: fat mass and obesity associated; HFD: high-fat diet; LC-MS/MS: liquid chromatography-tandem mass spectrometry; MAP1LC3B/LC3: microtubule-associated protein 1 light chain 3 beta; m6A: N6-methyladenosine; MEFs: mouse embryo fibroblasts; MeRIP-qPCR: methylated RNA immunoprecipitation-qPCR; PPARG: peroxisome proliferator activated receptor gamma; RIP: RNA-immunoprecipitation; SAT: subcutaneous adipose tissue; siRNA: small interfering RNA; SQSTM1/p62: sequestosome 1; TEM: transmission electron microscopy; ULK1: unc-51 like kinase 1; VAT: visceral adipose tissue; WAT: white adipose tissue; YTHDF: YTH N6-methyladenosine RNA binding protein
Introduction
Obesity and the associated cancer burden has been rapidly prevailed over the past several decades worldwide [Citation1]. In 2016, almost 40% adults and 18% children (ages 5–19 years) of the world were obese [Citation2]. In 2015, approximately 4 million deaths were attributable to obesity [Citation3]. Obesity is defined as abnormal or excessive accumulation of adipose tissue, which is caused by an increase in adipocyte volume (hypertrophy) and number (hyperplasia). Therefore, improving our understanding of the molecular mechanism of adipogenesis is of major health and scientific significance.
To date, researchers have suggested that many different events regulate adipocyte differentiation including extracellular signals, transcriptional cascade and epigenomic modification [Citation4]. Macroautophagy (hereafter referred to as autophagy) has been reported to control adipose mass and adipogenesis [Citation5]. Autophagy is a fundamental cellular degradation pathway, which starts with the formation of double-membrane autophagosomes, and ultimately fuse with the lysosomal compartments to degrade cellular organelles and proteins [Citation6,Citation7]. In mice, adipose-specific deletion of Atg7 has a unique anti-obesity and insulin sensitization effect [Citation8]. In addition, a recent study shows that targeted deletion of Atg5 impairs adipogenesis [Citation9].
Notably, N6-methyladenosine (m6A), the most abundant modification on mRNAs in eukaryotes, is also reported to play roles in adipogenesis [Citation10–Citation13]. However, the underlying mechanism remains largely unclear. m6A is modulated by methyltransferase complex, demethylases and RNA-binding proteins [Citation14,Citation15], which influences all fundamental aspects of mRNA metabolism, including mRNA stability, translation, subcellular localization, and alternative splicing [Citation10,Citation16–Citation18]. FTO (fat mass and obesity associated) is the first identified RNA demethylase that catalyzes m6A demethylation in an Fe(II)- and α-ketoglutarate-dependent manner [Citation19]. A recent study reports that FTO upregulates the protein abundance of autophagy-related protein ULK1 (unc-51 like kinase 1) and autophagy in an m6A-dependent manner [Citation20]. Intriguingly, previous work shows that depletion of FTO in mouse embryonic fibroblasts (MEFs) decreases activation of the MTORC1 pathway and enhances autophagy [Citation21]. In contrast, another study reports that ectopic expression of FTO does not affect starvation-induced autophagy [Citation22]. Overall, the regulatory mechanism of m6A on autophagy needs to be further investigated. Since both of m6A and autophagy play critical roles in the regulation of adipogenesis, we hypothesize that m6A mRNA methylation might regulate adipogenesis via autophagy pathway.
To validate our hypothesis, two ideal cell model, mouse 3T3-L1 cell line and porcine primary preadipocytes, were used in this study. 3T3-L1 is a well-established preadipose cell line which has been the standard model system to identify regulators of adipogenesis and fat cell function [Citation23]. Porcine preadipocytes are an excellent model for studying of adipogenesis because of their high similarity to human cells [Citation24]. In our study, we demonstrated that FTO played a critical role in mouse 3T3-L1 and porcine primary preadipocytes autophagy and adipogenesis by fine-tuning the expression of ATG5 and ATG7, but not ULK1, in an m6A-dependent and YTHDF2-mediated manner. Furthermore, adipose-selective fto knockout reduced white fat mass and impairs ATG5- and ATG7-dependent autophagy in mice. Our study revealed that m6A modification plays a cell-specific role in autophagy regulation and provided a novel insight that m6A methylation regulates adipogenesis through modulation of autophagy.
Results
FTO promotes autophagy and further enhances adipogenesis
To explore the role of FTO in autophagy, we first conducted loss-of-function studies in 3T3-L1 cells with control or Fto small interfering RNA (siRNA). Efficient knockdown of FTO in cells was validated by western blot (). Protein levels of MAP1LC3B/LC3 (microtubule-associated protein 1 light chain 3 beta, an autophagy marker) and SQSTM1/p62 (a protein specifically degraded in lysosomes) were measured to determine the autophagy activation of cells. Silencing of FTO significantly decreased LC3-II:I ratio and increased SQSTM1 level, compared to control cells, indicating an absence of steady-state autophagosome formation (). On the contrary, overexpression of HA tagged FTO (HA-FTO) dramatically elevated LC3-II:I ratio and alleviated SQSTM1 expression (), suggesting a positive correlation between FTO and autophagy. In addition, immunofluorescence assays showed that a greater amount of LC3 puncta were formed upon HA-FTO overexpression (). We analyzed autophagosome formation during adipogenesis by transmission electron microscopy (TEM) and found that silencing of FTO decreased the number of autophagosomes, indicating alleviated activation of autophagy (). In contrast, overexpression of FTO increased the number of autophagosomes in cells (). To determine whether autophagy was affected by FTO overexpression, control and FTO-overexpressing cells were treated with or without alternative autophagy inhibitors. Indeed, 3-methyladenine (3-MA, a PI3K and PtdIns3K inhibitor) or bafilomycin A1 (Baf A1, a vacuolar-type H+-translocating ATPase inhibitor) treatment experiment further confirmed that FTO promoted the activation of autophagy (). Consistent with 3T3-L1 cells, knockdown or forced expression of FTO in porcine primary preadipocytes attenuates and enhances, respectively, the induction of autophagy (Figure S1A–E), suggesting a conserved role of FTO among mouse and porcine preadipocytes. These results demonstrate that FTO positively modulates autophagy activation in 3T3-L1 and porcine preadipocytes.
Figure 1. FTO promotes adipogenesis via facilitating autophagy in 3T3-L1 preadipocytes. (A) Western blotting analysis of FTO, LC3 and SQSTM1 in 3T3-L1 preadipocytes with or without FTO knockdown, control or overexpressing FTO. ACTB was used as loading control. (B) Immunofluorescence assays of LC3 and HA in control and FTO-overexpressing cells. Scale bar: 20 μm. (C) Statistical analysis of the number of LC3 puncta per cell. (D) TEM analysis of autophagosomes in control, Fto-depleted or FTO-overexpressing cells. Arrows indicate autophagosomes. Scale bar: 0.5 μm. (E) Quantification of autophagosomes in cells. (F) Western blotting analysis of LC3 in control and FTO-overexpressing cells treated with or without 10 mM 3-MA for 4 h. (G) Western blotting analysis of LC3 in control and FTO-overexpressing cells treated with or without 10 nM Baf A1 for 4 h. (H) Oil Red O staining of control and FTO-overexpressing cells induced to differentiate in the presence or absence of 5 mM 3-MA or 4 nM Baf A1 for 8 d. Scale bar: 100 μm. (I) Relative lipid accumulation was quantified with a microplate spectrophotometer at 500 nm. (J) Relative triglyceride accumulation was measured using a triglyceride assay kit. (K) Real-time quantitative PCR (qPCR) analysis of Pparg, Fabp4 and Cebpa expression in control and FTO-overexpressing cells induced to differentiate in the presence or absence of 5 mM 3-MA or 4 nM Baf A1 for 8 d. Actb was used as an internal control. (L) Western blotting analysis of PPARG, FABP4 and CEBPA expression in control and FTO-overexpressing cells induced to differentiate in the presence or absence of 5 mM 3-MA or 4 nM Baf A1 for 8 d. The data were presented as the mean ± SD of triplicate tests. ***P < 0.001 compared to control group.
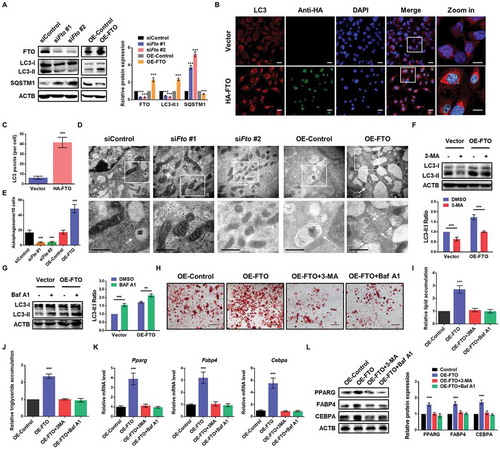
To investigate whether FTO affected adipogenesis through autophagy pathway, control and FTO-overexpressing 3T3-L1 and porcine preadipocytes were treated with or without autophagy inhibitors during adipogenesis. We observed that 3-MA and Baf A1 treatment could reverse the enhanced autophagy, adipogenesis and triglyceride accumulation of FTO-overexpressing cells ( and S1F–H). Consistent with the phenotype, the mRNA and protein levels of adipocyte marker genes, including Pparg (peroxisome proliferator activated receptor gamma), Fabp4 (fatty acid binding protein 4, adipocyte) and Cebpa (CCAAT/enhancer binding protein [C/EBP], alpha), were remarkably elevated in FTO-overexpressing cells, which could be downregulated to normal level by 3-MA or Baf A1 treatment (). Together, these results reveal that FTO enhances adipocyte differentiation via promoting autophagy.
Knockdown of FTO decreased the expression of ATG5 and ATG7, but not ULK1
To identify potential target genes of FTO in autophagy, we first employed qPCR analysis to compare the mRNA expression of autophagy-related genes following FTO knockdown. A recent study reports that loss of FTO positively regulates the expression of ULK1 in 293T cells [Citation20]. Interestingly, our results showed that the mRNA levels of Atg5 and Atg7 were significantly attenuated following FTO knockdown, while Ulk1 was unchanged (). Consistently, knockdown of FTO markedly downregulated protein levels of ATG5 and ATG7 (). In contrast, we found that ULK1 and other autophagy-related proteins, such as ATG12 and ATG16L1, were not significantly changed (). In porcine preadipocytes, we confirmed that silencing or overexpression of FTO decreased and increased, respectively, gene and protein expression of ATG5 and ATG7, but not ULK1 (Figure S2A–D). Moreover, we examined the expression profile of ATG5 and ATG7 during adipocyte differentiation and found that both of them were increased in the early stage and then decreased (), which was similar to the expression pattern of FTO [Citation13]. These data suggest that Atg5 and Atg7, rather than Ulk1, could be target genes of FTO in our system.
Figure 2. Loss of FTO attenuates the expression of ATG5 and ATG7, rather than ULK1. (A) qPCR analysis of expression levels of ATG (autophagy-related) proteins in control and FTO knockdown cells. Actb was used as an internal control. (B) Western blotting analysis of FTO, ATG5, ATG7, ULK1, ATG12 and ATG16L1 in control and FTO knockdown cells. ACTB was used as a loading control. (C) Western blotting analysis of ATG5 and ATG7 expression profiles during adipogenesis. (D) Western blotting analysis of ATG5, FTO and LC3 in control and ATG5 knockdown cells. (E) Western blotting analysis of ATG7, FTO and LC3 in control and ATG7 knockdown cells. (F) Oil Red O staining of control, FTO-depleted, ATG5-depleted and ATG7-depleted cells on day 6 of differentiation. Scale bar: 100 μm. (G) Relative lipid accumulation was quantified with a microplate spectrophotometer at 500 nm. (H) Relative triglyceride accumulation was measured using a triglyceride assay kit. (I) qPCR analysis of Pparg, Fabp4 and Cebpa expression in control, FTO-depleted, ATG5-depleted and ATG7-depleted cells on day 6 of differentiation. Actb was used as an internal control. (J) Western blotting analysis of PPARG, FABP4 and CEBPA expression in control, FTO-depleted, ATG5-depleted and ATG7-depleted cells on day 6 of differentiation. The data were presented as the mean ± SD of triplicate tests. *P < 0.05, **P < 0.01, ***P < 0.001 compared to control group.
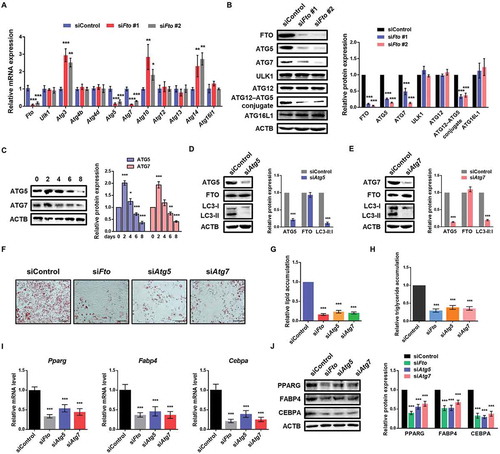
To test the effects of ATG5 and ATG7 on autophagy and adipogenesis, we treated 3T3-L1 preadipocytes with Atg5 and Atg7 siRNA, respectively, and confirmed the knockdown efficiency using western blot (). As expected, LC3 Ⅱ:Ⅰ radio was decreased upon ATG5 and ATG7 knockdown. The protein expression of FTO was unchanged (), consistent with the proposed upstream-downstream relationship between FTO and ATG5 and ATG7. Furthermore, we found that depletion of FTO, ATG5 and ATG7, respectively, both significantly inhibited adipogenesis and triglyceride accumulation compared to control cells (). Consistently, the expression levels of adipocyte marker genes were downregulated upon FTO, ATG5 or ATG7 knockdown (). These results demonstrate that ATG5 and ATG7 are functionally important for autophagy and adipogenesis of 3T3-L1 preadipocytes. We thus focused on these two FTO potential targets Atg5 and Atg7 for further studies.
FTO affects autophagy and adipogenesis through targeting ATG5 and ATG7
To confirm whether FTO influenced autophagy and adipogenesis by affecting the expression of ATG5 and ATG7, we first validated that overexpression of FTO substantially increased the mRNA levels of Atg5 and Atg7 (). Next, we performed rescue experiment and observed that silencing of ATG5 could reverse the upregulated LC3-II:I ratio in FTO-overexpressing 3T3-L1 cells (). Similar to ATG5, loss of ATG7 also recovered the augmented LC3-II:I ratio (), suggesting that FTO affects autophagy through regulating ATG5 and ATG7 expression.
Figure 3. FTO regulates autophagy and adipogenesis through targeting Atg5 and Atg7. (A) qPCR analysis of Atg5 and Atg7 expression in control and FTO-overexpressing cells. Actb was used as an internal control. (B) Western blotting analysis of FTO, ATG5 and LC3 in control and FTO-overexpressing cells transfected with or without Atg5 siRNA. ACTB was used as a loading control. (C) Western blotting analysis of FTO, ATG7 and LC3 in control and FTO-overexpressing cells transfected with or without Atg7 siRNA. (D) Western blotting analysis of ATG5, ATG7 and CEBPB in control and FTO-overexpressing cells transfected with or without Atg5 and Atg7 siRNA. (E) Oil Red O staining of control and FTO-overexpressing cells transfected with or without Atg5 and Atg7 siRNA on day 6 of differentiation. Scale bar: 100 μm. (F) Relative lipid accumulation was quantified with a microplate spectrophotometer at 500 nm. (G) Relative triglyceride accumulation was measured using a triglyceride assay kit. (H) qPCR analysis of Pparg, Fabp4 and Cebpa expression in control and FTO-overexpressing cells transfected with or without Atg5 and Atg7 siRNA on day 6 of differentiation. (I) Western blotting analysis of PPARG, FABP4 and CEBPA expression in control and FTO-overexpressing cells transfected with or without Atg5 and Atg7 siRNA on day 6 of differentiation. The data were presented as the mean ± SD of triplicate tests. ***P < 0.001 compared to control group.
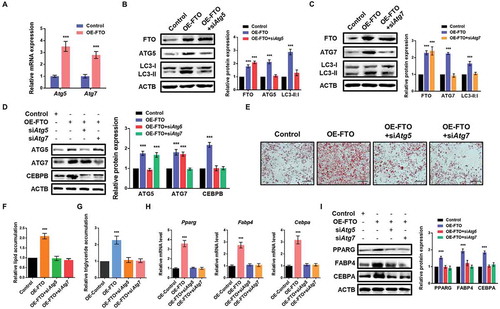
Previous works have reported that knockdown of ATG5 and ATG7 in preadipocytes inhibits autophagy and decreases the level of CEBPB (CCAAT/enhancer binding protein [C/EBP], beta) [Citation5] and impairs initiation of the adipogenic-differentiation program by inhibiting the expression of PPARG and CEBPA [Citation25,Citation26]. This raises the possibility that FTO regulates adipogenesis via Atg5 and Atg7-Cebpb signaling. As expected, we found that forced expression of FTO promoted CEBPB protein levels, whereas depletion of ATG5 and ATG7 reversed the expression of CEBPB (). In addition, knockdown of ATG5 and ATG7 restored adipogenesis and triglyceride accumulation of 3T3-L1 cells promoted by FTO overexpression (). Consistently, the enhanced mRNA and protein levels of Pparg, Fabp4 and Cebpa in FTO-overexpressing cells were also reversed (). Collectively, FTO promotes adipogenesis through mediating Atg5 and Atg7-Cebpb signaling axis.
FTO regulates ATG5 and ATG7 expression in an m6A-dependent manner
To further elucidate the underlying molecular mechanism of FTO in autophagy regulation, we constructed wild-type (FTO-WT) and catalytic mutant FTOR96Q (FTO-MUT) plasmid [Citation27], to determine whether the demethylase activity of FTO was required. The impact of ectopic expression of FTO-WT or FTO-MUT on cellular m6A level was confirmed by liquid chromatography-tandem mass spectrometry (LC-MS/MS) (). Ectopically expressed FTO-WT, but not FTO-MUT nor an empty vector, significantly increased the LC3-II:I radio in 3T3-L1 and porcine adipocytes ( and S3A), implying that FTO modulated autophagy in a demethylase activity-dependent manner. In consistent, cells expressing FTO-WT, rather than FTO-MUT, showed significantly augmented LC3 puncta in immunofluorescence assays (, , Fig. S3B and S3C). Moreover, compared with FTO-MUT or the empty vector, ectopic expression of FTO-WT elevated the number of autophagosomes (,S3D and S3E). These results demonstrate that the demethylation activity of FTO is required for autophagy in preadipocytes.
Figure 4. FTO regulates the expression of ATG5 and ATG7 in an m6A-dependent manner. (A) LC-MS/MS quantification of the m6A/A in mRNA of control, wild-type (WT)- and mutant (MUT)-FTO overexpressing cells. (B) Western blotting analysis of FTO and LC3 in control, WT- and MUT-FTO overexpressing cells. ACTB was used as a loading control. (C) Immunofluorescence assays of LC3 and HA in control, WT- and MUT-FTO overexpressing cells. Scale bar: 20 μm. (D) Statistical analysis of the number of LC3 puncta per cell. (E) TEM analysis of autophagosomes in control, WT- and MUT-FTO overexpressing cells. Arrows indicate autophagosomes. Scale bar: 0.5 μm. (F) Quantification of autophagosomes in cells. (G) Western blotting analysis of ATG5, ATG7 and ULK1 in control, WT- and MUT-FTO overexpressing cells. (H) qPCR analysis of Atg5 and Atg7 expression in control, WT- and MUT-FTO overexpressing cells. Actb was used as an internal control. (I) Integrative genomics viewer (IGV) plots of m6A peaks at Atg5 and Atg7 mRNAs. The y-axis shows sequence read number, blue boxes represent exons, and blue lines represent introns. (J) LC-MS/MS quantification of the m6A/A in mRNA of control and Fto-depleted cells. (K) Methylated RNA immunoprecipitation (MeRIP)-qPCR analysis of m6A levels of Atg5, Atg7 and Ulk1 mRNA in control and Fto-depleted cells. (L) RNA immunoprecipitation-qPCR (RIP-qPCR) analysis of the interaction of Atg5 and Atg7 with HA in cells overexpressing HA-tagged FTO. Enrichment of Atg5 and Atg7 with HA was measured by qPCR and normalized to input. (M) Left panel: Schematic diagram of dual-luciferase reporter constructs. Right panel: Relative luciferase activity of WT or MUT (A-to-T mutation) Atg5-3ʹUTR (or Atg7-3ʹUTR) luciferase reporter in control, WT- and MUT-FTO overexpressing cells. Firefly luciferase activity was measured and normalized to Renilla luciferase activity. (N) Oil Red O staining of control, WT- and MUT-FTO overexpressing cells on day 8 of differentiation. Scale bar: 100 μm. (O) Relative lipid accumulation was quantified with a microplate spectrophotometer at 500 nm. (P) Relative triglyceride accumulation was measured using a triglyceride assay kit. The data were presented as the mean ± SD of triplicate tests. **P < 0.01, ***P < 0.001 compared to control group.
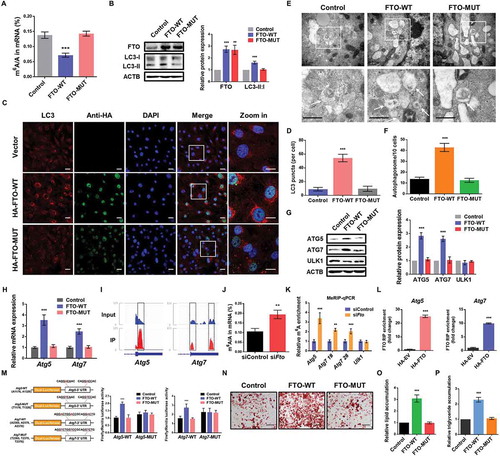
Next, we investigated whether FTO influenced the expression of ATG5 and ATG7 through RNA demethylation. Compared with FTO-MUT or the empty vector, ectopically expressed FTO-WT increased the protein and mRNA levels of ATG5 and ATG7, while the protein abundance of ULK1 was unchanged ( and Figure S3F). According to the published m6A-seq data of 3T3-L1 [Citation10], m6A modifications were found at 3ʹ UTR of Atg5 and Atg7 (). We found that knockdown of FTO increased global m6A level of 3T3-L1 and porcine preadipocytes by LC-MS/MS ( and Figure S3G). Furthermore, the gene-specific methylated RNA immunoprecipitation-qPCR (MeRIP-qPCR) assays demonstrated that FTO knockdown significantly increased the m6A levels on mRNA transcripts of Atg5 and Atg7, but not Ulk1 ( and S3H). We performed RNA immunoprecipitation followed by qPCR (RIP-qPCR) with gene-specific primers and observed that Atg5 and Atg7 interaction with HA-tagged FTO in 3T3-L1 and FLAG-tagged FTO in porcine preadipocytes, respectively, suggesting that Atg5 and Atg7 were direct target of FTO ( and S3I). More importantly, to assess whether m6A modifications on target mRNAs were necessary for FTO-mediated gene regulation, we performed dual-luciferase reporter and mutagenesis assays in 3T3-L1 cells. Forced expression of FTO-WT, but not FTO-MUT, substantially promoted luciferase activity of individual reporter constructs containing wild-type 3ʹUTR fragments of Atg5 and Atg7, relative to the control (). This increase was abrogated when the m6A sites were mutated (A was replaced with T) (), demonstrating that FTO regulates the expression of ATG5 and ATG7 through m6A-dependent mechanism. Additionally, Oil red O staining analysis showed that FTO-WT, but not FTO-MUT, promoted adipocyte differentiation and triglyceride accumulation (–P and S3J–L), validating that the demethylation activity of FTO was required for adipogenesis. Taken together, these results illustrate that FTO targets Atg5 and Atg7 transcripts and mediates their expression in an m6A-dependent manner, and further regulates autophagy and adipogenesis.
YTHDF2 mediates mrna stability and expression of ATG5 and ATG7, but not ULK1, through m6A-dependent mechanism
It has been shown that m6A methylation on mRNAs influences mRNA stability and translation [Citation16,Citation17,Citation28,Citation29], which is mediated by specific m6A binding proteins. YTHDF2 (YTH N6-methyladenosine RNA binding protein 2) is reported to selectively recognize and destabilize m6A-modified mRNA [Citation16], while YTHDF1 promotes translation of targeted mRNA [Citation17]. To further explain the negative correlation between m6A methylation and protein abundance of FTO-targeted genes, we first investigated whether the expression of ATG5 and ATG7 were affected by YTHDF2 or YTHDF1. Compared with control cells, overexpression of YTHDF2 markedly decreased ATG5 and ATG7 protein levels, whereas no significant change was observed for ULK1 and ATG12 ( and S4A). In contrast, forced expression of YTHDF1 didn’t affect ATG5 and ATG7 expression ( and S4A), implying that ATG5 and ATG7 are targets of YTHDF2. Indeed, using RIP-qPCR assay, we further confirmed that both Atg5 and Atg7 interact with FLAG-tagged YTHDF2 in 3T3-L1 and porcine preadipocytes ( and S4B).
Figure 5. FTO modulates ATG5 and ATG7 expression levels by YTHDF2-mediated mRNA decay. (A) Western blotting analysis of YTHDF2, ATG5, ATG7, ULK1 and ATG12 in control and YTHDF2-overexpressed cells. ACTB was used as a loading control. (B) Western blotting analysis of YTHDF1, ATG5 and ATG7 in control and YTHDF1-overexpressed cells. (C) RIP-qPCR analysis of the interaction of Atg5 and Atg7 with FLAG in cells overexpressing FLAG-YTHDF2. Enrichment of Atg5 and Atg7 with FLAG was measured by qPCR and normalized to input. (D) Relative luciferase activity of WT or MUT Atg5-3ʹUTR (or Atg7-3ʹUTR) luciferase reporter in cells transfected with control or YTHDF2 plasmid. Firefly luciferase activity was measured and normalized to Renilla luciferase activity. (E) qPCR analysis of Ythdf2, Atg5, Atg7 and Ulk1 in control and FTO knockdown cells. Actb was used as internal control. (F) Lifetime of Atg5 and Atg7 mRNA in control, FTO knockdown or YTHDF2 knockdown cells. Relative mRNA levels were quantified by qPCR. (G) Western blotting analysis of YTHDF2, ATG5, ATG7 and LC3 in control and FTO-overexpressing cells transfected with or without YTHDF2 plasmid. (H) Oil Red O staining of control and FTO-overexpressing cells transfected with or without YTHDF2 plasmid on day 8 of differentiation. Scale bar: 100 μm. (I) Relative lipid accumulation was quantified with a microplate spectrophotometer at 500 nm. (J) Relative triglyceride accumulation was measured using a triglyceride assay kit. The data were presented as the mean ± SD of triplicate tests. *P < 0.05, **P < 0.01, ***P < 0.001 compared to control group. ###P < 0.001 compared to OE-FTO group.
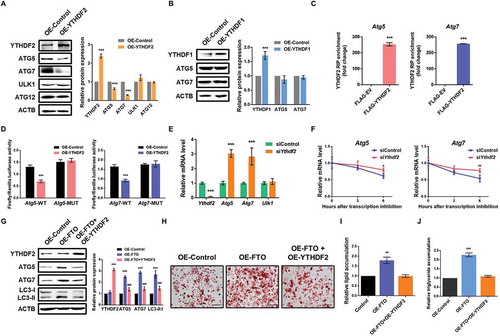
Next, we tested whether the m6A modifications on Atg5 and Atg7 mRNAs were essential for YTHDF2-mediated gene regulation. As expected, dual-luciferase assays revealed that ectopic YTHDF2 significantly downregulated luciferase activity in reporters carrying wild-type Atg5 and Atg7 fragment (). Such a decrease was completely abolished by mutations in the m6A consensuses sites (), suggesting an m6A-dependent regulation. To investigate whether YTHDF2 controlled the expression of Atg5 and Atg7 through mediating mRNA decay, we conducted loss-of-function studies in 3T3-L1 cells. Compared with control cells, knockdown of YTHDF2 elevated the mRNA levels of Atg5 and Atg7, but not Ulk1 (). Indeed, mRNA stability analysis showed that loss of YTHDF2 prolonged the half-life of Atg5 and Atg7 mRNA transcripts (). Consistently, overexpression of YTHDF2 decreased mRNA levels and mRNA stability of ATG5 and ATG7 in porcine preadipocytes (Figure S4C and D), suggesting that YTHDF2 regulates ATG5 and ATG7 expression via modulating their mRNA stability.
In addition, the increased protein levels of ATG5 and ATG7 in FTO-overexpressing 3T3-L1 could be partially reversed by forced expression of YTHDF2 (). YTHDF2 overexpression also partially reversed the increased LC3-II:I ratio in FTO-overexpressing cells. Furthermore, ectopically expressed YTHDF2 could reverse the facilitated adipogenesis and triglyceride accumulation caused by FTO overexpression (-J). These data together indicate that FTO regulates ATG5 and ATG7 expression in an m6A-dependent and YTHDF2-mediated manner.
Adipose-selective deletion of FTO reduces white fat mass and inhibits ATG5 and ATG7-dependent autophagy in mice
To study the in vivo role of FTO in adipose tissue, we generated an adipose-selective fto knockout mouse (fto-AKO) model by crossing Ftoflox/flox mice with the Fabp4 (fatty acid binding protein 4)-Cre mice, in which Cre expression is under the control of an adipose tissue-selective Fabp4 promoter (Figure S5A). As expected, FTO expression was efficiently deleted in white adipose tissue (WAT) from fto-AKO mice (), but not other tissues including muscle, liver, brain, macrophages or vascular endothelial cells (Figure S5B). Compared to littermate control (Ftoflox/flox) mice, fto-AKO mice were protected against chow diet or high-fat diet (HFD)-induced body weight gain (Figure S5C and ), whereas the food intake did not differ significantly between the two groups (Figure S5D and ). Compared to the control mice, fto-AKO mice appeared substantially thinner on both chow diet and HFD (Figure S5E and ), largely due to the striking reduction of fat mass. Indeed, the mass of inguinal fat (subcutaneous adipose tissue, SAT) and gonadal fat pads (visceral adipose tissue, VAT) from fto-AKO mice were significantly less than the mass of those in control littermates, respectively (, , S5F and S5G). Hematoxylin and eosin staining of SAT and VAT showed that adipocytes of control mice on HFD exhibited a typical structure in which almost the whole cell was occupied by one large lipid droplet ( and ). In contrast, FTO deficiency led to multilocular (containing multiple lipid droplets) and smaller adipocytes ( and ). Furthermore, blood glucose levels and serum triglyceride levels in fto-AKO mice fed HFD were significantly lower in comparison with control mice ( and ). These results reveal that adipose-selective deletion of Fto in mice could have a profound impact on adipose tissue development, glucose and lipid metabolism.
Figure 6. Adipose-specific fto knockout mice exhibit deceased fat mass and inactivated ATG5 and ATG7-dependent autophagy during high-fat diet feeding. (A) Western blotting analysis of FTO in white adipose tissue (WAT) from control (Ftoflox/flox) and adipose-specific fto knockout (Fabp4-Cre Ftoflox/flox, fto-AKO) mice. ACTB was used as a loading control. (B) Body weights of control (female, n = 10) and fto-AKO (female, n = 8) mice on high-fat diet (HFD). (C) Food intake of control and fto-AKO mice during HFD feeding. (D) Representative pictures of control and fto-AKO mice. (E) Representative pictures of subcutaneous adipose tissue (SAT) and visceral adipose tissue (VAT) from control and fto-AKO mice. (F) Weights of SAT and VAT from control and fto-AKO mice. (G) Representative hematoxylin and eosin–stained sections of SAT and VAT isolated from control and fto-AKO mice. Scale bars: 100 μm. (H) Adipocyte area size quantification for SAT and VAT isolated from control and fto-AKO mice. (I) Blood glucose levels of control and fto-AKO mice. (J) Serum triglyceride levels of control and fto-AKO mice. (K) Western blotting analysis of LC3, SQSTM1, ATG5 and ATG7 in WAT isolated from control and fto-AKO mice. (L) qPCR analysis of Atg5, Atg7 and Cebpb in WAT isolated from control and fto-AKO mice. Actb was used as an internal control. The data were presented as the mean ± SD of triplicate tests. **P < 0.01, ***P < 0.001 compared to control group.
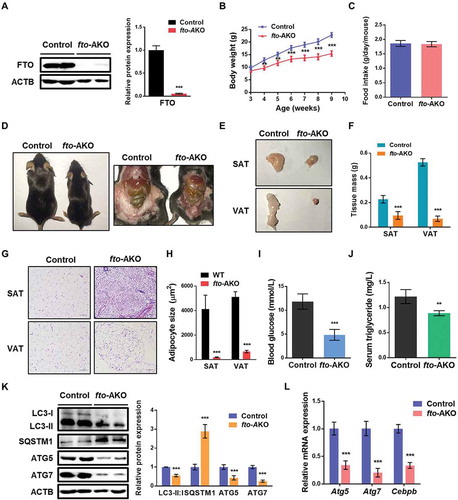
To investigated whether FTO influenced autophagy in vivo, we first detected the LC3-II:I radio and SQSTM1 expression levels in WAT from control and fto-AKO mice. Intriguingly, adipose-selective deletion of Fto markedly attenuated LC3-II:I ratio and elevated SQSTM1 protein abundance ( and S5H), suggesting the inhibited autophagy in WAT. Consistent with in vitro study, FTO deficiency alleviated protein and gene expression of ATG5 and ATG7 ( and , Figure S5H and 5I). Moreover, the mRNA level of Cebpb in WAT from fto-AKO mice was also downregulated (), implying that fto knockout could impair adipose tissue development via inhibiting ATG5 and ATG7-CEBPB signaling as shown in cell study. Taken together, these results suggest that adipocyte-selective fto knockout could decrease WAT mass and impair ATG5- and ATG7-dependent autophagy in mice.
Discussion
Several studies have investigated the relationship between FTO and autophagy. Whether and how FTO influences autophagy, however, remains controversial. FTO has been proposed as an amino acid sensor which can enhance MTORC1 activity [Citation30]. Previous work has found that loss of FTO inhibits MTORC1 signaling and then activates autophagy in MEFs [Citation21]. Subsequently, a study demonstrates that ectopic expression of FTO does not affect starvation-induced autophagy in U2OS cells [Citation22]. In contrast, we found that forced expression or knockdown of FTO augments and attenuates, respectively, the activation of autophagy in 3T3-L1 and porcine primary preadipocytes. Consistent with our finding, a recent study shows that meclofenamic acid (MA2), a highly selective inhibitor of FTO, inhibits cisplatin-induced activation of excessive autophagy in the HEI-OC1 cell line [Citation31]. Since autophagy plays diverse roles in various tissues or cells, the differences in FTO-mediated autophagy could potentially be explained by distinct type or status of cells used in these studies.
Autophagy has been known to regulate adipose mass and adipogenesis [Citation5]. Previous study of 3T3-L1 cells reports a negative correlation between autophagy and adipogenesis. They find that treatment with the MTOR inhibitor rapamycin blocks adipogenic differentiation [Citation32]. Recent study shows that FTO positively regulates the proliferation and differentiation of 3T3-L1 cells via enhancing PI3K-AKT signaling (negatively regulates autophagy), mitochondrial membrane potential and ATP generation [Citation33], indicating that FTO might inhibit autophagy and promote mitochondrial uncoupling during adipogenesis. However, we showed that FTO promoted autophagy and facilitated adipogenesis through mediating CEBPB expression. Adipocyte-selective fto knockout inhibited ATG5 and ATG7-dependent autophagy and Cebpb expression in mice. FTO-dependent regulation of ATG5 and ATG7-CEBPB signaling could be an endogenous mechanism that modulates adipose tissue expansion. Consistent with our results, without autophagic function, white adipocyte differentiation is blocked in vitro and WAT mass is markedly decreased in vivo [Citation5]. Moreover, previous study shows that adipocyte-specific knockout of the MTOR component RPTOR/raptor in mice display smaller adipose tissue and increased metabolic activity compared to control littermates [Citation34], which is similar to the phenotype in adipocyte-specific atg5 and atg7 knockout mice [Citation5,Citation8,Citation9]. Therefore, the anti-adipogenic effects of blocking MTOR in adipocytes could possibly result from one of the many MTOR-dependent pathways other than autophagy.
We knocked out Fto selectively in adipocytes using Fto conditional knockout and Fabp4-Cre mice. Since Fabp4 is also reported to be expressed in macrophages and vascular endothelial cells, we determined whether Fabp4 Cre-mediated deletion of Fto could be detected in these cell types. There was no decrease in FTO expression in macrophages or vascular endothelial cells from the fto-AKO mice (Figure S5B), consistent with published studies using Fabp4-Cre mice [Citation35–Citation39]. Compared with control mice, fto-AKO mice showed attenuated HFD-induced weight gain and fat accumulation, while the morphology and mass of muscle, liver, heart and other tissues showed no significant difference. Therefore, the weight loss of could be largely due to the striking reduction of fat mass. It is well documented that severe fat loss can lead to lipodystrophy with INS (insulin) resistance [Citation37]. However, the fat mass of HFD-fed fto-AKO mice was still higher than that of chow diet-fed control mice at the same age (data not shown). Also, the leaner fto-AKO mice fed with HFD exhibited decreased blood glucose levels and serum triglyceride levels compared with control mice, while the food intake showed no significant difference between two groups. All these data indicated that the decrease of the fat mass in fto-AKO mice didn’t cause lipodystrophy. Previous studies reports that FTO could play a role in regulation of energy metabolism [Citation40–Citation42]. FTO deficiency induces UCP1 expression and browning of WAT in mice under normal and obesogenic conditions, enhanced mitochondrial uncoupling and energy expenditure in adipocyte [Citation43,Citation44]. Thus, the lower levels of blood glucose and serum triglyceride in fto-AKO mice could partially be due to the enhanced energy expenditure in WAT, which needs further investigation.
In this study, we identified ATG5 and ATG7 as key regulators in FTO-dependent autophagy in 3T3-L1 and porcine preadipocytes. ATG7 facilitates the covalent attachment of the protein ATG12 to ATG5 through a ubiquitin-like conjugation system. The ATG12–ATG5 then forms a homo-oligomeric complex with ATG16L [Citation45], which is required for elongation of the phagophore during the formation of autophagosome [Citation46]. Our results suggested that loss of FTO inhibited covalent attachment of ATG12–ATG5, further impaired ternary complex formation and autophagy activation. In addition, the mRNA levels of Atg3, Atg10, and Atg14 were increased upon FTO knockdown. We found that FTO influenced autophagy and ATG5 and ATG7 expression in m6A-dependent manner. However, knockdown of FTO in 3T3-L1 didn’t increase m6A levels of Atg3 and Atg14 mRNAs [Citation10], while Atg10 mRNA didn’t have m6A modification, indicating that they were not direct targets of FTO. Thus, the increased expression of Atg3, Atg10, and Atg14 could not be directly mediated by FTO, which needs to be further investigated. Recently, one study reports that FTO specifically upregulates the ULK1 protein abundance via m6A-demethylation and promotes the initiation of autophagy in 293T cells [Citation20]. But in contrast, we found that FTO deficiency did not influence the expression levels of Ulk1 in preadipocytes or WAT. Moreover, the protein abundance of ULK1 was unchanged following ectopic expression of FTO-WT or FTO-MUT. Furthermore, using MeRIP-qPCR analysis, we found that depletion of FTO did not affect m6A levels of Ulk1 mRNA, suggesting that Ulk1 was not a target of FTO in this system. Thus, the discrepancy could potentially be explained by the cell-specific role of m6A methylation in autophagy. m6A methylome analysis of different cell types with FTO inactivation may shed light on these differences in the future. For the first time, our work reveals the network that FTO promotes adipogenesis through activating autophagy, which could be highly conserved across species.
It has been shown that m6A-marked mRNA transcripts tend to be less stable, largely due to the YTHDF2-mediated mRNA decay [Citation16]. The negative correlation between m6A methylation and protein expression of ATG5 and ATG7 indicates that YTHDF2 may play a role in regulating ATG5 and ATG7. In our study, forced expression of YTHDF2, rather than YTHDF1, decreased the expression of ATG5 and ATG7, suggesting that Atg5 and Atg7 were target genes of YTHDF2, but not YTHDF1. Using YTHDF2-RIP-qPCR analysis, we confirmed that both Atg5 and Atg7 interact with YTHDF2. Indeed, we further validated that YTHDF2 decreased protein expression of ATG5 and ATG7 by shortening the lifespan of their m6A-modified mRNAs, which was consistent with published data [Citation16]. The recent study showed that YTHDF2 controlled mRNA stability of ULK1 in an m6A-dependent way. In contrast, we found that ectopically expression of YTHDF2 did not affect Ulk1 expression at the RNA and protein level. This could be explained by that ULK1 is not a specific target of YTHDF2 in 3T3-L1 and porcine preadipocytes. Thus, our work demonstrates that m6A modification and YTHDF2 play cell type-specific roles in autophagy and gene expression.
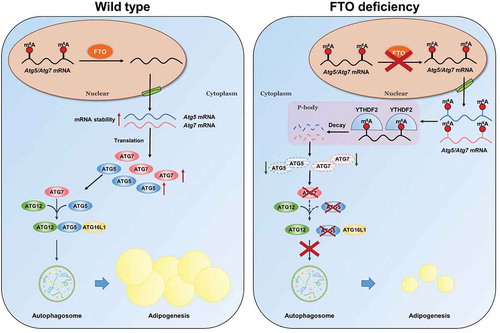
In summary, we show that FTO plays a conserved and fundamental role in promoting autophagy and adipogenesis in m6A-YTHDF2 dependent mechanism (). Our study highlights the functional importance of the m6A methylation machinery in autophagy. These findings provide insights into the underlying molecular mechanisms of FTO and m6A modification in regulating autophagy and adipogenesis, and development of therapeutic strategies in the prevention and treatment of obesity.
Figure 7. Working model of the mechanism of FTO regulates autophagy and adipogenesis in an m6A-dependent manner. In this model, FTO demethylases the m6A modification of Atg5 and Atg7 mRNAs, which in turn prevents YTHDF2-mediated mRNA decay, thereby increasing their mRNA stability and protein expression, leading to promoting autophagy and adipogenesis. Loss of FTO increases the m6A levels of Atg5 and Atg7 mRNAs, which are specifically recognized and destabilized by YTHDF2, resulting in the decreased protein expression, thereby inhibiting autophagy and adipogenesis.
Materials and methods
Cell culture and adipocyte differentiatio
The 3T3-L1 preadipocytes used in this study were purchased from Zenbio Inc. (Zenbio, SP-L1-F). The pig primary preadipocytes were isolated from cervical subcutaneous adipose tissue of 5-d-old Duroc-Landrace-Yorkshire piglets under sterile conditions [Citation47]. Cells were cultured in high-glucose Dulbecco’s Modified Eagle Medium (DMEM; Gibco, 11,995,065) containing 10% fetal bovine serum (Gibco, 10,091,148) and 1% penicillin-streptomycin. After 2 d post-confluence of cells, adipocyte differentiation was induced by adipogenic differentiation medium containing 0.5 mM IBMX (Sigma-Aldrich, I7018), 1 µM dexamethasone (Sigma-Aldrich, D1756) and 1 µg/mL INS/insulin (Sigma-Aldrich, I0516) and the time was recorded as day 0 of differentiation. After 2 d (or on day 2 of differentiation), medium was replaced with a maintenance medium (DMEM containing 10% fetal bovine serum and 1 µg/mL INS). Fresh maintenance medium was replaced every 2 d thereafter. Generally, 2 d adipogenic-induced cells were washed twice with phosphate-buffered saline (PBS; Sigma-Aldrich, P4417) and used for autophagy-related measurements. All cells were maintained at 37°C in a humidified 5% CO2 incubator. Cells were tested negative for mycoplasma contamination before use.
Cell transfection, plasmids and RNA knockdown
The siRNA and plasmid transfections were performed using Lipofectamine RNAiMAX (Invitrogen, 13,778,150) and Lipofectamine 2000 (Invitrogen, 11,668,019), respectively, according to the manufacturers’ instructions.
The HA-tagged wild type FTO-CDS expression plasmid was generated by cloning the full-length ORF of mouse Fto gene (NM_011936.2) into a pPB expression vector (Addgene, 48,753). The mutant FTO R96Q-CDS was amplified by PCR and cloned into pPB vector. The Flag-tagged wild type FTO-CDS expression plasmid was generated by cloning the full-length ORF of porcine FTO gene (NM_001112692.1) into a pcDNA3.1 vector (Invitrogen, V79020). The mutant FTOR96Q -CDS was amplified by PCR and cloned into pcDNA3.1 vector. The FLAG-tagged mouse and porcine YTHDF2 expression plasmids were cloned into a pPB vector, respectively. The mouse and porcine YTHDF1 were also cloned into a pPB vector, respectively.
The sequence for negative control siRNA is as follows (5ʹ to 3ʹ): 5ʹ-UUCUCCGAACGUGUCACGUTT-3ʹ. Mouse Fto siRNA #1 and #2 were ordered from Qiagen as custom synthesis which targets 5ʹ-TTAAGGTCCACTTCATCATCGCAGG-3ʹ and 5ʹ-GCAGCUGAAAUACCCUAAATT-3ʹ, respectively. Mouse Ythdf2 siRNA was ordered from Qiagen: 5ʹ-AAGGACGTTCCCAATAGCCAA-3ʹ. Mouse Atg5 siRNA was ordered from Genepharma: 5ʹ-GCUUCGAGAUGUGUGGUUUTT-3ʹ. Mouse Atg7 siRNA was ordered from Genepharma: 5ʹ-GCUAGAGACGUGACACAUATT −3ʹ. Porcine Fto siRNA were ordered from Ribobio (Fto siRNA #1 with the target sequence 5ʹ-CAAGGAGACTGCTACTTTA-3ʹ; Fto siRNA #2 with the target sequence 5ʹ-AGAGGAAAGCGAGGATGAT-3ʹ).
Animals
Fto conditional knockout mice with two loxP sites flanking exon 3 were generated as described previously [Citation48]. Ftoflox/flox mice and Fabp4-Cre transgenic mice (obtained from The Jackson Laboratory, 005069) were crossed to produce the adipose-selective fto knockout mice. The genotypes of the mice were determined and deletion of Fto in adipose tissue were confirmed with PCR and western blotting. Mice were maintained at 22 ± 2 °C with a humidity of 35 ± 5% under a 12 h light and 12 h dark cycle, with free access to water and food. For the HFD experiment, female control (Ftoflox/flox) and adipose-selective fto knockout (Fabp4-Cre Ftoflox/flox, fto-AKO) mice were fed with high-fat diet (60% fat in calories; Research Diets, D12492) for the desired periods of time, and food intake and body weight were measured every week after weaning (at 3 weeks of age). After the mice were sacrificed, their tissues were collected, weighed and immediately snap-frozen in liquid nitrogen. All animal experiments were approved by the Committee on Animal Care and Use and Committee on the Ethics of Animal Experiments of Zhejiang University (Hangzhou, China).
Histology and blood biochemical analysis
Inguinal and gonadal WAT, representing subcutaneous adipose tissue (SAT) and visceral adipose tissue (VAT) respectively, from control and Fto-AKO mice were collected and fixed in 4% paraformaldehyde for hematoxylin and eosin staining. The sections were observed under light microscopy. Blood glucose levels were measured using an ACCU-CHEK Aviva kit (Roche). Serum triglyceride levels were determined using a triglyceride assay kit (Applygen Technologies Inc, E1003).
Western blot analysis
Cells (washed twice with PBS) and tissues were lysed on ice in RIPA buffer (Beyotime Biotechnology, P0013B) with protease and phosphatase inhibitor cocktail (Beyotime Biotechnology, P1045) for 30 min. The protein concentration was determined using the BCA protein assay kit (Beyotime Biotechnology, P0012). Thirty µg total protein for each sample was separated by SDS-PAGE and then transferred to polyvinylidene difluoride (Millipore, IPVH00010) membranes. The membranes were blocked with 5% non-fat milk at room temperature for 1 h and then incubated with a 1:1,000-dilution of corresponding primary antibodies overnight at 4°C. After 3 washes, the membranes were incubated with a 1:3,000-dilution of goat anti-mouse or anti-rabbit HRP-conjugated secondary antibodies (Biosharp, BL001A or BL003A) at room temperature for 1 h. Protein bands were visualized using BeyoECL Star (Beyotime Biotechnology, P0018AS). Primary antibodies used in the experiment was listed in .
Table 1. The information of antibodies used in this study.
Quantitative real-time PCR (qPCR) analysis
For RNA isolation, cells were first washed with PBS twice. Total RNA from cells and adipose tissue were extracted using TRIzol reagent (Invitrogen, 15,596,018) and reverse transcribed into cDNA using M-MLV reverse transcriptase (Invitrogen, K1691). qPCR analysis was performed using the SYBR Green PCR Master Mix (Roche, 4,913,949,001) with the ABI Step-One PlusTM Real-Time PCR System (Applied Biosystems). The data were analyzed following the 2-ΔΔCt method and calculated using Actb as the normalization control. The sequences of primers used are presented in Table S1.
Transmission electron microscopy (TEM)
The cells were washed with PBS and fixed in 2.5% glutaraldehyde in phosphate buffer (0.1 M, pH 7.0) for 4 h and post-fixed with 1% OsO4 in phosphate buffer (0.1 M, pH 7.0) for 2 h. The samples were dehydrated with increasing concentrations of ethanol (30, 50, 70, 80, 90, 95 and 100) and transferred to absolute acetone for 20 min. After placing in 1:1 mixture of absolute acetone and the final Spurr resin (SPI-CHEM, 02690-AB) mixture for 1 h at room temperature, the samples were transferred to 1:3 mixture of absolute acetone and the final resin mixture for 3 h and to final Spurr resin mixture for overnight. Electron photomicrographs were taken from ultrastructures of cells under a transmission electron microscopy (Hitachi, H-7650).
Oil red O staining
Cells were washed and fixed in 10% formalin at room temperature for 1 h. After washed with 60% isopropanol, the cells were stained with a filtered Oil Red O (Sigma-Aldrich, O0625) working solution (six parts 0.35% Oil Red O dye in isopropanol and four parts dH2O) for 10 min, then rinsed three times with distilled water and observed under a microscope. To quantify triglyceride accumulation, Oil Red O-stained lipids were eluted in 100% isopropanol, and the optical density (OD) was measured at 500 nm.
Measurement of triglyceride levels in cells
For triglyceride measurement, differentiated cells were washed twice with PBS and lysed by lysis buffer (Applygen Technologies, E1013). The triglyceride levels of the cells were measured using the triglyceride assay kit (Applygen Technologies, E1013) according to the manufacturers’ protocol.
Immunofluorescence analysis
Cells were washed with PBS and fixed with 4% paraformaldehyde for 10 min at room temperature, permeabilized with Triton X-100 (Beyotime Biotechnology, P0096) for 10 min. After blocking with the immunostaining blocking buffer (Beyotime Biotechnology, P0252) for 1 h, cells were then incubated with Anti-LC3 (Abcam, ab192890,1:500) primary antibodies at 4°C overnight. The goat anti-rabbit Alexa Fluor 594 (Invitrogen, A11037; 1:500) secondary antibodies were incubated at room temperature for 1 h. Nuclei were stained with DAPI (Beyotime Biotechnology, C1006) for 5 min at room temperature. Pictures were taken by a confocal laser microscope (Carl Zeiss Ltd). To quantify the number of LC3 puncta, a total of 30 cells were recorded and analyzed using the Axiovision Automatic Measurement Program on the Zeiss LSM800. LC3 puncta with diameters between 0.3 μm and 1 μm were scored as positive.
Quantification of mRNA m6A
Total RNA was isolated from control and FTO knockdown cells using TRIzol reagent (Invitrogen, 15,596,018). mRNA was then purified using a Dynabeads mRNA DIRECT kit (Invitrogen, 61,012) following the manufacturer’s protocols. For m6A quantification, 100–200 ng of mRNA was digested by nuclease P1 (2 U) in 25 μl of buffer containing 10 mM of NH4OAc (pH = 5.3) at 42°C for 2 h, followed by the addition of 3 μl 1 M NH4HCO3 and alkaline phosphatase (0.5 U) with incubation at 37°C for 2 h. The sample was then diluted to a total volume of 100 µl and filtered (0.22-μm pore size, 4-mm diameter, Millipore, SLGVR04NK). The total amount of m6A in RNA was measured using LC-MS/MS as previously reported [Citation19,Citation49]. The ratio of m6A to A was calculated based on the determined concentrations.
Methylated RNA immunoprecipitation-pcr (merip-qpcr) analysis
MeRIP-qPCR analysis was used according to a reported method [Citation50]. Briefly, mRNA was fragmented using RNA Fragmentation reagent (Invitrogen, AM8740) at 70°C for 15 min. A small amount of the fragmented RNA was left aside to be used as input RNA. Fragmented RNA was immunoprecipitated with anti-m6A antibody coupled to Dynabeads (Invitrogen, 10002D) in immunoprecipitation buffer (10 mM Tris-HCl, 150 mM NaCl, 0.1% Igepal CA-630 [Sigma-Aldrich, I8896] and 400 U RNasin Plus RNase inhibitor [Promega, N2611]) at 4°C for 2 h. m6A containing mRNAs were eluted twice with 6.7 mM N6-methyladenosine 5ʹ-monophosphate sodium salt (Sigma-Aldrich, M2780) at 4°C for 1 h and precipitated with 5 mg glycogen (Life Technologies, AM9510), one-tenth volumes of 3 M sodium acetate (Sigma-Aldrich, S7899) in 2.5 volumes of 100% ethanol at −80°C overnight. m6A enrichment was determined by qPCR analysis. The sequences of primers used are presented in Table S2.
RNA immunoprecipitation-qPCR (RIP-qPCR) analysis
This procedure was used according to a previous published report [Citation51]. HA-FTO, FLAG-FTO or FLAG-YTHDF2 overexpressed cells pellets were washed twice by PBS and lysed in lysis buffer of 150 mM KCl, 10 mM HEPES, 2 mM EDTA, 0.5% NP-40 (Beyotime Biotechnology, ST366), 0.5 mM dithothreitol (DTT), 1x Protease Inhibitor Cocktail and RNasin Plus RNase inhibitor (Promega, N2611) for 30 min at 4°C. The lysates were centrifuged, and the supernatant was transferred to pass through a 0.45-μm membrane syringe filter. A 50 μl aliquot of cell lysate was saved as input, and the remaining sample was incubated with HA antibody-conjugated magnetic beads or anti-FLAG M2 magnetic beads (Sigma-Aldrich, M8823) for 4 h at 4°C and six times with wash buffer (50 mM Tris, 200 mM NaCl, 2 mM EDTA, 0.05% NP40, 0.5 mM DTT, RNase inhibitor). Then the beads were eluted in wash buffer containing 0.1% SDS and 10 mL proteinase K (Invitrogen,25,530,049), and incubated at 55°C for 30 min. The input and immunoprecipitated RNAs were isolated by TRIzol reagent and were reverse transcribed into cDNA using M-MLV reverse transcriptase. The fold enrichment was detected by qPCR.
Dual-luciferase reporter and mutagenesis assays
Atg5-3ʹUTR and Atg7-3ʹUTR with either wild-type or mutant (m6A was replaced by T) were inserted into downstream of pmirGLO Dual-Luciferase vector (Promega, E1330). For dual-luciferase reporter assay, cells seeded in 24-well plates were co-transfected with wild-type or mutant Atg5-3ʹUTR (or Atg7-3ʹUTR) and FTO-WT (or FTO-MUT, or YTHDF2, or empty vector). After 48 h post transfection, the activities of firefly luciferase and Renilla luciferase in each well were determined by a Dual-Luciferase Reporter Assay System (Promega, E1910) according to the manufacturer’s protocol.
Atg5-3ʹUTR with wild-type m6A sites:
GTCCTCCTCGCTAGATGGAACCACCTTGAGTCAGGACAACGAGGCGTGACACCCTTGCTTCAGTCAAGTTCAGTGGAGGCAACAGAAACCCGGGCTGCTGCAAGCCAAGGAGGAGAAGATTCCATGAGAGATAGGGCGCCCGGGCAGGGCTGAGTGTGCACCACTGCTTCGCTGAGACACACAGGACCACTGCAGCCTCCTCTTCTCGTGAAATGCAATGCAGCCGAAGCCTTTGCTCAATGAAAAAAAAAAAAATGGAAATGTGCCACAGTTTGTATTTCTGATTAACAAATAAGTGGG
Atg5-3ʹUTR with mutant m6A sites:
GTCCTCCTCGCTAGATGGAACCACCTTGAGTCAGGTCAACGAGGCGTGACACCCTTGCTTCAGTCAAGTTCAGTGGAGGCAACAGAAACCCGGGCTGCTGCAAGCCAAGGAGGAGAAGATTCCATGAGAGATAGGGCGCCCGGGCAGGGCTGAGTGTGCACCACTGCTTCGCTGAGACACACAGGTCCACTGCAGCCTCCTCTTCTCGTGAAATGCAATGCAGCCGAAGCCTTTGCTCAATGAAAAAAAAAAAAATGGAAATGTGCCACAGTTTGTATTTCTGATTAACAAATAAGTGGG
Atg7-3ʹUTR with wild-type m6A sites:
AGCAAGCAACCACAGCTCAGGAGTACCTGGCCCTCAGCGCAGGACTGGACCGCAGGACTGGTGATCTGGGCCCTGCCACCTCCCTGGTCCTGATCTCCACATCTCCAAGGACGAGGGTGTACCCTCTGCCACCCAGTTGCACCCTTTCCTGTGCCATCTCACCAGCTCTGAACTCAATAATAACCTTGGCATTGCCACT
Atg7-3ʹUTR with mutant m6A sites:
AGCAAGCAACCACAGCTCAGGAGTACCTGGCCCTCAGCGCAGGTCTGGTCCGCAGGTCTGGTGATCTGGGCCCTGCCACCTCCCTGGTCCTGATCTCCACATCTCCAAGGACGAGGGTGTACCCTCTGCCACCCAGTTGCACCCTTTCCTGTGCCATCTCACCAGCTCTGAACTCAATAATAACCTTGGCATTGCCACT
mRNA stability analysis
mRNA stability analysis was performed as described previously [Citation52]. Briefly, Cells were treated with 5 µg/ml actinomycin D (Sigma-Aldrich, A9415) to inhibit global mRNA transcription. After incubation for indicated time points, the cells were collected and RNA samples were extracted for reverse transcription. The mRNA transcript levels of interest were detected by qPCR.
Statistical analysis
Data are presented as the mean ± SD. Significance between groups was determined by using Student’s t-test using GraphPad Prism 6. Significance was established at P < 0.05.
Supplemental Material
Download Zip (1.9 MB)Acknowledgments
This work is supported by the National Natural Science Foundation of China (Grant No. 31572413), the National Key Research and Development Program (2018YFD0500405), the Natural Science Foundation of Zhejiang Province (No. LZ17C1700001) and the Special Fund for Cultivation and Breeding of New Transgenic Organism (No. 2014ZX0800949B).
Disclosure statement
No potential conflict of interest was reported by the authors.
Supplementary material
Supplemental data for this article can be accessed here.
Additional information
Funding
Related Research Data
References
- Sung H, Siegel RL, Torre LA, et al. Global patterns in excess body weight and the associated cancer burden. CA Cancer J Clin. 2018.
- Collaboration NCDRF. Worldwide trends in body-mass index, underweight, overweight, and obesity from 1975 to 2016: a pooled analysis of 2416 population-based measurement studies in 128.9 million children, adolescents, and adults. Lancet. 2017;390:2627–2642.
- Afshin A, Reitsma MB, Murray CJL. Health effects of overweight and obesity in 195 countries. N Engl J Med. 2017;377:1496–1497.
- Rosen ED, MacDougald OA. Adipocyte differentiation from the inside out. Nat Rev Mol Cell Biol. 2006;7:885–896.
- Singh R, Xiang Y, Wang Y, et al. Autophagy regulates adipose mass and differentiation in mice. J Clin Invest. 2009;119:3329–3339.
- Klionsky DJ. Autophagy: from phenomenology to molecular understanding in less than a decade. Nat Rev Mol Cell Biol. 2007;8:931–937.
- Levine B, Klionsky DJ. Development by self-digestion: molecular mechanisms and biological functions of autophagy. Dev Cell. 2004;6:463–477.
- Zhang Y, Goldman S, Baerga R, et al. Adipose-specific deletion of autophagy-related gene 7 (atg7) in mice reveals a role in adipogenesis. Proc Natl Acad Sci USA. 2009;106:19860–19865.
- Baerga R, Zhang Y, Chen PH, et al. Targeted deletion of autophogy-related 5 (atg5) impairs adipogenesis in a cellular model and in mice. Autophagy. 2009;5:1118–1130.
- Zhao X, Yang Y, Sun BF, et al. FTO-dependent demethylation of N6-methyladenosine regulates mRNA splicing and is required for adipogenesis. Cell Res. 2014;24:1403–1419.
- Wang X, Sun B, Jiang Q, et al. mRNA m6A plays opposite role in regulating UCP2 and PNPLA2 protein expression in adipocytes. Int J Obesity. 2018.
- Wang XX, Zhu LN, Chen JQ, et al. mRNA m(6)A methylation downregulates adipogenesis in porcine adipocytes. Biochem Biophys Res Commun. 2015;459:201–207.
- Wu R, Liu Y, Yao Y, et al. FTO regulates adipogenesis by controlling cell cycle progression via m(6)A-YTHDF2 dependent mechanism. Biochim Biophys Acta Mol Cell Biol Lipids. 2018;1863:1323–1330.
- Fu Y, Dominissini D, Rechavi G, et al. Gene expression regulation mediated through reversible m(6)A RNA methylation. Nat Rev Genet. 2014;15:293–306.
- Wu RF, Jiang DH, Wang YZ, et al. N (6)-methyladenosine (m(6)A) methylation in mRNA with A dynamic and reversible epigenetic modification. Mol Biotechnol. 2016;58:450–459.
- Wang X, Lu Z, Gomez A, et al. N6-methyladenosine-dependent regulation of messenger RNA stability. Nature. 2014;505:117–120.
- Wang X, Zhao BS, Roundtree IA, et al. N(6)-methyladenosine modulates messenger RNA translation efficiency. Cell. 2015;161:1388–1399.
- Zheng GQ, Dahl JA, Niu YM, et al. ALKBH5 is a mammalian RNA demethylase that impacts RNA metabolism and mouse fertility. Mol Cell. 2013;49:18–29.
- Jia G, Fu Y, Zhao X, et al. N6-methyladenosine in nuclear RNA is a major substrate of the obesity-associated FTO. Nat Chem Biol. 2011;7:885–887.
- Jin S, Zhang X, Miao Y, et al. m(6)A RNA modification controls autophagy through upregulating ULK1 protein abundance. Cell Res. 2018.
- Gulati P, Cheung MK, Antrobus R, et al. Role for the obesity-related FTO gene in the cellular sensing of amino acids. Proc Natl Acad Sci U S A. 2013;110:2557–2562.
- Aas A, Isakson P, Bindesboll C, et al. Nucleocytoplasmic shuttling of FTO does not affect starvation-induced autophagy. PloS One. 2017;12.
- Ruiz-Ojeda FJ, Ruperez AI, Gomez-Llorente C, et al. Cell models and their application for studying adipogenic differentiation in relation to obesity: a review. Int J Mol Sci. 2016;17(7):1040.
- Pang W, Wang Y, Wei N, et al. Sirt1 inhibits akt2-mediated porcine adipogenesis potentially by direct protein-protein interaction. PloS One. 2013;8:e71576.
- Tang QQ, Otto TC, Lane MD. CCAAT/enhancer-binding protein beta is required for mitotic clonal expansion during adipogenesis. Proc Natl Acad Sci USA. 2003;100:850–855.
- Skop V, Cahova M, Dankova H, et al. Autophagy inhibition in early but not in later stages prevents 3T3-L1 differentiation: effect on mitochondrial remodeling. Differentiation. 2014;87:220–229.
- Han ZF, Niu TH, Chang JB, et al. Crystal structure of the FTO protein reveals basis for its substrate specificity. Nature. 2010;464:1205–1209.
- Shi H, Wang X, Lu Z, et al. YTHDF3 facilitates translation and decay of N6-methyladenosine-modified RNA. Cell Res. 2017;27:315–328.
- Li A, Chen YS, Ping XL, et al. Cytoplasmic m6A reader YTHDF3 promotes mRNA translation. Cell Res. 2017;27:444–447.
- Cheung MK, Gulati P, O’Rahilly S, et al. FTO expression is regulated by availability of essential amino acids. Int J Obesity. 2013;37:744–747.
- Li H, Song Y, He Z, et al. Meclofenamic acid reduces reactive oxygen species accumulation and apoptosis, inhibits excessive autophagy, and protects hair cell-like HEI-OC1 cells from cisplatin-induced damage. Front Cell Neurosci. 2018;12:139.
- Yeh WC, Bierer BE, McKnight SL. Rapamycin inhibits clonal expansion and adipogenic differentiation of 3T3-L1 cells. Proc Natl Acad Sci U S A. 1995;92:11086–11090.
- Jiao Y, Zhang J, Lu L, et al. The FTO gene regulates the proliferation and differentiation of pre-adipocytes in vitro. Nutrients. 2016;8:102.
- Polak P, Cybulski N, Feige JN, et al. Adipose-specific knockout of raptor results in lean mice with enhanced mitochondrial respiration. Cell Metab. 2008;8:399–410.
- Qi L, Saberi M, Zmuda E, et al. Adipocyte CREB promotes insulin resistance in obesity. Cell Metab. 2009;9:277–286.
- Li PP, Fan WQ, Xu JF, et al. Adipocyte NCoR knockout decreases PPAR gamma phosphorylation and enhances PPAR gamma activity and insulin sensitivity. Cell. 2011;147:815–826.
- He WM, Barak Y, Hevener A, et al. Adipose-specific peroxisome proliferator-activated receptor gamma knockout causes insulin resistance in fat and liver but not in muscle. Proc Natl Acad Sci USA. 2003;100:15712–15717.
- Paschos GK, Ibrahim S, Song WL, et al. Obesity in mice with adipocyte-specific deletion of clock component Arntl. Nat Med. 2012;18:1768-+.
- Sabio G, Das M, Mora A, et al. A stress signaling pathway in adipose tissue regulates hepatic insulin resistance. Science. 2008;322:1539–1543.
- Speakman JR. The ‘Fat Mass and Obesity Related’ (FTO) gene: mechanisms of impact on obesity and energy balance. Curr Obes Rep. 2015;4:73–91.
- Church C, Lee S, Bagg EA, et al. A mouse model for the metabolic effects of the human fat mass and obesity associated FTO gene. PLoS Genet. 2009;5:e1000599.
- Fischer J, Koch L, Emmerling C, et al. Inactivation of the Fto gene protects from obesity. Nature. 2009;458:894–898.
- Tews D, Fischer-Posovszky P, Fromme T, et al. FTO deficiency induces UCP-1 expression and mitochondrial uncoupling in adipocytes. Endocrinology. 2013;154:3141–3151.
- Ronkainen J, Mondini E, Cinti F, et al. FTO-deficiency affects the gene and microrna expression involved in brown adipogenesis and browning of white adipose tissue in mice. Int J Mol Sci. 2016;17.
- Wesselborg S, Stork B. Autophagy signal transduction by ATG proteins: from hierarchies to networks. Cell Mol Life Sci. 2015;72:4721–4757.
- Otomo C, Metlagel Z, Takaesu G, et al. Structure of the human ATG12~ATG5 conjugate required for LC3 lipidation in autophagy. Nat Struct Mol Biol. 2013;20:59–66.
- Shi XE, Li YF, Jia L, et al. MicroRNA-199a-5p affects porcine preadipocyte proliferation and differentiation. Int J Mol Sci. 2014;15:8526–8538.
- Gao X, Shin YH, Li M, et al. The fat mass and obesity associated gene FTO functions in the brain to regulate postnatal growth in mice. PloS One. 2010;5:e14005.
- Liu J, Yue Y, Han D, et al. A METTL3-METTL14 complex mediates mammalian nuclear RNA N6-adenosine methylation. Nat Chem Biol. 2014;10:93–95.
- Dominissini D, Moshitch-Moshkovitz S, Amariglio N, et al. Transcriptome-wide mapping of N-6-Methyladenosine by m(6)A-Seq. Method Enzymol. 2015;560:131–147.
- Peritz T, Zeng F, Kannanayakal TJ, et al. Immunoprecipitation of mRNA-protein complexes. Nat Protoc. 2006;1:577–580.
- Wu R, Yao Y, Jiang Q, et al. Epigallocatechin gallate targets FTO and inhibits adipogenesis in an mRNA m(6)A-YTHDF2-dependent manner. Int J Obes (Lond). 2018;42:1378–1388.