
ABSTRACT
TARDBP/TDP-43 (TAR DNA binding protein) proteinopathies are a common feature in a variety of neurodegenerative disorders, including amyotrophic lateral sclerosis (ALS), frontotemporal lobar degeneration (FTLD), and Alzheimer disease (AD). However, the molecular mechanisms underlying TARDBP-induced neurotoxicity are largely unknown. In this study, we demonstrated that TARDBP proteinopathies induce impairment in the ubiquitin proteasome system (UPS), as evidenced by an accumulation of ubiquitinated proteins and a reduction in proteasome activity in neuronal cells. Through kinase inhibitor screening, we identified PTK2/FAK (PTK2 protein tyrosine kinase 2) as a suppressor of neurotoxicity induced by UPS impairment. Importantly, PTK2 inhibition significantly reduced ubiquitin aggregates and attenuated TARDBP-induced cytotoxicity in a Drosophila model of TARDBP proteinopathies. We further identified that phosphorylation of SQSTM1/p62 (sequestosome 1) at S403 (p-SQSTM1 [S403]), a key component in the autophagic degradation of poly-ubiquitinated proteins, is increased upon TARDBP overexpression and is dependent on the activation of PTK2 in neuronal cells. Moreover, expressing a non-phosphorylated form of SQSTM1 (SQSTM1S403A) significantly repressed the accumulation of insoluble poly-ubiquitinated proteins and neurotoxicity induced by TARDBP overexpression in neuronal cells. In addition, TBK1 (TANK binding kinase 1), a kinase that phosphorylates S403 of SQSTM1, was found to be involved in the PTK2-mediated phosphorylation of SQSTM1. Taken together, our data suggest that the PTK2-TBK1-SQSTM1 axis plays a critical role in the pathogenesis of TARDBP by regulating neurotoxicity induced by UPS impairment. Therefore, targeting the PTK2-TBK1-SQSTM1 axis may represent a novel therapeutic intervention for neurodegenerative diseases with TARDBP proteinopathies.Abbreviations: ALP: macroautophagy/autophagy lysosomal pathway; ALS: amyotrophic lateral sclerosis; ATXN2: ataxin 2; BafA1: bafilomycin A1; cCASP3: cleaved caspase 3; CSNK2: casein kinase 2; FTLD: frontotemporal lobar degeneration; MAP1LC3/LC3: microtubule-associated protein 1 light chain 3; OPTN: optineurin; PTK2/FAK: PTK2 protein tyrosine kinase 2; SQSTM1/p62: sequestosome 1; TARDBP/TDP-43: TAR DNA binding protein; TBK1: TANK binding kinase 1; ULK1: unc-51 like autophagy activating kinase 1; UPS: ubiquitin-proteasome system.
Introduction
Amyotrophic lateral sclerosis (ALS) is the most common type of motor neuron disease and is characterized by the progressive degeneration of motor neurons in the brain and the spinal cord [Citation1,Citation2]. ALS is a fatal neurodegenerative disease with no cure. Currently, there is only two FDA-approved drugs for ALS. However, they are known to extend lifespan by only a few months [Citation3,Citation4]. Therefore, there is an urgent demand for the development of effective treatments for ALS.
Intracellular accumulation of TARDBP/TDP-43 (TAR DNA binding protein) is a pathological hallmark of ALS in the majority of cases [Citation5–Citation8]. TARDBP is a highly conserved nuclear RNA binding protein. So far, over fifty missense mutations of TARDBP have been linked to sporadic and familial ALS [Citation5,Citation9]. TARDBP-induced neurotoxicity is currently well-recognized as a contributor to the pathology of ALS and other neurodegenerative diseases that are linked to the deposition of TARDBP, known as TARDBP proteinopathies, such as frontotemporal lobar degeneration (FTLD) and Alzheimer disease [Citation5,Citation7,Citation10]. However, the neuropathological mechanisms of TARDBP proteinopathies are largely unknown. To gain further insight into the pathogenesis of TARDBP proteinopathies, it is critical to understand how TARDBP deposition leads to neurotoxicity.
Notably, the most prominent pathological hallmark of TARDBP proteinopathies is the presence of intracellular ubiquitin-positive inclusions in neurons [Citation11,Citation12]. Ubiquitinated proteins are known to be rapidly degraded by the proteasome in healthy neurons [Citation13]. These findings raise the possibility that the accumulation of ubiquitin-positive proteinaceous inclusions in degenerating neurons contributes to impairment of the ubiquitin proteasome system (UPS) in TARDBP proteinopathies. Interestingly, several genes associated with ALS, such as SQSTM1/p62, VCP (valosin containing protein), OPTN (optineurin), TBK1 (TANK binding kinase 1) and UBQLN2 (ubiquilin 2), are directly linked to the degradation of ubiquitinated proteins, suggesting that impairment of the UPS may be a core pathological mechanism of ALS [Citation14,Citation15]. These findings raise the possibility that the UPS may play a crucial role in TARDBP proteinopathies. However, it has never been determined whether UPS impairment is involved in the neurotoxicity of TARDBP accumulation.
Notably, Drosophila models of TARDBP proteinopathies recapitulate many key pathological features of ALS, such as the deposition of ubiquitin-positive aggregates, progressive motility deficits, and shortened lifespan [Citation16,Citation17]. Moreover, the TARDBP-induced ALS-like features of animal and cellular models including neurotoxicity, cytoplasmic accumulation of TARDBP and endoplasmic reticulum stress are synergistically enhanced by ATXN2 (ataxin 2), one of the polyglutamine disease proteins (polyQ) [Citation18–Citation22]. Furthermore, intermediate expansion of polyglutamine disease proteins (27 ~ 33Q) in ATXN2 has indeed been identified as a risk factor for ALS [Citation19]. These results demonstrate that the Drosophila model co-expressing TARDBP and ALS-associated ATXN2 can mimic the human TARDBP proteinopathies better than the TARDBP-only expressing model. However, the neuropathological mechanisms underlying TARDBP and/or ATXN2-associated ALS remain largely unknown.
PTK2/FAK (PTK2 protein tyrosine kinase 2) is a multifunctional protein that is involved in cell migration and survival [Citation23]. The tyrosine phosphorylation sites in PTK2 are Tyr397, 407, 576/567, 861, and 925. Autophosphorylation at Y397 activates PTK2 and subsequently activates its downstream signaling pathway, but its involvement in the protein quality control system has been largely unexplored [Citation24]. Previous studies have indicated that PTK2 is upregulated in the motor neurons of a 60-d-old presymptomatic SOD1G93A ALS mouse model [Citation25,Citation26].
In this study, we investigated the potential role of the UPS in TARDBP-induced neuropathology by utilizing mammalian cellular models as well as a Drosophila model of TARDBP proteinopathies. We demonstrated that proteasome activity is significantly reduced by TARDBP accumulation. Moreover, we determined that PTK2 plays a critical role in the deposition of ubiquitinated aggregates and neurotoxicity induced by UPS impairment through regulation of the TBK1-SQSTM1 pathway in TARDBP proteinopathies.
Results
TARDBP overexpression induces UPS impairment
To determine whether TARDBP overexpression impairs the UPS in neuronal cells, we first transfected DNA vectors expressing GFP-tagged human TARDBP or Gfp only into mouse neuronal N2a cells (). Consistent with previous findings [Citation11], TARDBP overexpression markedly increased the level of poly-ubiquitinated proteins in insoluble fractions, whereas this level mildly increased in soluble fractions (). We also confirmed these results by performing ICC with an FK1 antibody (a specific antibody for poly-ubiquitinated proteins). TARDBP overexpression dramatically increased the number of poly-ubiquitinated aggregates compared to that in the control N2a cells (). Similar results were also observed in N2a cells treated with MG132 (a potent UPS inhibitor) () [Citation27].
Figure 1. Overexpression of TARDBP causes UPS impairment in neuronal cells. (A-B) N2a cells were transiently transfected with a plasmid containing TARDBP cDNA (pCMV6-AC-TARDBP-Gfp) or a control plasmid (pCMV6-AC-Gfp) and analyzed by immunoblotting. (A) Cell lysates were prepared, and samples were immunoblotted with an anti-GFP or TARDBP antibody. (B) Soluble and insoluble poly-ubiquitinated protein levels in GFP- or TARDBP-GFP-expressing cells. Both soluble and insoluble poly-ubiquitinated protein levels were significantly increased by TARDBP-GFP expression. GFP- or TARDBP-GFP-expressing cells were fractionated into the supernatant (the soluble fraction) and the pellet (the insoluble fraction) using lysis buffer containing 1% Triton X-100. The levels of poly-ubiquitinated proteins were analyzed by immunoblotting. Data are presented as the mean ± SD of 3 independent experiments. **p < 0.005, ***p < 0.001 (Student’s t-test). (C) N2a cells were transiently transfected with a plasmid containing either Gfp or TARDBP-Gfp for 2 d and subsequently treated with MG132 (5 μM) for 24 h. ICC was subsequently performed to detect poly-ubiquitin (red) or DAPI (nuclei; blue). Poly-ubiquitinated aggregates were greatly increased by TARDBP-GFP expression. The percentage of GFP-positive cells that were positive for poly-ubiquitin is shown (lower). Arrowheads indicate the colocalization of the poly-ubiquitinated aggregates with GFP-positive cells. Scale bars: 10 μm. Data are presented as the mean ± SD of 3 independent experiments. *p < 0.05, ***p < 0.001 (one-way ANOVA with Bonferroni multiple comparison test). (D-F) N2a cells were transiently transfected with a plasmid containing either Gfp or TARDBP-Gfp for 2 d and subsequently treated with a PTK2 inhibitor (5 μM) for 24 h. (D) Protein levels of nuclear and cytosolic TARDBP. The protein level of cytosolic TARDBP was greatly increased by TARDBP-GFP expression, and PTK2 inhibition significantly reduced the protein level of cytosolic TARDBP in TARDBP-GFP expressing cells. Bar diagram of expression levels of cytoplasmic and nuclear TARDBP normalized to that of TUBA or LMNA. Data are presented as the mean ± SD of 3 independent experiments. *p < 0.05, **p < 0.005, ***p < 0.001, n.s., not significant (one-way ANOVA with Bonferroni multiple comparison test). (E) Chymotrypsin-like, trypsin-like, and caspase-like activity of the 20S proteasome in GFP- or TARDBP-GFP-expressing cells was analyzed using a Proteasome 20S assay kit from Enzo Life Sciences. TARDBP overexpression markedly reduced the chymotrypsin-like activity of the proteasome. Data are presented as the mean ± SD (n = 3). *p < 0.05, n.s., not significant (one-way ANOVA with Bonferroni multiple comparison test). (F) Immunoblotting for the PSMB5 from the cell lysate and purified proteasome. TARDBP overexpression in N2a cells markedly decreased the PSMB5 subunit of the proteasome in purified proteasome samples. Data are presented as the mean ± SD of 3 independent experiments. **p < 0.005, n.s., not significant (one-way ANOVA with Bonferroni multiple comparison test).
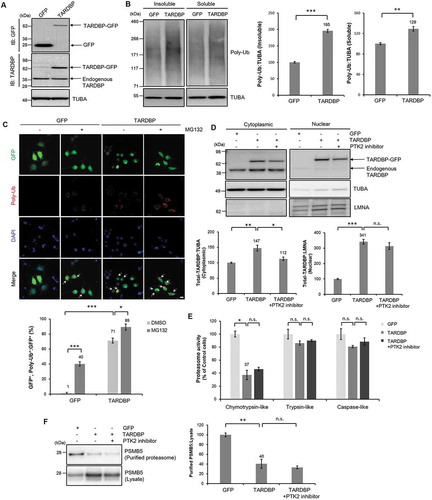
Although TARDBP is mainly localized in the nucleus, it can shuttle to the cytoplasm [Citation28]. Accumulation of cytoplasmic and/or insoluble TARDBP is a key pathological feature of TARDBP proteinopathies, such as ALS and FTLD [Citation10,Citation29], and this accumulation causes neurodegeneration [Citation5,Citation30]. Nuclear cytoplasmic fractionation of N2a cells was employed to determine the level of cytoplasmic and nuclear TARDBP in TARDBP-overexpressing cells. Protein levels of both nuclear and cytoplasmic TARDBP were significantly higher in TARDBP-GFP-expressing cells compared to those in GFP-expressing cells (). Furthermore, TARDBP protein levels were also greatly increased in the insoluble fraction of TARDBP-overexpressing cells (Fig. S1A). These results suggest that TARDBP-GFP-overexpressing N2a cells recapitulate some critical features of TARDBP proteinopathies.
To investigate how TARDBP overexpression inhibits proteasome activity, we measured the enzymatic activities of the 26S proteasome. Interestingly, chymotrypsin-like activity of the proteasome of TARDBP-overexpressing cells was significantly decreased compared to that of control cells, whereas trypsin-like and caspase-like activity were not altered (). It is already known that the PSMB5 subunit of the proteasome is associated with chymotrypsin-like activity [Citation31]. Therefore, we assessed the level of PSMB5 by immunoblotting with a PSMB5 antibody. The level of PSMB5 in the purified proteasome was significantly decreased in TARDBP-GFP-expressing N2a cells compared to that in GFP-expressing cells (). Consistent with the results of the proteasome activity assay, PSMB1 (caspase-like) and PSMB2 (trypsin-like) levels were not significantly affected by TARDBP overexpression (Fig. S2A-B). It is well known that the macroautophagy/autophagy-lysosomal pathway (ALP) is activated upon UPS impairment as a compensatory mechanism [Citation32]. In line with this, we also observed that TARDBP overexpression activated ALP, as evidenced by increased numbers of MAP1LC3/LC3-II+ puncta and increased levels of LC3-I/II in N2a cells (Fig. S3A-B) compared to those in control cells; this further supports the notion that TARDBP overexpression impairs the UPS in neuronal cells. Taken together, our data demonstrated that TARDBP overexpression inhibits the enzymatic activity of the proteasome and thereby increases the level of poly-ubiquitinated proteins in neuronal cells.
PTK2 inhibition ameliorates neurotoxicity induced by TARDBP overexpression
Given that the accumulation of poly-ubiquitinated proteins exerts a cytotoxic effect on cells, we hypothesized that UPS impairment may mediate neurotoxicity in TARDBP proteinopathies and that these can be attenuated by modulating deficits in the UPS. To address this hypothesis, we used kinase inhibitor screening to screen molecules that regulate cytotoxicity induced by blocking the UPS with MG132 (Fig. S4A). We found that the PTK2 inhibitor PF573228 significantly mitigated MG132-induced toxicity in N2a and mouse primary cortical neurons (,, and S4B-C). We also confirmed these results by immunoblotting for cleaved CASP3/caspase-3 (cCASP3) (). To rule out the possibility of off-target effects of PF573228, we confirmed these results using Ptk2 siRNA. Downregulation of PTK2 also attenuated MG132-induced toxicity in N2a and primary cortical neurons (,D and Fig. S5). We also confirmed these results using a different experimental approach based on live cell imaging and obtained similar results (Fig. S6A-B). However, rotenone and tunicamycin-induced neuronal toxicity were not significantly affected by a PTK2 inhibitor (Fig. S7A). These results suggest that PTK2 inhibition specifically mitigates UPS-impairment cytotoxicity but not cell death by other proteotoxic stresses such as reactive oxygen production or endoplasmic reticulum stress. PF573228 is a PTK2-specific inhibitor [Citation33,Citation34]. A previous report indicated that the major autophosphorylation site of PTK2 is Tyr397 residue (Y397) and that the level of Y397 phosphorylation represents the kinase activity of PTK2 [Citation23,Citation24,Citation35]. The level of PTK2 phosphorylated at Tyr397 (p-PTK2 [Y397]) was significantly increased upon MG132 treatment in N2a cells compared to control cells (Fig. S8A). Inhibiting PTK2 with PF573228 significantly decreased the level of p-PTK2 (Y397) (Fig. S8A) and insoluble poly-ubiquitinated proteins (Fig. S8B) in MG132-treated N2a cells. We also confirmed these results in mouse primary cortical neurons (Fig. S8C). However, MG132 is also able to inhibit several other proteases, including serine protease and calpain [Citation36]. Thus, we confirmed these results using lactacystin as a more specific UPS inhibitor than MG132 [Citation37]. Consistently, lactacystin treatment also increased p-PTK2 (Y397) levels, and PTK2 inhibition significantly suppressed lactacystin-induced toxicity in N2a cells (Fig. S9).
Figure 2. Inhibition of PTK2 mitigates TARDBP-induced UPS impairment and neuronal toxicity. (A-B) N2a cells were pretreated with a PTK2 inhibitor (5 μM, A) or Ptk2-specific siRNA (20 nM, B) for 24 h and subsequently treated with MG132 (5 μM) for 24 h. CCK-8 analysis was performed thereafter. Data are presented as the mean ± SD of 3 independent experiments. **p < 0.005 (Student’s t-test). (C-E) Primary cortical neuron cells were pretreated with a PTK2 inhibitor (0.05 μM, C) or Ptk2-specific siRNA (40 nM, D) for 30 min and subsequently treated with MG132 (5 μM) for 24 h. CCK-8 analysis was performed thereafter. Data are presented as the mean ± SD of 3 independent experiments. **p < 0.005 (Student’s t-test). (E) Immunoblot for cCASP3. PTK2 inhibition significantly mitigated MG132-induced cell death. Data are presented as the mean ± SD. **p < 0.005 (one-way ANOVA with Bonferroni multiple comparison test). (F-H) N2a cells were transiently transfected with a plasmid containing either Gfp or TARDBP-Gfp for 2 d and subsequently treated with a PTK2 inhibitor (5 μM) or Ptk2-specific siRNA (20 nM) for 24 h. (F) Immunoblot for p-PTK2 (Y397) and total PTK2. TARDBP overexpression markedly increased the phosphorylation level of PTK2. Data are presented as the mean ± SD of 3 independent experiments. **p < 0.005 (Student’s t-test). (G) Immunocytochemistry was subsequently performed to detect poly-ubiquitin (red) or DAPI (nuclei; blue). The percentage of GFP-positive cells that were positive for poly-ubiquitin is shown (right). Arrowheads indicate the colocalization of the poly-ubiquitinated aggregates with GFP-positive cells. Data are presented as the mean ± SD of 3 independent experiments. *p < 0.05, **p < 0.005 (one-way ANOVA with Bonferroni multiple comparison test). Scale bars: 10 μm. (H) N2a cells transfected with either Gfp or TARDBP-Gfp vector were stained for cCASP3 (red) or DAPI (nuclei; blue). The percentage GFP-positive cells that were positive for cCASP3 is shown (right). Arrowheads indicate the colocalization of cCASP3 with GFP-positive cells. Data are presented as the mean ± SD of 3 independent experiments. **p < 0.005, ***p < 0.001 (one-way ANOVA with Bonferroni multiple comparison test). Scale bars: 10 μm.
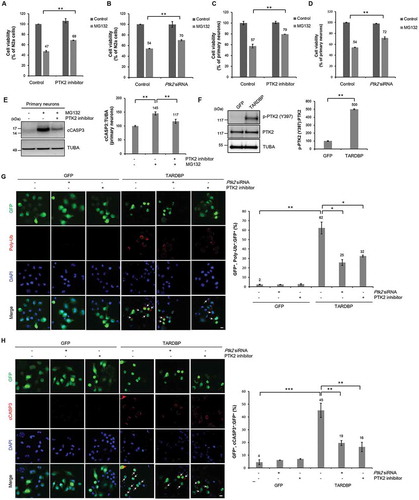
Given that PTK2 regulates cytotoxicity induced by UPS impairment, we next investigated whether inhibiting PTK2 ameliorates neurotoxicity induced by overexpression of TARDBP. We first assessed whether TARDBP overexpression increases the level of p-PTK2 (Y397). TARDBP overexpression markedly increased p-PTK2 (Y397) levels in N2a cells compared to those in control cells (). We also confirmed these results by immunostaining for p-PTK2 (Y397) (Fig. S10A). This result suggests that TARDBP-induced UPS impairment is sufficient to activate PTK2. Moreover, PTK2 inhibition by either siRNA or PF573228 decreased the accumulation of poly-ubiquitinated aggregates induced by TARDBP overexpression in N2a cells (). We also confirmed these results by immunoblotting for poly-ubiquitinated proteins. The level of insoluble poly-ubiquitinated proteins was significantly higher in TARDBP-transfected N2a cells than in Gfp-transfected cells, and PTK2 inhibition effectively reduced the TARDBP-induced accumulation of insoluble poly-ubiquitinated proteins (Fig. S1A). Insoluble TARDBP levels were not significantly affected by Ptk2 siRNA or a PTK2 inhibitor (Fig. S1A).
Interestingly, PTK2 inhibition reduced cytoplasmic TARDBP protein levels but not nuclear TARDBP in TARDBP-GFP-expressing N2a cells (). Cytoplasmic accumulation of TARDBP is a marker of TARDBP toxicity. Therefore, we assumed that TARDBP toxicity is also attenuated by PTK2 inhibition. To determine whether PTK2 modulates neurotoxicity induced by TARDBP overexpression, we monitored the levels of cCASP3 by immunostaining after inhibiting PTK2 in N2a cells expressing TARDBP. cCASP3 is a typical marker for apoptotic cell death [Citation38]. As expected, PTK2 inhibition suppressed TARDBP-induced cell death in N2a cells compared to that in control N2a cells (). We also confirmed these results using a different experimental approach such as immunoblotting and CASP3 colorimetric activity assay (Fig. S1B-C). These results indicate that PTK2 inhibition strongly mitigates TARDBP neurotoxicity in a cellular model of TARDBP proteinopathies.
Downregulation of Fak ameliorates UPS impairment and behavioral deficits in the Drosophila model of TARDBP proteinopathies
Given strong in vitro evidence that PTK2 regulates TARDBP-induced toxicity in neuronal cells, we next examined whether inhibiting PTK2 suppresses TARDBP-induced toxicity in vivo using a Drosophila model of TARDBP proteinopathies that expresses human TARDBP and ATXN2-32Q in the nervous system (hereafter referred to as TDP-P flies) [Citation19,Citation22]. The expression of TARDBP in TDP-P flies was verified by immunoblot (). We first assessed whether the UPS is impaired in TDP-P flies. To monitor UPS activity in flies, we utilized CL1-GFP reporter flies expressing CL1 fused to GFP. CL1 degron is a peptide that is rapidly degraded specifically by the UPS. Therefore, the level of CL1-GFP is indicative of UPS activity [Citation39]. The protein level of CL1-GFP was markedly increased in TDP-P flies compared to that in controls (). Moreover, both insoluble and soluble poly-ubiquitinated proteins were significantly increased in TDP-P fly heads (), suggesting that the UPS is impaired in the nervous system of TDP-P flies.
Figure 3. Fak downregulation mitigates UPS impairment and neuronal toxicity in a fly model of TARDBP proteinopathies. (A-B) Immunoblot of TARDBP-proteinopathies (TDP-P) files expressing the CL1-GFP reporter (a reporter of UPS activity). Genes were expressed in the nervous system in a drug-inducible manner with the elavGS driver. (A) Immunoblot analysis of an anti-TARDBP antibody. (B) Immunoblot analysis of an anti-GFP antibody. The level of CL1-GFP was significantly upregulated in TDP-P flies, which indicates impaired UPS activity. Data are presented as the mean ± standard error of the mean/SEM of 3 independent experiments. **p < 0.005 (Student’s t-test). (C) Both soluble and insoluble poly-ubiquitinated proteins levels were significantly increased in TDP-P flies. The lysates from control or TDP-P fly heads were fractionated into the supernatant (the soluble fraction) and the pellet (the insoluble fraction) using lysis buffer containing 1% Triton X-100. Data are presented as the mean ± SEM. *p < 0.05 (Student’s t-test). (A-C) Genotypes: Control is elavGS,UAS-CL1-Gfp/+, TDP-P is UAS-TARDBP/+;elavGS,UAS-CL1-Gfp/UAS-ATXN2-32Q. (D) RT-PCR for Fak mRNA expression in the heads of TDP-P+ Gfp RNAi or TDP-P+ Fak RNAi flies. The quantification of data Fak mRNA transcript levels are presented as the mean ± SD from 3 independent real-time RT-PCR experiments. Gapdh was used for normalization. ***p < 0.001 (Student’s t-test). (E-F) Immunoblot of TARDBP-proteinopathies (TDP-P) flies with Gfp or Fak RNAi. Knockdown of Fak does not affect TARDBP or ATXN2 protein levels. Data are presented as the mean ± SEM of 3 independent experiments. n.s., not significant (Student’s t-test). (D-F) Genotypes: TDP-P+ Gfp RNAi is UAS-ATXN2-32Q/+;elavGS,UAS-TARDBP/UAS-Egfp RNAi, TDP-P+ Fak RNAi is UAS-ATXN2-32Q/+;elavGS,UAS-TARDBP/UAS-Fak RNAiHMS00010. (G) Immunoblot for insoluble poly-ubiquitinated proteins in the heads of TDP-P+ Gfp RNAi or TDP-P+ Fak RNAi flies. TDP-P-induced accumulation of insoluble poly-ubiquitinated proteins was greatly reduced by Fak inhibition. Data are presented as the mean ± SEM of 3 independent experiments. *p < 0.05, **p < 0.005 (one-way ANOVA with Bonferroni multiple comparison test). Genotypes: (H) The brains of TDP-P+ Gfp RNAi or TDP-P+ Fak RNAi flies were immunostained for poly-ubiquitin (red) and ELAV (green). Knockdown of Fak significantly reduced the accumulation of ubiquitinated inclusions in the brain of TDP-P flies. ELAV is a marker for most differentiated neuronal cells in the central and peripheral nervous systems of Drosophila. The quantification of the number of poly-ubiquitin-positive inclusions per brain (right). Arrowheads indicate poly-ubiquitin-positive inclusions. Data are presented as the mean ± SEM of 4 independent experiments. ***p < 0.001 (two-way ANOVA with Tukey’s multiple comparison test). Scale bars: 50 μm. (I-J) Knockdown of Fak mildly mitigates the climbing defects and shortened lifespan of TDP-P flies. Data are presented as the mean ± SEM of 4 independent experiments. *p < 0.05, **p < 0.005, ***p < 0.001 (one-way ANOVA with Tukey’s multiple comparison test). (G-J) Genotypes: control is elavGS/+, Gfp RNAi is elavGS, UAS-Egfp RNAi, Fak RNAi is elavGS, UAS-Fak RNAiHMS00010, TDP-P+ Gfp RNAi is UAS-ATXN2-32Q/+;elavGS,UAS-TARDBP/UAS-Egfp RNAi and TDP-P+ Fak RNAi is UAS-ATXN2-32Q/+;elavGS,UAS-TARDBP/UAS-Fak RNAiHMS00010.
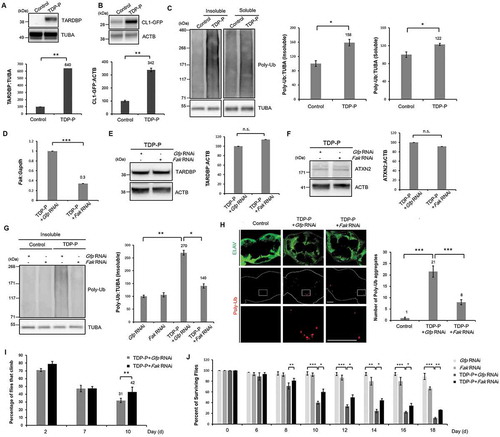
To determine whether knockdown of Fak (Drosophila homolog of PTK2) decreases the level of poly-ubiquitinated proteins in TDP-P flies, we downregulated the expression of Fak by RNAi-mediated gene knock-down (, S11A-B). TARDBP and ATXN2 levels were not affected in Fak RNAi flies (–). However, the amount of insoluble poly-ubiquitinated proteins was significantly higher in TDP-P flies than in Gfp flies, and Fak inhibition effectively reduced the TDP-P-induced accumulation of insoluble poly-ubiquitinated proteins (). We also confirmed these results by immunostaining for poly-ubiquitinated proteins. Knockdown of Fak decreased the number of poly-ubiquitin-positive aggregates in the brains of TDP-P flies (). In physiological conditions, the level of poly-ubiquitinated proteins was not altered by downregulation of Fak (Fig. S12A-B). Taken together, we concluded that knockdown of Fak attenuates UPS impairment in TDP-P flies, similar to the cell-based TARDBP proteinopathies model. Previously, we revealed that TDP-P flies showed deficits in climbing ability and exhibited shortened lifespan [Citation19,Citation22]. When Fak is inhibited, climbing ability and shortened lifespan in TDP-P flies were mildly improved compared those in controls (–J). We also confirmed these results using flies expressing only TARDBP (Fig. S11). Taken together, Fak inhibition ameliorates UPS impairment and behavioral deficits in a Drosophila model of TARDBP proteinopathies.
PTK2 inhibition ameliorates UPS impairment-induced neurotoxicity in a SQSTM1-dependent manne
We next investigated how PTK2 regulates neurotoxicity in TARDBP proteinopathies. It is noteworthy that inhibiting PTK2 markedly decreased the level of insoluble poly-ubiquitinated proteins upon inhibition of protein degradation via the UPS (Fig. S8B). However, PTK2 inhibition did not restore the impaired chymotrypsin-like activity of the proteasome in TARDBP-overexpressing neuronal cells (–). These results suggest that PTK2 inhibition improves the degradation of poly-ubiquitinated proteins by mechanisms other than the UPS. Poly-ubiquitinated proteins can be degraded by ALP under conditions of UPS impairment [Citation40]. SQSTM1 is an ubiquitin-binding protein that mediates the degradation of poly-ubiquitinated proteins by ALP [Citation41,Citation42]. To determine whether SQSTM1 is involved in PTK2-mediated mitigation of neurotoxicity induced by UPS dysfunction, we treated MG132-treated cells with Sqstm1-specific siRNA to suppress SQSTM1 (,). Knockdown of Sqstm1 completely abolished the neuroprotective effect of PTK2 inhibition against MG132-induced toxicity in both N2a cells and primary neurons (,). All of these findings indicate that PTK2 inhibition compensates for the dysfunction of the UPS through the SQSTM1-mediated pathway.
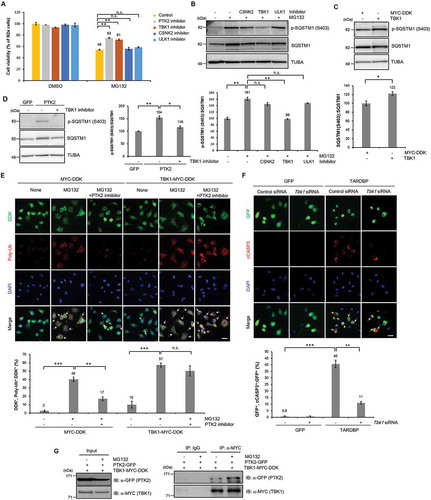
Figure 4. SQSTM1 is a crucial component of PTK2-mediated neuroprotection during UPS impairment. (A-B) N2a cells were pretransfected with control siRNA (40 nM) or Sqstm1-specific siRNA (40 nM) for 24 h and subsequently treated with MG132 (5 μM) for 24 h. (A) Transfection of Sqstm1 siRNA efficiently downregulated the protein level of SQSTM1 in N2a cells. Data are presented as the mean ± SD of 3 independent experiments. **p < 0.005 (Student’s t-test). (B) A CCK-8 assay was performed to assess the effect of Sqstm1 knockdown on MG132-induced toxicity in N2a cells. PTK2 inhibition did not mitigate MG132 toxicity in Sqstm1 knockdown conditions. Data are presented as the mean ± SD of 3 independent experiments. **p < 0.005, n.s., not significant (one-way ANOVA with Bonferroni multiple comparison test). (C) N2a cells were pretreated with a PTK2 inhibitor (5 μM) for 30 min and subsequently treated with MG132 (5 μM) for 24 h. Immunoblot for p-SQSTM1 at S403 (p-SQSTM1 [S403]) and total SQSTM1. PTK2 inhibition significantly reduced UPS impairment-induced PTK2 phosphorylation. Data are presented as the mean ± SD of 3 independent experiments. *p < 0.05 (one-way ANOVA with Bonferroni multiple comparison test). (D-E) Primary cortical neurons were pretransfected with control siRNA (40 nM) or Sqstm1-specific siRNA (40 nM) for 24 h and subsequently treated with MG132 (5 μM) for 24 h. (D) Immunoblot for total SQSTM1. Data are presented as the mean ± SD of 3 independent experiments. **p < 0.005 (Student’s t-test). (E) A CCK-8 assay was performed to assess the effect of Sqstm1 knockdown on MG132-induced toxicity in primary cortical neurons. PTK2 inhibition did not mitigate MG132 toxicity in Sqstm1 knockdown conditions. Data are presented as the mean ± SD of 3 independent experiments. **p < 0.005, ***p < 0.001, n.s., not significant (one-way ANOVA with Bonferroni multiple comparison test). (F) Primary cortical neurons were pretreated with a PTK2 inhibitor (0.05 μM) for 30 min and subsequently treated with MG132 (5 μM) for 24 h. Immunoblot for p-SQSTM1 (S403) and total SQSTM1. Data are presented as the mean ± SD of 3 independent experiments. **p < 0.005, ***p < 0.001 (one-way ANOVA with Bonferroni multiple comparison test). (G-I) N2a cells were transiently transfected with either Gfp or TARDBP-Gfp for 2 d and subsequently treated with a PTK2 inhibitor (5 μM) for 24 h. (G) Immunocytochemistry was subsequently performed to detect p-SQSTM1 (S403) (red) or DAPI (nuclei; blue). TARDBP-induced upregulation of p-SQSTM1 (S403) was greatly reduced by PTK2 inhibition. Arrowheads indicate p-SQSTM1 (S403)-positive puncta. The percentage of GFP-positive cells that were positive for p-SQSTM1 (S403) is shown (right). Data are presented as the mean ± SD of 3 independent experiments. **p < 0.005 (one-way ANOVA with Bonferroni multiple comparison test). Scale bars: 10 μm. (H) N2a cells transfected with either a Gfp or TARDBP-Gfp vector were stained for SQSTM1. PTK2 inhibition did not affect the total SQSTM1 level in TARDBP-expressing cells. Arrowheads indicate SQSTM1-positive puncta. The percentage of GFP-positive cells that were positive for SQSTM1 is shown (right). Data are presented as the mean ± SD of 3 independent experiments. ***p < 0.001, n.s., not significant (one-way ANOVA with Bonferroni multiple comparison test). Scale bars: 10 μm. (I) Immunoblot for total SQSTM1 expression. Data are presented as the mean ± SD of 3 independent experiments. *p < 0.05, n.s., not significant (one-way ANOVA with Bonferroni multiple comparison test).
![Figure 4. SQSTM1 is a crucial component of PTK2-mediated neuroprotection during UPS impairment. (A-B) N2a cells were pretransfected with control siRNA (40 nM) or Sqstm1-specific siRNA (40 nM) for 24 h and subsequently treated with MG132 (5 μM) for 24 h. (A) Transfection of Sqstm1 siRNA efficiently downregulated the protein level of SQSTM1 in N2a cells. Data are presented as the mean ± SD of 3 independent experiments. **p < 0.005 (Student’s t-test). (B) A CCK-8 assay was performed to assess the effect of Sqstm1 knockdown on MG132-induced toxicity in N2a cells. PTK2 inhibition did not mitigate MG132 toxicity in Sqstm1 knockdown conditions. Data are presented as the mean ± SD of 3 independent experiments. **p < 0.005, n.s., not significant (one-way ANOVA with Bonferroni multiple comparison test). (C) N2a cells were pretreated with a PTK2 inhibitor (5 μM) for 30 min and subsequently treated with MG132 (5 μM) for 24 h. Immunoblot for p-SQSTM1 at S403 (p-SQSTM1 [S403]) and total SQSTM1. PTK2 inhibition significantly reduced UPS impairment-induced PTK2 phosphorylation. Data are presented as the mean ± SD of 3 independent experiments. *p < 0.05 (one-way ANOVA with Bonferroni multiple comparison test). (D-E) Primary cortical neurons were pretransfected with control siRNA (40 nM) or Sqstm1-specific siRNA (40 nM) for 24 h and subsequently treated with MG132 (5 μM) for 24 h. (D) Immunoblot for total SQSTM1. Data are presented as the mean ± SD of 3 independent experiments. **p < 0.005 (Student’s t-test). (E) A CCK-8 assay was performed to assess the effect of Sqstm1 knockdown on MG132-induced toxicity in primary cortical neurons. PTK2 inhibition did not mitigate MG132 toxicity in Sqstm1 knockdown conditions. Data are presented as the mean ± SD of 3 independent experiments. **p < 0.005, ***p < 0.001, n.s., not significant (one-way ANOVA with Bonferroni multiple comparison test). (F) Primary cortical neurons were pretreated with a PTK2 inhibitor (0.05 μM) for 30 min and subsequently treated with MG132 (5 μM) for 24 h. Immunoblot for p-SQSTM1 (S403) and total SQSTM1. Data are presented as the mean ± SD of 3 independent experiments. **p < 0.005, ***p < 0.001 (one-way ANOVA with Bonferroni multiple comparison test). (G-I) N2a cells were transiently transfected with either Gfp or TARDBP-Gfp for 2 d and subsequently treated with a PTK2 inhibitor (5 μM) for 24 h. (G) Immunocytochemistry was subsequently performed to detect p-SQSTM1 (S403) (red) or DAPI (nuclei; blue). TARDBP-induced upregulation of p-SQSTM1 (S403) was greatly reduced by PTK2 inhibition. Arrowheads indicate p-SQSTM1 (S403)-positive puncta. The percentage of GFP-positive cells that were positive for p-SQSTM1 (S403) is shown (right). Data are presented as the mean ± SD of 3 independent experiments. **p < 0.005 (one-way ANOVA with Bonferroni multiple comparison test). Scale bars: 10 μm. (H) N2a cells transfected with either a Gfp or TARDBP-Gfp vector were stained for SQSTM1. PTK2 inhibition did not affect the total SQSTM1 level in TARDBP-expressing cells. Arrowheads indicate SQSTM1-positive puncta. The percentage of GFP-positive cells that were positive for SQSTM1 is shown (right). Data are presented as the mean ± SD of 3 independent experiments. ***p < 0.001, n.s., not significant (one-way ANOVA with Bonferroni multiple comparison test). Scale bars: 10 μm. (I) Immunoblot for total SQSTM1 expression. Data are presented as the mean ± SD of 3 independent experiments. *p < 0.05, n.s., not significant (one-way ANOVA with Bonferroni multiple comparison test).](/cms/asset/dc139a36-6e88-4dfd-9f5f-331cab33ede7/kaup_a_1686729_f0004_oc.jpg)
PTK2 regulates TARDBP- and UPS impairment-induced neurotoxicity via phosphorylation of SQSTM1 at S403
SQSTM1 has multiple phosphorylation sites, and the phosphorylation of SQSTM1 modulates various SQSTM1 functions, including the transfer of ubiquitinated proteins to autophagosomes [Citation42,Citation43]. Thus, we investigated whether PTK2 regulates SQSTM1 phosphorylation during UPS dysfunction. The most recognized phosphorylation sites of SQSTM1 were not affected by PTK2 inhibition in MG132-treated N2a cells, except for the Ser403 residue (S403) (, and S13A). Total SQSTM1 expression and the level of SQSTM1 phosphorylated at S403 (p-SQSTM1 [S403]) were significantly higher in MG132-treated N2a cells compared to those in DMSO-only-treated cells, but PTK2 inhibition did not alter the level of total SQSTM1 in either the insoluble or soluble fraction compared to those in MG132 treated cells (Fig. S13B). However, PTK2 inhibition dramatically decreased the level of p-SQSTM1 (S403) in N2a cells and primary neurons treated with MG132 (,). In addition, PTK2 did not regulate p-SQSTM1 (S403) under untreated conditions (Fig. S13C-D), suggesting that PTK2-mediated regulation of SQSTM1 phosphorylation at S403 is specific to the condition of UPS dysfunction. To determine whether TARDBP also increases p-SQSTM1 (S403) levels, we performed immunostaining of N2a cells overexpressing TARDBP with a p-SQSTM1 (S403)-specific antibody. We found that TARDBP overexpression markedly increased the number of p-SQSTM1 (S403)-positive cells and that PTK2 inhibition effectively reduced the TARDBP-induced upregulation of p-SQSTM1 (S403) (). Moreover, the level of total SQSTM1 was significantly higher in TARDBP-transfected N2a cells compared to that in Gfp-transfected cells, and PTK2 inhibition did not affect TARDBP-induced upregulation of total SQSTM1 (). We also confirmed this result using immunoblotting, and the total SQSTM1 level was not altered by PTK2 inhibition in either the soluble or insoluble fraction of the cell lysate (Fig. S13E). Altogether, these findings suggest that PTK2 regulates TARDBP-induced UPS impairment via phosphorylation of SQSTM1 at S403.
The SQSTM1S403A mutation enhances the autophagic clearance of insoluble ubiquitinated proteins during UPS dysfunction
Previous studies demonstrated that the phosphorylation of SQSTM1 at S403 modulates its binding affinity to poly-ubiquitinated proteins, thereby regulating their autophagic degradation [Citation44]. To examine the effect of the phosphorylation of SQSTM1 at S403 on the degradation of poly-ubiquitinated proteins during UPS impairment, we generated a stable N2a cell line expressing MYC-DDK-tagged wild-type SQSTM1, a non-phosphorylated mimic form of SQSTM1 (SQSTM1S403A) (Fig. S14A-B). Strikingly, SQSTM1S403A-expressing cells showed significantly fewer poly-ubiquitinated aggregates than SQSTM1-expressing cells undergoing UPS impairment (), which was further validated by immunoblotting of the soluble and insoluble fractions of the cell lysate (Fig. S14C). Similar to PTK2-inhibited cells, only the insoluble ubiquitinated protein accumulation was reduced in the cells expressing the S403A mutation during UPS dysfunction (Fig. S14C). Moreover, poly-ubiquitinated aggregates in SQSTM1S403A-expressing cells were more frequently colocalized with autophagic vesicles (visualized by Cyto-ID) than in control cells (). Consistent with these results, poly-ubiquitinated aggregates were more frequently colocalized with SQSTM1S403A (marked by DDK) than with wild-type SQSTM1 (), indicating that SQSTM1 phosphorylation at S403 inhibits the transfer of poly-ubiquitinated proteins to autophagic vesicles. Neither the soluble nor the insoluble SQSTM1 levels were affected by SQSTM1S403A expression. These results indicate that SQSTM1S403A mitigates UPS impairment without altering SQSTM1 stability (Fig. S14D). In addition, MG132-induced cell death was attenuated by SQSTM1S403A expression compared to that in wild-type SQSTM1 expressing control cells (). Taken together, these findings suggest that non-phosphorylated SQSTM1 (SQSTM1S403A) incorporates poly-ubiquitinated proteins into autophagic vesicles more effectively than wild-type SQSTM1 does. To further support this hypothesis, we used bafilomycin A1 (BafA1) as a specific inhibitor of lysosomal degradation [Citation45] and generated an N2a cell line that stably expresses a phosphorylated mimic form of MYC-DDK-tagged SQSTM1 (SQSTM1S403E). Accumulated ubiquitinated proteins produced by UPS dysfunction are generally degraded by ALP [Citation40]. We examined the amount of poly-ubiquitinated proteins degraded by ALP during UPS inhibition to evaluate the degradation capacity of ALP against ubiquitinated proteins. Wild-type SQSTM1- or mutant SQSTM1 (SQSTM1S403A and SQSTM1S403E)-expressing cells were treated with MG132 for 12 h to inhibit UPS activity. The cells were then treated with BafA1 for 12 h to evaluate the ability of ALP to degrade poly-ubiquitinated proteins and MYC-DDK-tagged SQSTM1. A greater amount of poly-ubiquitinated proteins and MYC-DDK-SQSTM1 accumulated in BafA1-treated SQSTM1S403A cells compared to that in BafA1-treated wild-type and SQSTM1S403E-expressing cells (Fig. S15A-B). We next investigated whether SQSTM1 phosphorylation also regulates ubiquitin binding affinity of SQSTM1. We performed co-immunoprecipitation (co-IP) of MYC-DDK-SQSTM1- or SQSTM1S403A with a MYC and poly-ubiquitin antibodies. The S403A mutation does not improve the binding affinity of SQSTM1 to soluble ubiquitinated proteins (Fig. S16A). These results further confirmed our hypothesis that dephosphorylation of p-SQSTM1 (S403) improves the autophagic degradation of insoluble ubiquitinated proteins under UPS impaired conditions.
Figure 5. The S403A mutation suppresses TARDBP- and MG132-induced neuronal toxicity in neuronal cells. (A-B) MYC-DDK-tagged wild-type SQSTM1-, and SQSTM1S403A-expressing N2a stable cell lines were treated with MG132 (5 μM) for 24 h. (A) Immunocytochemistry to detect the Cyto-ID autophagy dye (green), poly-ubiquitin (red), DDK (SQSTM1; violet) was subsequently performed. The percentage of total cells that were positive for poly-ubiquitin, the percentage of poly-ubiquitin-positive cells that were positive for CytoID:poly-ubiquitin, the percentage total cells that were positive for CytoID, and the percentage of poly-ubiquitin-positive cells that were exhibited SQSTM1-positive puncta is shown (lower). Arrowheads indicate the colocalization of the Cyto-ID autophagy dye with poly-ubiquitin or of SQSTM1 with poly-ubiquitin in the SQSTM1 or SQSTM1 mutant stable cell lines. Data are presented as the mean ± SD of 3 independent experiments. *p < 0.05, n.s., not significant (one-way ANOVA with Bonferroni multiple comparison test). Scale bars: 10 μm. (B) N2a cells expressing either MYC-DDK-SQSTM1 or MYC-DDK-SQSTM1S403A were stained for cCASP3 (red) or DAPI (nuclei; blue). SQSTM1S403A significantly mitigates MG132-induced cell death. Arrowheads indicate cCASP3-positive cells. The percentage of cells that were positive for cCASP3 in the SQSTM1 stable cell lines is shown (lower). Data are presented as the mean ± SD of 3 independent experiments. **p < 0.005 (one-way ANOVA with Bonferroni multiple comparison test). Scale bars: 100 μm. (C-D) MYC-DDK-SQSTM1 or MYC-DDK-SQSTM1S403A-overexpressing N2a stable cells were transiently transfected with plasmids containing either Gfp or TARDBP-Gfp for 3 d. Immunostaining was performed thereafter. (C) Immunocytochemistry to detect poly-ubiquitin (red) or DAPI (nuclei; blue). TARDBP-induced UPS impairment was markedly reduced by SQSTM1S403A expression. Arrowheads indicate poly-ubiquitin-positive inclusions. The percentage of GFP-positive cells that were positive for poly-ubiquitin is shown (lower). Data are presented as the mean ± SD of 3 independent experiments. **p < 0.005 (one-way ANOVA with Bonferroni multiple comparison test). Scale bars: 10 μm. (D) Immunocytochemistry to detect cCASP3 (red) or DAPI (nuclei; blue). TARDBP-induced cell death is greatly mitigated by SQSTM1S403A expression. Arrowheads indicate cCASP3-positive cells. The percentage of GFP-positive cells that were positive for cCASP3 is shown (lower). Data are presented as the mean ± SD of 3 independent experiments. **p < 0.005 (one-way ANOVA with Bonferroni multiple comparison test). Scale bars: 10 μm.
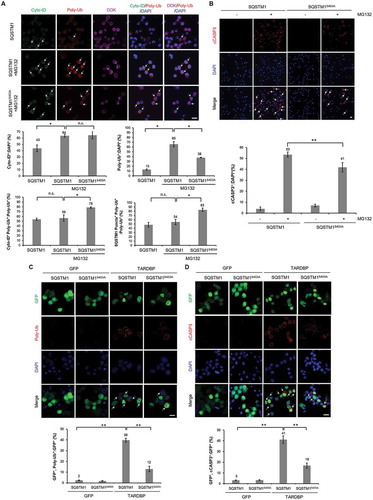
We next investigated whether SQSTM1 phosphorylation at S403 regulates TARDBP-induced neurotoxicity. To do this, we transfected TARDBP-Gfp or Gfp into N2a cells stably expressing either SQSTM1 or SQSTM1S403A. The accumulation of poly-ubiquitinated aggregates induced by TARDBP overexpression was markedly reduced in the SQSTM1S403A-expressing cells compared to that in the control cells (). In line with these findings, TARDBP-induced cell death was strongly suppressed in SQSTM1S403A-expressing cells compared to that in SQSTM1-expressing cells (). Taken together, our data suggest that PTK2 inhibition alleviates TARDBP-induced neurotoxicity by inhibiting the phosphorylation of SQSTM1 at S403.
PTK2 regulates SQSTM1 phosphorylation at S403 via TBK1
PTK2 is a tyrosine kinase that cannot directly phosphorylate SQSTM1 at S403. Therefore, another kinase is likely involved in the PTK2-mediated regulation of SQSTM1 phosphorylation. Previous studies showed that S403 of SQSTM1 is phosphorylated by TBK1, CSNK2 (casein kinase 2), or ULK1 (unc-51 like autophagy activating kinase 1) [Citation44,Citation46,Citation47]. Among these proteins, inhibition of only TBK1 (by BX797)-mitigated MG132-induced neurotoxicity in N2a cells (). TBK1 inhibition with Tbk1-specific siRNA showed a similar protective effect against MG132-induced neurotoxicity in primary neurons (Fig. S17A-B). TBK1 inhibition suppressed MG132-induced upregulation of p-SQSTM1 (S403) in N2a cells and primary neurons ( and S17C). We also showed that TBK1 overexpression clearly increased p-SQSTM1 (S403) levels (). Consistent with these results, PTK2 overexpression also increased p-SQSTM1 (S403) levels, and TBK1 inhibition significantly suppressed PTK2-induced phosphorylation of SQSTM1 in N2a cells (). Moreover, PTK2 inhibition did not compensate for UPS impairment in TBK1-overexpressing cells (). Similar results were also observed with immunoblotting for poly-Ub (Fig. S18A). In addition, the ability of ALP to degrade poly-ubiquitinated proteins under UPS impaired condition was markedly reduced in the TBK1-overexpressing cells compared to that in the control cells (Fig. S19A). Furthermore, SQSTM1, PTK2, and p-PTK2 (Y397) levels were not affected by TBK1 inhibition or overexpression (Fig. S20A-B). All of these data indicate that PTK2 regulates p-SQSTM1 (S403) via TBK1 in cells with UPS impairment. To determine whether PTK2 physically interacts with TBK1, we performed co-IP using MYC and GFP antibodies. To do this, N2a cells were co-transfected with Ptk2-GFP and Tbk1-MYC-DDK expression constructs. Then, co-transfected cells were either treated with MG132 or left untreated before extracting protein. Interestingly, PTK2 physically bound to TBK1, and this interaction was enhanced by UPS impairment (). Knockdown of Sqstm1 completely abolished the neuroprotective effect of PTK2 inhibition against MG132-induced toxicity in both N2a cells and primary neurons (,). Our data suggest that PTK2 modulates neurotoxicity induced by UPS impairment via the TBK1-SQSTM1 axis in neurons.
Figure 6. TBK1 inhibition attenuates UPS impairment-induced neuronal toxicity. (A-B) N2a cells were pretreated with a TBK1 inhibitor (1 μM), a CSNK2A1 inhibitor (5 μM), or a ULK1 inhibitor (10 nM) for 30 min and subsequently treated with MG132 (5 μM) for 24 h. (A) A CCK-8 assay was performed to assess the effects of TBK1, CSNK2A1 and ULK1 inhibition on MG132-induced toxicity in N2a cells. TBK1 inhibition significantly reduced MG132-induced toxicity. Data are presented as the mean ± SD of 3 independent experiments. **p < 0.005, n.s., not significant (one-way ANOVA with Bonferroni multiple comparison test). (B) Immunoblot for p-SQSTM1 (S403) and total SQSTM1. TBK1 inhibition significantly decreased the MG132-induced upregulation of p-SQSTM1 (S403). Data are presented as the mean ± SD. **p < 0.005, n.s., not significant (one-way ANOVA with Bonferroni multiple comparison test). (C) N2a cells were transiently transfected with either a control vector (pCMV6-AC-MYC-DDK) or a construct expressing Tbk1 (pCMV6-AC-Tbk1-MYC-DDK) for 2 d. TBK1 overexpression markedly increased the level of p-SQSTM1 (S403). Immunoblot for p-SQSTM1 (S403) and total SQSTM1. Data are presented as the mean ± SD of 3 independent experiments. *p < 0.05 (Student’s t-test). (D) N2a cells were transiently transfected with either a Gfp (pGFP) or a Ptk2-GFP (pGFP-Ptk2) vector for 2 d and subsequently treated with TBK1 inhibitor (1 μM) for 24 h. Immunoblot for p-SQSTM1 (S403) and total SQSTM1. TBK1 inhibition significantly suppressed the phosphorylation of SQSTM1 induced by PTK2 overexpression. *p < 0.05, **p < 0.005 (one-way ANOVA with Bonferroni multiple comparison test). (E) N2a cells were transiently transfected with either a MYC-DDK or a Tbk1-MYC-DDK vector for 2 d. The Tbk1-transfected cells were pretreated with a PTK2 inhibitor (5 μM) for 30 min and subsequently treated with MG132 (5 μM) for 24 h. PTK2 inhibition did not affect MG132-induced toxicity in TBK1-overexpressing cells. Immunocytochemistry to detect DDK (green), poly-ubiquitin (red), or DAPI (nuclei; blue). The percentage of DDK-positive cells that were positive for poly-ubiquitin is shown (lower). Data are presented as the mean ± SD of 3 independent experiments. **p < 0.005, ***p < 0.001, n.s., not significant (one-way ANOVA with Bonferroni multiple comparison test). Scale bars: 10 μm. (F) N2a cells were transiently transfected with control siRNA or Tbk1 siRNA for 24 h. The Tbk1 siRNA-transfected cells were co- transfected with a plasmid containing either Gfp- or TARDBP-Gfp for 2 d. Immunocytochemistry to detect cCASP3 (red) or DAPI (nuclei; blue). Knockdown of Tbk1 greatly attenuated TARDBP-induced cell death. The percentage of GFP-positive cells that were positive for cCASP3 is shown (lower). Data are presented as the mean ± SD of 3 independent experiments. **p < 0.005, ***p < 0.001 (one-way ANOVA with Bonferroni multiple comparison test). Scale bars: 10 μm. (G) N2a cells were co-transfected with a Tbk1-MYC-DDK or a Ptk2-GFP vector for 2 d and subsequently treated with MG132 (5 μM) for 24 h. Cell lysates were immunoprecipitated with anti-GFP or anti-MYC antibodies. TBK1 physically interacted with PTK2 in physiological and UPS-impaired conditions.
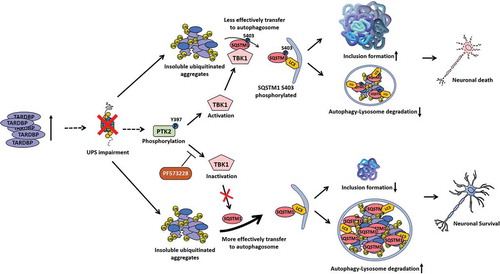
We next investigated whether TBK1 regulates TARDBP-induced neurotoxicity. We co-transfected Tbk1 siRNA and TARDBP-Gfp into N2a cells. Consistently, knockdown of Tbk1 greatly alleviated TARDBP-induced cell death (). Taken together, our data support a model whereby TARDBP compromises UPS activity (). In the context of TARDBP proteinopathies, the accumulation of TARDBP compromises the UPS. UPS impairment eventually leads to an increase in insoluble ubiquitinated aggregates and PTK2 activation. PTK2 activation also increases TBK1 activity, which phosphorylates the Ser403 site of SQSTM1. Increased phosphorylation of SQSTM1 at S403 weakens the ability of SQSTM1 to facilitate autophagic clearance of insoluble ubiquitinated proteins. Consequently, elevated proteotoxic stress due to the accumulation of ubiquitinated aggregates induces neuronal cell death. On the other hand, PTK2 inhibition reduces the phosphorylation of SQSTM1 at S403, which enables ubiquitinated proteins to be more effectively degraded by ALP, thereby mitigating TARDBP toxicity.
Figure 7. Model of TARDBP-mediated neurodegeneration in TARDBP proteinopathies. See text for details.
Discussion
More than 95% of ALS patients have TARDBP aggregates in their affected tissues [Citation5]. As mentioned above, several lines of evidence suggest that the UPS may be impaired in cases of ALS with TARDBP proteinopathies [Citation48–Citation51]. Some evidence suggests that ubiquitin-proteasome activity is reduced in the motor neurons of sporadic ALS patients [Citation11]. However, it has never been clearly addressed whether TARDBP is the culprit behind UPS dysfunction in ALS. In this study, we demonstrated that TARDBP overexpression impairs the UPS in cellular and Drosophila models of TARDBP proteinopathies. In particular, chymotrypsin-like activity of the 26S proteasome and PSMB5 levels are significantly reduced by TARDBP overexpression. Our data suggest that abnormal accumulation of TARDBP contributes to the progression of ALS with TARDBP proteinopathies at least in part by impairing the UPS. However, further studies are warranted to determine how TARDBP accumulation affects UPS function.
Through kinase inhibitor screening in neuronal cells, we identified PTK2 as a modifier of toxicity induced by UPS impairment. We also found that the knockdown of Sqstm1 abolished the neuroprotective effect of PTK2 inhibition against MG132-induced toxicity. These results indicate that neuroprotective effect of PTK2 inhibition against UPS dysfunction requires SQSTM1. Besides, we observed that UPS impairment increases phosphorylation of SQSTM1 at S403, and this upregulation of SQSTM1 phosphorylation was diminished by PTK2 inhibition. Therefore, we concluded that PTK2 inhibition suppresses neurotoxicity induced by UPS impairment via regulation of SQSTM1 phosphorylation. Moreover, PTK2 inhibition represses the accumulation of ubiquitinated aggregates in cellular and Drosophila models of TARDBP proteinopathies, suggesting that inhibiting PTK2 may represent a novel therapeutic intervention for neurodegenerative diseases with TARDBP proteinopathies.
SQSTM1 mediates the sequestration of poly-ubiquitinated proteins into the autophagosome [Citation52,Citation53]. It is well known that SQSTM1 plays an important role in the degradation of poly-ubiquitinated proteins during UPS impairment [Citation42,Citation53–Citation55]. Previous studies reported that phosphorylation of SQSTM1 at S403 increases the binding affinity between SQSTM1 and polyubiquitin chain, resulting in the enhancement of autophagic clearance of poly-ubiquitinated proteins [Citation44]. Moreover, SQSTM1 is known to facilitate the incorporation of soluble ubiquitinated proteins to autophagosome [Citation53,Citation56], and another autophagic adapter protein NBR1 enhances the autophagic degradation of insoluble ubiquitinated proteins in plants [Citation57]. However, our results have shown that inhibition of SQSTM1 S403 phosphorylation reduces the accumulation of insoluble poly-ubiquitinated proteins under UPS impaired conditions. We also found that inhibition of UPS activity induced by MG132 treatment or TARDBP overexpression increases p-SQSTM1 (S403) levels in neuronal cells. Moreover, PTK2 inhibition, which reduces the UPS impairment induced toxicity and ubiquitinated aggregates, suppresses UPS impairment induced upregulation of p-SQSTM1 (S403) in neuronal cells. Besides, expressing the non-phosphorylated form of SQSTM1 (SQSTM1S403A) in UPS impaired neuronal cells reduces the amount of insoluble ubiquitin aggregates (Fig. S14C). All of these results indicate that SQSTM1S403A facilitates the degradation of insoluble ubiquitinated proteins by ALP under UPS-impaired conditions in neuronal cells. Insoluble ubiquitinated proteins are mainly degraded by ALP in yeast under non-stressed condition [Citation58]. To investigate whether S403 phosphorylation regulates autophagic degradation of insoluble ubiquitinated proteins in normal condition, we increased the level p-SQSTM1 (S403) by TBK1 overexpression and analyzed the amount of insoluble ubiquitinated aggregates. Intriguingly, insoluble ubiquitinated proteins were accumulated in the TBK1-overexpressing cells without UPS impairment (Fig. S19). These results also suggest that the dephosphorylation of SQSTM1 at S403 facilitates the autophagic clearance of insoluble ubiquitinated proteins. However, further analysis is still warranted to clarify how phosphorylation of SQSTM1 controls the autophagic degradation efficiency of poly-ubiquitinated proteins during the UPS dysfunction.
Importantly, SQSTM1S403A significantly attenuates cell death induced by TARDBP overexpression in neuronal cells. Thus, our findings also suggest that PTK2 regulates TARDBP-mediated neurotoxicity by modulating the phosphorylation of SQSTM1 at S403. Intriguingly, mutations in SQSTM1 are associated with ALS and FTLD [Citation59–Citation63]. In addition, p-SQSTM1 (S403)-positive inclusions accumulate in the spinal cord of ALS patients [Citation64]. These results raise the possibility that the PTK2-SQSTM1 axis plays a critical role in the pathogenesis of ALS.
TBK1 is a kinase that phosphorylates SQSTM1 at S403 [Citation65]. Notably, mutations in Tbk1 are also associated with ALS [Citation66]. Moreover, OPTN, another interacting partner of both TBK1 and SQSTM1, is associated with ALS [Citation67]. TBK1 phosphorylates OPTN to modulate its binding affinity for ubiquitin chains [Citation68]. ALS-associated mutations in OPTN are reported to induce deficits in autophagosome formation and thereby inhibit the degradation of ubiquitinated substrates [Citation49,Citation69,Citation70]. Taken together, all the evidence suggests that UPS dysfunction may be one of the core pathogenic mechanisms of ALS. We demonstrated that TBK1 inhibition strongly suppresses the induction of p-SQSTM1 (S403) and cell death induced by UPS impairment in neuronal cells, suggesting that the PTK2-TBK1-SQSTM1 axis may represent a novel therapeutic target for ALS. Further studies are warranted to elucidate the underlying mechanism of the effect of TARDBP accumulation on the PTK2-TBK1-SQSTM1 axis.
In summary, we demonstrated that the UPS is impaired in TARDBP proteinopathies. We identified that the PTK2-TBK1-SQSTM1 axis regulates the degradation of ubiquitinated proteins and neurotoxicity induced by TARDBP overexpression. Therefore, our data suggest that targeting the PTK2-TBK1-SQSTM1 axis may represent a novel therapeutic intervention for neurodegenerative diseases with TARDBP proteinopathies.
Materials and methods
Reagents
The following reagents were purchased as indicated: dimethyl sulfoxide (DMSO, Sigma, D8418), mifepristone (RU-486; Sigma, M8046), MG132 (Calbiochem/Merck-Millipore, 474791), PTK2 inhibitor (PF573228; APExBIO, B1523), CSNK2A1 inhibitor (DMAT; APExBIO, A3368), ULK1 inhibitor (MRT68921; Selleckchem, S7949), and TBK1 inhibitor (BX 795; Axon Medchem, 1390).
Antibodies
The following antibodies were used for immunoblotting: p-PTK2 (Y397) (Cell Signaling Technology, 3283), PTK2 (Cell Signaling Technology, 3285), HRP-conjugated TUBA/alpha-Tubulin (Cell Signaling Technology, 9099), TBK1 (Abcam, ab40676), HRP-conjugated mouse IgM (Abcam, ab97230), ACTB/beta-Actin (Abcam, ab16039), poly-ubiquitin (FK1, Enzo Life Science, BML-PW8805), PSMB5 (Enzo Life Science, BML-PW8895), TARDBP (Proteintech, 10782-2-AP), GFP (Clontech, 632380), SQSTM1 (Sigma, P0067), poly-ubiquitin (FK2, Calbiochem/Merck-Millipore, 04–263), LMNA/Lamin A/C (Calbiochem/Merck-Millipore, 05–714), p-SQSTM1 (S403) (GeneTex, GTX128171), TurboGFP (Origene, TA150041), HRP-conjugated anti-rabbit IgG (Santa Cruz Biotechnology, sc-2004), and HRP-conjugated mouse IgG (Santa Cruz Biotechnology, sc-2005). The following antibodies were used for immunocytochemistry: Cleaved CASP3 (cCASP3, Cell Signaling Technology, 9661), poly-ubiquitin (FK1, Enzo Life Science, BML-PW8805), DDK (Origene, TA50011), p-SQSTM1 (S403) (GeneTex, GTX128171), and SQSTM1 (Sigma, P0067). The following antibodies were used for immunohistochemistry: ELAV (DSHB, RAT-ELAV-7) and poly-ubiquitin (FK1, Enzo Life Science, BML-PW8805).
Cell lines
The Neuro-2a (N2a) mouse neuroblastoma cell line was maintained in Dulbecco’s modified Eagle’s medium (DMEM; Gibco, 11995–065) supplemented with 10% heat-inactivated fetal bovine serum (FBS; Gibco, 16000–044) and 50 μg/ml penicillin-streptomycin (Gibco, 15140–122). Primary cultures of cerebral cortical neurons were prepared from 16 d embryonic mice as described previously [Citation71,Citation72]. Briefly, mouse embryos were decapitated, and the brains were rapidly removed and placed in a culture dish containing HBSS (Gibco, 14170–112). Cortices were isolated, transferred to a conical tube and washed twice in HBSS. Cortical tissues were enzymatically digested by 20 U/ml papain (Worthington Biochemical Corporation, LK003176) and 0.005% DNase I (Worthington Biochemical Corporation, LK003170) for 30 min at 37°C. The tissues were mechanically dissociated by gently pipetting up and down. The cortical cells were centrifuged at 800 × g for 10 min at room temperature. Then, the dissociated cells were seeded onto plates coated with poly-D-lysine (Sigma-Aldrich, P7405) in neurobasal media containing 2 mM glutamine (Gibco, 25030–081), N2 supplement (Gibco, 17502–048), B27 supplement (Gibco, 17504–044), and penicillin-streptomycin (Gibco, 15140–122). Culture media were changed initially after 5 d and then changed every 3 d. All experiments with primary neurons were performed at DIV 14–21 d.
Transfection
N2a cells were plated in 6 well plate and transfected with 4 µg Gfp (pCMV6-AC-Gfp, Origene Technologies, PS100010), human TARDBP (pCMV6-AC-TARDBP-Gfp, Origene Technologies, RG210639), MYC-DDK (pCMV6-AC-MYC-DDK, Origene Technologies, PS100001), Tbk1-MYC-DDK (pCMV6-AC-Tbk1-MYC-DDK, Origene Technologies, MR223008), or Ptk2-GFP (pGFP-Ptk2, Addgene, 50515) cDNA by using Lipofectamine 3000 reagent (Invitrogen, L3000-015) according to the manufacturer’s guide. Empty pCMV6-AC-Gfp, pCMV6-MYC-DDK, or pGFP vector were generated from original vectors and used as a negative control. For siRNA transfection, cells were transfected with control siRNA (Santa Cruz Biotechnology, sc-37007 and Dharmacon; D-001810-10), mouse Sqstm1 siRNA (Santa Cruz Biotechnology, sc-29828), mouse Ptk2 siRNA (Santa Cruz Biotechnology, sc-35353), or mouse Tbk1 siRNA (Santa Cruz Biotechnology, sc-39059) by using Lipofectamine RNAiMAX reagent (Invitrogen, 13778–150). At 48 h post-transfection, knockdown of target proteins was confirmed by immunoblot analysis.
Immunostaining
For immunocytochemistry, cells were fixed in 4% or 8% paraformaldehyde in PBS (Gibco, 70011–044) for 30 min at room temperature. The cells were then washed three times with PBS and permeabilized in PBS-T (0.3% Triton X-100 (Sigma, T8787)) for 15 min at room temperature. After blocking with 5% BSA (Sigma, A3509) in PBS-T for 1h. The primary antibodies were incubated with 1% BSA in PBS-T for overnight at 4°C. The cells were then washed three times with PBS and incubated with Alexa Fluor-conjugated secondary antibody for 1 h at room temperature. Alexa Fluor 594-conjugated rabbit IgG (Jackson Immuno Research, 111-585-144), Alexa Fluor 647-conjugated mouse IgG (Jackson Immuno Research, 115-605-146), and Alexa Fluor 594-conjugated mouse IgM (Jackson Immuno Research, 115-587-020) were used as secondary antibodies as indicated. Then, samples were mounted and observed with a fluorescence microscope (Nikon). Photomicrographs from three randomly chosen fields were obtained and the number of poly-ubiquitin+, cCASP3+, p-SQSTM1 (S403)+, or SQSTM1+ cells was counted in the GFP+ cells. For immunohistochemistry, adult flies were dissected in PBS and fixed in 4% paraformaldehyde in PBS for 30 min at room temperature. The brains were then washed six times with PBS and pre-incubated in PBS-T for 15 min at room temperature. After blocking with 5% normal goat serum (Abcam, ab748) in PBS-T for overnight at 4°C. The primary antibodies were incubated with 5% normal goat serum in PBS-T for 2 d at 4°C. The brains were then washed six times with PBS and incubated with Alexa-conjugated secondary antibody for 2 d at 4°C. Alexa Fluor 488-conjugated rat IgG (Jackson Immuno Research, 112-545-167) and Alexa Fluor 594-conjugated mouse IgM (Jackson Immuno Research, 115-587-020) were used as secondary antibodies as indicated. The samples were mounted and observed with fluorescence confocal microscope (Leica). Photomicrographs from three randomly chosen fields were obtained and the number of poly-ubiquitin+ was counted.
Proteasome activity assay
N2a cells were transfected with Gfp or TARDBP-Gfp for 3 d and then the cells expressing GFP were sorted using FACS. Cells harvested were incubated in Lysis Buffer (Cell Signaling Technology, 9803). The lysates were centrifuged at 13,000 × g for 30 min at 4°C. Total protein (100 μg) was used for proteasome purification by using 26S proteasome purification kit according to the manufacturer’s guide (Enzo Life Science, BML-PW1075). The lysates were incubated with matrices for overnight at 4ºC. The 20S proteasome activity was measured using the 20S proteasome activity Kit (Promega, G8531) according to the manufacturer’s guide. Briefly, 20 μg of purified lysates was incubated with inhibitor and enzyme matrix for 10 min at room temperature. After adding 10 µl of fluorescently labeled substrate (trypsin-like; Boc-LSTR-AMC, Bachem and chymotrypsin-like; Suc-LLVY-AMC; caspase-like; Z-nLPnLD-AMC) to each well, the fluorescence signals were measured at 10 min intervals for 1 h using a FlexStation 3 microplate reader (set to 37ºC, Molecular Devices) at an excitation wavelength of 360 nm and an emission wavelength of 460 nm. For immunoblotting, purified proteasome and original lysate sample were mixed with 5X SDS-PAGE gel loading buffer and then boiled at 95°C for 5 min.
Preparation of soluble and insoluble cell extracts
Cells were homogenized in RIPA buffer (Thermo Fisher Scientific, SH252366) with protease and phosphatase inhibitor cocktails (Roche, 11836153001, 04906837001). Soluble and insoluble fractions in 1% Triton X-100 were obtained by centrifugation at 100,000 × g for 30 min at 4°C. Supernatants containing the soluble factions were harvested and the pellets for insoluble fractions were solubilized in a 2% SDS detergent Cell Lysis buffer (Cell signaling Technology, 9803). After sonication, the cell lysates were mixed with 4x Bolt LDS Sample buffer (Invitrogen, B0007) and 10x Bolt Sample Reducing Agent buffer (Invitrogen, B0009) and then boiled at 95°C for 5 min.
Nuclear and cytoplasmic extraction
The Gfp or TARDBP-Gfp-transfected N2a cells were fractionated using NE-PER nuclear and cytosolic extraction reagents (Thermo Fisher Scientific, 78833). Nuclear and cytoplasmic fractions in ice-cold CER I and CER II buffer were obtained by centrifugation at 16,000 × g for 5 min at 4°C. Supernatants containing the cytoplasmic extract were harvested, and the pellets were solubilized in ice-cold NER buffer. After vortexing, the extracts were centrifuged at 16,000 × g for 10 min at 4°C. Supernatants containing the nuclear extract were harvested. The extracts were mixed with 4x Bolt LDS sample buffer and 10x Bolt Sample Reducing Agent buffer and then boiled at 95°C for 5 min.
Co-immunoprecipitation
The Tbk1-MYC-DDK or Ptk2-GFP co-transfected N2a cells were co-immunoprecipitated using crosslink immunoprecipitation kit (Thermo Fisher Scientific, 26147) according to the manufacturer’s guide. The lysates in IP lysis buffer (Thermo Fisher Scientific, 26147) were obtained by centrifugation at 13,000 × g for 10 min at 4°C. 1 mg of total protein was used for immunoprecipitation. Lysates were immunoprecipitated with the antibody-coupled resin indicated at 4°C overnight. Immunoprecipitated proteins were eluted with 5x sample buffer and analyzed by immunoblotting. Ten percent of each lysates was analyzed as the input.
Immunoblot analysis
For total protein extraction, either cells or 20 adult fly heads were homogenized in Cell Lysis buffer (Cell signaling Technology, 9803) with protease and phosphatase inhibitor cocktails. The protein concentration of the cell lysates was determined by BCA protein assay (Thermo Fisher Scientific, 23225). Next, the protein extracts were mixed with 4x Bolt LDS sample buffer (Invitrogen) and 10x Bolt Sample Reducing Agent buffer (Invitrogen) and then boiled at 95°C for 5 min. An equal amount of proteins from each sample were separated on Bolt 4–12% Bis-Tris gels (Invitrogen, NW04120BOX) or NuPAGE 3–8% Tris-Acetate gels (Invitrogen, EA0378BOX) and transferred to a polyvinylidene difluoride (PVDF, Invitrogen, LC2005) membrane. After blocking membranes with 5% skim milk (BD Difco, 232100) in TBS with 0.025% Tween 20 (Sigma, P2287), blots were probed with antibodies as indicated and detected with an ECL prime kit (GE healthcare, RPN2232). Samples from three independent experiments were used and the relative expression levels were determined using a Fusion-FX (Viber Lourmat).
Cytotoxicity assay
N2a cells (5 × 10⁵ cells/ml) or primary cortical neuron cells (10 × 105 cells/ml) were grown in 96 well plates and treated with MG132 or inhibitors as indicated for 24 h. DMSO was used as a negative control. To measure cytotoxicity, the Cell Counting Kit-8 (CCK-8, Enzo Life Science, ALX-850-039-KI02) was used according to the manufacturer’s guide. Briefly, 10 µl of CCK-8 reagent was added into each well and the plate was incubated at 37°C for 2 h. The absorbance at 450 nm was measured by using a microplate reader (Tecan). Cell viability was expressed as a percentage of control. All experiments were performed in triplicate.
Cyto-ID autophagy analysis
To detect autophagic vesicles, the Cyto-ID® Green Autophagy Kit (Enzo Life Science, ENZ-51031-K200) was used according to the manufacturer’s guide. Briefly, 1 µl of Cyto-ID dye was added into each well of a 24 well plate. Then, the plate was incubated at 37°C for 30 min. Cells were fixed in 4% paraformaldehyde in PBS for 30 min. All reagents were diluted in 1x Assay buffer with 2% FBS. The samples were mounted and observed with a microscope.
Stable transfection
N2a cells in 6 well plates were transfected with 4 µg of Sqstm1, Sqstm1S403A, or Sqstm1S403E plasmid by using Lipofectamine 3000 reagent (Invitrogen, L3000-015). An empty pCMV6-MYC-DDK vector was used as a negative control. Stable transfectants were selected in the presence of 800 µg/ml G418 (Gibco, 10131–027). The expression of transgenes was confirmed by immunoblot and immunocytochemistry analysis.
Quantitative RT-PCR
RNA was extracted from cells by using TRIzol plus RNA Purification Kit (Invitrogen, 12183–555) according to the manufacturer’s instructions. cDNA synthesis was performed at 37°C for 120 min with 100 ng of RNA using a High Capacity cDNA Reverse Transcription kit (Applied Biosystems, 4368814). Quantitative RT-PCR was performed using the one-step SYBR® PrimeScriptTM RT-PCR kit (Takara Bio Inc, RR420A) according to the manufacturer’s instructions, followed by detection using an Applied Biosystems 7500 Real-Time PCR system (Applied Biosystems). Gapdh was used as an internal control. The 2−ΔΔCt method was used to calculate relative changes in gene expression, as determined by real time PCR experiments [Citation73].
Fly strains
Drosophila stocks were maintained on standard cornmeal agar media at 24ºC unless otherwise noted. The UAS-ATXN2-32Q were described previously [Citation22]. UAS-CL1-GFP has been described previously [Citation39]. All other stocks were from The Bloomington stock centre.
Climbing and lifespan assays
Adult males (0 to 1-d-old) were separated and transferred into experimental vials containing fly media or paper mixed with or without RU-486 (in ethanol, 40 µg/ml) at a density of 20 (for lifespan) or 25 (for climbing assay) flies per vial (n > 100). The number of dead flies was scored daily, and flies were transferred to fresh media or paper every other day. Adult locomotor function was assessed by a previously described method [Citation74] with 125 flies per genotype per time point in all experiments. Experiments were repeated twice to assure consistent results.
Statistical analyses
Data were analyzed by Student’s t-test (Vassar Stats, www.vassarstats.net), one-way ANOVA, or two-way ANOVA test depending on comparison variables with post-hoc analysis as indicated (GraphPad Prism Software). Differences were considered significant when p < 0.05 and are indicated as follows: *p < 0.05; **p < 0.005; ***p < 0.001; n.s., not significant.
Supplemental Material
Download Zip (47.3 MB)Acknowledgments
This work was supported by the KBRI Research Program of the Ministry of Science, ICT & Future Planning (19-BR-02-03, 19-BR-02-04, and 19-BR-01-01); the DGIST R&D Program of the Ministry of Science, ICT and Future Planning (16-BD-0402) (S.B.L.); the Soonchunhyang University Research Fund; the Basic Science Research Program through the National Research Foundation of Korea (NRF), funded by the Ministry of Science, ICT & Future Planning (NRF-2017R1C1B2007941, NRF-2017R1C1B1008825); and the Korea Health Technology R&D Project through the Korea Health Industry Development Institute (KHIDI), funded by the Ministry of Health and Welfare, South Korea (grant number: H I14C1135, HI15C1928, HI18C1241). Confocal microscopy data were acquired in the Advanced Neural Imaging Center in KBRI.
Disclosure statement
No potential conflict of interest was reported by the authors.
Supplementary material
Supplemental data for this article can be accessed here.
Additional information
Funding
Related Research Data
References
- Al-Chalabi A, Jones A, Troakes C, et al. The genetics and neuropathology of amyotrophic lateral sclerosis. Acta Neuropathol. 2012;124:339–352.
- Cleveland DW, Rothstein JD. From Charcot to Lou Gehrig: deciphering selective motor neuron death in ALS. Nat Rev Neurosci. 2001;2:806–819.
- Costa J, Gomes C, de Carvalho M. Diagnosis, pathogenesis and therapeutic targets in amyotrophic lateral sclerosis. CNS Neurol Disord Drug Targets. 2010;9:764–778.
- Bhandari R, Kuhad A, Kuhad A. Edaravone: a new hope for deadly amyotrophic lateral sclerosis. Drugs Today (Barc). 2018;54:349–360.
- Scotter EL, Chen HJ, Shaw CE. TDP-43 proteinopathy and ALS: insights into disease mechanisms and therapeutic targets. Neurotherapeutics. 2015;12:352–363.
- Liscic RM, Grinberg LT, Zidar J, et al. ALS and FTLD: two faces of TDP-43 proteinopathy. Eur J Neurol. 2008;15:772–780.
- James BD, Wilson RS, Boyle PA, et al. TDP-43 stage, mixed pathologies, and clinical Alzheimer’s-type dementia. Brain. 2016;139:2983–2993.
- Josephs KA, Dickson DW, Tosakulwong N, et al. Rates of hippocampal atrophy and presence of post-mortem TDP-43 in patients with Alzheimer’s disease: a longitudinal retrospective study. Lancet Neurol. 2017;16:917–924.
- Buratti E. Functional significance of TDP-43 mutations in disease. Adv Genet. 2015;91:1–53.
- Meriggioli MN, Kordower JH. TDP-43 proteinopathy: aggregation and propagation in the pathogenesis of amyotrophic lateral sclerosis. Mov Disord. 2016;31:1139.
- Bendotti C, Marino M, Cheroni C, et al. Dysfunction of constitutive and inducible ubiquitin-proteasome system in amyotrophic lateral sclerosis: implication for protein aggregation and immune response. Prog Neurobiol. 2012;97:101–126.
- Neumann M, Sampathu DM, Kwong LK, et al. Ubiquitinated TDP-43 in frontotemporal lobar degeneration and amyotrophic lateral sclerosis. Science. 2006;314:130–133.
- Ross JM, Olson L, Coppotelli G. Mitochondrial and ubiquitin proteasome system dysfunction in ageing and disease: two sides of the same coin? Int J Mol Sci. 2015;16:19458–19476.
- Renton AE, Chio A, Traynor BJ. State of play in amyotrophic lateral sclerosis genetics. Nat Neurosci. 2014;17:17–23.
- Lee JK, Shin JH, Lee JE, et al. Role of autophagy in the pathogenesis of amyotrophic lateral sclerosis. Biochim Biophys Acta. 2015;1852:2517–2524.
- Casci I, Pandey UB. A fruitful endeavor: modeling ALS in the fruit fly. Brain Res. 2015;1607:47–74.
- Joyce PI, Fratta P, Fisher EM, et al. SOD1 and TDP-43 animal models of amyotrophic lateral sclerosis: recent advances in understanding disease toward the development of clinical treatments. Mamm Genome. 2011;22:420–448.
- Ross OA, Rutherford NJ, Baker M, et al. Ataxin-2 repeat-length variation and neurodegeneration. Hum Mol Genet. 2011;20:3207–3212.
- Elden AC, Kim HJ, Hart MP, et al. Ataxin-2 intermediate-length polyglutamine expansions are associated with increased risk for ALS. Nature. 2010;466:1069–1075.
- Hart MP, Gitler AD. ALS-associated ataxin 2 polyQ expansions enhance stress-induced caspase 3 activation and increase TDP-43 pathological modifications. J Neurosci. 2012;32:9133–9142.
- Nihei Y, Ito D, Suzuki N. Roles of ataxin-2 in pathological cascades mediated by TAR DNA-binding protein 43 (TDP-43) and Fused in Sarcoma (FUS). J Biol Chem. 2012;287:41310–41323.
- Kim HJ, Raphael AR, LaDow ES, et al. Therapeutic modulation of eIF2alpha phosphorylation rescues TDP-43 toxicity in amyotrophic lateral sclerosis disease models. Nat Genet. 2014;46:152–160.
- Armendariz BG, Masdeu Mdel M, Soriano E, et al. The diverse roles and multiple forms of focal adhesion kinase in brain. Eur J Neurosci. 2014;40:3573–3590.
- Hanks SK, Ryzhova L, Shin NY, et al. Focal adhesion kinase signaling activities and their implications in the control of cell survival and motility. Front Biosci. 2003;8:d982–96.
- de Oliveira GP, Alves CJ, Chadi G. Early gene expression changes in spinal cord from SOD1(G93A) amyotrophic lateral sclerosis animal model. Front Cell Neurosci. 2013;7:216.
- Maximino JR, de Oliveira GP, Alves CJ, et al. Deregulated expression of cytoskeleton related genes in the spinal cord and sciatic nerve of presymptomatic SOD1(G93A) amyotrophic lateral sclerosis mouse model. Front Cell Neurosci. 2014;8:148.
- Lee DH, Goldberg AL. Proteasome inhibitors: valuable new tools for cell biologists. Trends Cell Biol. 1998;8:397–403.
- Ederle H, Dormann D. TDP-43 and FUS en route from the nucleus to the cytoplasm. FEBS Lett. 2017;591:1489–1507.
- Guerrero EN, Wang H, Mitra J, et al. TDP-43/FUS in motor neuron disease: complexity and challenges. Prog Neurobiol. 2016;145–146:78–97.
- Shenouda M, Zhang AB, Weichert A, et al. Mechanisms associated with TDP-43 neurotoxicity in ALS/FTLD. Adv Neurobiol. 2018;20:239–263.
- Tanaka K. The proteasome: overview of structure and functions. Proc Jpn Acad Ser B Phys Biol Sci. 2009;85:12–36.
- Wang C, Wang X. The interplay between autophagy and the ubiquitin-proteasome system in cardiac proteotoxicity. Biochim Biophys Acta. 2015;1852:188–194.
- Slack-Davis JK, Martin KH, Tilghman RW, et al. Cellular characterization of a novel focal adhesion kinase inhibitor. J Biol Chem. 2007;282:14845–14852.
- Wilson E, Leszczynska K, Poulter NS, et al. RhoJ interacts with the GIT-PIX complex and regulates focal adhesion disassembly. J Cell Sci. 2014;127:3039–3051.
- Schaller MD, Hildebrand JD, Shannon JD, et al. Autophosphorylation of the focal adhesion kinase, pp125FAK, directs SH2-dependent binding of pp60src. Mol Cell Biol. 1994;14:1680–1688.
- Tsubuki S, Saito Y, Tomioka M, et al. Differential inhibition of calpain and proteasome activities by peptidyl aldehydes of di-leucine and tri-leucine. J Biochem. 1996;119:572–576.
- Yang H, Landis-Piwowar KR, Chen D, et al. Natural compounds with proteasome inhibitory activity for cancer prevention and treatment. Curr Protein Pept Sci. 2008;9:227–239.
- Bressenot A, Marchal S, Bezdetnaya L, et al. Assessment of apoptosis by immunohistochemistry to active caspase-3, active caspase-7, or cleaved PARP in monolayer cells and spheroid and subcutaneous xenografts of human carcinoma. J Histochem Cytochem. 2009;57:289–300.
- Pandey UB, Nie Z, Batlevi Y, et al. HDAC6 rescues neurodegeneration and provides an essential link between autophagy and the UPS. Nature. 2007;447:859–863.
- Korolchuk VI, Menzies FM, Rubinsztein DC. Mechanisms of cross-talk between the ubiquitin-proteasome and autophagy-lysosome systems. FEBS Lett. 2010;584:1393–1398.
- Lippai M, Low P. The role of the selective adaptor p62 and ubiquitin-like proteins in autophagy. Biomed Res Int. 2014;2014:832704.
- Demishtein A, Fraiberg M, Berko D, et al. SQSTM1/p62-mediated autophagy compensates for loss of proteasome polyubiquitin recruiting capacity. Autophagy. 2017;13:1697–1708.
- Liu WJ, Ye L, Huang WF, et al. p62 links the autophagy pathway and the ubiqutin-proteasome system upon ubiquitinated protein degradation. Cell Mol Biol Lett. 2016;21:29.
- Matsumoto G, Wada K, Okuno M, et al. Serine 403 phosphorylation of p62/SQSTM1 regulates selective autophagic clearance of ubiquitinated proteins. Mol Cell. 2011;44:279–289.
- Shacka JJ, Klocke BJ, Roth KA. Autophagy, bafilomycin and cell death: the “a-B-cs” of plecomacrolide-induced neuroprotection. Autophagy. 2006;2:228–230.
- Lim J, Lachenmayer ML, Wu S, et al. Proteotoxic stress induces phosphorylation of p62/SQSTM1 by ULK1 to regulate selective autophagic clearance of protein aggregates. PLoS Genet. 2015;11:e1004987.
- Pilli M, Arko-Mensah J, Ponpuak M, et al. TBK-1 promotes autophagy-mediated antimicrobial defense by controlling autophagosome maturation. Immunity. 2012;37:223–234.
- Tashiro Y, Urushitani M, Inoue H, et al. Motor neuron-specific disruption of proteasomes, but not autophagy, replicates amyotrophic lateral sclerosis. J Biol Chem. 2012;287:42984–42994.
- Chang L, Monteiro MJ. Defective proteasome delivery of polyubiquitinated proteins by ubiquilin-2 proteins containing ALS mutations. PloS One. 2015;10:e0130162.
- Watanabe T, Okeda Y, Yamano T, et al. An immunohistochemical study of ubiquitin in the skin of sporadic amyotrophic lateral sclerosis. J Neurol Sci. 2010;298:52–56.
- Maekawa S, Leigh PN, King A, et al. TDP-43 is consistently co-localized with ubiquitinated inclusions in sporadic and Guam amyotrophic lateral sclerosis but not in familial amyotrophic lateral sclerosis with and without SOD1 mutations. Neuropathology. 2009;29:672–683.
- Bjorkoy G, Lamark T, Brech A, et al. p62/SQSTM1 forms protein aggregates degraded by autophagy and has a protective effect on huntingtin-induced cell death. J Cell Biol. 2005;171:603–614.
- Pankiv S, Clausen TH, Lamark T, et al. p62/SQSTM1 binds directly to Atg8/LC3 to facilitate degradation of ubiquitinated protein aggregates by autophagy. J Biol Chem. 2007;282:24131–24145.
- Kageyama S, Sou YS, Uemura T, et al. Proteasome dysfunction activates autophagy and the Keap1-Nrf2 pathway. J Biol Chem. 2014;289:24944–24955.
- Milan E, Perini T, Resnati M, et al. A plastic SQSTM1/p62-dependent autophagic reserve maintains proteostasis and determines proteasome inhibitor susceptibility in multiple myeloma cells. Autophagy. 2015;11:1161–1178.
- Johansen T, Lamark T. Selective autophagy mediated by autophagic adapter proteins. Autophagy. 2011;7:279–296.
- Zhou J, Wang J, Cheng Y, et al. NBR1-mediated selective autophagy targets insoluble ubiquitinated protein aggregates in plant stress responses. PLoS Genet. 2013;9:e1003196.
- Lu K, Den Brave F, Jentsch S. Receptor oligomerization guides pathway choice between proteasomal and autophagic degradation. Nat Cell Biol. 2017;19:732–739.
- Teyssou E, Takeda T, Lebon V, et al. Mutations in SQSTM1 encoding p62 in amyotrophic lateral sclerosis: genetics and neuropathology. Acta Neuropathol. 2013;125:511–522.
- Le Ber I, Camuzat A, Guerreiro R, et al. SQSTM1 mutations in French patients with frontotemporal dementia or frontotemporal dementia with amyotrophic lateral sclerosis. JAMA Neurol. 2013;70:1403–1410.
- Shimizu H, Toyoshima Y, Shiga A, et al. Sporadic ALS with compound heterozygous mutations in the SQSTM1 gene. Acta Neuropathol. 2013;126:453–459.
- Rubino E, Rainero I, Chio A, et al. SQSTM1 mutations in frontotemporal lobar degeneration and amyotrophic lateral sclerosis. Neurology. 2012;79:1556–1562.
- Yang Y, Tang L, Zhang N, et al. Six SQSTM1 mutations in a Chinese amyotrophic lateral sclerosis cohort. Amyotroph Lateral Scler Frontotemporal Degener. 2015;16:378–384.
- Kurosawa M, Matsumoto G, Sumikura H, et al. Serine 403-phosphorylated p62/SQSTM1 immunoreactivity in inclusions of neurodegenerative diseases. Neurosci Res. 2016;103:64–70.
- Matsumoto G, Shimogori T, Hattori N, et al. TBK1 controls autophagosomal engulfment of polyubiquitinated mitochondria through p62/SQSTM1 phosphorylation. Hum Mol Genet. 2015;24:4429–4442.
- Cui R, Tuo M, Li P, et al. Association between TBK1 mutations and risk of amyotrophic lateral sclerosis/frontotemporal dementia spectrum: a meta-analysis. Neurol Sci. 2018;39:811–820.
- Markovinovic A, Cimbro R, Ljutic T, et al. Optineurin in amyotrophic lateral sclerosis: multifunctional adaptor protein at the crossroads of different neuroprotective mechanisms. Prog Neurobiol. 2017;154:1–20.
- Richter B, Sliter DA, Herhaus L, et al. Phosphorylation of OPTN by TBK1 enhances its binding to Ub chains and promotes selective autophagy of damaged mitochondria. Proc Natl Acad Sci U S A. 2016;113:4039–4044.
- Sundaramoorthy V, Walker AK, Tan V, et al. Defects in optineurin- and myosin VI-mediated cellular trafficking in amyotrophic lateral sclerosis. Hum Mol Genet. 2017;26:3452.
- Bansal M, Moharir SC, Sailasree SP, et al. Optineurin promotes autophagosome formation by recruiting the autophagy-related Atg12-5-16L1 complex to phagophores containing the Wipi2 protein. J Biol Chem. 2018;293:132–147.
- Enokido Y, Akaneya Y, Niinobe M, et al. Basic fibroblast growth factor rescues CNS neurons from cell death caused by high oxygen atmosphere in culture. Brain Res. 1992;599:261–271.
- Araki W, Yuasa K, Takeda S, et al. Overexpression of presenilin-2 enhances apoptotic death of cultured cortical neurons. Ann N Y Acad Sci. 2000;920:241–244.
- Livak KJ, Schmittgen TD. Analysis of relative gene expression data using real-time quantitative PCR and the 2(-Delta Delta C(T)) Method. Methods. 2001;25:402–408.
- Feany MB, Bender WW. A drosophila model of Parkinson’s disease. Nature. 2000;404:394–398.