
ABSTRACT
The identification of the mechanisms predisposing to stroke may improve its preventive and therapeutic strategies in patients with essential hypertension. The role of macroautophagy/autophagy in the development of hypertension-related stroke needs to be clarified. We hypothesized that a defective autophagy may favor hypertension-related spontaneous stroke by promoting mitochondrial dysfunction. We studied autophagy in the stroke-prone spontaneously hypertensive (SHRSP) rat, which represents a clinically relevant model of stroke associated with high blood pressure. We assessed autophagy, mitophagy and NAD+:NADH levels in brains of SHRSP and stroke-resistant SHR fed with high salt diet. Vascular smooth muscle cells silenced for the mitochondrial complex I subunit Ndufc2 gene (NADH:ubiquinone oxidoreductase subunit C2) and cerebral endothelial cells isolated from SHRSP were also used to assess autophagy/mitophagy and mitochondrial function in response to high salt levels. We found a reduction of autophagy in brains of high salt-fed SHRSP. Autophagy impairment was associated with NDUFC2 downregulation, mitochondrial dysfunction and NAD+ depletion. Restoration of NAD+ levels by nicotinamide administration reactivated autophagy and reduced stroke development in SHRSP. A selective reactivation of autophagy/mitophagy by Tat-Beclin 1 also reduced stroke occurrence, restored autophagy/mitophagy and improved mitochondrial function. Endothelial progenitor cells (EPCs) from subjects homozygous for the thymine allele variant at NDUFC2/rs11237379, which is associated with NDUFC2 deficiency and increased stroke risk, displayed an impairment of autophagy and increased senescence in response to high salt levels. EPC senescence was rescued by Tat-Beclin 1. Pharmacological activation of autophagy may represent a novel therapeutic strategy to reduce stroke occurrence in hypertension.
Abbreviations
10 VSMCs: aortic vascular smooth muscle cells; COX4I1/COX IV: cytochrome c oxidase subunit 4I1; ECs: endothelial cells; EPCs: endothelial progenitor cells; JD: Japanese-style diet; MAP1LC3/LC3: microtubule-associated protein 1 light chain 3; NAD: nicotinamide adenine dinucleotide; NDUFC2: NADH:ubiquinone oxidoreductase subunit C2; NMN: nicotinamide mononucleotide; RD: regular diet; SHRSP: stroke-prone spontaneously hypertensive rat; SHRSR: stroke-resistant spontaneously hypertensive rat.
Introduction
Stroke is a leading cause of mortality and disability [Citation1], with a multifactorial pathogenesis including hypertension, genetics and lifestyle. To date there are no efficacious treatments for this disease [Citation2,Citation3]. Moreover, the molecular mechanisms responsible for stroke predisposition are not yet fully understood. We hypothesized that an impairment of macroautophagy/autophagy may favor the spontaneous onset of stroke associated with high blood pressure levels. Autophagy is an evolutionarily conserved mechanism devoted to the removal of cytoplasmic elements, such as damaged organelles and misfolded proteins [Citation4,Citation5]. Mitophagy is the selective form of autophagy devoted to the clearance of damaged mitochondria, ensuring mitochondrial quality control [Citation6]. Autophagy is usually activated in response to stress to remove dysfunctional mitochondria, which are then substituted with newly formed healthy ones. An impairment of autophagy leads to the lack of a proper mitochondrial turnover with the resulting development of mitochondrial dysfunction. The latter is a major pathophysiological substrate underlying the development of cardiovascular diseases, including stroke [Citation7]. Mitochondrial dysfunction causes energy depletion, oxidative stress and inflammation, which are all major determinants of brain ischemic injury. Therefore, autophagy inhibition would favor mitochondrial dysfunction and increase the susceptibility to stroke in the presence of risk factors. The exact role of autophagy in the pathogenesis of stroke remains unsolved.
We tested the association between autophagy impairment and spontaneous stroke development in the stroke-prone spontaneously hypertensive rat (SHRSP), which represents a suitable model for the study of human stroke. This rat model develops spontaneous stroke, with an incidence of 100% after 7 weeks of high sodium/low potassium diet (Japanese-style diet, JD) [Citation8–Citation10]. The occurrence of stroke is preceded by the development of mitochondrial dysfunction, oxidative stress and inflammation in brains and cerebral vasculature, which finally leads to vascular arteriosclerosis and hyalinosis, lacunar infarction, brain edema and stroke. We previously found that a quantitative trait locus for stroke, named STR1, contributes to 20% of stroke occurrence in SHRSP, independently of blood pressure levels [Citation8,Citation9]. The expression of Ndufc2 gene (NADH:ubiquinone oxidoreductase subunit C2), which encodes a subunit of mitochondrial complex I and maps nearby the lod score peak within STR1, is significantly downregulated in the brains of SHRSP in response to high salt feeding. Systemic Ndufc2 gene deletion in stroke-resistant spontaneously hypertensive rat (SHRSR), which do not develop spontaneous stroke even after JD, is sufficient to make this strain susceptible to stroke, with a 40% stroke occurrence in response to high salt feeding [Citation11]. Overall, these data suggest that NDUFC2 downregulation may significantly contribute to the development of stroke in high salt-fed SHRSP. In addition, a reduction of NDUFC2 gene expression, related to a NDUFC2 exon 1 variant (cytosine substitution by thymine at rs11237379), was found to associate with increased risk of juvenile ischemic stroke in human subjects [Citation11]. However, the involvement of autophagy in the interplay among high salt feeding, hypertension, NDUFC2 downregulation, mitochondrial dysfunction and stroke is unclear.
The aim of this study was to evaluate the role of autophagy in the development of stroke in SHRSP.
Results
We firstly assessed autophagy in brains of SHRSP fed with high salt diet for 4 weeks (). We found a decrease of LC3-II, a marker of autophagosome accumulation, and an increase of SQSTM1/p62 (sequestosome 1), a protein degraded by autophagy in high salt-fed SHRSP, as compared to animals fed with RD (-). This indicates that autophagy is downregulated during a high salt dietary regimen. In contrast, LC3-II and SQSTM1 did not change in SHRSR, which are resistant to stroke even when fed with high salt diet (-). Even after chloroquine treatment, LC3-II remained lower in high salt-fed SHRSP, confirming a reduction of autophagy (,). Both COX4I1/COX IV (cytochrome c oxidase subunit 4I1) and mitochondrial DNA (mtDNA) content were increased in the brains of high salt-fed SHRSP as compared to RD (-). COX4I1 and mtDNA represent two markers for mitochondrial mass level, which are inversely related with mitophagy [Citation12,Citation13]. Therefore, the increase of COX4I1 and mtDNA suggests that mitochondria accumulate inside the cells, consistently with an impairment of mitophagic digestion [Citation12,Citation13]. In order to exclude the involvement of mitochondrial biogenesis as a potential mechanism responsible for the increase of mitochondrial mass, we evaluated the transcript levels of Ppargc1a (peroxisome proliferator-activated receptor gamma coactivator 1-alpha), a master inducer of mitochondrial biogenesis, in brains of SHRSP. We did not observe any difference between JD- and RD-fed animals (Figure S1), suggesting that increased mitochondrial biogenesis is not responsible for the increased mitochondrial mass in SHRSP in response to high salt diet. Overall, our data indicate that SHRSP are unable to activate autophagy/mitophagy in the brain in response to high salt diet.
Figure 1. Autophagy and mitophagy were downregulated in brains of high salt-fed SHRSP. (A-C) Representative western blots for LC3 and SQSTM1 and corresponding densitometric analyses in SHRSP and SHRSR fed with either regular diet (RD) or high salt Japanese style diet (JD) for 4 weeks (n = 6 for each group). (D-E) Autophagic flux in SHRSP fed with either RD or JD for 4 weeks. At the end of treatment, a single administration of chloroquine (Chl) was performed; a representative western blot for LC3 is shown (n = 3). (F-H) Analysis of mitophagy in SHRSP fed with either RD or JD for 4 weeks (n = 6 for each group); a representative western blot for COX4I1 with densitometric analysis (F-G) and mitochondrial DNA content (H) are shown (n = 6). Results are presented as mean values ± SEM; *p < 0.05 **p < 0.01 for the indicated comparisons.
Next, in order to assess if autophagy impairment is strictly correlated with the NDUFC2 downregulation observed in SHRSP brains in response to JD, we evaluated autophagy and autophagic flux in A10 vascular smooth muscle cells (VSMCs) silenced for Ndufc2. Ndufc2-silenced cells displayed decreased levels of LC3-II, both at baseline and when exposed to high salt medium, together with increased levels of SQSTM1 (-). We used a VSMC line to test the effects of Ndufc2 knockdown since VSMC abnormalities are involved in the development of vascular remodeling associated with stroke development.
Figure 2. Nicotinamide mononucleotide (NMN) reactivated autophagy in Ndufc2-silenced A10 cells. (A-C) Representative western blots of LC3 and SQSTM1 with densitometric analyses in Ndufc2-silenced (siRNA) A10 cells treated with sodium chloride (NaCl) (n = 4). (D) NAD+:NADH ratio in cells with Ndufc2 silencing, treated or not with NMN (n = 3–7). (E-F) Representative western blot of LC3 and corresponding densitometric analysis in Ndufc2-depleted A10 cells treated with NaCl and exposed to NMN (n = 3). (G-H) Representative western blot of COX4I1 and corresponding densitometric analysis in Ndufc2-depleted A10 cells treated with NaCl and exposed to NMN (n = 3). (I) Mitochondrial DNA content (mtDNA) in Ndufc2-silenced cells exposed to NaCl and treated with NMN (n = 4). CTR indicates non-silenced and untreated cells. Results are presented as mean values ± SEM; *p < 0.05 **p < 0.01 ***p < 0.001 for the indicated comparisons.
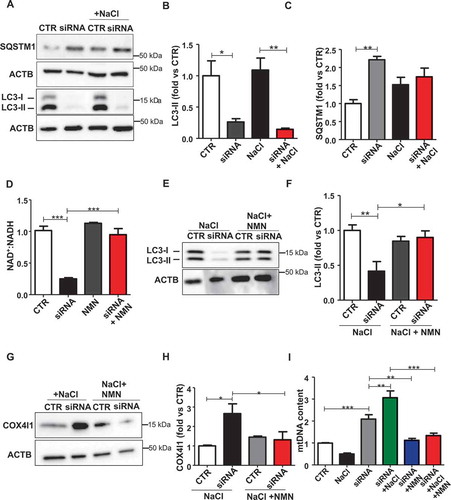
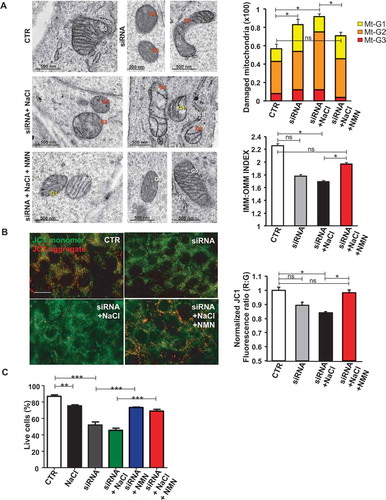
Mitochondrial complex I maintains the cellular redox status ensuring the balance between the oxidized form of nicotinamide adenine nucleotide (NAD+) and its reduced form (NADH). NAD+ is a coenzyme that participates in the electron transport chain reactions, in ATP synthesis and it also acts as a substrate for several NAD+-consuming enzymes involved in cellular metabolism and in several cell signaling mechanisms [Citation14]. A decline of NAD+ has been shown to associate with several pathological conditions [Citation15,Citation16], whereas NAD+ supplementation was reported to stimulate autophagy [Citation17]. Therefore, we investigated the association of reduced NAD+:NADH ratio with autophagy downregulation in Ndufc2-silenced cells and in SHRSP. We found a decrease of NAD+:NADH ratio both in Ndufc2-silenced cells (Figure S2A) and in SHRSP fed with high salt diet (Figure S2B). Nicotinamide mononucleotide (NMN) treatment was able to restore NAD+ levels in Ndufc2-silenced A10 cells (). In addition, it stimulated autophagy in A10 cells with Ndufc2 knockdown cultured in high salt conditions (,). Then, we demonstrated that NMN was able to restore mitophagy in cells with Ndufc2 downregulation. We found an increase in mitochondrial mass, as assessed by COX4I1 expression and mtDNA levels, in both unstressed and stressed Ndufc2-silenced cells (-, S2C and S2D), which was rescued by NMN treatment (-). MitoTracker signal, which directly correlates with the number of mitochondria, was also accumulated in A10 cells with Ndufc2 depletion with respect to control cells in response to high salt conditions, and this accumulation was reversed by NMN treatment (Figure S2E). Mitochondrial ultrastructural analyses revealed an overall damage and a loss of cristae in Ndufc2-silenced cells in response to NaCl exposure. NMN treatment counteracted the mitochondrial damage (). Similarly, fluorescence microscopy analysis of mitochondrial membrane potential (MMP) levels showed a clear and significant red to green color shift in A10 cells with Ndufc2 knockdown in response to high salt stress. These data reflect a loss of MMP. Conversely, NMN treatment rescued this phenomenon (). NMN also rescued cell death induced by loss of NDUFC2 and high salt exposure in vitro () Overall, these data show that NMN-induced mitophagy is associated with beneficial effects on mitochondrial function.
Figure 3. NMN improved mitochondrial function and cell viability in vitro. (A) Evaluation of ultrastructural damage in mitochondria from A10 cells with Ndufc2 knockdown; representative micrographs of mitochondria (left) and graphical representation of the ultrastructural damage in either untreated or treated A10 cells (n = 3). Legend: Nu, nucleus; NM, nuclear membrane, PM, plasma membrane; rER, rough endoplasmic reticulum; Gx, grade of mitochondrial (Mt) damage; IMM, inner mitochondrial membrane; OMM, outer mitochondrial membrane. (B) Fluorescence microscope analysis of mitochondrial membrane potential (ΔΨm) levels through JC1 dye (n = 3); representative images (left) and corresponding quantification (right) are shown. (C) FACS analysis in A10 cells with Ndufc2 knockdown treated with NaCl without or with NMN (n = 3); CTR indicates non-silenced and untreated cells. Results are presented as mean values ± SEM; *p < 0.05 **p < 0.01 ***p < 0.001; ns, not significant for the indicated comparisons.
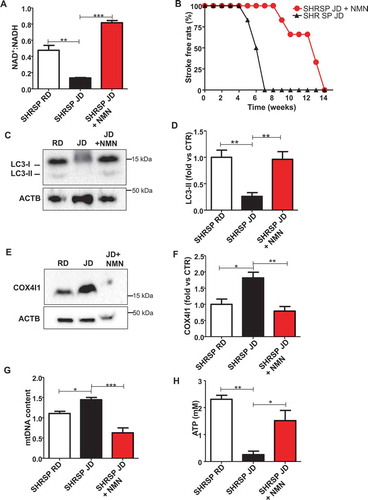
Next, we tested the impact of NMN supplementation in vivo. We found that NMN restored brain NAD+ levels and strongly blunted stroke occurrence in high salt-fed SHRSP (,). Notably, more than 50% of animals receiving NMN survived from stroke until the 12th week as compared to SHRSP fed with high salt diet alone. The protection from stroke occurrence was associated with the restoration of autophagic process in brains of JD-fed SHRSP (,). In addition, NMN decreased mitochondrial mass (-), suggesting mitophagy activation, and improved mitochondrial function, as assessed by ATP production ().
Figure 4. Restoration of NAD+:NADH through NMN increased stroke-free survival in JD-fed SHRSP and reactivated autophagy. (A) NAD+:NADH ratio in brains of SHRSP fed with RD, JD and JD plus NMN (n = 3 for each group). (B) Stroke occurrence in JD-fed SHRSP with (n = 6) or without (n = 6) NMN; the comparison was significant p < 0.001. (C-D) Representative western blot of LC3 and corresponding densitometric analysis in SHRSP fed for three weeks with RD, JD and JD plus NMN (n = 5 for each group). (E-F) Representative western blot of COX4I1 and corresponding densitometric analysis in brains of SHRSP fed for three weeks with RD, JD, JD plus NMN (n = 3 for each group). (G) mtDNA content in brains of SHRSP fed for three weeks with RD (n = 3), JD (n = 4), JD plus NMN (n = 3). (H) Mitochondrial ATP levels in brains of SHRSP fed for 3 weeks with RD, JD and JD plus NMN (n = 3 for each group). Results are presented as mean values ± SEM; *p < 0.05 **p < 0.01 ***p < 0.001 for the indicated comparisons.
Renal damage, which always precedes stroke in high salt-fed SHRSP [Citation18–Citation20], was also decreased in the NMN group, as assessed by proteinuria levels (Figure S3 and Table S1). No differences in body weight were observed among the groups (Table S1). The protection from stroke occurrence conferred by NMN could be in part because of an antihypertensive effect, since we observed a significant reduction of SBP levels at 4th and 6th weeks of dietary regimen (Table S1). These data indicate that NMN rescues autophagy and mitophagy both in vivo and in vitro.
In order to define the specific role of autophagy inhibition in the development of stroke in SHRSP, we reactivated autophagy by means of Tat-Beclin 1 treatment and tested its effects on stroke survival in high salt-fed SHRSP. Tat-Beclin 1 is a synthetic peptide and a potent autophagy and mitophagy inducer both in vitro and in vivo [Citation21]. We showed that Tat-Beclin 1 significantly delayed the onset of stroke () along with a reduction of renal damage ( and Table S2), without affecting body weight of animals (Table S2). Interestingly, Tat-Beclin 1 administration did not significantly affect SBP levels (Table S2). These data demonstrate that a specific reactivation of autophagy plays a contributory role in improving stroke survival independent of blood pressure levels.
Figure 5. Reactivation of autophagy and mitophagy through Tat-Beclin 1 decreased stroke occurrence and renal damage in JD-fed SHRSP. (A) Stroke occurrence in JD-fed SHRSP with (n = 6) or without (n = 6) Tat-Beclin 1 (TAT-BEC); the comparison was significant, p < 0.001. (B) Proteinuria levels in JD-fed SHRSP without or with TAT-BEC. (C-D) Representative western blot of LC3 and corresponding densitometric analysis in brains of SHRSP fed for three weeks with RD, JD, JD plus Tat-Beclin 1 (TAT-BEC) (n = 4). (E-F) Representative western blot of COX4I1 and corresponding densitometric analysis in brains of SHRSP fed for three weeks with RD, JD, JD plus Tat-Beclin 1 (n = 4). (G) Mitochondrial DNA content in brains of SHRSP fed for three weeks with RD (n = 4), JD (n = 6), JD plus Tat-Beclin 1 (n = 4). Results are presented as mean values ± SEM; *p < 0.05 **p < 0.01 ***p < 0.001 for the indicated comparisons.
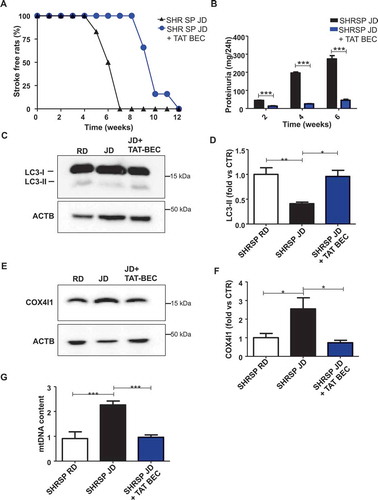
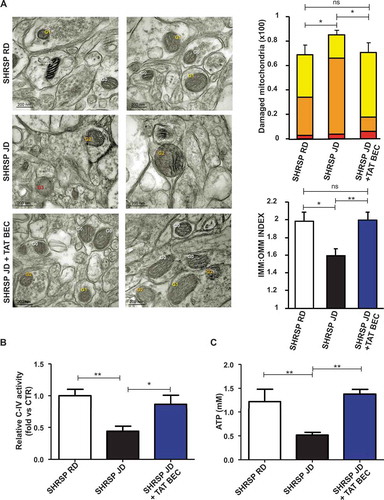
We observed that Tat-Beclin 1 administration restored autophagy levels (,) and mitochondrial mass (-) in the whole brain of animals treated with Tat-Beclin 1, as compared to SHRSP fed with JD alone. Notably, Tat-Beclin 1 also rescued mitochondrial dysfunction (). Mitochondrial ultrastructural analyses revealed an overall damage and a loss of cristae in brain tissue from SHRSP in response to high salt diet () which was counteracted by Tat-Beclin 1. Moreover, Tat-Beclin 1 also restored brain mitochondrial complex IV activity and mitochondrial ATP levels close to baseline (,).
Figure 6. Tat-Beclin 1 rescued mitochondrial ultrastructural damage and function in brains of JD-fed SHRSP. (A) Evaluation of ultrastructural damage in mitochondria from SHRSP brain tissue; representative micrographs of mitochondria (left) and graphical representation of the ultrastructural damage (n = 4 for each group). Legend: Gx, grade of mitochondrial (Mt) damage; IMM, inner mitochondrial membrane; OMM, outer mitochondrial membrane. Student T test: *p < 0.05 **p < 0.01; ns, not significant. (B-C) Evaluation of mitochondrial function in brains of SHRSP fed with RD (n = 4), JD (n = 6) and JD plus Tat-Beclin 1 (n = 4) (TAT-BEC): complex IV activity (B) and mitochondrial ATP levels (C). Results are presented as mean values ± SEM; *p < 0.05 **p < 0.01 for the indicated comparisons.
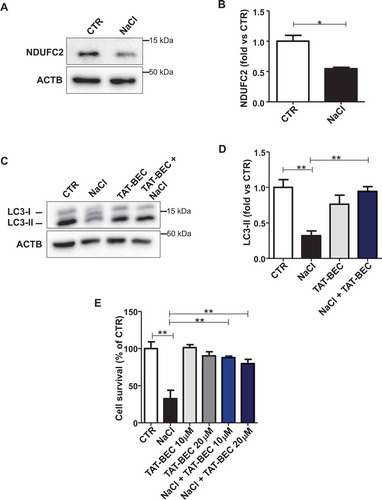
Vascular damage underlies the development of stroke in human subjects and SHRSP. We investigated if autophagy is also impaired in endothelial cells (ECs) of SHRSP in a manner comparable to that observed in the whole brain. Therefore, we isolated cerebral endothelial cells from SHRSP brains. First, a reduction of NDUFC2 after NaCl exposure was observed in these cells (,). More importantly, LC3-II was also significantly decreased under high salt exposure (,). Tat-Beclin 1 supplementation rescued autophagy and cell survival in SHRSP-derived primary endothelial cells treated with NaCl (-), suggesting a potential role of endothelial autophagy in the increased stroke susceptibility.
Figure 7. Reactivation of autophagy increased cell survival in primary SHRSP cerebral ECs. (A-B) Representative western blot of NDUFC2 with corresponding densitometric analysis in ECs isolated from SHRSP exposed to NaCl is shown (n = 3). (C-D) Representative western blot of LC3 with corresponding densitometric analysis in ECs isolated from SHRSP exposed to NaCl either in the absence or in the presence of Tat-Beclin 1 (TAT-BEC) pre-treatment for 5 h (n = 3). (E) Cell survival in ECs isolated from SHRSP exposed to NaCl, either in the absence or in the presence of TAT-BEC pre-treatment for 5 h. CTR indicates untreated cells. Results are presented as mean values ± SEM; *p < 0.05, **p < 0.01 for the indicated comparisons.
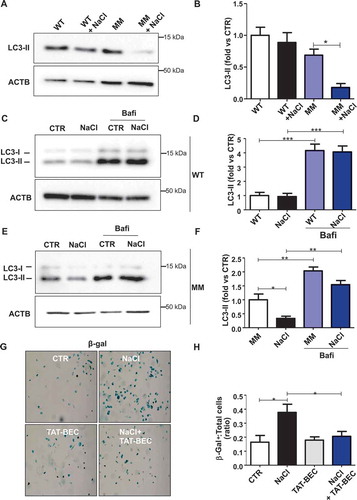
Finally, in order to translate our findings to humans, we assessed the levels of autophagy in endothelial progenitor cells (EPCs) derived from subjects carrying (MM) or not (WT) the T allele variant at NDUFC2/rs11237379, which is associated with reduced NDUFC2 expression and increased incidence of juvenile ischemic stroke [Citation11]. When exposed to high salt medium, WT EPCs did not show autophagy abnormalities in response to high salt stress (-). In contrast, EPCs of MM showed a significant decrease of autophagy in response to NaCl treatment, as indicated by reduced LC3-II levels (,), and a similar, but not significant, trend toward LC3-II reduction could also be observed in the presence of bafilomycin A1 treatment (,). Of interest, Tat-Beclin 1 administration reduced cell senescence in EPCs of MM exposed to NaCl (,).
Figure 8. Autophagy was downregulated in endothelial progenitor cells (EPCs) derived from human subjects carrying the rs11237379/NDUFC2 variant. (A-B) Representative western blots and corresponding densitometric analyses of LC3 in EPCs exposed to 20 mM sodium chloride (NaCl) for 72 h (n = 5). (C-F) Evaluation of autophagic flux in EPCs treated with NaCl and exposed to bafilomycin A1 (bafi) for the last 4 h of the treatment. Representative western blot and corresponding densitometric analyses of LC3 in EPCs of WT subjects are shown (C-D, n = 3). Representative western blot and corresponding densitometric analyses of LC3 in EPCs of MM subjects are also shown (E-F, n = 3). (G-H) Cell senescence experiments: representative images of β- galactosidase (β- gal)-positive EPCs of MM subjects exposed for 72 h to 20 mM NaCl either in the presence or in the absence of 1 µM Tat-Beclin 1 (G, TAT-BEC). Corresponding quantification of β-gal-positive cells (H). WT indicates subjects not carrying the variant; MM indicates subjects homozygous for the T rs11237379/NDUFC2 variant. Results are presented as mean values ± SEM. Statistical significance by ANOVA followed by Bonferroni’s posthoc test; *p < 0.05 **p < 0.001 ***p < 0.0001 for the indicated comparisons.
Discussion
Here we demonstrate that autophagy impairment is a critical mechanism favoring stroke occurrence. In a rat model of spontaneous stroke, which shares several features with the human disease, a defect of autophagy is responsible for brain injury. In fact, reactivation of autophagy by Tat-Beclin 1 significantly reduced stroke development in SHRSP independent of blood pressure levels. We also observed autophagy inhibition in cerebral SHRSP ECs, indicating that a defect of autophagy in ECs may play a major role in the promotion of stroke in this model.
Mechanistically, we found that autophagy inhibition in SHRSP is dependent on the dramatic drop of intracellular NAD+ levels in response to high salt dietary feeding. NMN treatment rescued NAD+ levels and autophagy, and delayed stroke development in these animals. Reduction of NAD+ was likely the result of NDUFC2 downregulation in brains of SHRSP. NDUFC2 inhibition reduces the activity of mitochondrial complex I, which impairs the oxidation of NADH to NAD+ that leads to the imbalance of the NAD+:NADH ratio. We found that Ndufc2 knockdown was sufficient to cause autophagy inhibition, NAD+ depletion and mitochondrial dysfunction in VSMCs in vitro. It will be interesting to evaluate in the future how NAD+ inhibition may lead to autophagy downregulation in SHRSP. A reduction of SIRT1 (sirtuin 1) activity and an activation of mechanistic target of rapamycin kinase complex 1 (MTORC1) signaling may be involved in the autophagy downregulation by NAD+ inhibition in SHRSP [Citation22].
Although other data reported detrimental effects of autophagy activation in the acute brain adaptation to experimental surgical models of ischemic stroke [Citation23,Citation24], our results clearly indicate that autophagy impairment may contribute to the development of cerebrovascular damage and stroke occurrence. Autophagy reactivation may favor the removal of dysfunctional mitochondria and limit the damage of endothelial and cerebral cells in response to high salt treatment, thereby delaying the onset of brain injury. In fact, we found a significant reduction of mitochondrial damage and an improvement of mitochondrial function in brains of animals receiving Tat-Beclin 1, in association with a reduced mitochondrial mass. Of note, it is known that autophagy attenuates cellular damage during stress also through the reduction of misfolded protein accumulation. Therefore, it is possible that this mechanism also plays a role in the prevention of stroke occurrence in SHRSP.
The SHRSP model has previously provided key information for a better comprehension of the human disease. In the current investigation, we found that human subjects carrying the T allele variant at NDUFC2/rs11237379, associated with increased risk of juvenile ischemic stroke, show a significant inhibition of autophagy in circulating EPCs in response to high salt, similarly to SHRSP. Circulating mononuclear cells derived from these subjects also show increased susceptibility to mitochondrial dysfunction and damage in response to stress stimuli [Citation25].
Our study significantly extends previous evidence regarding the role of NDUFC2 downregulation in the development of stroke in response to high salt diet in SHRSP. NDUFC2 downregulation may favor stroke through the induction of mitochondrial dysfunction, which may be secondary on the one hand to the inhibition of complex I activity and on the other hand to the impairment of mitochondrial autophagy, which is not able to remove damaged mitochondria (Figure S4).
In conclusion, our findings suggest that interventions aimed to activate autophagy may represent novel therapeutic strategies for subjects at higher risk to develop stroke.
Materials and methods
Animal study design and phenotypic analyses
In order to assess the level of autophagy and mitophagy at baseline and in response to stress, six-week old male SHRSR and SHRSP (n = 6 for each group) were fed with either regular diet (RD) or JD for 4 weeks, following our standardized protocols [Citation11,Citation26]. In different sets of experiments, the autophagic flux was analyzed in SHRSP (n = 3 for each group) receiving intraperitoneal injection of chloroquine (50 mg/kg) (Sigma Aldrich, C6628) 4 h before being killed at the end of 4 weeks of JD. At the end of dietary regimen, animals were sacrificed, and brains were removed and used for molecular analyses.
In order to evaluate the impact of nicotinamide mononucleotide (NMN) on stroke survival, animals were divided in SHRSP receiving JD (n = 6) and SHRSP receiving JD in combination with intraperitoneal injection of 250 mg/kg/d of NMN (n = 6) (Sigma Aldrich, N3501). Animals receiving JD plus NMN for 3 weeks with appropriate controls (SHRSP fed for 3 weeks with JD only) were also used for molecular analysis (n = 5 for each group). The effects of the specific reactivation of autophagy on stroke survival was evaluated in the following experimental groups: SHRSP receiving JD plus intraperitoneal injection of 15 mg/kg/d of Tat-Beclin 1 D11 (n = 6) (Novus Biological, NBP2-49888) and animals fed with JD alone used as controls (n = 6 for each group). In a separate set of experiments, SHRSP receiving JD plus Tat-Beclin 1 (n = 4) for 3 weeks were used for molecular analyses and were compared with control animals fed with only JD (n = 6) or RD (n = 4), without Tat-Beclin 1 treatment. Animals of the above groups were monitored for systolic blood pressure (SBP), BW, proteinuria and stroke occurrence up to 3 months of the experimental protocol, following previously published procedures [Citation11]. All animal procedures were performed in accordance with our institutional guidelines (D. lgs 26/2014), and they were approved by the Neuromed institutional committee for experimental work (OPBA = organization for the animal welfare).
In vitro studies
Ndufc2-silenced A10 vascular smooth muscle cells (VSMCs) were used to test the modulation of autophagy, mitophagy, mitophagic flux, cell viability, mitochondrial morphology and function under both basal and stress conditions (high salt medium). NMN (Sigma Aldrich, N3501) (1 μM) was used to reactivate autophagy.
Primary cerebral endothelial cells (ECs) obtained from neonatal SHRSP were exposed to high salt medium either in the absence or in the presence of Tat-Beclin 1 to test autophagy and cell viability.
Endothelial progenitor cells (EPCs) obtained from human subjects carrying either the cytosine (C) wild type or the thymine (T) variant allele at NDUFC2/rs11237379 were exposed to high salt medium to test the autophagy modulation. For the evaluation of autophagic flux in EPCs, 50 nM bafilomycin A1 (Sigma Aldrich, B1793) was used as inhibitor of the autophagic flux and added to the medium 4 h before the end of the NaCl treatment. Tat-Beclin 1 was used to verify the impact of autophagy reactivation on cell senescence.
Cell cultures
A10 VSMCs (ATCC, CRL-1476™) were cultured and silenced for Ndufc2 using a Ndufc2-specific siRNA (Mission siRNA; Sigma Aldrich, SASI_Rn01_00074945) as previously described [Citation11]. A10 incubated with transfection agents (Lipofectamine RNAi max; Invitrogen, 13778150) were used as control cells. Cells between passages 3–8 were used for experiments.
Cultures of primary cerebral ECs were obtained from brains of neonatal (day 2) SHRSP using mechanic and enzymatic digestions followed by a CD31+ magnetic positive selection (Miltenyi Biotec, Bergisch Gladbach, Germany). ECs were cultured in DMEM-F12 medium (Life Technologies, 21331) supplemented with FBS 10% (Thermo Fisher Scientific, A3840001) and EC growth supplement (ECGS; Sigma Aldrich, E2759). Cells between passages 1–2 were used for experiments.
Human EPCs were isolated from peripheral venous blood of healthy volunteers carrying either the C wild type or the T variant allele at NDUFC2/rs11237379 (n = 5 for both CC and TT genotypes). Then, isolated EPCs were cultured in EGM complete medium (Life Technologies, CC-4176) on fibronectin (Sigma Aldrich, ECM001) pre-coated dishes and characterized as previously described [Citation27,Citation28]. The protocol was approved by the ethic committee of Sapienza University of Rome (no. 1916/2015). All experiments involving EPCs were conducted in compliance with the Declaration of Helsinki involving human subjects.
Cell treatment
In order to test in vitro the modulation of autophagy under both basal and stress conditions, cells were treated with a high salt medium (NaCl 20 mM) for 72 h. Cells incubated with the medium used for the routine culture were used as control. Tat-Beclin 1 D-11 was used as enhancer of autophagy in ECs at the concentration of 10–20 µM. Each in vitro analysis was performed in a biological triplicate.
Cell viability
A10 cell viability was assessed by fluorescence-activated cell sorting (FACS) by the use of a FACS Calibur flow cytometer (BD Biosciences, California, USA) using the ANXA5/propidium iodide staining (Thermo Fisher Scientific, BMS500FI) as previously described [Citation29]. Cell survival in ECs was evaluated by the 3-(4,5-dimethylthiazol-2-yl)-2,5-diphenyltetrazolium bromide (MTT) assay (Sigma Aldrich, M5655) following the manufacturer’s instructions.
Mitophagy in vitro
Mitophagy in vitro was assessed in siRNA A10 exposed to NaCl by means of the mitochondrial probe MitoTracker green (Invitrogen, M7514). MitoTracker signal directly correlates with the number of mitochondria [Citation30]. Briefly, after specific treatments, cells were incubated with 50 nM MitoTracker green for 30 min at 37°C, then collected and analyzed by FACS (excitation 490 nm, emission 516 nm). Mitophagic flux in vitro was evaluated in cells treated with 50 nM bafilomycin A1 (Sigma Aldrich, B1793) used 4 h before the end of the NaCl treatment.
Mitochondrial morphology and function
Mitochondrial morphology in A10 and in brains of SHRSP fed for 3 weeks with RD, JD or JD plus Tat-Beclin 1 was evaluated through transmission electron microscopy. Samples were embedded in Epon 812 (Electron Microscopy Science, 14120) and ultrathin sections were obtained with an Ultracut EMFCS ultramicrotome (Leica Microsystems, Wetzlar, Germany). Sections were examined under a Morgagni 268D transmission electron microscope (FEI, Hillsboro, OR, USA) equipped with a Mega View II charge coupled device camera (SIS, Soft Imaging System GmbH, Munster, Germany) and the ultrastructural quantitation of mitochondrial damage was performed as previously described [Citation25,Citation31]. Briefly, three grades of mitochondria damage were assigned, based on the mitochondrial area with intact cristae: Mt-G3, severe; Mt-G2, moderate; Mt-G1, slight. The inner mitochondrial membrane (IMM):Outer Mitochondrial Membrane (OMM) ratio was also calculated and used as marker for mitochondrial damage [Citation25,Citation31].
Mitochondrial membrane potential (ΔΨm) in A10 was assessed by confocal microscopy through the 5, 50,6,60-tetrachloro-1,10,3,30-tetraethylbenzimidazolylcarbocyanine iodide probe (JC-1; Molecular Probes, Invitrogen, T3168) following the manufacturer’s instructions. Data were analyzed as previously reported [Citation25].
NAD+:NADH levels were measured in freshly mitochondria isolated from brains and in A10 cells by using commercially available colorimetric kits (BioAssay Systems, E2ND-100) and following the manufacturer’s instructions.
Mitochondrial function in vivo was assessed by evaluating ATP levels and Complex IV activity in brains of SHRSP, by using commercially available kits purchased from Abcam (ab83355 and ab109911, respectively). Values were acquired by a microplate reader and data were analyzed following the manufacturer’s protocol.
Cell senescence
EPCs of healthy volunteers carrying the T variant allele at NDUFC2/rs11237379 were stimulated for 3 d with complete media, with medium containing 20 mM NaCl, with medium containing 1 µM Tat-Beclin 1 D11 or with a combination of 1 µM Tat-Beclin 1 D11 and 20 mM NaCl. Afterward, cells were fixed with manufacturer fixative solution at RT for 10 min and stained with the Senescence β-galactosidase Staining Kit (Cell Signaling Technology, 9860) according to the manufacturer’s instructions. The number of β-gal-positive EPCs was determined in >3 randomly selected fields for each condition of three different subjects by optical microscopy (Nikon Eclipse).
DNA extraction, mitochondrial DNA content and RTPCR
Genomic DNA was extracted from brains of SHRSP and A10 cells using a specific commercially available kit (Promega, A1125) and following the manufacturer’s instructions. 50 ng of DNA for each sample were used to determine the mitochondrial DNA content. The latter was performed by assessing the expression levels of Mt-Cyb (Mitochondrial complex III: ubiquinol-cytochrome c reductase complex subunit) by real time PCR (RTPCR) experiments, using the ViiA 7 Real-Time PCR System (Applied Biosystem, Foster City, CA, USA) and SYBR Select Master Mix (Applied Biosystem, 4472908). The amount of target DNA was calculated by the comparative 2−DDCt method [Citation32] using the Gapdh (glyceraldehyde 3-phosphate dehydrogenase) as housekeeping gene. Primers used were the following: Mt-Cyb sense 5ʹ-CCTTCCTACCATTCCTGCATAC-3ʹ, antisense 5ʹ-TGGCCTCCGATTCATGTTAAG-3ʹ; Gapdh: sense 5ʹ-AACGACCCCTTCATTGACCTC-3ʹ, antisense 5ʹ-CCTTGACTGTGCCGTTGAACT-3ʹ).
Genomic DNA from human healthy subjects was isolated from peripheral blood and genotyping for the TC/rs11237379 NDUFC2 exon 1 variant was performed using RTPCR [Citation11].
Mitochondrial biogenesis analysis
Mitochondrial biogenesis was evaluated in brains of SHRSP fed for 4 weeks with RD or JD by assessing the transcript level of Ppargc1a through RTPCR. RNA was extracted by trizol (Invitrogen, 15596026) and 500 ng of each sample were retrotranscribed into cDNA and used for RTPCR experiments. Values of the target cDNA were calculated as reported above. Primers used for amplification were the following: Ppargc1a sense: 5ʹ-CTCTGGGGTCAGAGGAAGAG-3ʹ, antisense 5ʹ-CGATGACCCTCCTCACACCA-3ʹ.
Western blot analysis
Western blot analysis was performed as previously reported [Citation11]. The following primary antibodies were used: anti-MAP1LC3/LC3 (MBL International, M186-3), anti-SQSTM1 (RD System, MAB8028), anti-COX4I1 (Cell Signaling Technology, 4850), anti-NDUFC2 (Novus Biologicals, NPB1-59610), anti-ACTB/beta ACTIN (Santa Cruz Biotechnology, 69879). Secondary antibodies were anti-rabbit (Millipore, AP132P) and anti-mouse (Millipore, 401215).
Statistical analysis
All continuous variables are shown as means ± SEM. Comparisons between two groups were performed using the student’s t test. Comparisons between multiple groups were performed by one-way ANOVA followed by Bonferroni post hoc test. Survivor function in rats monitored over JD feeding alone, compared with JD plus the different treatments, was estimated by the life-table method. Log-rank and Wilcoxon statistics were used for testing equality of survivor functions. Statistical significance was stated at the p < 0.05 level. Graph Pad Prism (Ver 5.01 GraphPad Software, Inc., La Jolla, CA, USA) statistical software was used for the statistical analysis.
Supplemental Material
Download MS Word (1.1 MB)Disclosure statement
No potential conflict of interest was reported by the authors.
Supplemental material
The supplementary data for this article can be accessed here.
Additional information
Funding
Related Research Data
References
- Collaborators H DALYs GBD. Global, regional, and national disability-adjusted life-years (DALYs) for 315 diseases and injuries and healthy life expectancy (HALE), 1990–2015: a systematic analysis for the Global Burden of Disease Study 2015. Lancet. 2016 Oct 8;388(10053):1603–1658. PubMed PMID: 27733283; PubMed Central PMCID: PMC5388857.
- Thomopoulos C, Parati G, Zanchetti A. Effects of blood pressure lowering on outcome incidence in hypertension: 4. Effects of various classes of antihypertensive drugs–overview and meta-analyses. J Hypertens. 2015 Feb;33(2):195–211. PubMed PMID: 25485720.
- Rubattu S, Giliberti R, Volpe M. Etiology and pathophysiology of stroke as a complex trait. Am J Hypertens. 2000 Oct;13(10):1139–1148. PubMed PMID: 11041170.
- Levine B, Kroemer G. Autophagy in the pathogenesis of disease. Cell. 2008 Jan 11;132(1):27–42. PubMed PMID: 18191218; PubMed Central PMCID: PMC2696814.
- Sciarretta S, Maejima Y, Zablocki D, et al. The Role of Autophagy in the Heart. Annu Rev Physiol. 2018 Feb 10;80:1–26. PubMed PMID: 29068766.
- Saito T, Sadoshima J. Molecular mechanisms of mitochondrial autophagy/mitophagy in the heart. Circ Res. 2015 Apr 10;116(8):1477–1490. PubMed PMID: 25858070; PubMed Central PMCID: PMC4419704.
- Siasos G, Tsigkou V, Kosmopoulos M, et al. Mitochondria and cardiovascular diseases-from pathophysiology to treatment. Ann Transl Med. 2018 Jun;6(12):256. PubMed PMID: 30069458; PubMed Central PMCID: PMCPMC6046286.
- Rubattu S, Volpe M, Kreutz R, et al. Chromosomal mapping of quantitative trait loci contributing to stroke in a rat model of complex human disease. Nat Genet. 1996 Aug;13(4):429–434. PubMed PMID: 8696337.
- Di Castro S, Scarpino S, Marchitti S, et al. Differential modulation of uncoupling protein 2 in kidneys of stroke-prone spontaneously hypertensive rats under high-salt/low-potassium diet. Hypertension. 2013 Feb;61(2):534–541. PubMed PMID: 23297375.
- Volpe M, Iaccarino G, Vecchione C, et al. Association and cosegregation of stroke with impaired endothelium-dependent vasorelaxation in stroke prone, spontaneously hypertensive rats. J Clin Invest. 1996 Jul 15;98(2):256–261. PubMed PMID: 8755632; PubMed Central PMCID: PMCPMC507425.
- Rubattu S, Di Castro S, Schulz H, et al. Ndufc2 gene inhibition is associated with mitochondrial dysfunction and increased stroke susceptibility in an animal model of complex human disease. J Am Heart Assoc. 2016 Feb 17;5(2). pii: e002701. PubMed PMID: 26888427; PubMed Central PMCID: PMC4802485.
- Ikeda Y, Shirakabe A, Maejima Y, et al. Endogenous Drp1 mediates mitochondrial autophagy and protects the heart against energy stress. Circ Res. 2015 Jan 16;116(2):264–278. PubMed PMID: 25332205.
- Shirakabe A, Zhai P, Ikeda Y, et al. Drp1-dependent mitochondrial autophagy plays a protective role against pressure overload-induced mitochondrial dysfunction and heart failure. Circulation. 2016 Mar 29;133(13):1249–1263. PubMed PMID: 26915633; PubMed Central PMCID: PMC4811679.
- Houtkooper RH, Canto C, Wanders RJ, et al. The secret life of NAD+: an old metabolite controlling new metabolic signaling pathways. Endocr Rev. 2010 Apr;31(2):194–223. PubMed PMID: 20007326; PubMed Central PMCID: PMC2852209.
- Imai S, Guarente L. NAD+ and sirtuins in aging and disease. Trends Cell Biol. 2014 Aug;24(8):464–471. PubMed PMID: 24786309; PubMed Central PMCID: PMC4112140.
- Verdin E. NAD(+) in aging, metabolism, and neurodegeneration. Science. 2015 Dec 4;350(6265):1208–1213. PubMed PMID: 26785480.
- Zhang DX, Zhang JP, Hu JY, et al. The potential regulatory roles of NAD(+) and its metabolism in autophagy. Metabolism. 2016 Apr;65(4):454–462. PubMed PMID: 26975537.
- Rubattu S, Hubner N, Ganten U, et al. Reciprocal congenic lines for a major stroke QTL on rat chromosome 1. Physiol Genomics. 2006 Oct 11;27(2):108–113. PubMed PMID: 16835352.
- Volpe M, Camargo MJ, Mueller FB, et al. Relation of plasma renin to end organ damage and to protection of K+ feeding in stroke-prone hypertensive rats. Hypertension. 1990 Mar;15(3):318–326. PubMed PMID: 2406201.
- Schreiber S, Bueche CZ, Garz C, et al. Kidney pathology precedes and predicts the pathological cascade of cerebrovascular lesions in stroke prone rats. PloS One. 2011;6(10):e26287. PubMed PMID: 22031827; PubMed Central PMCID: PMC3198774.
- Shoji-Kawata S, Sumpter R, Leveno M, et al. Identification of a candidate therapeutic autophagy-inducing peptide. Nature. 2013 Feb 14;494(7436):201–206. PubMed PMID: 23364696; PubMed Central PMCID: PMC3788641.
- Wang P, Guan YF, Du H, et al. Induction of autophagy contributes to the neuroprotection of nicotinamide phosphoribosyltransferase in cerebral ischemia. Autophagy. 2012 Jan;8(1):77–87. PubMed PMID: 22113203.
- Ginet V, Spiehlmann A, Rummel C, et al. Involvement of autophagy in hypoxic-excitotoxic neuronal death. Autophagy. 2014 May;10(5):846–860. PubMed PMID: 24674959; PubMed Central PMCID: PMC5119065.
- Wen YD, Sheng R, Zhang LS, et al. Neuronal injury in rat model of permanent focal cerebral ischemia is associated with activation of autophagic and lysosomal pathways. Autophagy. 2008 Aug;4(6):762–769. PubMed PMID: 18567942.
- Raffa S, Scrofani C, Valente S, et al. In vitro characterization of mitochondrial function and structure in rat and human cells with a deficiency of the NADH: ubiquinone oxidoreductase Ndufc2 subunit. Hum Mol Genet. 2017 Dec 1;26(23):4541–4555. PubMed PMID: 28973657; PubMed Central PMCID: PMCPMC5886163.
- Rubattu S, Cotugno M, Bianchi F, et al. A differential expression of uncoupling protein-2 associates with renal damage in stroke-resistant spontaneously hypertensive rat/stroke-prone spontaneously hypertensive rat-derived stroke congenic lines. J Hypertens. 2017 Sep;35(9):1857–1871. PubMed PMID: 28399045.
- De Falco E, Carnevale R, Pagano F, et al. Role of NOX2 in mediating doxorubicin-induced senescence in human endothelial progenitor cells. Mech Ageing Dev. 2016 Oct;159:37–43. PubMed PMID: 27181082.
- De Falco E, Avitabile D, Totta P, et al. Altered SDF-1-mediated differentiation of bone marrow-derived endothelial progenitor cells in diabetes mellitus. J Cell Mol Med. 2009 Sep;13(9B):3405–3414. PubMed PMID: 20196780; PubMed Central PMCID: PMC4516496.
- Stanzione R, Bianchi F, Cotugno M, et al. A decrease of brain MicroRNA-122 level is an early marker of cerebrovascular disease in the stroke-prone spontaneously hypertensive rat. Oxid Med Cell Longev. 2017;2017:1206420. PubMed PMID: 28751928; PubMed Central PMCID: PMCPMC5494068.
- Mauro-Lizcano M, Esteban-Martinez L, Seco E, et al. New method to assess mitophagy flux by flow cytometry. Autophagy. 2015;11(5):833–843. PubMed PMID: 25945953; PubMed Central PMCID: PMCPMC4509449.
- Putignani L, Raffa S, Pescosolido R, et al. Preliminary evidences on mitochondrial injury and impaired oxidative metabolism in breast cancer. Mitochondrion. 2012 May;12(3):363–369. PubMed PMID: 22366096.
- Livak KJ, Schmittgen TD. Analysis of relative gene expression data using real-time quantitative PCR and the 2(-Delta Delta C(T)) Method. Methods. 2001 Dec;25(4):402–408. PubMed PMID: 11846609.