
ABSTRACT
Ferroptosis is a recently discovered form of programmed cell death, but its regulatory mechanisms remain poorly understood. Here, we show that the RNA-binding protein ZFP36/TTP (ZFP36 ring finger protein) plays a crucial role in regulating ferroptosis in hepatic stellate cells (HSCs). Upon exposure to ferroptosis-inducing compounds, the ubiquitin ligase FBXW7/CDC4 (F-box and WD repeat domain containing 7) decreased ZFP36 protein expression by recognizing SFSGLPS motif. FBXW7 plasmid contributed to classical ferroptotic events, whereas ZFP36 plasmid impaired FBXW7 plasmid-induced HSC ferroptosis. Interestingly, ZFP36 plasmid inhibited macroautophagy/autophagy activation by destabilizing ATG16L1 (autophagy related 16 like 1) mRNA. ATG16L1 plasmid eliminated the inhibitory action of ZFP36 plasmid on ferroptosis, and FBXW7 plasmid enhanced the effect of ATG16L1 plasmid on autophagy. Importantly, ZFP36 plasmid promoted ATG16L1 mRNA decay via binding to the AU-rich elements (AREs) within the 3ʹ-untranslated region. The internal mutation of the ARE region abrogated the ZFP36-mediated ATG16L1 mRNA instability, and prevented ZFP36 plasmid-mediated ferroptosis resistance. In mice, treatment with erastin and sorafenib alleviated murine liver fibrosis by inducing HSC ferroptosis. HSC-specific overexpression of Zfp36 impaired erastin- or sorafenib-induced HSC ferroptosis. Noteworthy, we analyzed the effect of sorafenib on HSC ferroptosis in fibrotic patients with hepatocellular carcinoma receiving sorafenib monotherapy. Attractively, sorafenib monotherapy led to ZFP36 downregulation, ferritinophagy activation, and ferroptosis induction in human HSCs. Overall, these results revealed novel molecular mechanisms and signaling pathways of ferroptosis, and also identified ZFP36-autophagy-dependent ferroptosis as a potential target for the treatment of liver fibrosis.
Abbreviations
ARE: AU-rich elements; ATG: autophagy related; BECN1: beclin 1; CHX: cycloheximide; COL1A1: collagen type I alpha 1 chain; ELAVL1/HuR: ELAV like RNA binding protein 1; FBXW7/CDC4: F-box and WD repeat domain containing 7; FN1: fibronectin 1; FTH1: ferritin heavy chain 1; GPX4/PHGPx: glutathione peroxidase 4; GSH: glutathione; HCC: hepatocellular carcinoma; HSC: hepatic stellate cell; LSEC: liver sinusoidal endothelial cell; MAP1LC3A: microtubule associated protein 1 light chain 3 alpha; MDA: malondialdehyde; NCOA4: nuclear receptor coactivator 4; PTGS2/COX2: prostaglandin-endoperoxide synthase 2; RBP: RNA-binding protein; ROS: reactive oxygen species; SLC7A11/xCT: solute carrier family 7 member 11; SQSTM1/p62: sequestosome 1; TNF: tumor necrosis factor; TP53/p53: tumor protein p53; UTR: untranslated region; ZFP36/TTP: ZFP36 ring finger protein
Introduction
Liver fibrosis is a complex pathophysiological process related to cicatrization mechanisms, and its end-stage cirrhosis causes high morbidity and mortality with no currently available treatment worldwide [Citation1–Citation3]. The transdifferentiation of HSCs into matrix-producing myofibroblasts is a central event in liver fibrosis [Citation4,Citation5]. Therefore, targeting to scavenge HSCs is considered therapeutic approaches to reverse liver fibrosis [Citation6–Citation8]. We previously reported that targeting of HSCs, including inhibition of the pericyte function [Citation9], proinflammatory function [Citation10], glycolytic function [Citation11] and contractile function [Citation12], and induction of apoptosis [Citation13], necroptosis [Citation14], senescence [Citation15] and lipocyte phenotype [Citation16], can alleviate the pathological condition of liver fibrosis. Importantly, we recently showed that activation of ferritinophagy is required for the RNA-binding protein (RBP) ELAVL1/HuR (ELAV like RNA binding protein 1) to regulate ferroptosis in HSCs [Citation17]. Moreover, we found that TP53 (tumor protein p53)-dependent induction of ferroptosis is necessary for artemether to alleviate carbon tetrachloride-induced liver fibrosis and HSC activation [Citation18]. In the present study, we aimed to elucidate the role of RBP ZFP36 in ferroptosis, and to further identify ZFP36-dependent ferroptosis as a potential target for the treatment of liver fibrosis.
Ferroptosis is a genetically encoded program of cell death that results from iron-dependent lipid peroxidation, but differs from classical programmed cell death including apoptosis, necroptosis, senescence and pyroptosis [Citation19–Citation21]. Noteworthy, SLC7A11 (solute carrier family 7 member 11)/system Xc− inhibition (e.g., sorafenib, erastin, sulfasalazine), GPX4 (glutathione peroxidase 4) inhibition (e.g., RSL3, FIN56, FINO2, altretamine), and physiological conditions (e.g., high extracellular glutamate, cystine deprivation, amino acid starvation) are all reported to trigger ferroptosis [Citation22–Citation24]. Conversely, ferroptotic cell death can be inhibited by iron chelators (e.g., deferoxamine), lipophilic antioxidants (e.g., ferrostatin-1, liproxstatin-1, vitamin E), inhibitors of lipid peroxidation (e.g., eugenol), and depletion of polyunsaturated fatty acyl phospholipids (PUFA-PLs) (e.g., arachidonic acid) [Citation22–Citation24]. Mechanistically, it was well established that autophagy signaling [Citation25], iron metabolism signaling [Citation26], reactive oxygen species (ROS) metabolism signaling [Citation27], TP53 signaling [Citation28], MAPK (mitogen-activated protein kinase) signaling [Citation29], and SQSTM1 (sequestosome 1)-KEAP1 (kelch like ECH associated protein 1)-NFE2L2 (nuclear factor, erythroid 2 like 2) signaling [Citation30] are mainly involved in the regulation of ferroptosis. Importantly, several lines of evidence indicates that ferroptosis is a type of autophagy-dependent cell death [Citation31–Citation33]. Autophagy is identified as an upstream mechanism in the induction of ferroptosis by regulating cellular iron homeostasis and cellular ROS generation [Citation31–Citation33]. The molecular mechanisms may involve multiple pathways, such as the degradation of ferritin via NCOA4 (nuclear receptor coactivator 4)-dependent ferritinophagy (ferritin-specific autophagy) [Citation25], the inhibition of SLC7A11 activity via the formation of a BECN1-SLC7A11 protein complex [Citation22], the degradation of lipid droplets via RAB7A (RAB7A, member RAS oncogene family)-dependent lipophagy (lipid droplet-specific autophagy) [Citation32], and the degradation of the core circadian clock protein ARNTL (aryl hydrocarbon receptor nuclear translocator like) via SQSTM1/p62-dependent clockophagy (circadian clock protein-specific autophagy) [Citation33]. Although the mechanisms underlying the regulation of ferroptosis have long been attracted extensive concern of numerous scholars and its acute regulation by iron-sensing signaling pathways is well described, the longer-term post-transcriptional regulation of ferroptosis is still largely unknown.
Lipid peroxidation response requires lasting, accurate, and adaptable gene regulation, which uniquely suits to post-transcriptional control [Citation34]. The AU-rich elements (AREs) in 3ʹ-untranslated region (UTR) facilitate post-transcriptional control of many biological functions including signal transduction, cytokine expression, and oxidative stress [Citation35]. The ubiquitous RBP ZFP36 is one of the best-studied regulators of cytoplasmic mRNA fate, which is characterized by two tandem repeat CCCH zinc fingers domains [Citation36]. ZFP36 binds to target mRNAs through its tandem zinc finger domains [Citation36]. One of the central features of this interaction is that the optimal binding sequence contains the UUAUUUAUU motif which is flanked by additional uridylate residues [Citation37]. ZFP36 destabilizes target mRNAs by binding 3ʹ-UTR AREs and recruiting deadenylation and degradation factors [Citation38]. Currently, a wide range of mRNAs including TNF (tumor necrosis factor), IL6 (interleukin 6), CXCL8/IL8 (C-X-C motif chemokine ligand 8), IL17A, IL33, PTGS2 (prostaglandin-endoperoxide synthase 2), CCND1 (cyclin D1), E2F1 (E2F transcription factor 1), LATS2 (large tumor suppressor kinase 2), CSF2 (colony stimulating factor 2), VEGFA (vascular endothelial growth factor A), HIF1A (hypoxia inducible factor 1 subunit alpha), and MMP9 (matrix metallopeptidase 9) have been identified to bind to ZFP36 [Citation39]. Through these post-transcriptional influences on specific target mRNAs, ZFP36 can alter the cellular response to lipid peroxidation, oxidative stress, apoptosis, and immune stimuli [Citation40]. Interestingly, exploring the ZFP36-mediated post-transcriptional regulation of ferroptosis in HSCs could provide effective diagnostic signs and therapeutic targets in liver fibrosis.
In the current study and for the first time, we investigated novel molecular mechanisms and signaling pathways of ferroptosis in HSCs. We found that ZFP36 overexpression can result in ATG16L1 mRNA decay via binding to the AREs in the 3ʹ-UTR, thus triggering autophagy inactivation, blocking autophagic ferritin degradation, and eventually conferring resistance to ferroptosis. Our results indicated that ZFP36 was a critical and novel post-transcriptional regulator of ferroptosis in liver fibrosis.
Results
RNA-binding protein ZFP36 expression is decreased during HSC ferroptosis
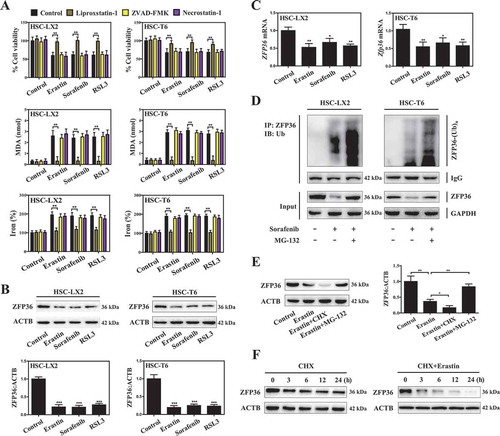
We previously reported that clinical (e.g., sorafenib) and preclinical (e.g., erastin) drugs can induce ferroptosis in both human (HSC-LX2) and rat (HSC-T6) HSC lines [Citation17]. In agreement with previous findings, sorafenib-, erastin-, and RSL3-mediated growth inhibition in HSC-LX2 and HSC-T6 cells was blocked by liproxstatin-1 (a potent ferroptosis inhibitor) but not ZVAD-FMK (a potent apoptosis inhibitor) and necrostatin-1 (a potent necroptosis inhibitor) (). Furthermore, 3 different cell permeablization assays including trypan blue exclusion (Figure S1A), fluorescein diacetate (FDA) staining (Figure S1B), and calcein-AM-propidium iodide (PI) double staining (Figure S1C) showed that sorafenib treatment resulted in a drastic increase in the dead cells compared with the untreated group, whereas liproxstatin-1, but not ZVAD-FMK and necrostatin-1, completely diminished the promoting effect of sorafenib on ferroptotic cell death (Figure S1A-C). Lipid peroxidation, glutathione (GSH) depletion, and redox-active iron accumulation are three key events in ferroptosis [Citation41]. As expected, the end products of lipid peroxidation (MDA) (), GSH depletion (Figure S2A and B), and redox-active iron overload () were significantly increased following treatment with sorafenib, erastin, and RSL3. Interestingly, liproxstatin-1, but not ZVAD-FMK and necrostatin-1, inhibited MDA production, GSH depletion, and redox-active iron accumulation in the induction of ferroptosis (, S2A and B). Overall, these results suggested that sorafenib, erastin, and RSL3 can induce HSC ferroptosis in vitro.
Figure 1. RNA-binding protein ZFP36 expression is decreased during HSC ferroptosis. HSC-LX2 and HSC-T6 cells were treated with erastin (10 μM), sorafenib (10 μM), and RSL3 (2.5 μM), with or without the indicated inhibitors (liproxstatin-1, 100 nM; ZVAD-FMK, 10 μM; necrostatin-1, 10 μM) for 24 h. (A) Cell viability, MDA, and iron levels were assayed (n = 3 in every group, **, p < 0.01). (B and C) HSC-LX2 and HSC-T6 cells were treated with erastin (10 μM), sorafenib (10 μM), and RSL3 (2.5 μM) for 24 h. ZFP36 protein and mRNA levels were determined (n = 3 in every group, *, p < 0.05, **, p < 0.01, ***, p < 0.001). (D) HSC-LX2 and HSC-T6 cells were treated with sorafenib (10 μM) with or without MG-132 (10 μM) for 24 h. Cells were harvested for ubiquitination assay (n = 3 in every group). (E) HSC-LX2 cells were treated with erastin (10 μM) with or without cycloheximide (CHX, 20 μg/ml) or MG-132 (10 μM) for 24 h, and ZFP36 protein level was assayed (n = 3 in every group, *, p < 0.05, **, p < 0.01). (F) HSC-LX2 cells were treated with CHX (20 μg/ml) for 24 h or treated with erastin (10 μM) and CHX (20 μg/ml) for 24 h. ZFP36 protein levels were determined at the indicated time points (n = 3 in every group).
To discover RBPs that regulate ferroptosis, we performed an unbiased screen in HSC-LX2 cells exposed to erastin. Among the screen hits, many reported ferroptosis genes were identified, such as GPX4 (0.32-fold), ACSL4 (acyl-CoA synthetase long chain family member 4) (2.47-fold), SLC7A11 (2.51-fold), SLC11A2 (solute carrier family 11 member 2) (2.48-fold) (Figure S3B). These positive outcomes validated our screen approach. Next, we searched for RBPs that are highly sensitive to ferroptosis. Remarkably, 116 RBPs were upregulated and 102 RBPs were downregulated in HSC ferroptosis induced by SLC7A11 inhibition (Figure S3A). To validate the findings of screen analyses, we selected 10 RBPs according to the fold change, and analyzed their expression in erastin-treated HSC-LX2 cells, respectively. The results confirmed that ELAVL1 (3.92-fold), SRSF1 (serine and arginine rich splicing factor 1) (2.85-fold), ACO1/IRP1 (aconitase 1) (3.47-fold), IGF2BP3/IMP3 (insulin like growth factor 2 mRNA binding protein 3) (2.43-fold), and CELF2 (CUGBP Elav-like family member 2) (2.41-fold) were up-regulated, whereas ZFP36 (0.23-fold), HNRNPD/AUF1 (heterogeneous nuclear ribonucleoprotein D) (0.44-fold), STAU1 (staufen double-stranded RNA binding protein 1) (0.49-fold), PUM1 (pumilio RNA binding family member 1) (0.51-fold), and MBNL1 (muscleblind like splicing regulator 1) (0.56-fold) were downregulated in ferroptotic HSCs (Figure S3C). To further screen out conserved and universal ferroptotic regulatory RBPs, we performed detailed analyses of the expression of the identified subsets of RBPs in another ferroptotic cell model induced by cysteine deprivation. Of note, we identified a universal and well-studied RBP ZFP36 (Figure S3D), which is known to regulate lipid peroxidation through destabilizing or decaying the translation of target mRNAs [Citation42].
In order to examine whether ZFP36 played a pivotal role in regulating ferroptosis, we analyzed protein and mRNA expression levels of ZFP36 during HSC ferroptosis. Remarkably, treatment with erastin, sorafenib, and RSL3 reduced the protein expression of ZFP36 by about 84%, 82% and 81%, respectively (). However, erastin, sorafenib, and RSL3 treatment only decreased the mRNA expression of ZFP36 by about 48%, 36% and 41%, respectively (). These results suggested that the reduction of ZFP36 protein may involve other potential mechanisms. Subsequently, we used MG-132 (a selective 26S proteosomal inhibitor) to address the effect of ubiquitination-mediated proteasomal degradation on ZFP36 protein during HSC ferroptosis. Interestingly, a concomitant increase in ZFP36 polyubiquitination was noted in the presence of MG132 in both human and rat HSC lines when ZFP36 was immunoprecipitated using a specific antibody (). Moreover, the chemical protein synthesis inhibitor cycloheximide (CHX) further promoted the reduction of ZFP36 protein by erastin in HSC-LX2 cells, whereas MG-132 partially rescued the expression of ZFP36 protein (). Furthermore, the cycloheximide chase assay indicated that erastin treatment significantly shortened the half-life of ZFP36 protein in HSC-LX2 cells ().
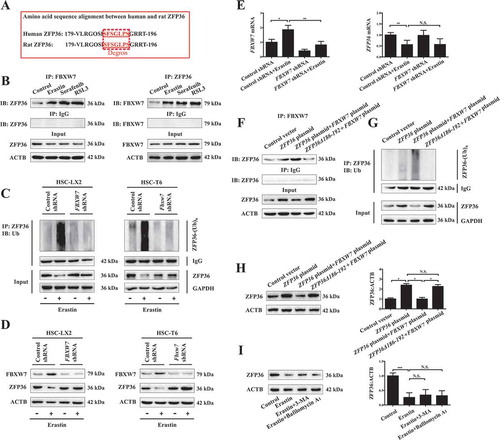
To further identify the ubiquitinase responsible for ZFP36 ubiquitination, we used computational methods to search the presence of a degron (degradation signal) present in ZFP36 protein. Noteworthy, a detailed amino acid sequence alignment between human and rat ZFP36 protein revealed the presence of “degron” spans (SFSGLPS) between amino acids 186–192 recognized by the Skp, Cullins, and F-box (SCF) complex E3 ubiquitin ligase including FBXW7, SKP2 (S-phase kinase associated protein 2), and BTRC/β-TrCP (beta-transducin repeat containing E3 ubiquitin protein ligase) (). Of note, the expression level of FBXW7 was significantly increased, but the expression level of SKP2 and BTRC was not evidently changed during HSC ferroptosis (Figure S3E). Further, immunocoprecipitation assay clearly showed that ferroptosis inducers erastin, sorafenib, and RSL3 markedly promoted the direct binding of FBXW7 and ZFP36 (). Additionally, ubiquitination assay showed that FBXW7 knockdown by shRNA completely impaired erastin-induced ZFP36 protein ubiquitination () and ZFP36 protein reduction () in both human and rat HSC lines. However, FBXW7 knockdown did not affect the mRNA expression of ZFP36 in erastin-treated cells (). Importantly, truncated mutant of ZFP36 residues 186–192 (ZFP36Δ186-192) was prepared by polymerase chain reaction [Citation43]. Immunoprecipitation assay indicated that ZFP36Δ186-192 failed to bind directly to FBXW7 (). Ubiquitination assay also showed that ZFP36Δ186-192 completely impaired FBXW7-mediated ZFP36 protein ubiquitination (). Besides, western blot further demonstrated that ZFP36Δ186-192 rescued FBXW7-induced ZFP36 protein reduction (). More importantly, we investigated whether autophagy signaling affected ZFP36 protein degradation. As a result, erastin treatment significantly decreased the protein expression of ZFP36 compared with control, whereas autophagy inhibitors 3-methyladenine (3-MA) and bafilomycin A1 did not affect erastin-induced downregulation of ZFP36 protein (). The results showed that autophagy signaling did not affect ZFP36 protein degradation. Collectively, these findings indicated that the expression of ZFP36 was downregulated via a decrease in the transcription of ZFP36 and an increase in ubiquitination degradation in sorafenib-, erastin-, and RSL3-induced ferroptosis.
Figure 2. The ubiquitin ligase FBXW7 decreases ZFP36 protein expression by recognizing SFSGLPS motif. (A) Amino acid sequence alignment between human and rat ZFP36 protein was determined. (B) HSC-LX2 cells were treated with erastin (10 μM), sorafenib (10 μM), and RSL3 (2.5 μM) for 24 h. The binding of ZFP36 and FBXW7 was determined by immunoprecipitation assay (n = 3 in every group). (C and D) FBXW7-deficient HSC-LX2 and HSC-T6 cells were treated with erastin (10 μM) for 24 h. The ubiquitylation of ZFP36 and the protein levels of ZFP36 and FBXW7 were determined (n = 3 in every group). (E) FBXW7-deficient HSC-LX2 cells were treated with erastin (10 μM) for 24 h. the mRNA levels of ZFP36 and FBXW7 were determined (n = 3 in every group, *, p < 0.05, **, p < 0.01, N.S., not significant). (F-H) HSC-LX2 cells were stably transferred with ZFP36 Δ186-192 plasmid, ZFP36 plasmid, or FBXW7 plasmid, and then were treated with erastin (10 μM) for 24 h. The binding of ZFP36 and FBXW7, the ubiquitylation of ZFP36, and the protein levels of ZFP36 were determined (n = 3 in every group, *, p < 0.05, N.S., not significant). (I) HSC-LX2 cells were treated with erastin (10 μM) with or without autophagy inhibitors (3-MA, 10 mM; bafilomycin A1, 5 nM) for 24 h. The protein levels of ZFP36 were determined (n = 3 in every group, ***, p < 0.001, N.S., not significant).
ZFP36 overexpression confers resistance to HSC ferroptosis
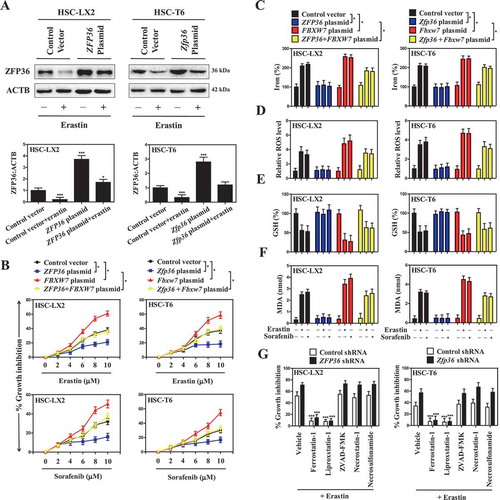
To investigate whether downregulated ZFP36 was directly involved in the induction of ferroptosis, we first measured cell viability when ZFP36 is overexpressed by specific plasmid in both human and rat HSC lines (). Indeed, ZFP36 overexpression significantly impaired sorafenib- and erastin-induced growth inhibition in HSC-LX2 and HSC-T6 cells () with reduced ferroptotic events, including a decrease of iron levels (), lipid ROS elimination (), GSH generation (), and MDA reduction (). Interestingly, FBXW7 overexpression suppressed ZFP36 expression, and in turn, promoted sorafenib- and erastin-induced growth inhibition () with increased ferroptotic events, including redox-active iron accumulation (), lipid ROS generation (), GSH depletion (), and MDA production (). As expected, treatment with erastin and sorafenib significantly decreased the protein expression of ZFP36 (Figure S4A). Interestingly, FBXW7 plasmid can further decrease ferroptosis inducer-induced ZFP36 reduction, whereas ZFP36 plasmid can rescue ZFP36 reduction in FBXW7-overexpressed cells (Figure S4A). Additionally, several ferroptosis inhibitors (ferrostain-1 and liproxstatin-1) markedly reversed erastin-induced growth inhibition in the absence of ZFP36 (), whereas ZVAD-FMK (a pan-caspase inhibitor), necrosulfonamide (a potent necroptosis inhibitor that targets mixed lineage kinase domain-like protein), and necrostatin-1 (a potent necroptosis inhibitor that targets RIPK1 [receptor-interacting protein kinase 1]), did not significantly reverse this process (). Of note, ferroptosis-inducer erastin could reduce the protein expression of ZFP36, whereas knockdown of ZFP36 could further decrease erastin-induced ZFP36 protein reduction (Figure S4B). Importantly, ferroptosis inhibitors ferrostain-1 and liproxstatin-1 could impair erastin-induced ZFP36 protein reduction, whereas apoptosis inhibitor ZVAD-FMK and necroptosis inhibitors necrosulfonamide and necrostatin-1 could not abolish erastin-induced ZFP36 protein reduction (Figure S4B). Altogether, these results showed that ZFP36 overexpression conferred resistance to HSC ferroptosis, but not apoptosis and necroptosis, following erastin and sorafenib treatment.
Figure 3. ZFP36 overexpression confers resistance to HSC ferroptosis. (A) HSC-LX2 and HSC-T6 cells overexpressing ZFP36 were treated with erastin (10 μM) for 24 h. The ZFP36 protein levels were determined (n = 3 in every group, ***, p < 0.001). (B) HSC-LX2 and HSC-T6 cells overexpressing ZFP36 and FBXW7 were treated with erastin (0–10 μM) or sorafenib (0–10 μM) for 24 h. Cell viability was assayed (n = 3 in every group, *, p < 0.05). (C-F) HSC-LX2 and HSC-T6 cells overexpressing ZFP36 and FBXW7 were treated with erastin (10 μM) or sorafenib (10 μM) for 24 h. The levels of iron, ROS, GSH, and MDA were assayed (n = 3 in every group, *, p < 0.05). (G) ZFP36-deficient HSC-LX2 and HSC-T6 cells were treated with erastin (10 μM) with or without the indicated inhibitors (ferrostatin-1, 1 μM; liproxstatin-1, 100 nM; ZVAD-FMK,10 μM; necrostatin-1, 10 μM; necrosulfonamide, 0.5 μM) for 24 h, and cell viability was assayed (n = 3 in every group, ***, p < 0.001).
Reduced ferroptosis by ZFP36 plasmid is associated with autophagy inactivation
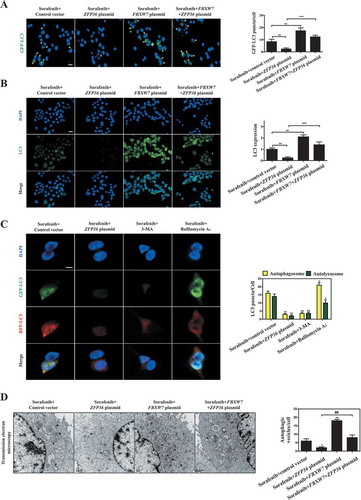
To further define the molecular mechanism of ZFP36-induced ferroptosis resistance, we focused on analyzing mRNA expression of the ZFP36 target genes involved in the classical iron metabolic pathway, glutamine metabolic pathway and recently discovered non-classical autophagy pathway by RNA-sequencing (RNA-seq) (). Importantly, we identified a crucial target gene ATG16L1 in autophagy pathway, but not in iron metabolic pathway and glutamine metabolic pathway, was evidently inhibited upon ZFP36 overexpression according to the fold change (Figure S5A). Moreover, the repression of ATG16L1 gene by ZFP36 overexpression was further verified by the results of western blot and real-time PCR assays. As expected, ZFP36 overexpression remarkably reduced the expression of ATG16L1 ( and S5B) without large differences in ATG3 ( and S5C), ATG4A ( and S5D), ATG5 (), BECN1/Beclin 1 (), ATG7 (), ATG9A ( and S5E), ATG12 (), and ATG14 (Figure S5F) levels in HSC-LX2 cells. In contrast, FBXW7 overexpression significantly increased the expression of ATG16L1 () (Figure S5B), but did not obviously affect other autophagy-related (ATG) gene levels ( and S5C–F). It is worthy of note that the activity of the conserved ATG12–ATG5-ATG16L1 complex is essential for the conversion of LC3-II and the formation of autophagosome [Citation44]. As a result, immunoprecipitation assay indicated that ZFP36 plasmid markedly blocked the protein complex of ATG12–ATG5-ATG16L1, whereas FBXW7 plasmid significantly promoted the protein complex of ATG12–ATG5-ATG16L1 (). Furthermore, ZFP36 overexpression significantly abrogated sorafenib-induced conversion of LC3-I to LC3-II, whereas FBXW7 overexpression markedly enhanced LC3-II conversion in both HSC-LX2 and HSC-T6 cells (). Moreover, GFP-LC3 puncta formation assay revealed that the number of GFP-LC3 punctate structures in ZFP36 plasmid-treated HSC-LX2 cells was significantly reduced compared to those in control vector-treated HSC-LX2 cells during ferroptosis (). However, the number of fluorescent spots was evidently increased in FBXW7 plasmid-treated HSC-LX2 cells (). Consistently, the endogenous LC3 expression was also decreased in ZFP36 plasmid-treated HSC-LX2 cells, but was upregulated in FBXW7 plasmid-treated HSC-LX2 cells (). It is well known that the generation of autophagosomes is a central event in maturation of autophagic vacuoles [Citation45]. Indeed, when HSC-LX2 cells were transfected with adenovirus carrying RFP-GFP-LC3 plasmid,ZFP36 overexpression and autophagy inhibitors 3-MA and bafilomycin A1 remarkably blocked autophagy flux during HSC ferroptosis(). Meanwhile, transmission electron microscopy (TEM) assays further confirmed that ZFP36 upregulation markedly reduced autophagic vesicles, whereas FBXW7 upregulation increased autophagic vesicles in ferroptosis (). Additionally, we also determined whether autophagy can play a normal degradation function in ZFP36- or FBXW7-overexpressing cells. Interestingly, long-lived protein degradation assay indicated that ZFP36 overexpression significantly inhibited the autophagic degradation of long-lived protein, whereas FBXW7 overexpression evidently enhanced the autophagic degradation function during HSC ferroptosis (Figure S5G). Of note, activation of autophagy mediates ferroptosis by degrading the cellular iron stock protein FTH1 (ferritin heavy chain 1) in a NCOA4-dependent manner [Citation25]. As expected, ZFP36 plasmid markedly upregulated, whereas FBXW7 plasmid apparently downregulaed, ferritin and NCOA4 expression in sorafenib-treated HSC-LX2 cells (Figure S5H). Taken together, these data supported the hypothesis that reduced ferroptosis by ZFP36 plasmid was associated with autophagy inactivation.
Figure 4. Reduced ferroptosis by ZFP36 plasmid is associated with autophagy inactivation. (A) HSC-LX2 cells overexpressing ZFP36 were treated with sorafenib (10 μM) for 24 h, and total RNAs were extracted for RNA-Seq. Microarray heat map demonstrates clustering of HSC-LX2 cells. Hierarchical cluster analyses of significantly differentially expressed mRNAs: bright blue, underexpression; gray, no change; bright red, overexpression (Control vector, n = 3; ZFP36 plasmid, n = 3). (B-D) HSC-LX2 cells overexpressing ZFP36 and FBXW7 were treated with erastin (10 μM), sorafenib (10 μM), and RSL3 (2.5 μM) for 24 h. The protein levels of ATG3, ATG4A, ATG12–ATG5, BECN1, ATG7, ATG9A, and ATG16L1 were determined (n = 3 in every group). (E) HSC-LX2 cells overexpressing ZFP36 and FBXW7 were treated with sorafenib (10 μM) for 24 h. The protein complex of ATG12–ATG5-ATG16L1 was assayed by immunocoprecipitation (n = 3 in every group). (F) HSC-LX2 and HSC-T6 cells overexpressing ZFP36 and FBXW7 were treated with sorafenib (10 μM) for 24 h. The protein levels of LC3-I/II were determined (n = 3 in every group).
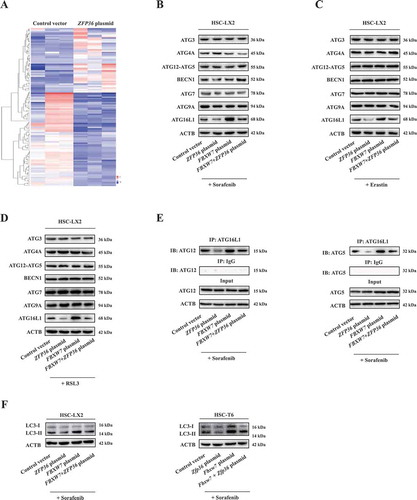
Figure 5. ZFP36 plasmid inhibits HSC ferroptosis by regulating autophagy signaling. (A) HSC-LX2 cells overexpressing ZFP36 and FBXW7 were stably transferred with pGM-CMV-GFP-hLC3 plasmid, and then were treated with sorafenib (10 μM) for 24 h. The green fluorescence spots were detected. Scale bars: 50 μm. Representative photographs were shown (n = 3 in every group, **, p < 0.01, ***, p < 0.001). (B) HSC-LX2 cells overexpressing ZFP36 and FBXW7 were treated with sorafenib (10 μM) for 24 h. The endogenous LC3 levels were determined by immunofluorescence. Scale bars: 50 μm. Representative photographs were shown (n = 3 in every group, **, p < 0.01, ***, p < 0.001). (C) HSC-LX2 cells were stably transferred with CMV-TurboRFP-EGFP-LC3-PGK-Puro plasmid and ZFP36 plasmid, and then were treated with sorafenib (10 μM) with or without autophagy inhibitors (3-MA, 10 mM; bafilomycin A1, 5 nM) for 24 h. The yellow fluorescence and red fluorescence spots were detected. Scale bars: 50 μm. Representative photographs were shown (n = 3 in every group, *, p < 0.05, **, p < 0.01). (D) HSC-LX2 cells overexpressing ZFP36 and FBXW7 were treated with sorafenib (10 μM) for 24 h. Autophagosomes and autolysosomes were determined by transmission electron microscopy. Scale bars: 0.5 μm. Representative photographs were shown (n = 3 in every group, *, p < 0.05, **, p < 0.01, ##, p < 0.01).
Induction of autophagy by ATG16L1 plasmid impairs ZFP36-induced resistance to HSC ferroptosis
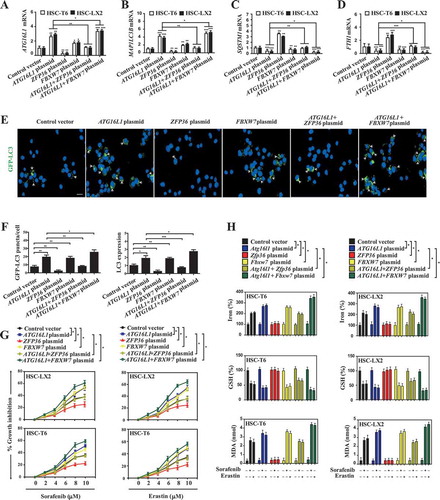
To determine whether autophagy inactivation directly mediated ZFP36-induced ferroptosis resistance, we employed ATG16L1 plasmid to induce autophagy activation for reverse validation. Western blot and real-time PCR analyses indicated that ATG16L1 plasmid significantly increased the protein and mRNA expression of ATG16L1 in both human and rat HSC lines, and also completely impaired ZFP36 plasmid-induced ATG16L1 downregulation during HSC ferroptosis ( and S6A). Moreover, ATG16L1 overexpression by specific plasmid evidently restored the conversion of LC3-I to LC3-II ( and S6A), the generation of autophagosomes ( and S6B), autophagic flux (), and the autophagic degradation of ferritin () in the presence of ZFP36 plasmid. Interestingly, in accordance with the above results, FBXW7 plasmid can enhance ATG16L1 plasmid-induced autophagy activation (). Subsequently, we measured growth inhibition in HSC-LX2 and HSC-T6 cells co-treated with ATG16L1 plasmid and ZFP36 plasmid. Indeed, ZFP36 plasmid significantly impaired erastin- and sorafenib-induced growth inhibition, whereas ATG16L1 plasmid dramatically promoted growth inhibition by erastin and sorafenib (). Of note, FBXW7 plasmid could enhance the growth inhibition of ATG16L1 plasmid (). Importantly, several typical ferroptotic events including iron accumulation, lipid ROS production, GSH depletion, and lipid peroxidation were all investigated in HSC-LX2 and HSC-T6 cells co-treated with ATG16L1 plasmid and ZFP36 plasmid. Similarly, pretreatment with ZFP36 plasmid completely abolished erastin- and sorafenib-induced redox-active iron accumulation (), lipid ROS accumulation (Figure S6C), GSH depletion (), and MDA production () in the absence of ATG16L1 plasmid or FBXW7 plasmid. In contrast, ATG16L1 plasmid almost impaired the resistance of ZFP36 to HSC ferroptosis ( and S6C). As expected, there appeared to be increases in ferroptotic events in cells co-treated with ATG16L1 plasmid and FBXW7 plasmid ( and S6C). Overall, these results indicated that induction of autophagy by ATG16L1 plasmid impaired the resistance of ZFP36 to HSC ferroptosis.
Figure 6. Induction of autophagy by ATG16L1 plasmid impairs ZFP36-induced resistance to HSC ferroptosis. (A-D) HSC-LX2 and HSC-T6 cells overexpressing ATG16L1, ZFP36 and FBXW7 were treated with sorafenib (10 μM) for 24 h. The mRNA expression of ATG16L1, MAPILC3B, SQSTM1, and FTH1 were determined (n = 3 in every group, *, p < 0.05, **, p < 0.01, ***, p < 0.001). (E and F) HSC-LX2 cells overexpressing ATG16L1, ZFP36 and FBXW7 were stably transferred with pGM-CMV-GFP-hLC3 plasmid, and then were treated with sorafenib (10 μM) for 24 h. The green fluorescence spots were detected. Scale bars: 50 μm. Representative photographs were shown (n = 3 in every group, *, p < 0.05, **, p < 0.01). (G) HSC-LX2 and HSC-T6 cells overexpressing ATG16L1, ZFP36 and FBXW7 were treated with sorafenib (0–10 μM) or erastin (0–10 μM) for 24 h. Cell viability were examined (n = 3 in every group, *, p < 0.05). (H) HSC-LX2 and HSC-T6 cells overexpressing ATG16L1, ZFP36 and FBXW7 were treated with erastin (10 μM) or sorafenib (10 μM) for 24 h. The levels of iron, GSH, and MDA were assayed (n = 3 in every group, *, p < 0.05).
ZFP36 plasmid promotes autophagy inactivation and ATG16L1 mRNA decay via binding to the AU-rich elements
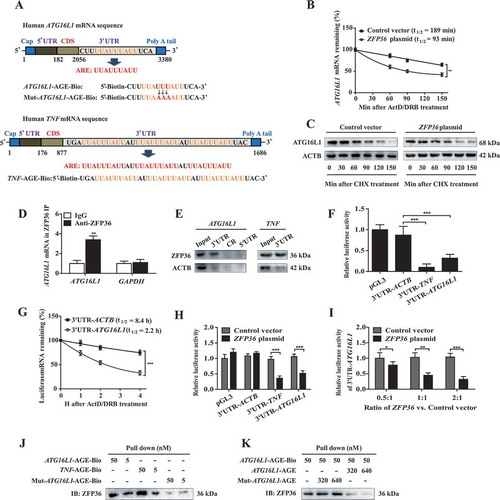
It has been reported that ZFP36 promotes mRNA decay and degradation via binding to AREs in the 3ʹ-UTR of short-lived human transcripts [Citation36–Citation38]. Therefore, we first used computational methods to search AREs in the ATG16L1 mRNA sequence. Interestingly, detailed primary sequence analyses identified a 9-nucleotide consensus sequence (UUAUUUAUU) in the 3ʹ-UTR of the ATG16L1 mRNA sequence (), which represent the canonical class II sequence recognized by the RBP ZFP36 [Citation36–Citation38]. To determine whether ZFP36 affected ATG16L1 mRNA stability, we examined ATG16L1 mRNA half-life after inhibiting de novo synthesis with actinomycin D (ActD) and 5, 6-dichloro-1-β-D-ribofuranosyl-benzimadazole (DRB). As expected, the half-life of ATG16L1 mRNA was shortened by 50% in ZFP36 plasmid-treated HSC-LX2 cells compared with control vector-treated HSC-LX2 cells (), indicating a post-transcriptional regulation of ATG16L1 mRNA by ZFP36. Consistently, the cycloheximide chase assay indicated that ZFP36 plasmid did not significantly affect the half-life of ATG16L1 protein in HSC-LX2 cells (). Next, we measured whether ZFP36 bound to the ATG16L1 mRNA in HSC-LX2 cells by performing RNP IP assays using anti-ZFP36 antibody under conditions that preserved RNP integrity. As shown in , the ATG16L1 PCR products were highly enriched in ZFP36 samples compared with control IgG samples, demonstrating a direct bind of ZFP36 to ATG16L1 mRNA. The enrichment of GAPDH (glyceraldehyde-3-phosphate dehydrogenase) PCR product was treated as a negative control, and the amplification of PCR products (a nonspecific contaminating housekeeping transcript of ZFP36) served to monitor the evenness of sample input as reported previously [Citation17]. Furthermore, we detected the binding between ZFP36 and ATG16L1 mRNA using biotinylated transcripts that spanned the ATG16L1 mRNA 3ʹ-UTR, coding region (CR), and 5ʹ-UTR. The interaction between the biotinylated ATG16L1 transcripts and ZFP36 was examined by biotin pull down followed by western blot analysis after incubation with cytoplasmic lysates. The results from mRNA-protein precipitation revealed that ZFP36 could readily interact with the ATG16L1 3ʹ-UTR or TNF 3ʹ-UTR, whereas the ATG16L1 5ʹ-UTR and CR transcripts did not bind to ZFP36 (). In contrast, none of the ATG16L1 partial transcripts (3ʹ-UTR, CR, or 5ʹ-UTR) were found to interact with ACTB (actin beta), included here as a negative control (). As 3ʹ-UTR played a crucial role in regulating mRNA stability, we cloned the ATG16L1 3ʹ-UTR immediately downstream of luciferase gene and transfected it into HSC-LX2 cells. Because ZFP36 was known to target TNF 3ʹ-UTR for degradation and ACTB mRNA was quite stable, we included TNF 3ʹ-UTR and ACTB 3ʹ-UTR as positive and negative controls. Importantly, the luciferase activity was significantly decreased in HSC-LX2 cells transfected with the ATG16L1 3ʹ-UTR, at similar levels of reduction as the TNF 3ʹ-UTR positive control (). To further confirm that the 3ʹ-UTR-mediated mRNA decay contributed to the decreased luciferase activity, we determined the half-life of luciferase mRNA. As expected, the half-life of luciferase mRNA was remarkably reduced in HSC-LX2 cells transfected with the ATG16L1 3ʹ-UTR compared with the ACTB 3ʹ-UTR transfected cells (). As described in above results, sorafenib-treated HSC-LX2 cells express minimal amounts of endogenous ZFP36. Therefore, we introduced ZFP36 and ATG16L1 3ʹ-UTR luciferase vector into sorafenib-treated HSC-LX2 cells, followed by measuring luciferase activity. Interestingly, ZFP36 dose-dependently decreased luciferase activity in HSC-LX2 cells transfected with ATG16L1 3ʹ-UTR (). To further define the role of 3ʹ-UTR in regulating ATG16L1 mRNA stability, we generated ARE mutants as illustrated in for reverse validation. Indeed, ATG16L1-AGE-Biotin (, lane 1 and 2) or TNF-AGE-Biotin (, lane 3 and 4), but not mutated ATG16L1-AGE-Biotin (, lane 5 and 6), bound and precipitated ZFP36. More importantly, a cold ATG16L1 AGE probe (, lane 4 and 5) but not a mutant ATG16L1 AGE probe (, lane 2 and 3) successfully competed with ATG16L1-AGE-Biotin (, lane 1) to bind ZFP36, indicating that ZFP36 specifically bound to the ATG16L1 AGE. Collectively, these findings suggested that ZFP36 plasmid promoted ATG16L1 mRNA decay via binding to the AREs within the 3ʹ-UTR of ATG16L1 mRNA.
Figure 7. ZFP36 plasmid promotes autophagy inactivation and ATG16L1 mRNA decay via binding to the AU-rich elements. (A) The predicted hits of the ZFP36 signature motif in human ATG16L1 and TNF mRNA 3ʹ-UTR were assayed. (B) HSC-LX2 cells overexpressing ZFP36 were treated with sorafenib (10 μM), ActD (10 μg/ml) and DBR (5 μM) for indicated times. The remaining ATG16L1 mRNA levels were measured by real-time PCR and normalized to the results at 0 min after ActD/DRB treatment (n = 3 in every group, **, p < 0.01). (C) HSC-LX2 cells overexpressing ZFP36 were treated with sorafenib (10 μM) and CHX (20 μg/ml) for 150 min. ATG16L1 protein level was determined at the indicated time points (n = 3 in every group). (D) Association of endogenous ZFP36 with endogenous ATG16L1 mRNA was measured by real-time PCR after ribonucleoprotein immunoprecipitation (RNP IP) (n = 3 in every group, **, p < 0.01). (E) mRNA affinity isolation assay was performed with biotinylated transcripts of the ATG16L1 mRNA 5ʹ-UTR, coding region (CR), 3ʹ-UTR or the TNF mRNA 3ʹ-UTR (n = 3 in every group). (F) Luciferase constructs carrying the 3ʹ-UTRs of genes encoding ACTB (3ʹ-UTR-ACTB), TNF (3ʹ-UTR-TNF), ATG16L1 (3ʹ-UTR-ATG16L1) or empty vector (pGL3) was stably transfected into HSC-LX2 cells. Cells were treated with sorafenib (10 μM) for 24 h, and luciferase activities were measured and normalized to the activities obtained in pGL3-transfected cells without treatment (n = 3 in every group, ***, p < 0.001). (G) Luciferase constructs carrying the 3ʹ-UTRs of genes encoding ACTB (3ʹ-UTR-ACTB) and ATG16L1 (3ʹ-UTR-ATG16L1) were stably transfected into HSC-LX2 cells. Luciferase mRNA half-life was measured by real-time PCR after sorafenib (10 μM) and ActD/DRB treatment for indicated times (n = 3 in every group, ***, p < 0.001). (H) HSC-LX2 cells overexpressing ZFP36 were stably transfected with the luciferase constructs carrying the 3ʹ-UTRs of genes encoding ACTB (3ʹ-UTR-ACTB), TNF (3ʹ-UTR-TNF), ATG16L1 (3ʹ-UTR-ATG16L1) or empty vector (pGL3), and then were treated with sorafenib (10 μM) for 24 h. Luciferase activities were measured and normalized to the activities obtained in pGL3-transfected cells without treatment (n = 3 in every group, ***, p < 0.001). (I) ATG16L1 3ʹ-UTR luciferase construct was co-transfected with different amounts of ZFP36 plasmid into HSC-LX2 cells. Luciferase activity was detected after sorafenib (10 μM) treatment for 24 h and normalized to the cells transfected with empty plasmid (n = 3 in every group, *, p < 0.05, **, p < 0.01, ***, p < 0.001). (J) mRNA pull down assay was performed by mixing ATG16L1-AGE-Bio, TNF-AGE-Bio, and Mut-ATG16L1-AGE-Bio with total cell extracts from HSC-LX2 cells. Precipitates were prepared for western blot (n = 3 in every group). (K) Cold ATG16L1-AGE probes or Mut-ATG16L1-AGE probes with different concentrations were used to compete for the binding between ATG16L1-AGE-Bio and ZFP36 (n = 3 in every group).
HSC-specific knock-in of zfp36 impairs erastin- or sorafenib-induced HSC ferroptosis in murine liver fibrosis
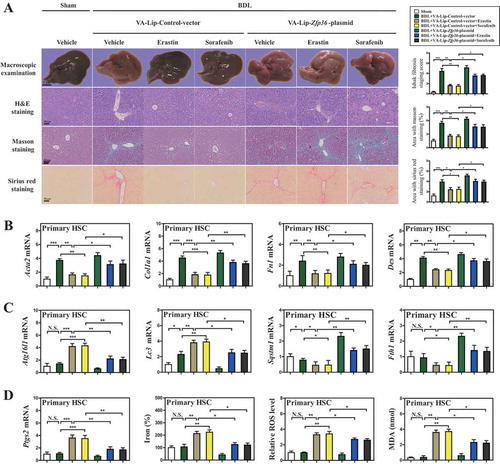
To evaluate whether Zfp36 overexpression impaired ferroptosis in vivo, we generated vitamin A-coupled liposomes carrying Zfp36 plasmid (VA-Lip-Zfp36-plasmid) to upregulate HSC-specific ZFP36 expression in bile duct ligation (BDL)-induced murine liver fibrosis model [Citation17]. As expected, pathorphological observation showed that typical fibrotic pathological changes occurred in the livers of model group compared with the normal livers of control group, whereas treatment with ferroptosis inducers erastin and sorafenib significantly alleviated BDL-induced liver fibrosis (). Interestingly, pretreatment with VA-Lip-Zfp36-plasmid completely impaired the improvement of erastin and sorafenib on liver fibrosis (). Moreover, histopathologic analysis including hematoxylin and eosin (H&E), masson, and sirius red staining revealed that collagen type I overdeposited in fibrotic livers of model group, but erastin and sorafenib treatment markedly reduced collagen deposition (). Attractively, VA-Lip-Zfp36-plasmid almost reversed the effect of erastin and sorafenib on hepatic fibrosis (). Furthermore, real-time PCR also confirmed that erastin and sorafenib treatment prominently decreased the mRNA expression of Acta2 (actin, alpha 2, smooth muscle, aorta), Col1a1 (collagen type I alpha 1 chain), Fn1 (fibronectin 1), and Des/desmin (), whereas VA-Lip-Zfp36-plasmid completely abolished the inhibition of erastin and sorafenib on Acta2, Col1a1, Fn1, and Des expression ().
Figure 8. HSC-specific knock-in of Zfp36 impairs erastin- or sorafenib-induced HSC ferroptosis in murine liver fibrosis. Mice of 7 groups were treated with sham, BDL+VA-Lip-control-vector, BDL+VA-Lip-control-vector+erastin, BDL+VA-Lip- control-vector+sorafenib, BDL+VA-Lip-Zfp36-plasmid, BDL+VA-Lip-Zfp36- plasmid+erastin or BDL+VA-Lip-Zfp36-plasmid+sorafenib. (A) The pathological changes of the livers were observed by macroscopic examination. Scale bars: 1 cm. Thin sections (4 μm) were stained with H&E, Sirius Red, and Masson for histopathological study. Scale bars: 50 μm. Representative photographs were shown (n = 6 in every group, *, p < 0.05, **, p < 0.01, ***, p < 0.001). (B and C) The mRNA expression of liver fibrosis markers (Acta2, Col1a1, Fn1, and Des) and autophagy markers (Atg16l1, Lc3, Sqstm1, and Fth1) was determined by real-time PCR in isolated primary HSCs (n = 6 in every group, *, p < 0.05, **, p < 0.01, ***, p < 0.001, N.S., not significant). (D) The Ptgs2 mRNA expression, iron level, ROS level, and MDA level were determined (n = 6 in every group, *, p < 0.05, **, p < 0.01, ***, p < 0.001, N.S., not significant).
Next, we further analyzed which specific types of liver cells presented ferroptosis following erastin treatment. The primary HSCs, hepatocytes, liver sinusoidal endothelial cells (LSECs), and macrophages were all isolated from fibrotic livers, and the effect of erastin on ferroptosis was determined in these primary liver cells. Interestingly, erastin treatment could increase the expression of the ferroptosis marker Ptgs2 (prostaglandin-endoperoxide synthase 2) in primary HSCs but not in primary hepatocytes, LSECs, and macrophages (Figure S7A). Consistent with this finding, erastin treatment could trigger redox-active iron overload (Figure S7B), lipid ROS accumulation (Figure S7C), and MDA production (Figure S7D) in primary HSCs. By contrast, ferroptotic events including redox-active iron overload (Figure S7B), lipid ROS accumulation (Figure S7C), and lipid peroxidation (Figure S7D) were not triggered following treatment with erastin in primary hepatocytes, LSECs, and macrophages. Collectively, these data suggested that ferroptosis inducer erastin may alleviate liver fibrosis by inducing ferroptosis in HSCs, but not in hepatocytes, LSECs, and macrophages.
To further elucidate the role of ZFP36 in erastin- or sorafenib-induced HSC ferroptosis, primary HSCs were also isolated from fibrotic livers of C57BL/6 mice treated with sham, BDL+VA-Lip-control-vector, BDL+VA-Lip-control-vector+erastin, BDL+VA-Lip-control-vector+sorafenib, BDL+VA-Lip-Zfp36-plasmid, BDL+VA-Lip-Zfp36-plasmid+erastin, and BDL+VA-Lip-Zfp36-plasmid+sorafenib. Interestingly, treatment with ferroptosis inducers erastin and sorafenib decreased Zfp36 expression compared to untreated controls, whereas VA-Lip-Zfp36-plasmid nearly counteracted the inhibitory effect of erastin and sorafenib on ZFP36 in primary HSCs (Figure S8A). Besides, erastin and sorafenib treatment evidently increased the expression of Atg16l1 and Lc3, but reduced the expression of the ferritinophagy substrates Fth1 and Sqstm1 (). As expected, VA-Lip-Zfp36-plasmid completely inhibited erastin- or sorafenib-induced ferritinophagy activation characterized by decreased Atg16l1 and Lc3 expression, and upregulated Fth1 and Sqstm1 expression (). More importantly, erastin and sorafenib treatment prominently promoted the expression of the HSC ferroptosis marker Ptgs2 with enhanced ferroptotic events including redox-active iron overload (), GSH reduction (Figure S8B), lipid ROS accumulation (), and MDA production (), suggesting that erastin and sorafenib could lead to the induction of HSC ferroptosis in vivo as well. Interestingly, VA-Lip-Zfp36-plasmid completely impaired erastin or sorafenib-induced HSC ferroptosis characterized by redox-active iron reduction (), GSH generation (Figure S8B), lipid ROS clearance (), and MDA elimination (). Altogether, these data supported the hypothesis that HSC-specific overexpression of Zfp36 impaired erastin- or sorafenib-induced HSC ferroptosis in murine liver fibrosis.
Sorafenib monotherapy leads to ZFP36 downregulation, ferritinophagy activation, and ferroptosis induction in human HSCs from fibrotic patients
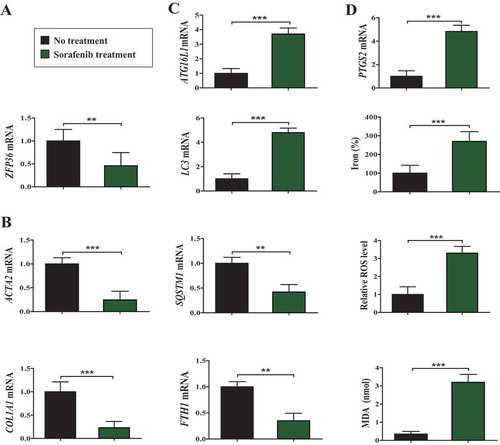
To verify this underlying mechanism in clinical, we retrospectively analyzed 28 liver biopsy samples from cirrhotic patients who did not receive any treatment, and 18 partial hepatectomy samples from cirrhotic patients complicated with hepatocellular carcinoma (HCC) who received sorafenib monotherapy in Nanjing Hospital Affiliated to Nanjing University of Chinese Medicine. Moreover, primary human HSCs were isolated from the collected liver tissue by laser capture microdissection for laboratory investigation as described previously [Citation17]. Interestingly, real-time PCR analyses showed that the expression of ZFP36 was remarkably reduced in sorafenib-treated primary HSCs compared to untreated controls (). Moreover, the mRNA expression of fibrosis markers ACTA2 and COL1A1 was markedly decreased in sorafenib-treated hepatectomy samples compared to untreated liver biopsy samples (). Furthermore, the expression of ferritinophagy markers ATG16L1 and LC3 was upregulated, whereas the expression of the ferritinophagy substrates FTH1 and SQSTM1 was downregulated after sorafenib treatment in primary HSCs (). More importantly, ferroptosis marker PTGS2 and ferroptotic events including lipid peroxidation, lipid ROS accumulation, and redox-active iron overload, were triggered following treatment with sorafenib in primary HSCs (). Taken together, these results indicated that sorafenib monotherapy contributed to ZFP36 downregulation, ferritinophagy activation, and ferroptosis induction in human HSCs from fibrotic patients.
Figure 9. Sorafenib monotherapy leads to ZFP36 downregulation, ferritinophagy activation, and ferroptosis induction in human HSCs from fibrotic patients. (A-C) Primary human HSCs were isolated from the collected liver tissue by laser capture microdissection (LCM). The mRNA expression of ZFP36, ACTA2, COL1A1, ATG16L1, LC3, SQSTM1, and FTH1 was determined by real-time PCR (No treatment, n = 28; Sorafenib treatment, n = 18, **, p < 0.01, ***, p < 0.001). (D) The PTGS2 mRNA expression, iron level, ROS level, and MDA level were determined (No treatment, n = 28; Sorafenib treatment, n = 18, ***, p < 0.001).
Discussion
Ferroptosis is a recently recognized form of regulated cell death that is characterized by lipid peroxidation [Citation19–Citation21]. Further recognition of the function of ferroptosis in the development of liver fibrosis has provided opportunities for diagnosis and treatment [Citation19–Citation21]. Kong et al. recently reported that artesunate alleviates liver fibrosis by regulating ferroptosis signaling pathway [Citation46]. Moreover, Sui et al. showed that magnesium isoglycyrrhizinate ameliorates liver fibrosis and HSC activation by regulating ferroptosis signaling pathway [Citation47]. Furthermore, Wang et al. demonstrated that TP53-dependent induction of ferroptosis is required for artemether to alleviate carbon tetrachloride-induced liver fibrosis and HSC activation [Citation18]. Consistent with previous studies, we found that ferroptosis inducer erastin could alleviate liver fibrosis by induce ferroptosis in HSCs, but not in hepatocytes, LSECs, and macrophages in murine fibrotic liver. Although ferroptosis offers new hope for the prevention and treatment of liver fibrosis, there are still many drawbacks that need to be monitored. Wang et al. reported that the ferroptosis stimulant ferric citrate potently induces ferroptosis in murine primary hepatocytes and bone marrow-derived macrophages, which is a disadvantage for the improvement of liver injury [Citation48]. Different ferroptosis inducers have different cell selectivity. Therefore, drug design for targeting HSC ferroptosis is a new trend in the treatment of liver fibrosis.
Importantly, the present study first identified the RBP ZFP36 as a novel post-transcriptional regulator of ferroptosis. ZFP36 is also known as TTP, TIS11, G0S24, and Nup475, and is the founding member of a small family of proteins containing tandem CCCH zinc fingers [Citation36–Citation38]. ZFP36 specifically binds the nonamer sequence UUAUUUAUU, which can be considered the core destabilizing element of many ARE-containing mRNAs [Citation36–Citation38]. Most importantly, a key step in the initiation of ARE-mediated decay lies within ZFP36’s capacity to promote deadenylation of ARE-containing transcripts [Citation36–Citation38]. ZFP36 has a high affinity for the conserved instances of the simple linear RNA motif, UUAUUUAUU, in the 3ʹ-UTR of the message, and promotes the shortening of the poly (A) tail of transcripts [Citation36–Citation38]. Interestingly, ARE-mediated mRNA post-transcriptional regulation is an essential method to control mRNA turnover and translation, which plays an important role in normal development and diseases [Citation36–Citation38]. Wu et al. recently showed that the ARE-binding protein ZFP36 is a novel target and mediator of calcineurin tumor suppressing function in the skin [Citation49]. Moreover, Haneklaus et al. reported that the RBP ZFP36 is a critical negative regulator of the NLRP3 (NLR family pyrin domain containing 3) inflammasome [Citation50]. Similarly, Tiedje et al. also demonstrated that the RBP ZFP36 is a global post-transcriptional regulator of feedback control in inflammation [Citation36]. Furthermore, Prabhala et al. revealed that corticosteroid-induced DUSP1 (dual specificity phosphatase 1) represses proinflammatory cytokine secretion by enhancing activity of ZFP36 in airway smooth muscle (ASM) cells [Citation51]. In the current study, we showed that the expression of ZFP36 was downregulated via a decrease in the transcription of ZFP36 and an increase in ubiquitination degradation in sorafenib-, erastin-, and RSL3-induced ferroptosis. ZFP36 overexpression conferred resistance to ferroptosis, whereas ZFP36 knockdown contributed to classical ferroptotic events. Attractively, upregulated ZFP36 appeared to inhibit autophagy activation by destabilizing ATG16L1 mRNA, which may be the underlying mechanism for ZFP36 overexpression-mediated ferroptosis resistance. As expected, ATG16L1 overexpression almost eliminated the inhibitory action of ZFP36 overexpression on ferroptosis. Noticeably, upregulated ZFP36 promoted autophagy inactivation and ATG16L1 mRNA decay via binding to the AREs (UUAUUUAUU) within the 3ʹ-UTR of ATG16L1 mRNA. The internal mutation of the ARE region abrogated the ZFP36-mediated ATG16L1 mRNA instability, and, in turn, prevented ZFP36-mediated ferroptosis resistance. Meanwhile, treatment with erastin and sorafenib alleviated murine liver fibrosis by inducing HSC ferroptosis. HSC-specific overexpression of Zfp36 impaired erastin- or sorafenib-induced HSC ferroptosis in murine liver fibrosis. Although more experiments are needed to determine the exact role of ZFP36 during HSC ferroptosis, our results showed a novel function of ZFP36 in addition to regulating inflammation, proliferation, and apoptosis.
Notably, many recent studies highlight the importance of autophagy as an emerging mechanism of ferroptosis, and also raise new insights regarding regulated cell death [Citation52–Citation54]. Mechanistically, selective autophagy (namely ferritinophagy) contributes to ferroptosis by mediating the degradation of ferritin. Further quantitative proteomics identifies NCOA4 as the cargo receptor responsible for ferritin degradation by ferritinophagy [Citation25]. Interestingly, Du et al. reported that dihydroartemisinin inhibits proliferation and induces ferroptosis of leukemia cells through autophagy-dependent degradation of ferritin [Citation55]. Moreover, Kong et al. showed that ferritinophagy-mediated HSC ferroptosis is responsible for artesunate induced anti-fibrosis efficacy, which provide new clues for further pharmacological study of artesunate [Citation46]. Furthermore, Kang et al. revealed that autophagy key molecule BECN1 is a new driver of ferroptosis [Citation22]. Further molecular mechanism studies found that AMP-activated protein kinase (AMPK) is required for BECN1 phosphorylation to trigger formation of the BECN1-SLC7A11 complex in the process of inhibiting SLC7A11 activity and inducing lipid peroxidation [Citation22]. Additionally, Gao et al. demonstrated that ferroptosis is an autophagic cell death process [Citation56]. Using RNAi screening coupled with subsequent genetic analysis, they identified multiple autophagy-related genes as positive regulators of ferroptosis [Citation56]. Of note, we recently also found that activation of ferritinophagy is required for the RBP ELAVL1 to regulate ferroptosis in HSCs [Citation17]. On the basis of previous studies, the current results showed that RBP ZFP36 protected against ferroptosis by regulating autophagy signaling pathway in HSCs. Although a large number of studies have confirmed that autophagy can fight against liver fibrosis by promoting HSC ferroptosis, we should also pay attention to the profibrotic properties of autophagy in liver fibrosis. Hernández-Gea et al. offered a surprising discovery that autophagy is the missing link underlying lipid droplet release, by stimulating metabolism of their contents to provide the energy vital to fuel HSC activation [Citation57]. Meanwhile, Li et al. also showed that HMGB1 (high mobility group box 1)-induced fibrogenesis is dependent on its autophagy-inducing effects [Citation58]. Moreover, Tan et al. found that ARRB1 (arrestin beta 1) enhances liver fibrosis through autophagy-mediated snail signaling [Citation59]. Overall, the effect of autophagy on liver fibrosis is complex. The exact role of autophagy in liver fibrosis should be discussed by distinguishing different pathological stages and cell types of liver fibrosis.
Interestingly, recent studies have highlighted the key role of ATG16L1 in autophagy [Citation60,Citation61]. ATG16L1 interacts with the ATG12–ATG5 protein conjugate through its N-terminal domain and self-assembles through its coiled-coil domain (CCD) [Citation60,Citation61]. Further functional studies showed that the mammalian ATG12–ATG5-ATG16L1 complex has been shown to specify the lipidation site of LC3, a mammalian ATG8 orthologue, through interaction with ATG3 and other factors on the membrane [Citation62]. Attractively, Xiong et al. recently reported that ATG16L1 mediates the autophagic degradation of the 19S proteasomal subunits PSMD1 (proteasome 26S subunit, non-ATPase 1) and PSMD2 [Citation63]. Moreover, Morozova et al. showed that ANXA2 (annexin A2) promotes phagophore assembly by enhancing ATG16L1-positive vesicle biogenesis and homotypic fusion [Citation64]. Furthermore, Parkhouse et al. found that the N-terminal region of the human autophagy protein ATG16L1 contains a domain that folds into a helical structure consistent with formation of a coiled-coil [Citation65]. In addition, Song et al. revealed that ATG16L1-mediated autophagy is required for the encystation of amoeba [Citation66]. In the current study, we found that ZFP36 conferred resistance to ferroptosis by inhibiting ATG16L1 mRNA expression. ATG16L1 overexpression could completely impair ZFP36-induced autophagy inactivation and ferroptosis resistance. More in-depth sequence analyses identified a 9-nucleotide consensus sequence, UUAUUUAUU, in the 3ʹ-UTR of the ATG16L1 mRNA sequence, which represent the canonical class II sequence recognized by ZFP36 protein. Mutations in this key sequence could block the interaction between ZFP36 and ATG16L1 mRNA, and also prevented the inhibition of ZFP36 on ferroptosis.
Attractively, NCOA4 is identified as a specific cargo receptor for autophagy, which interacts with LC3B protein to deliver selective cargo to the autophagosome [Citation67,Citation68]. Characterization of GFP-labeled NCOA4 showed puncta accumulation that tended to localize with LC3B-positive puncta in response to chloroquine treatment [Citation68,Citation69]. Moreover, in vitro binding assay fully confirmed the interaction between NCOA4 and LC3B [Citation67,Citation68]. It is generally known that lipidated LC3B binds to the growing membrane of autophagosomes and contributes to its elongation and fusion and also acts as a recruitment platform for autophagic molecular machinery [Citation69–Citation71]. Thus, the mechanism of NCOA4-ferritin trafficking to the lysosome may depend on the classical LC3-mediated autophagic delivery system. Meanwhile, it is also notable that the ATG16L1 complex delivers LC3 to the forming autophagosome and subsequently LC3 functions in the closing of the autophagosome [Citation44,Citation60,Citation72]. In Atg16l1-deficient mouse embryonic fibroblast, the ATG12–ATG5 conjugate could not be recruited to the phagophore, which resulted in a loss of LC3 lipidation [Citation73]. Although more experiments are needed to determine the exact function of ATG16L1, we cautiously and conservatively assume that ATG16L1 may play a role in NCOA4-dependent ferritinophagy.
Noteworthy, we retrospectively analyzed consecutive advanced fibrotic patients with HCC who were treated with sorafenib monotherapy in the Nanjing Hospital Affiliated to Nanjing University of Chinese Medicine between September 2014 and December 2018. Interestingly, sorafenib monotherapy contributes to ZFP36 downregulation, autophagy activation, and ferroptosis induction in human HSCs from the collected human liver tissue. However, it should be stressed in particular that our study has several limitations. First, this was a single-center retrospective study rather than a nationwide investigation, which limits the generalizability of our data. The results obtained from this study need to be verified in a multicenter study with a large sample size. Second, the number of patients subjected to liver biopsy was relatively small. Although liver biopsy remains the gold standard in the diagnosis of several liver disorders, many patients did not have the physical conditions required for the operation, and were also mentally reluctant to undergo surgery. Third, potential bias in the selection of samples is inherent to the retrospective nature. The most suitable clinical samples are fibrotic patients who were treated with sorafenib monotherapy. However, the oral multikinase inhibitor sorafenib has been clinically approved for the treatment of HCC. Therefore, fibrotic patients with HCC were included in the retrospective cohort study. Importantly, to minimize the risk of selection bias, primary human HSCs were isolated from the collected liver tissue samples for detection of ferroptosis markers. Given that HSCs are the most principal cellular players promoting synthesis and deposition of extracellular matrix proteins in liver fibrosis, it is reasonable that the results of isolated HSCs are mainly related to liver fibrosis.
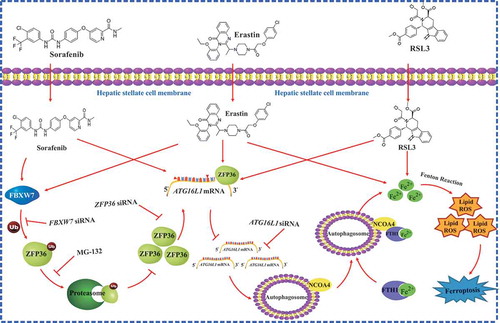
In summary, the interaction of ZFP36 and ATG16L1 mRNA served as a crucial event that inhibited autophagy activation, limited autophagic ferritin degradation, and eventually conferred resistance to ferroptosis (). Further analyses of post-transcriptional regulation mechanisms of ferroptosis may provide new diagnostic and therapeutic approaches to regulate HSC survival and death in liver fibrosis.
Figure 10. RNA-binding protein ZFP36 protects against ferroptosis by regulating autophagy signaling pathway in HSCs. ZFP36 overexpression can result in ATG16L1 mRNA decay via binding to the AREs in the 3ʹ-UTR, thus triggering autophagy inactivation, blocking autophagic ferritin degradation, and eventually conferring resistance to ferroptosis.
Materials and methods
Human liver specimens
We retrospectively analyzed 28 liver biopsy samples from cirrhotic patients who did not receive any treatment, and 18 partial hepatectomy samples from cirrhotic patients complicated with HCC who received sorafenib monotherapy (Nexavar; Bayer Healthcare Pharmaceuticals, Leverkusen, Germany) in Nanjing Hospital Affiliated to Nanjing University of Chinese Medicine between September 2014 and December 2018. The diagnostic criteria for liver cirrhosis and HCC come from the American Association for the Study of Liver Diseases (AASLD) [Citation74]. An initial sorafenib dosage of 400 mg was administered orally twice daily, after breakfast and dinner [Citation75]. Subsequently, discontinuations and dosage reductions of sorafenib were based on tolerance. Treatment was continued until clinical disease progression or unacceptable drug-related toxicity occurred, or upon withdrawal of consent [Citation75]. Informed consent in writing was obtained from patients. Data on patient characteristics were collected retrospectively from all patients by reviewing their electronic medical records. Patient records were scanned for the following information: gender, age, body mass index (BMI), Child-Pugh grade, model for end-stage liver disease (MELD) score, American Society of Anesthesiologists (ASA) class, serum GPT/ALT (glutamic–pyruvic transaminase), GOT1/AST (glutamic-oxaloacetic transaminase 1), ALPL (alkaline phosphatase, biomineralization associated), TBIL (total bilirubin), GGT1 (gamma-glutamyltransferase 1), ALB (albumin), and IGH (immunoglobulin heavy) levels, etiology of liver cirrhosis, treatment and outcome data. For detailed patient characteristics, please refer to . This study protocol conformed to the ethical guidelines of the 1975 Declaration of Helsinki Principles, and was approved by the review committee of the Nanjing University of Chinese Medicine.
Table 1. Patient characteristics used in this study.
Primary human HSC isolation and characterization
Primary human HSCs were isolated from the collected human liver tissue by laser capture microdissection (LCM) as described previously [Citation17,Citation76]. Briefly, frozen human liver tissue was sectioned at 10 μm and stained with immunofluorescence for DES (Abcam, ab15200). Once the tissue was stained, the DES-positive cells were located using specialized microdissection software. Then, a specific CapSure® LCM Cap (Thermo Fisher Scientific, LCM0211) was placed on the section. Pulsing the laser through the cap caused the thermoplastic film to form a thin protrusion that bridges the gap between the cap and tissue and adheres to the DES-positive cells. Lifting of the cap could remove the target cells attached to the cap. Purification and characterization of the obtained human HSCs were confirmed by detection of ACTA2 and PDGFRB (platelet derived growth factor receptor beta).
Animals and experimental design
Fifty-six 8-week-old male C57BL/6 mice were obtained from the Experimental Animal Center of Yangzhou University (Yangzhou, China). Mice were randomly divided into 7 groups of 8 animals each with comparable mean body weight. The randomization was performed using a freely accessible computer program for scientific randomizations at www.randomizer.org. Mice of 7 groups were treated with sham, BDL+VA-Lip-control-vector, BDL+VA-Lip-control-vector+erastin, BDL+VA-Lip-control-vector+sorafenib, BDL+VA-Lip-Zfp36-plasmid, BDL+VA-Lip-Zfp36-plasmid+erastin or BDL+VA-Lip-Zfp36-plasmid+sorafenib. A midline laparotomy was performed, and the common bile duct was ligated close to the liver hilus immediately below the bifurcation with 3–0 surgical silk and cut between the ligatures as described previously [Citation17]. Controls underwent a sham operation that consisted of exposure, but not ligation, of the common bile duct. Erastin (30 mg/kg, once every other day) and sorafenib (10 mg/kg, once every other day) were suspended in sterile phosphate-buffered saline (PBS; Sigma, P5368) and given by intraperitoneal injection for 2 weeks after the BDL operation. VA-Lip-control-vector and VA-Lip-Zfp36-plasmid (0.75 mg/kg) were administered intravenously 3 times a week for 2 weeks after the BDL operation. The livers were collected 2 weeks after surgery under general anesthesia. A small portion of the liver was removed for histopathological studies by fixation with 10% formalin and subsequent embedment with paraffin. The remaining liver was cut in pieces and rapidly frozen with liquid nitrogen for extraction of total RNA. All experimental procedures were approved by the institutional and local committee on the care and use of animals of Nanjing University of Chinese Medicine (Nanjing, China), and all animals received humane care according to the National Institutes of Health (USA) guidelines.
Histological analyses
The liver tissue samples were immobilized in fixation buffer (Thermo Fisher Scientific, 28906) for 2 d, and then were transferred to ethanol of different concentration and embedded in paraffin in preparation for histopathological analyses. 4 μm thin sections were stained with H&E, Sirius red, and Masson for histological study. H&E, Sirius red, and Masson-stained areas from 10 random fields were quantified with ImageJ software (NIH, Bethesda, MD, USA). The liver fibrosis stage was assessed by Ishak scale [Citation77].
Primary hepatocyte isolation and characterization
Primary mouse hepatocytes were isolated from mouse liver according to our previous reports [Citation17]. Briefly, the livers of the mice were first perfused in situ via the portal vein with Ca2+- and Mg2+-free Hanks’ balanced salt solution (HBSS; Sigma, H1641) supplemented with 0.5 mM EGTA (Sigma, E3889) and 25 mM HEPES (Sigma, H3375) at 37.8°C. Then, the buffer was replaced with 0.1% collagenase I solution (Sigma, C0130) in HBSS (containing 4 mM CaCl2, 0.8 mM MgSO4). After a few minutes of perfusion, the liver was excised rapidly from the body cavity and dispersed into cold HBSS. The cell suspension generated was filtered through a sterile 70 μm pore size nylon cell strainer (Sigma, CLS431751) and spun 3 times at 30 × g for 4 min. The pellets were suspended in Dulbecco’s modified essential medium (DMEM; Gibco, 12491–015) containing 10% fetal bovine serum (FBS; Gibco, 10099141) for primary hepatocyte culture. Purification and characterization of the obtained hepatocytes were confirmed by detection of ALB.
Primary HSC isolation and characterization
Primary mouse HSCs were isolated from the mouse liver according to our previous reports [Citation17]. Briefly, the livers of the mice were first perfused in situ with DMEM-free containing 1 mg/ml collagenase IV (Vetec, V900893) and 2 mg/ml pronase (Roche, PRON-RO) following HBSS including 0.5 mM EDTA (Sigma, E6758). After a few minutes of perfusion, the livers were removed, and the digested hepatic cells were dispersed in DMEM-free. Next, DNase enzymes (Sigma, D4263) were added to prevent filamentous gelatinous material, and the undigested debris was removed through a filter. The filtrates were centrifuged at 50 × g in a centrifuge tube for 5 min at 4°C. The supernatant was collected following gradient centrifugation with 25% Nycodenz (Sigma, D2158) to isolate primary HSCs. Cells were washed and plated on 60 mm diameter tissue culture dishes (Sigma, CLS430599). Purification and characterization of the obtained HSCs were confirmed by detection of ACTA2 and PDGFRB.
Primary liver macrophage isolation and characterization
Primary mouse macrophages were isolated from mouse liver according to our previous reports [Citation17]. Briefly, the livers of the mice were first perfused in situ with Ca2+- and Mg2+-free HBSS containing 2.5 mM EGTA via portal vein and then they were perfused again with 0.05% collagenase I HBSS solution. Digested livers were dissected and then gently teased with forceps until they were in solution. The cell suspensions were filtered through a 70-μm nylon cell strainer. Nonparenchymal cells were separated from the hepatocytes by 1 cycle of differential centrifugation (300 × g for 5 min). The supernatant was centrifuged further (300 × g for 5 min and 2 cycles of 1200 × g for 5 min) to obtain nonparenchymal cells. The obtained nonparenchymal cells were resuspended in DMEM with 2% FBS, and separated by centrifugation on a 25%-50% Percoll (Sigma, P4937) gradient. The macrophage fraction located at the interface of the 25%-50% Percoll layer was seeded in DMEM containing 10% FBS and 10 mM HEPES. Purification and characterization of the obtained macrophages were confirmed by detection of ADGRE1 (adhesion G protein-coupled receptor E1).
Primary liver sinusoidal endothelial cell isolation and characterization
Primary mouse liver sinusoidal endothelial cells were isolated from mouse liver according to a reported protocol [Citation78]. Briefly, the livers of the mice were first washed with serum-free DMEM, minced into small pieces with a sterilized razor blade in a 60 mm tissue culture dish, and digested with 2 ml of collagenase I (Sigma, C0130) at 37°C. After digestion, cells were rinsed with 5 ml of DMEM containing 10% FBS, centrifuged for 5 min at 400 × g, and resuspended in 5 ml of DMEM with 10% FBS. After filtration through a double layer of 70 μm pore size nylon cell strainer (Sigma, CLS431751), cells were centrifuged at 400 × g for 10 min and rinsed twice with DMEM containing 10% FBS. Cells were re-suspended in 1 ml of DMEM with 10% FBS and incubated with magnetic-beads coated with anti-PECAM1/CD31 (platelet and endothelial cell adhesion molecule 1) antibody (Abcam, ab28364) for 1 h at 4°C on a rocker. After incubation, cells bound to the magnetic beads were collected with a magnetic tube holder and washed 6 times with 1 ml of DMEM containing 10% FBS. Purification and characterization of the obtained macrophages were confirmed by detection of PECAM1.
Reagents and antibodies
Erastin (S7242), sorafenib (S7397), RSL3 (S8155), MG-132 (S2619), liproxstatin-1 (S7699), Z-VAD-FMK (S7023), necrostatin-1 (S8037), ferrostatin-1 (S7243), necrostatin-1 (S8037), 3-MA (S2767), and bafilomycin A1 (S1413) were purchased from Selleck Chemicals. CHX (C7698), ActD (129935), DRB (D1916), and DMSO (156914) were purchased from Sigma-Aldrich. Opti MEM medium (51985034), phosphate-buffered saline (10010023), and trypsin-EDTA (25200114) were bought from Gibco BRL. Primary antibody against ZFP36 (sc-376162) and ATG16L1 (sc-393274) were bought from Santa Cruz Biotechnology. Primary antibodies against ubiquitin (ab7780), FBXW7 (ab109617), ATG3 (ab108251), ATG4A (ab108322), ATG12-ATG5 (ab108327), BECN1 (ab227107), ATG7 (ab133528), ATG9A (ab108338), LC3-I/II (ab128025), FTH1 (ab65080), and NCOA4 (ab86707) were purchased from Abcam Technology. Primary antibodies against ACTB (4970), GAPDH (2118), anti-rabbit IgG (7054), and anti-mouse IgG (7076) were purchased from Cell Signaling Technology.
Plasmid construction
ZFP36 shRNA plasmid (sc-36760-SH, sc-36761-SH), FBXW7 shRNA plasmid (sc-37547-SH, sc-37548-SH) and empty vector were purchased from Santa Cruz Biotechnology. The pcDNA3.1-ZFP36 plasmid (NM_003407.4, NM_133290.3), pcDNA3.1-FBXW7 plasmid (NM_001013415.2, NM_ 001004448.2), pcDNA3.1-ATG16L1 plasmid (NM_030803.7, NM_029846.4), and control vector were obtained from Hanbio (KW20180601RFF-LP05). pGM-CMV-GFP-hLC3 (GM-1314P101H) and CMV-TurboRFP-EGFP-LC3-PGK-Puro plasmid (GM-1314L204H-S) were purchased from Genomeditech (Shanghai, China). VA-Lip-Zfp36-plasmid and VA-Lip-control-vector were prepared according to our previous reports [Citation17]. Briefly, 5 mg VA (Sigma-Aldrich, 95144) was added into 50 μl DMSO to form VA solution. 280 nmol VA solution and 0.14 μmol lipotrust solution (Hokkaido System Science, LEO-01) were mixed by vortexing in a 1.5 ml tube (Thermo Scientific, AM12450) at 25°C. 12.24 nmol control-vector or Zfp36-plasmid was added into VA-Lip solution with stirring at 25°C. The VA-Lip solution was filtered. Fractions were collected and the material trapped in the filter (Thermo Scientific, 596–3320) was reconstituted with PBS to achieve the desired dose for in vivo use.
Construction of ZFP36 Δ186-192 plasmid
The ZFP36 Δ186-192 plasmid was constructed according to a reported protocol [Citation79]. Briefly, the truncated mutant of ZFP36 residues 186–192 (SESGLPS) was prepared by polymerase chain reaction using the following primer pairs: 5ʹ-CTTCGCCAGAGCATCGGCCGCCGGACCTCA-3ʹ (forward), and 5ʹ-TGAGGTCCGGCGGCCGATGCTCTGGCGAAG-3ʹ (reverse). The PCR products were digested with EcoRI/XhoI and cloned into the corresponding sites of plasmid of pcDNA-3.1. The fidelity of the sequence was confirmed with DNA sequencing.
Construction of full-length ATG16L1 plasmid
ATG16L1 plasmid was designed to express full-length ATG16L1 mRNA containing its 3ʹ-UTR according to a reported protocol [Citation80]. Briefly, total RNA was isolated from HSC cells using RNA isolation kit (Thermo Scientific, 10296010) and reversed transcribed into cDNA by cDNA synthesis kit (Thermo Scientific, K1651) according to the manufacturer’s instruction. Primer sequences were as follows: 5ʹ-CGCAATTCAGACCGTCCCGGATGGCCT-3ʹ (forward), 5ʹ-GCTCTAGATTTGAAAAGTATATA ACAG-3ʹ (reverse). Forward and reverse primers containing EcoRI (forward) and XbaI (reverse) restriction enzyme recognition sites were designed for amplification of full-length ATG16L1 cDNA. Using Platinum™ Taq DNA Polymerase High Fidelity enzyme (Thermo Scientific, 11304029), the full-length ATG16L1 cDNA was amplified by RT-PCR. PCR conditions included a denaturation step of 5 min at 95°C, followed by 33 cycles of 30 s at 95°C, 30 s at 55°C and 155 s at 72°C, and a final extension step of 7 min at 72°C. The ATG16L1 amplified cDNA was inserted into the mammalian expression vector pcDNA3.1 (Invitrogen, V79020) in the sense orientation, and was used for transformation of DH5α competent Escherichia coli cells (Thermo Scientific, EC0112). Then, the LB agar medium containing 100 μg/ml ampicillin (Invitrogen, Q60120) was used to screen the recombinant bacteria. Finally, the presence of the insert was established and the fidelity of the ATG16L1-cloned sequence was confirmed with DNA sequencing.
Construction of stable cell lines
Stable cell lines were constructed according to a reported protocol [Citation81]. Briefly, the HSC cells were seeded in 24 well culture plates (Sigma, CLS3527) at a density of 5 × 10⁴ cells/well and cultured with DMEM supplemented with 10% FBS. Before transfection, lentivirus stocks were diluted with cell culture medium at a ratio of 1:10 and polybrene (Sigma-Aldrich, 107689) was added to a final concentration of 6 μg/ml. When cell density reached about 50% confluence, the medium was replaced with the diluted lentivirus stock solution containing 6 μg/ml polybrene (Sigma-Aldrich, 107689). The HSC cells were further cultured at 37°C, 5% CO2 for 24 h. After exchanging the solution with fresh DMEM supplemented with 10% FBS, the HSC cells were incubated for an additional 24 h at 37°C, 5% CO2. Approximately 48 h after the beginning of the transfection, the HSC cells were digested with 0.03% trypsin (Sigma-Aldrich, T2600000) and the cell suspensions were seeded in 10 cm culture dishes (Sigma-Aldrich, Z358762) at a density of about 500 cells/dish. Puromycin (Thermo Scientific, A1113803) was added to a final concentration of 5 μg/ml. Fresh puromycin-containing medium was exchanged every 3 d. After continuous selection with puromycin for approximately 3 weeks, the surviving cell colonies were picked using cloning rings, and then were expanded and subcloned using the limiting dilution method. The efficacy of overexpression and knockdown was verified by real-time PCR and western blot.
Cell culture conditions and drug treatment
HSC-T6 (BNCC337976) and HSC-LX2 (BNCC337957) cells were obtained from BeNa culture collection (Beijing, China). Cells were cultured in DMEM with 10% FBS, 1% antibiotics, and maintained at 37°C in a humidified incubator of 5% CO2 and 95% air. Erastin, sorafenib, and RSL3 were dissolved in DMSO at a concentration of 10 mM and stored in a dark-colored bottle at −20°C. The stock was diluted to the required concentration with DMSO when needed. Prior to the drug treatment, cells were grown to 70% confluence, and then exposed to drug at different concentrations (0–10 μM) for different periods of time (0–24 h). Cells grown in a medium containing an equivalent amount of DMSO without drugs served as a control.
Cell viability assay
The cell viability was assessed using a CCK8 Cell Counting Kit (Beyotime Institute of Biotechnology, C0042) according to the manufacturer’s instructions.
Lipid peroxidation assay
The lipid peroxidation product MDA concentration in cell lysates was assessed using a Lipid Peroxidation Assay Kit (Abcam, ab118970) according to the manufacturer’s instructions.
Iron assay
The relative iron concentration in cell lysates was assessed using an Iron Assay Kit (Abcam, ab83366) according to the manufacturer’s instructions.
Glutathione assay
The relative GSH concentration in cell lysates was assessed using a Glutathione Assay Kit (Sigma, CS0260) according to the manufacturer’s instructions.
Reactive oxygen species assay
Intracellular ROS level was measured using an oxidation-sensitive fluorescent probe DCFH-DA (Sigma, D6883) according to the manufacturer’s instructions.
Trypan blue staining
HSC-LX2 cells were cultured in 6-well plates (Sigma, CLS3516) for 24 h and then treated with vehicle, sorafenib, sorafenib+ZVAD-FMK, sorafenib+necrosulfonamide, and sorafenib+ferrostatin-1. After the indicated treatment times, cell suspension and 0.4% trypan blue solution (Sigma, T8154) were mixed in 9:1 ratio. After 3 min, the counting plate containing the live cells (no cytoplasmic fluorescence) and dead cells (blue cytoplasmic fluorescence) were counted. The trypan blue-positive ratio from 10 random fields was quantified with ImageJ software.
Fluorescein diacetate staining
After the indicated treatment, HSC-LX2 cells were rinsed twice with sterile HBSS, incubated in 10 ml of FDA working solution (10 mg/mL; Sigma, F7378) at 37°C for 15 min, and then washed twice with HBSS. Subsequently, HSC-LX2 cells were observed and photos were taken using an inverted fluorescence microscope (Leica, Germany). FDA-positive ratio from 10 random fields was quantified with ImageJ software.
Calcein-AM/PI fluorescence staining
After the indicated treatment, HSC-LX2 cells were washed twice with PBS, and a solution of 2 μmol/L calcein-AM and 4.5 μmol/L propidium iodide (Sigma, 04511) was added to the culture wells, and incubated at 37°C in the dark for 20 min. Living cells (green cytoplasmic fluorescence) and dead cells (red nucleus) were observed in an inverted fluorescence microscope (Leica, Germany). Live:dead cell ratio from 10 random fields was quantified with ImageJ software.
Immunofluorescence
HSC-LX2 cells were seeded in 6-well plates and cultured in DMEM supplemented with 10% FBS for 24 h, followed by treatment with drugs for the indicated time periods. Then, HSC-LX2 cells were incubated with antibody against LC3 (Abcam, ab48394) at 4°C overnight followed by incubation with FITC-labeled goat anti-rabbit IgG (Cell Signaling Technology, 7054) for 1 h at room temperature. 4ʹ,6-Diamidino-2-phenylindole (DAPI; Sigma-Aldrich, D9542) was used to stain the nucleus in cells. All the images were captured with the fluorescence microscope and representative images were shown. The software ImageJ was used to quantitate the fluorescent intensity on the micrographs.
Western blot and immunoprecipitation
For western blot analyses, HSC cells were washed three times with PBS and then used for extraction of total proteins. Protein extracts were prepared by mammalian lysis buffer (Sigma-Aldrich, MCL1). Protein concentrations were measured by the Pierce™ BCA Protein Assay Kit (Thermo Scientific, 23250). Protein extracts were separated by SDS-PAGE (Sigma-Aldrich, PCG2001) and transferred onto polyvinylidene fluoride (PVDF) membranes (Sigma-Aldrich, P2938). Then the PVDF membranes were blotted individually with appropriate primary antibodies and appropriate secondary antibodies. Protein bands were visualized using the chemiluminescence system (Merck Millipore, Darmstadt, Germany). Densitometry analyses were performed using ImageJ software. For immunoprecipitation assay, HSC cells were lysed and sonicated in RIPA buffer (Sigma-Aldrich, R0278) for 30 min at 4°C. The homogenates were centrifuged for 30 min at 13,800 × g. at 4°C. About 10% of the supernatant was harvested for western blot analysis as inputs, while the remaining cell lysate was incubated with indicated antibodies overnight at 4°C. Protein A/G plus agarose beads (Santa Cruz Biotechnology, sc-2003) were added at 4°C for another 2 h. The immunoprecipitation beads were washed with lysis buffer for 5 times, followed by western blot analysis. Every experiment was repeated at least three times independently, and all the band detection is within the linear range.
Ubiquitination assay
Ubiquitination assay was preformed according to a reported protocol [Citation82]. Briefly, HSC cells were washed with PBS and lysed in two pellet volumes of RIPA buffer (Sigma-Aldrich, R0278) supplemented with protease inhibitors 10 µM MG-132 (Sigma-Aldrich, M7449) and 10 mM N-Ethylmaleimide (NEM; Sigma-Aldrich, E3876). Cell lysates were sonicated, boiled at 95°C for 5 min, diluted with RIPA buffer containing 0.1% SDS, then centrifuged at 4°C at 16 × 103 × g for 15 min. The supernatant was incubated with an anti-ZFP36 antibody (Santa Cruz Biotechnology, sc-376162) and protein A-Sepharose (Thermo Scientific, 101090) for 3 h at 4°C. After extensive washing, bound proteins were eluted with 2× SDS sample buffer (Thermo Scientific, LC1676) and separated on a SDS-PAGE (Sigma-Aldrich, PCG2001). The ubiquitinated proteins were detected by western blot using an anti-ubiquitin antibody (Abcam Technology, ab7780).
Cycloheximide chase assay
To evaluate whether erastin destabilized ZFP36 protein, HSC-LX2 cells were treated with 10 μM erastin for 24 h. Subsequently, HSC-LX2 cells were treated with 50 μg/ml CHX (Sigma-Aldrich, C7698) for indicated times and lysed for western blot analyses as described previously [Citation17].
RNA isolation and real-time PCR
Total RNA was isolated and qPCR performed using the QuantiTect SYBR Green PCR Kit (Qiagen, 204141) in accordance with the manufacturer’s instructions. ACTB levels were taken for normalization and fold change was calculated using 2−ddCt. Every experiment was repeated at least three times independently.
Transmission electron microscopy
HSC-LX2 cells were seeded onto 4-well Chambered Coverglass (Thermo Scientific, 155382) at a density of 2 × 10⁴ cells/mL (14,000 cells/well). Images were acquired using the Olympus EM208S transmission electron microscope.
RNA-seq and computational analyses
After the indicated treatment, HSC-LX2 cells were collected and lysed with Trizol reagent (Sigma, T9424). RNA (1 μg) was used for library preparation with TruSeq Stranded Total RNA with Ribo-Zero Gold kit (Illumina, MRZG12324). The sequenced reads were aligned to the human reference genome (GRCh38.p10) using TopHat v1.4.1. Differential gene expression was performed with EdgeR (Empirical analyses of digital gene expression data in R) version 3.08. Adjusted P values were computed using the Benjamini-Hochburg method. The threshold we used to screen upregulated or downregulated mRNAs was fold change >2 and Adjusted P < 0.05.
RNP IP
The immunoprecipitation of endogenous ribonucleoprotein complexes was analyzed using Imprint® RNA Immunoprecipitation Kit (Sigma, RIP-12RXN) according to the manufacturer’s instructions.
GST affinity isolation
The synthesis of biotinylated transcripts and analyses of RNA binding proteins bound to biotinylated RNA were performed as described previously [Citation17]. Approximately 8 × 10⁶ cells were washed twice with PBS, harvested and lysed in Cell Lysis Buffer (Cell Signaling Technology, 9803) plus complete protease inhibitor cocktail (Sigma, P8340). 9 μg biotinylated transcripts were incubated with 120 μg cytoplasmic lysates for 30 min at room temperature. Complexes were isolated with paramagnetic streptavidin-conjugated Dynabeads (Dynal, 11206D) and analyzed by western blot.
Luciferase reporter system construction
The construction of chimeric firefly luciferase reporter plasmids were generated as described previously [Citation17]. Briefly, the 3ʹ-UTR of human ATG16L1, TNF, and ACTB mRNA were subcloned into the pGL3-Luc plasmid (Promega, E1751) at the Xba1 site to generate the chimeric pGL3-Luc-ATG16L1-3ʹ-UTR, pGL3-Luc-TNF-3ʹ-UTR, and pGL3-Luc-ACTB-3ʹ-UTR reporter construct. The sequence and orientation of the luciferase reporter were verified by sequencing and enzyme digestion. Primers for the luciferase reporter system constructs or for deleting the fragments are available on request. The luciferase reporter constructs were transfected in cells along with phRL-null (luciferase control reporter vector; Promega, E2231) to monitor transfection efficiencies as described. Luciferase activity was measured using the Dual Luciferase Assay System (Promega, E1910).
Statistical analysis
Individual cell experiments and animal experiments were performed in duplicate or triplicate and repeated 3 times using matched controls, and the data were pooled. Data were expressed as mean ± standard error of the mean (SEM). Statistical analysis were performed using either Student’s t-test (two-group comparison) or one-way analyses of variance followed by Student-Newman-Keuls test (more than two groups). In the retrospective cohort study, quantitative values were expressed as means with standard deviations or medians with range, while categorical values were expressed as numbers with percentages. Categorical variables were analyzed using the chi-squared test or Fisher’s exact test as appropriate. Continuous variables were analyzed using the paired t-test or Wilcoxon tests as appropriate. In all analyses, a probability of less than 0.05 was considered to indicate statistical significance. All statistical analyses were performed using the SPSS program (version 20.0; IBM, Somers, NY, USA).
Supplemental Material
Download Zip (15.2 MB)Acknowledgments
Most importantly, I sincerely thank my wife (Mei Guo) for her support and encouragement in a difficult period. I shall love you as long as I have breath.
Supplemental Material
Supplemental data for this article can be accessed on the publisher's website.
Disclosure statement
No potential conflict of interest was reported by the authors.
Additional information
Funding
Related Research Data
References
- Zhang K, Han X, Zhang Z, et al. The liver-enriched lnc-LFAR1 promotes liver fibrosis by activating TGFβ and notch pathways. Nat Commun. 2017;8:144.
- De Magalhaes Filho CD, Downes M, Evans R. Bile acid analog intercepts liver fibrosis. Cell. 2016;166:789.
- Ding BS, Cao Z, Lis R, et al. Divergent angiocrine signals from vascular niche balance liver regeneration and fibrosis. Nature. 2014;505:97–102.
- Kostallari E, Hirsova P, Prasnicka A, et al. Hepatic stellate cell-derived platelet-derived growth factor receptor-alpha-enriched extracellular vesicles promote liver fibrosis in mice through SHP2. Hepatology. 2018;68:333–348.
- Gandhi CR. Hepatic stellate cell activation and pro-fibrogenic signals. J Hepatol. 2017;67:1104–1105.
- Chen Y, Choi SS, Michelotti GA, et al. Hedgehog controls hepatic stellate cell fate by regulating metabolism. Gastroenterology. 2012;143:1319–1329.
- Xiang DM, Sun W, Ning BF, et al. The HLF/IL-6/STAT3 feedforward circuit drives hepatic stellate cell activation to promote liver fibrosis. Gut. 2018;67:1704–1715.
- Caviglia JM, Yan J, Jang MK, et al. MicroRNA-21 and dicer are dispensable for hepatic stellate cell activation and the development of liver fibrosis. Hepatology. 2018;67:2414–2429.
- Zhang F, Lu S, He J, et al. Ligand activation of PPARγ by ligustrazine suppresses pericyte functions of hepatic stellate cells via SMRT-mediated transrepression of HIF-1α. Theranostics. 2018;8:610–626.
- Zhang Z, Guo M, Zhao S, et al. ROS-JNK1/2-dependent activation of autophagy is required for the induction of anti-inflammatory effect of dihydroartemisinin in liver fibrosis. Free Radic Biol Med. 2016;101:272–283.
- Lian N, Jin H, Zhang F, et al. Curcumin inhibits aerobic glycolysis in hepatic stellate cells associated with activation of adenosine monophosphate-activated protein kinase. IUBMB Life. 2016;68:589–596.
- Xu W, Lu C, Zhang F, et al. Dihydroartemisinin counteracts fibrotic portal hypertension via farnesoid X receptor-dependent inhibition of hepatic stellate cell contraction. Febs J. 2017;284:114–133.
- Bian M, Chen X, Zhang C, et al. Magnesium isoglycyrrhizinate promotes the activated hepatic stellate cells apoptosis via endoplasmic reticulum stress and ameliorates fibrogenesis in vitro and in vivo. Biofactors. 2017;43:836–846.
- Jia Y, Wang F, Guo Q, et al. Curcumol induces RIPK1/RIPK3 complex-dependent necroptosis via JNK1/2-ROS signaling in hepatic stellate cells. Redox Biol. 2018;19:375–387.
- Zhang Z, Yao Z, Zhao S, et al. Interaction between autophagy and senescence is required for dihydroartemisinin to alleviate liver fibrosis. Cell Death Dis. 2017;8:e2886.
- Zhang Z, Zhao S, Yao Z, et al. Autophagy regulates turnover of lipid droplets via ROS-dependent Rab25 activation in hepatic stellate cell. Redox Biol. 2017;11:322–334.
- Zhang Z, Yao Z, Wang L, et al. Activation of ferritinophagy is required for the RNA-binding protein ELAVL1/HuR to regulate ferroptosis in hepatic stellate cells. Autophagy. 2018;14:2083–2103.
- Wang L, Zhang Z, Li M, et al. P53-dependent induction of ferroptosis is required for artemether to alleviate carbon tetrachloride-induced liver fibrosis and hepatic stellate cell activation. IUBMB Life. 2019;71:45–56.
- Dixon SJ, Lemberg KM, Lamprecht MR, et al. Ferroptosis: an iron-dependent form of nonapoptotic cell death. Cell. 2012;149:1060–1072.
- Murphy MP. Metabolic control of ferroptosis in cancer. Nat Cell Biol. 2018;20:1104–1105.
- Hassannia B, Vandenabeele P, Vanden Berghe T. Targeting ferroptosis to iron out cancer. Cancer Cell. 2019;35:830–849.
- Kang R, Zhu S, Zeh HJ, et al. BECN1 is a new driver of ferroptosis. Autophagy. 2018;14:2173–2175.
- Song X, Zhu S, Chen P, et al. AMPK-mediated BECN1 phosphorylation promotes ferroptosis by directly blocking system Xc (-) activity. Curr Biol. 2018;28:2388–2399.
- Miess H, Dankworth B, Gouw AM, et al. The glutathione redox system is essential to prevent ferroptosis caused by impaired lipid metabolism in clear cell renal cell carcinoma. Oncogene. 2018;37:5435–5450.
- Hou W, Xie Y, Song X, et al. Autophagy promotes ferroptosis by degradation of ferritin. Autophagy. 2016;12:1425–1428.
- Gaschler MM, Andia AA, Liu H, et al. FINO2 initiates ferroptosis through GPX4 inactivation and iron oxidation. Nat Chem Biol. 2018;14:507–515.
- NaveenKumar SK, SharathBabu BN, Hemshekhar M, et al. The role of reactive oxygen species and ferroptosis in heme-mediated activation of human platelets. ACS Chem Biol. 2018;13:1996–2002.
- Jiang L, Kon N, Li T, et al. Ferroptosis as a p53-mediated activity during tumour suppression. Nature. 2015;520:57–62.
- Hattori K, Ishikawa H, Sakauchi C, et al. Cold stress-induced ferroptosis involves the ASK1-p38 pathway. EMBO Rep. 2017;18:2067–2078.
- Sun X, Ou Z, Chen R, et al. Activation of the p62-Keap1-NRF2 pathway protects against ferroptosis in hepatocellular carcinoma cells. Hepatology. 2016;63:173–184.
- Zhou B, Liu J, Kang R, et al. Ferroptosis is a type of autophagy-dependent cell death. Semin Cancer Biol. 2019. DOI:10.1016/j.semcancer.2019.03.002.
- Bai Y, Meng L, Han L, et al. Lipid storage and lipophagy regulates ferroptosis. Biochem Biophys Res Commun. 2019;508:997–1003.
- Yang M, Chen P, Liu J, et al. Clockophagy is a novel selective autophagy process favoring ferroptosis. Sci Adv. 2019;5:eaaw2238.
- Kim S. A longitudinal study of lipid peroxidation and symptom clusters in patients with brain cancers. Nurs Res. 2018;67:387–394.
- Fallmann J, Sedlyarov V, Tanzer A, et al. AREsite2: an enhanced database for the comprehensive investigation of AU/GU/U-rich elements. Nucleic Acids Res. 2016;44:D90–D95.
- Tiedje C, Diaz-Muñoz MD, Trulley P, et al. The RNA-binding protein TTP is a global post-transcriptional regulator of feedback control in inflammation. Nucleic Acids Res. 2016;44:7418–7440.
- Hausburg MA, Doles JD, Clement SL, et al. Post-transcriptional regulation of satellite cell quiescence by TTP-mediated mRNA decay. Elife. 2015;4:e03390.
- Masias C, Vasu S, Cataland SR. None of the above: thrombotic microangiopathy beyond TTP and HUS. Blood. 2017;129:2857–2863.
- Stockwell BR1, Friedmann Angeli JP, Bayir H, et al. Ferroptosis: a regulated cell death nexus linking metabolism, redox biology, and disease. Cell. 2017;171:273–285.
- Pillai VG, Bao J, Zander CB, et al. Human neutrophil peptides inhibit cleavage of von Willebrand factor by ADAMTS13: a potential link of inflammation to TTP. Blood. 2016;128:110–119.
- Hirschhorn T, Stockwell BR. The development of the concept of ferroptosis. Free Radic Biol Med. 2019;133:130–143.
- Prenzler F, Fragasso A, Schmitt A, et al. Functional analysis of ZFP36 proteins in keratinocytes. Eur J Cell Biol. 2016;95:277–284.
- Carey MF, Peterson CL, Smale ST. PCR-mediated site-directed mutagenesis. Cold Spring Harb Protoc. 2013;2013:738–742.
- Walczak M, Martens S. Dissecting the role of the ATG12-ATG5-ATG16 complex during autophagosome formation. Autophagy. 2013;9:424–425.
- Wang C, Wang H, Zhang D, et al. Phosphorylation of ULK1 affects autophagosome fusion and links chaperone-mediated autophagy to macroautophagy. Nat Commun. 2018;9:3492.
- Kong Z, Liu R, Cheng Y. Artesunate alleviates liver fibrosis by regulating ferroptosis signaling pathway. Biomed Pharmacother. 2019;109:2043–2053.
- Sui M, Jiang X, Chen J, et al. Magnesium isoglycyrrhizinate ameliorates liver fibrosis and hepatic stellate cell activation by regulating ferroptosis signaling pathway. Biomed Pharmacother. 2018;106:125–133.
- Wang H, An P, Xie E, et al. Characterization of ferroptosis in murine models of hemochromatosis. Hepatology. 2017;66:449–465.
- Wu X, Tommasi di Vignano A, Zhou Q, et al. The ARE-binding protein Tristetraprolin (TTP) is a novel target and mediator of calcineurin tumor suppressing function in the skin. PLoS Genet. 2018;14:e1007366.
- Haneklaus M, O’Neil JD, Clark AR, et al. The RNA-binding protein tristetraprolin (TTP) is a critical negative regulator of the NLRP3 inflammasome. J Biol Chem. 2017;292:6869–6881.
- Prabhala P, Bunge K, Ge Q, et al. Corticosteroid-induced MKP-1 represses pro-inflammatory cytokine secretion by enhancing activity of tristetraprolin (TTP) in ASM cells. J Cell Physiol. 2016;231:2153–2158.
- Kang R, Tang D. Autophagy and ferroptosis-what’s the connection? Curr Pathobiol Rep. 2017;5:153–159.
- Sun Y, Zheng Y, Wang C, et al. Glutathione depletion induces ferroptosis, autophagy, and premature cell senescence in retinal pigment epithelial cells. Cell Death Dis. 2018;9:753.
- Wu Z, Geng Y, Lu X, et al. Chaperone-mediated autophagy is involved in the execution of ferroptosis. Proc Natl Acad Sci USA. 2019;116:2996–3005.
- Du J, Wang T, Li Y, et al. DHA inhibits proliferation and induces ferroptosis of leukemia cells through autophagy dependent degradation of ferritin. Free Radic Biol Med. 2019;131:356–369.
- Gao M, Monian P, Pan Q, et al. Ferroptosis is an autophagic cell death process. Cell Res. 2016;26:1021–1032.
- Hernández-Gea V, Friedman SL. Autophagy fuels tissue fibrogenesis. Autophagy. 2012;8:849–850.
- Li J, Zeng C, Zheng B, et al. HMGB1-induced autophagy facilitates hepatic stellate cells activation: a new pathway in liver fibrosis. Clin Sci (Lond). 2018;132:1645–1667.
- Tan S, Lu Y, Xu M, et al. β-Arrestin1 enhances liver fibrosis through autophagy-mediated snail signaling. Faseb J. 2019;33:2000–2016.
- Xiong Q, Li W, Li P, et al. The role of ATG16 in autophagy and the ubiquitin proteasome system. Cells. 2018. DOI:10.3390/cells8010002.
- Xiong Q, Ünal C, Matthias J, et al. The phenotypes of ATG9, ATG16 and ATG9/16 knock-out mutants imply autophagy-dependent and -independent functions. Open Biol. 2015;5:150008.
- Matsushita M, Suzuki NN, Obara K, et al. Structure of ATG5. ATG16, a complex essential for autophagy. J Biol Chem. 2007;282:6763–6772.
- Xiong Q, Fischer S, Karow M, et al. ATG16 mediates the autophagic degradation of the 19S proteasomal subunits PSMD1 and PSMD2. Eur J Cell Biol. 2018;97:523–532.
- Morozova K, Sridhar S, Zolla V, et al. Annexin A2 promotes phagophore assembly by enhancing ATG16L⁺ vesicle biogenesis and homotypic fusion. Nat Commun. 2015;6:5856.
- Parkhouse R, Ebong IO, Robinson CV, et al. The N-terminal region of the human autophagy protein ATG16L1 contains a domain that folds into a helical structure consistent with formation of a coiled-coil. PLoS One. 2013;8:e76237.
- Song SM, Han BI, Moon EK, et al. Autophagy protein 16-mediated autophagy is required for the encystation of acanthamoeba castellanii. Mol Biochem Parasitol. 2012;183:158–165.
- Mancias JD, Wang X, Gygi SP, et al. Quantitative proteomics identifies NCOA4 as the cargo receptor mediating ferritinophagy. Nature. 2014;509:105–109.
- Goodall M, Thorburn A. Identifying specific receptors for cargo-mediated autophagy. Cell Res. 2014;24:783–784.
- Wilkinson DS, Jariwala JS, Anderson E, et al. Phosphorylation of LC3 by the hippo kinases STK3/STK4 is essential for autophagy. Mol Cell. 2015;57:55–68.
- Lee YK, Jun YW, Choi HE, et al. Development of LC3/GABARAP sensors containing a LIR and a hydrophobic domain to monitor autophagy. Embo J. 2017;36:1100–1116.
- Romao S, Münz C. LC3-associated phagocytosis. Autophagy. 2014;10:526–528.
- Romanov J, Walczak M, Ibiricu I, et al. Mechanism and functions of membrane binding by the Atg5-Atg12/Atg16 complex during autophagosome formation. Embo J. 2012;31:4304–4317.
- Saitoh T, Fujita N, Jang MH, et al. Loss of the autophagy protein ATG16L1 enhances endotoxin-induced IL-1beta production. Nature. 2008;456:264–268.
- Muratori L, Muratori P, Lanzoni G, et al. Application of the 2010 American association for the study of liver diseases criteria of remission to a cohort of Italian patients with autoimmune hepatitis. Hepatology. 2010;52:1857.
- Nagai H, Kanekawa T, Kobayashi K, et al. Changes of cytokines in patients with liver cirrhosis and advanced hepatocellular carcinoma treated by sorafenib. Cancer Chemother Pharmacol. 2014;73:223–229.
- Shang L, Hosseini M, Liu X, et al. Human hepatic stellate cell isolation and characterization. J Gastroenterol. 2018;53:6–17.
- Standish RA, Cholongitas E, Dhillon A, et al. An appraisal of the histopathological assessment of liver fibrosis. Gut. 2006;55:569–578.
- Kochan K, Kus E, Filipek A, et al. Label-free spectroscopic characterization of live liver sinusoidal endothelial cells (LSECs) isolated from the murine liver. Analyst. 2017;142:1308–1319.
- Neira JL, Sandí MJ, Bacarizo J, et al. An N-terminally truncated mutant of human chemokine CXCL14 has biological activity. Protein Pept Lett. 2013;20:955–967.
- Matsuo T, Obana E, Yamamoto T, et al. Construction of plasmids suitable for in vitro synthesis of full-length mRNAs having a 3ʹ-poly(A)+tail. Biotechnol Lett. 2009;31:203–207.
- Opefi CA, Tranter D, Smith SO, et al. Construction of stable mammalian cell lines for inducible expression of G protein-coupled receptors. Methods Enzymol. 2015;556:283–305.
- Levy-Cohen G, Blank M. Functional analysis of protein ubiquitination. Anal Biochem. 2015;484:37–39.