
ABSTRACT
Epidemiological and clinical studies have long shown that exposure to high levels of heavy metals are associated with increased risks of neurodegenerative diseases. It is widely accepted that autophagic dysfunction is involved in pathogenesis of various neurodegenerative disorders; however, the role of heavy metals in regulation of macroautophagy/autophagy is unclear. Here, we show that manganese (Mn) induces a decline in nuclear localization of TFEB (transcription factor EB), a master regulator of the autophagy-lysosome pathway, leading to autophagic dysfunction in astrocytes of mouse striatum. We further show that Mn exposure suppresses autophagic-lysosomal degradation of mitochondria and induces accumulation of unhealthy mitochondria. Activation of autophagy by rapamycin or TFEB overexpression ameliorates Mn-induced mitochondrial respiratory dysfunction and reactive oxygen species (ROS) generation in astrocytes, suggesting a causal relation between autophagic failure and mitochondrial dysfunction in Mn toxicity. Taken together, our data demonstrate that Mn inhibits TFEB activity, leading to impaired autophagy that is causally related to mitochondrial dysfunction in astrocytes. These findings reveal a previously unappreciated role for Mn in dysregulation of autophagy and identify TFEB as a potential therapeutic target to mitigate Mn toxicity.
Abbreviations
BECN1: beclin 1; CTSD: cathepsin D; DMEM: Dulbecco’s Modified Eagle Medium; GFAP: glial fibrillary acid protein; GFP: green fluorescent protein; HBSS: hanks balanced salt solution; LAMP: lysosomal-associated membrane protein; LDH: lactate dehydrogenase; Lys Inh: lysosomal inhibitors; MAP1LC3/LC3: microtubule-associated protein 1 light chain 3; MAPK: mitogen-activated protein kinase; Mn: manganese; MTOR: mechanistic target of rapamycin kinase; OCR: oxygen consumption rate; PBS: phosphate-buffered saline; PFA: paraformaldehyde; PI: propidium iodide; ROS: reactive oxygen species; s.c.: subcutaneous; SQSTM1/p62: sequestosome 1; TEM: transmission electron microscopy; TFEB: transcription factor EB
Introduction
Chronic exposure to high levels of manganese (Mn) results in its accumulation in the basal ganglia of the brain, which leads to an extrapyramidal disorder referred to as manganism [Citation1,Citation2]. This disorder is characterized by early stage cognitive and psychiatric symptoms and late stage motor deficits that closely resemble idiopathic Parkinson disease [Citation3,Citation4]. The primary source for Mn toxicity is occupational exposure to Mn containing fumes or dusts, which can occur in mining, welding, smelting and battery manufacturing industries [Citation2,Citation5,Citation6]. Mn overload can occur in general population via consumption of contaminated water [Citation7–Citation9] and inhalation of combusted MMT (an Mn-containing gasoline additive) [Citation10,Citation11].
In the brain, Mn is preferentially deposited in astrocytes through the high-affinity transporter system [Citation12–Citation14]. Consequently, astrocytes have been proposed as a primary site of early damage and dysfunction upon Mn overexposure [Citation15,Citation16]. Cytotoxic levels of Mn interfere with mitochondrial electron transport chain, resulting in disruption of inner membrane potential, reduced ATP production, and generation of reactive oxygen species (ROS) [Citation17,Citation18]. Damaged mitochondria are hazardous due to their ability to generate secondary ROS and amplify the initial oxidative insult, which in turn impairs the healthy mitochondrial population and initiates a self-propagating vicious cycle [Citation19,Citation20]. Therefore, timely and efficient removal of damaged mitochondria by autophagy (mitophagy) is crucial for mitochondrial quality control and maintenance of normal cell functions under pathological stress such as Mn exposure [Citation21–Citation23].
Autophagy is a lysosome-mediated intracellular degradation pathway. In autophagy, cytoplasmic constituents, including proteins and/or organelles, are sequestered in MAP1LC3/LC3 (microtubule associated protein 1 light chain 3)-II-labeled double membranes termed phagophores. Phagophores then elongate and mature into autophagosomes, which fuse with lysosomes, leading to the degradation of vesicular cargoes [Citation24,Citation25]. Autophagy plays an important role in the maintenance of cellular homeostasis through elimination of misfolded proteins and damaged organelles, e.g., mitochondria. Autophagic failure can result in accumulation of dysfunctional mitochondria that not only contributes to bioenergetic deficits but also exacerbates oxidative stress [Citation26]. Indeed, mounting evidence has suggested that dysregulation of autophagy may represent a common pathway leading to mitochondrial dysfunction in several neurodegenerative diseases [Citation27–Citation30].
It is well-established that autophagic failure is a pathologic mechanism in various neurodegenerative diseases. Alterations in autophagy have been reported in cellular models of Mn toxicity [Citation31–Citation33]; however, studies have yet to elucidate the mechanisms underlying the altered autophagy. Using mouse primary astrocytes as a model system, we found that Mn suppressed TFEB (transcription factor EB) activity, which in turn led to inhibition of autophagy flux. The effects of Mn on autophagy were further validated in vivo in striatal astrocytes of a sub-acute Mn-exposed mouse model. Restoration of autophagy by rapamycin or TFEB overexpression partially rectified Mn-induced mitochondrial respiratory deficits, ATP depletion, and excessive mitochondrial ROS production. These findings establish a causal relation between compromised autophagy and mitochondrial dysfunction in Mn toxicity and identify TFEB as a potential therapeutic target for Mn-induced cytotoxicity.
Results
Mn exposure down-regulates autophagy in primary astrocytes
To determine whether Mn exposure affects autophagic activity, we assessed autophagy flux in primary astrocyte cultures exposed to either 100 μM or 500 μM MnCl2. Upon initiation of autophagy, the cytosolic LC3-I is lipidated to form LC3-II, which becomes associated with autophagosomal membrane and subsequently degraded in lysosome as a part of autophagic cargo [Citation34]. We assessed autophagy flux by monitoring rates of LC3-II turnover in presence and absence of lysosomal inhibitors [Citation35] at multiple time points. As shown in and B, we observed that 100 μM Mn decreased net LC3-II flux in a time-dependent manner. At 24 h exposure, 100 μM Mn induced a ~ 50% decrease in LC3-II flux. Comparing with 100 μM, Mn at 500 μM induced a greater reduction in LC3-II flux ( and E), indicating that Mn inhibits autophagic activity in a dose-dependent manner. Notably, cytosolic LC3 (LC3-I) levels were also diminished following Mn exposure ( and F), suggesting that Mn may inhibit LC3 expression at transcriptional level. Since 100 μM MnCl2 was close to estimated threshold (60.1–158.4 μM) of Mn toxicity [Citation36,Citation37], and since this Mn concentration did not induce cell death at 24 h exposure (Figure S1), we used 100 μM Mn for all subsequent experiments.
Figure 1. Mn inhibits autophagy flux in mouse primary astrocyte cultures. (A) Western blots of LC3 in astrocytes exposed to 100 μM Mn for times indicated. Astrocytes were treated with (+)/without (-) lysosomal inhibitors (Lys Inh, 20 mM NH4Cl and 100 μM leupeptin) for the last 2 h. ACTB is used as a loading control. (B) Quantification of LC3-II flux determined by subtracting LC3-II densitometric value of untreated samples (Lys Inh -) from corresponding Lysosomal inhibitors-treated (Lys Inh +) samples (n = 4). (C) Quantification of LC3-I protein levels. (n = 4) (D) Western blots of LC3 in astrocytes exposed to 500 μM Mn for times indicated. (E, F) Summary data show LC3-II net flux (E, n = 4) and LC3-I protein levels (F, n = 4). (G) Western blots of SQSTM1 and K63-linked polyubiquitin in astrocytes treated with 100 μM Mn for 24 h. Bar graphs show summary data (n = 4). (H) Confocal images show immunostaining of SQSTM1 (green) together with astrocyte marker GFAP (red) in primary astrocytes treated with 100 μM Mn for 24 h (Scale bar: 15 μm). Summary data show SQSTM1 florescent puncta intensities. n ≥ 60 astrocytes from 4 experiments involving independent batches of astrocytes cultured from different litters. (I) Confocal images show overlay of MitoTracker Green and LysoTracker Red in live primary astrocytes. Scale bar: 8 μm. (J) Summary data show quantitative analysis of average mitochondrial length. n ≥ 40 astrocytes from 4 experiments. (K) The co-localization is represented by yellow signals and quantified as Pearson’s correlation coefficient. n ≥ 60 astrocytes from 4 experiments. Summary data are normalized to control group except (K). Values reflect means ± SD. *p < 0.05, **p < 0.01.
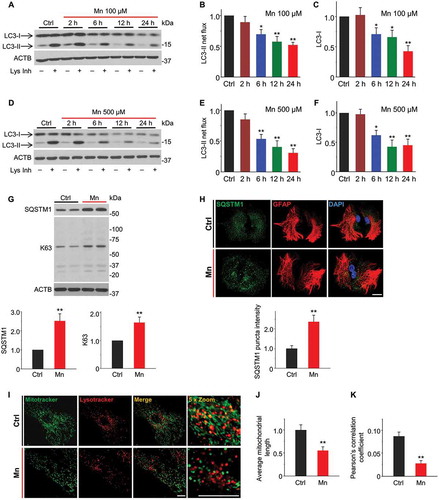
To verify the alterations in autophagy flux in response to Mn treatment, we examined the abundance of two autophagy substrates, SQSTM1/p62 and Lys63 (K63)-linked polyubiquitin chain in astrocytes exposed to MnCl2 (100 μM) for 24 h. Both markers accumulate when the autophagic degradation is impaired [Citation38,Citation39]. We found that Mn significantly increased the accumulation of SQSTM1 and K63-linked ubiquitin chain, indicating a failure in the autophagic-lysosomal degradation (). Concomitantly, immunofluorescence showed a robust increase of SQSTM1-positive puncta in the astrocytes exposed to Mn (). Of note, increased SQSTM1 accumulation was not due to transcriptional activation, since Sqstm1 mRNA levels were not significantly different between control and Mn-treated cells (Figure S2). Taken together, these results demonstrate that Mn exposure inhibits autophagy flux in primary astrocyte culture.
We next investigated whether the Mn-impaired autophagy flux was associated with an inhibition of mitophagy. Toward this end, astrocytes were double stained with MitoTracker Green and LysoTracker Red to label mitochondria and lysosomes, respectively. The co-localizations of green and red fluorescence indicate that mitochondria are sequestered by lysosomes and therefore undergo mitophagy. We observed that Mn perturbed the mitochondrial morphology (, green fluorescence). High magnification images revealed that mitochondria in Mn-treated cells were primarily fragmented with rod-like shape, which was strikingly distinct from the filamentous morphology in control cells. Quantitative analysis () confirmed a significant reduction in average mitochondrial length following Mn exposure. As shown in , Mn-exposed astrocytes exhibited a lower degree of mitochondria-lysosome co-localization, suggesting decreased mitophagy.
Mn impairs lysosomal function in primary astrocytes
Since lysosomal degradation constitutes the final step of autophagy, we next characterized the impact of Mn exposure on lysosomal function in astrocytes. Two fluorescent acidotrophic probes, LysoTracker Red and pH-sensitive LysoSensor Green, were applied to evaluate lysosomal abundance and acidification, respectively. Mn exposure induced a significant decrease in the number of lysosomes, which appear as red puncta in LysoTracker staining (and B). Decreases in lysosome abundance were further confirmed by acridine orange (AO) staining, a dye that emits red fluorescence in acidic organelles (Figure S3). In addition, we observed a reduced fluorescence intensity of LysoSensor Green in Mn-treated cells ( and C), indicative of defective lysosomal acidification. Acidic environment is required for lysosomal enzyme activity, and as a consequence, Mn-treated astrocytes exhibited reduced lysosomal proteolytic activity assessed by cleavage of DQ-BSA (). The altered lysosomal proteolysis was associated with reduced enzymatic activity of CTSD (cathepsin D) from isolated lysosomes in Mn-exposed astrocytes ().
Figure 2. Mn impairs lysosomal function in mouse primary astrocyte cultures. Primary astrocyte cultures were treated with 100 μM Mn for 24 h. (A) Live confocal microscopy of astrocytes stained with LysoTracker Red and LysoSensor Green. Scale bar: 12 μm. (B) Summary data show average number of LysoTracker-stained puncta per cell. (C) Summary data show quantification of LysoSensor fluorescence intensity/puncta area. n ≥ 60 astrocytes from 4 independent experiments in B and C. (D) Lysosomal proteolytic activity measured by DQ-BSA fluorescence intensities (n = 4). (E) CTSD activity (n = 4). (F, G) Confocal images show immunostaining of LAMP1 (F, green) and LAMP2 (G, green) together with GFAP (red) in primary astrocytes (Scale bar: 15 μm). Summary data show LAMP1 and 2 florescent intensities. n ≥ 60 astrocytes from 4 independent experiments. (H) Western blots of LAMP1. Bar graphs show summary data (n = 4). All Summary data are normalized to control group. Values reflect means ± SD. *p < 0.05, **p < 0.01.
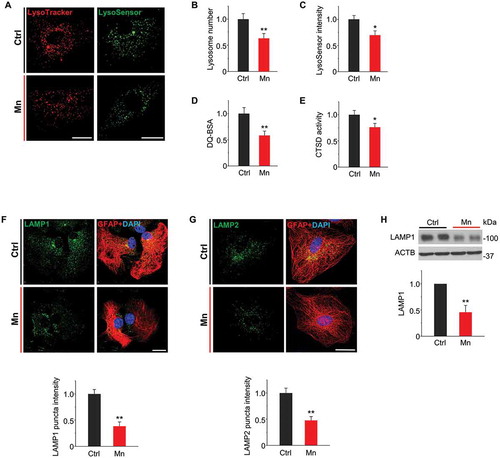
Mn-induced lysosome dysfunction was further corroborated by immunofluorescence using antibodies against LAMP1 (lysosomal-associated membrane protein 1) and LAMP2, both of which are lysosomal structural membrane proteins that are typically used as lysosome markers. Indeed, both LAMP1- and LAMP2-positive puncta were markedly reduced in Mn-exposed astrocytes ( and G). In parallel, immunoblots showed a decrease in LAMP1 protein level in Mn vs. control astrocytes (), indicating that Mn treatment decreased the number and disrupted the integrity of lysosomes. Overall, these data suggest that Mn exposure impairs lysosomal function by reducing lysosome abundance, thus inhibiting proteolytic capacity.
Sub-acute administration of Mn alters autophagy in mouse striatum
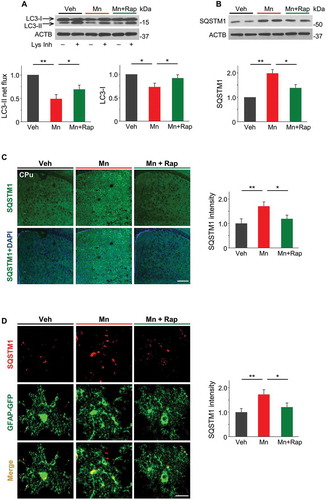
In order to determine the effect of Mn on autophagy in vivo, we employed a model of sub-acute Mn intoxication. Mice received MnCl2∙4H2O (50 mg/kg, subcutaneous, s.c.) injection on experimental day 0, 3 and 6. One day after the last injection, we performed ex vivo LC3 flux assay with isolated mouse striatum since it is one of the major target sites for Mn accumulation and toxicity. As shown in and B, Mn administration resulted in significant reductions in LC3-II flux and LC3-I expression and a concomitant increase in SQSTM1 accumulation, all of which can be reversed by treating the animals with autophagy activator rapamycin. Consistent with the western blotting results, immunofluorescence analysis revealed a robust increase in SQSTM1 immunoreactivity in Mn-treated mouse striatum (). To examine whether SQSTM1 accumulation primarily occurs in astrocytes, we specifically labeled mouse striatal astrocytes with GFP by injecting AAV expressing GFP under control of the Gfap (glial fibrillary acid protein) promoter [Citation40] into the mouse striatum. Consecutive Z section images revealed marked co-localization between SQSTM1 puncta and GFP-positive cells (), suggesting an impairment of autophagic degradation in the striatal astrocytes of mice subjected to Mn exposure.
Figure 3. Sub-acute Mn administration inhibited autophagy in mouse striatum. Mice were subjected to vehicle or MnCl2∙4H2O (50mg/kg, s.c.) injection on the day 0, 3 and 6. Rapamycin (7.5 mg/kg) was administrated daily starting 2 d before Mn injection. Striatum tissue was collected 24 h after last MnCl2 injection. (A) Western blots of LC3. Bar graphs show LC3-II flux and LC3-I protein levels (n = 4). (B) Western blots of SQSTM1. Bar graph shows summary data (n = 4). ACTB is used as a loading control. (C) Confocal images show immunostaining of SQSTM1 (green) and DAPI (blue) in mouse striatum (CPu). Scale bar: 450 µm. Summary data show fluorescent intensities of SQSTM1 (n = 4). (D) Confocal images show SQSTM1 (red) localizes with GFAP-GFP labeled astrocytes (green) in mouse brain section. Scale bar: 20 µm. Summary data show fluorescent intensities of SQSTM1 (n = 4). All summary data are normalized to vehicle group. Values are means ± SD. *p < 0.05, **p < 0.01.
Autophagic failure underlies Mn-induced mitochondrial dysfunction in primary astrocytes
Autophagic turnover of damaged mitochondria is essential in maintaining a healthy, respiratory-competent mitochondrial network [Citation21]. Compromised autophagy is predicted to result in an accumulation of defective mitochondria that not only contributes to bioenergetics deficiency but also amplify ROS generation [Citation19,Citation41,Citation42]. We then hypothesized that Mn-induced autophagic failure was casually related to mitochondrial dysfunction. Toward this end, we examined the impact of an autophagic activator rapamycin on mitochondrial bioenergetics in primary astrocytes exposed to Mn. Validation experiments revealed that rapamycin suppressed the MTOR (mechanistic target of rapamycin kinase) signaling pathway (Figure S4) and restored autophagy flux in presence of Mn exposure (). Following Mn exposure, oxygen consumption rate (OCR) was measured by XF24 extracellular flux analyzer. Mn-treated astrocytes exhibited significantly lower basal OCR and ATP synthesis-linked OCR (i.e., OCRbaseline – OCRoligomycin, see Materials and Methods) (B–D). In addition, Mn induced a marked reduction in maximal respiration capacity, as assessed by FCCP-stimulated OCR (). Pretreating the astrocytes with 100 nM rapamycin partially restored basal, ATP-linked and maximal mitochondrial respiration (B–E). To distinguish whether the rescuing effects of rapamycin depend on autophagy, we transfected the cells with shRNA to Atg7, an E1-like enzyme essential for autophagosome formation. We found that Atg7 knockdown inhibited autophagy flux () and abolished the rescuing effects of rapamycin on mitochondrial respiration (B–E), indicating that the rescue afforded by rapamycin occurs largely via autophagic activation. Consistent with the mitochondrial respiratory capacity, the luminescence-based ATP assays showed that rapamycin reversed the Mn-induced intracellular ATP depletion (). Moreover, rapamycin also corrected Mn-induced collapse of the mitochondrial membrane potential (ΔΨm) ().
Figure 4. Activation of autophagy by rapamycin rescues Mn-induced mitochondrial dysfunction in primary astrocytes. Primary astrocytes were transfected with lentivirus carrying non-target shRNA or Atg7 shRNA. Rapamycin (100 nM) was added 2 h prior to Mn exposure (100 μM, 24 h). (A) Western blots of LC3 in presence and absence of lysosomal inhibitors (Lys Inh, 20 mM NH4Cl and 100 μM leupeptin) for the last 2 h. ACTB is used as a loading control. Summary data show LC3-II flux (n = 4). (B) Oxygen consumption rate (OCR) in primary astrocytes measured by XF24 extracellular analyzer was plotted against time. OCR was measured at baseline and following sequential additions of 0.8 μM oligomycin (oligo), 1.5 μM FCCP, and 1 μM rotenone + 1 μM antimycin A (Rot+AA). (C-E) Basal, ATP-linked, and maximal OCR were calculated from (B) as described in the Methods. Values are normalized to protein content. Each experimental point was an average of 4–5 replicate wells. n = 3 independent experiments involving astrocytes cultured from different litters. (F) Total intracellular ATP (n = 4). (G) Mitochondrial membrane potential (ΔΨm) determined by JC-1 red/green fluorescence ratio (n = 4). (H) Images of astrocytes stained with MitoSOX Red (Scale bar: 15 μM). Summary data show fluorescence intensity (n ≥ 80 astrocytes from 4 independent experiments). Values are normalized to control group in (A) and (F-H). Values reflect means ± SD. *p < 0.05, **p < 0.01.
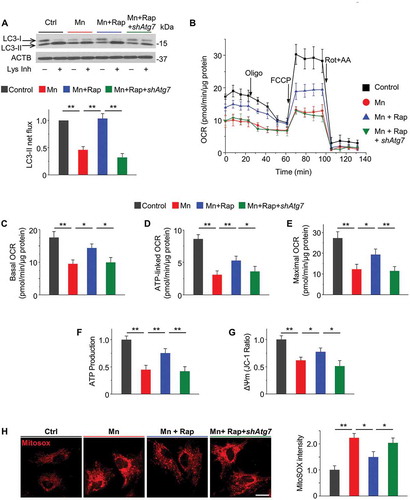
Since accumulation of damaged mitochondria causes excessive ROS production, we evaluated mitochondrial ROS generation using MitoSOX staining, a live-cell permeant indicator of mitochondrial superoxide. Rapamycin alleviated the prominent mitochondrial ROS production in Mn-exposed astrocytes, and this rescuing effect was diminished by Atg7 knockdown (). Together, these findings suggest that the compromised autophagy underlies, at least in part, the mitochondrial dysfunction in Mn toxicity.
Consistent with the toxic effect of Mn on mitochondrial function, electron micrographs revealed extensive mitochondrial fragmentation and injury (Figure S5, yellow arrow) in Mn-treated astrocytes. Mn-exposed cells also exhibited accumulation of large electron-lucent structures reflecting large vesicles (indicated by red arrows) that may have originated from expansion and damage to organelles, such as mitochondria. When compared to control cells, where a number of autophagic structures (indicated by black arrows) could be visualized containing cargo in various stages of degradation, Mn-treated cells failed to show equivalent number of autophagic structures. The addition of rapamycin led to remarkable reversal of the toxic phenotype of Mn – in particular, we observed a marked increase in mitochondria that appeared healthy and unfragmented, which is in line with the functional recovery indicated by increased OCR when compared to Mn-exposed cells. Furthermore, rapamycin treatment led to complete dissipation of the large electron-lucent vesicles observed in Mn-treated cells.
Mn exposure inhibits nuclear localization and transcriptional activity of TFEB
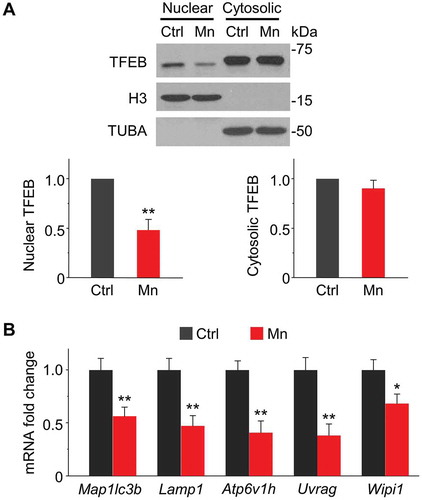
TFEB is a transcriptional factor that coordinates autophagy through positively regulating the transcription of a gene network controlling autophagosome formation, autophagosome-lysosome fusion, and lysosome biogenesis and function [Citation43–Citation45]. Since Mn exposure resulted in decreased protein levels of autophagosome protein LC3 and lysosomal membrane protein LAMP1, both of which are regulated by TFEB [Citation45,Citation46], we speculated that loss of TFEB function might be involved in Mn-induced autophagic dysfunction. Thus, we investigated the subcellular localization of TFEB by cell fractionation assays. As shown in , Mn markedly reduced nuclear TFEB protein levels, whereas the decrease in cytoplasmic TFEB was not statistically significant. The loss of nuclear TFEB was confirmed by downregulation of the mRNA levels of TFEB target genes Map1lc3b, Lamp1, Atp6v1h, Uvrag, Wipi1 [Citation45,Citation46] (). On the other hand, the expression of autophagic marker BECN1/Beclin-1 remained unchanged (Figure S6), which is consistent with a previous study showing that transcription of BECN1 is not regulated by TFEB [Citation45]. Furthermore, we found that nuclear TFEB was also significantly decreased in the striatal tissue of Mn-treated mice (Figure S7). Together, these results indicate that Mn blocks TFEB nuclear translocation, which may cause dysfunction in autophagic pathway.
Figure 5. Mn decreases TFEB nuclear localization and transcriptional activity in primary astrocytes. (A) Western blots of TFEB in nuclear and cytoplasmic fraction in astrocytes exposed to 100 μM Mn for 24 h. Bar graphs show summary data (n = 4). Nuclear and cytoplasmic fractions are normalized to histone H3 and TUBA, respectively. (B) qPCR analysis showing mRNA expression of TFEB target genes (Maplc3b, Lamp1, Atp6v1h, Uvrag, and Wipi1). All summary data are normalized to control. Values reflect means ± SD. n = 4, *p < 0.05, **p < 0.01.
TFEB dysregulation underlies Mn-induced autophagic failure and mitochondrial dysfunction
The finding that Mn inhibits TFEB activity prompted us to test whether loss of TFEB function is a potential mechanism contributing to compromised autophagy in Mn toxicity. Therefore, we transfected primary astrocytes with lentivirus expressing TFEB and assessed autophagic activity by LC3-II turnover and SQSTM1 protein accumulation. TFEB overexpression rescued LC3-II flux and LC3-I expression () and eliminated SQSTM1 accumulation () in Mn-exposed astrocytes. In contrast, shRNA-mediated knockdown of TFEB (validated in Figure S8A) resulted in further reduction of LC3-II flux and LC3-I expression in the presence of Mn (Figure S8B). The results showing Mn-impaired autophagy is rescued by TFEB overexpression and aggravated by TFEB depletion collectively establish TFEB as a key mediator of Mn-induced autophagic failure.
Figure 6. Overexpression of TFEB restores autophagy flux and attenuates mitochondrial respiratory defects in Mn-exposed primary astrocytes. Primary astrocytes were transfected with lentivirus carrying TFEB or empty vector and then exposed to 100 μM Mn for 24 h. (A) Western blots of LC3 in the presence and absence of lysosomal inhibitors (Lys Inh, 20 mM NH4Cl and 100 μM leupeptin) for the last 2h. ACTB is used as a loading control. Bar graphs show LC3-II flux and LC3-I protein levels (n = 4). (B) Western blots of SQSTM1. Bar graph shows summary data (n = 4). (C-D) Oxygen consumption rate (OCR) measured by XF24 extracellular analyzer at baseline and following sequential additions of 0.8 μM oligomycin, 1.5 μM FCCP, and 1μM rotenone + 1μM antimycin A. Basal and maximal OCR (D) were calculated as described in the Methods. Values are normalized to protein content. Each experimental point was an average of 5–7 replicate wells. n = 3 independent experiments. (E) Total intracellular ATP (n = 4). Values are normalized to control group in (A), (B) and (E). Values reflect means ± SD. *p < 0.05, **p < 0.01.
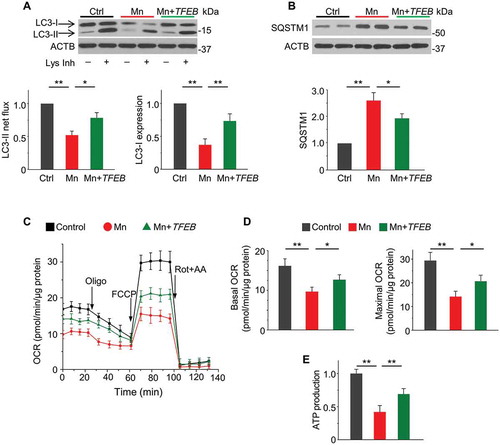
Since impaired autophagy is associated with mitochondrial dysfunction, we postulated that induction of TFEB ameliorated Mn-induced mitochondrial respiratory defects through activation of autophagy. Indeed, TFEB overexpression restored basal and maximal OCR in Mn-treated astrocytes ( and D), suggesting an improvement of mitochondrial respiration. Simultaneously, ATP production was partially normalized in TFEB-transfected cells (). On the other hand, TFEB knockdown markedly exacerbated Mn-induced mitochondrial respiratory dysfunction, as illustrated by further reduced levels of ATP production and basal OCR (Figure S8C and D). These gain- and loss-of-protection data strongly support the role of TFEB in rescuing Mn-induced mitochondrial dysfunction in astrocytes.
In addition, we examined the effects of TFEB-overexpressing astrocytes on Mn-induced neurotoxicity using a neuron-astrocyte co-culture system, in which astrocytes were plated on transwell inserts and transfected with lentivirus expressing TFEB. As shown in Figure S9, propidium iodide (PI) staining demonstrated that TFEB-overexpressing astrocytes significantly attenuated Mn-induced neuronal death in co-culture. The results indicate that TFEB overexpression in astrocytes could exhibit therapeutic potential against Mn-induced neurotoxicity.
Mn exposure blocks TFEB nuclear translocation through MAPK1/ERK2-MAPK3/ERK1-mediated TFEB phosphorylation
The subcellular localization of TFEB mainly depends on its phosphorylation state [Citation45,Citation47]. Phosphorylated TFEB is located predominantly in the cytoplasm, whereas dephosphorylated TFEB is in the nucleus. MTOR complex 1 (MTORC1) and MAPK1/ERK2 (mitogen-activated protein kinase 1) are the main protein kinases known to phosphorylate TFEB and keep it inactive in cytosol [Citation45,Citation48–Citation50]. We found that Mn exposure markedly elevated phosphorylation of MAPK1/3 (), with little effect on MTOR signaling pathway (Figure S10). Thus, we examined the effect of MAPK1/3 inhibitor U0126 on the subcellular localization of TFEB in primary astrocytes co-treated with Mn. Western blots showed that MAPK1/3 inhibition led to massive TFEB nuclear accumulation as well as increased protein expression of TFEB target genes Wipi1 and Lamp1 (). Increased nuclear localization of TFEB by U0126 was accompanied by increased lysosomal enzymatic activity assessed by DQ-BSA, and similar effects were achieved by rapamycin and TFEB overexpression (Figure S11). Consistent with the immunoblots, U0126-treated astrocytes exhibited increased TFEB nuclear distribution compared with Mn alone in immunofluorescence staining (). In addition, U0126 restored the mRNA levels of multiple TFEB target genes inhibited by Mn (). These results suggested that MAPK/ERK activation was critical for Mn-induced TFEB nuclear exclusion and concomitant loss-of-function.
Figure 7. Mn-induced MAPK1/3 (ERK2/1) activation is involved in TFEB phosphorylation and nuclear exclusion. Primary astrocytes were exposed to 100 μM Mn for 24 h. U0126 (10 μM) was added to the cultures 6 h after Mn exposure. (A) Western blots of p-MAPK1/3 (Thr202/Tyr204), total MAPK1/3, nuclear TFEB, LAMP1 and WIPI1. Histone H3 is used as a nuclear fraction control. ACTB is used as a whole-cell loading control. Bar graphs show summary data (n = 4). (B) Confocal images show immunostaining of TFEB (green) together with GFAP (red) in primary astrocytes (Scale bar: 15 μm). Summary data show nuclear TFEB florescent intensities. n ≥ 45 astrocytes from 3 independent experiments.(C) qPCR analysis showing mRNA expression of TFEB target genes (Maplc3b, Lamp1, Atp6v1h, Uvrag, and Wipi1) (n = 4). (D) Astrocytes expressing equal amounts of WT TFEB-GFP or TFEBS142A-GFP vectors were subjected to 100 μM Mn for 24 h. GFP antibody is used to detect exogenous TFEB-GFP levels. Western blots show TFEB levels in nuclear and cytoplasmic fractions. Bar graphs show summary data (n = 3). H3 and TUBA are used as nuclear and cytosolic loading controls, respectively. All summary data are normalized to control group. Values reflect means ± SD. *p < 0.05, **p < 0.01.
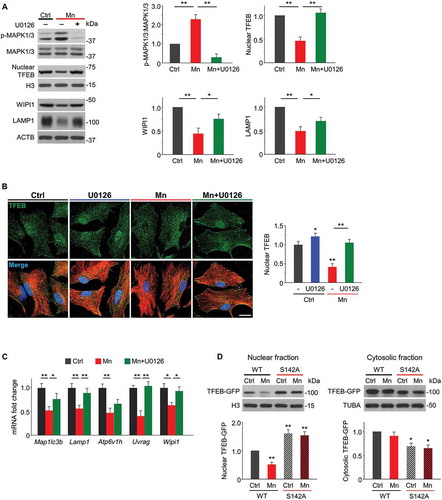
Previous studies have reported that MAPK-mediated TFEB phosphorylation on S142 plays a crucial role in keeping TFEB in cytoplasm [Citation45]. We then tested whether Mn-induced loss of nuclear TFEB was resulted from S142 phosphorylation. Toward this end, we transfected astrocytes with wild type human TFEB-GFP or site-mutant TFEBS142A-GFP (TFEBS142A) which carries Ser-to-Ala mutation to abolish S142 phosphorylation. The qPCR of GFP mRNA confirmed that equal levels of exogenous WT TFEB-GFP and TFEBS142A-GFP were expressed in astrocytes (Figure S12). Subcellular fractionation revealed that S142A mutation caused a decrease in cytosolic TFEB-GFP and a significant increase in nuclear TFEB-GFP accumulation compared with WT TFEB (). More importantly, Mn failed to reduce nuclear TFEB protein levels in astrocytes expressing TFEBS142A (), suggesting that the loss of nuclear TFEB is largely due to S142 phosphorylation. Together, these experiments demonstrate mechanistically that Mn blocks TFEB nuclear translocation through MAPK1/3-mediated S142 phosphorylation.
Discussion
It is well established that autophagic dysfunction is a critical feature and central pathophysiological component underpinning numerous neurodegenerative diseases [Citation26,Citation51,Citation52]. Recently, evidence has emerged to implicate altered autophagy in the pathogenesis of heavy metal toxicity, such as cadmium [Citation53], lead [Citation54,Citation55], arsenic [Citation56] and Mn [Citation32,Citation57]. In this study, we examined the mechanism(s) underlying Mn-induced autophagic dysregulation and its functional role in an astrocyte model of Mn toxicity. Our data established a causal role of down-regulated autophagy in Mn-induced mitochondrial dysfunction. In addition, our study highlighted a novel mechanism that loss of TFEB function, a master regulator of autophagy-lysosome pathway, underlies Mn-induced autophagic dysfunction in astrocytes.
The present study employed LC3-II flux and autophagic substrates accumulation as functional readouts of autophagic activity. During autophagosome formation, the cytosolic LC3-I is conjugated to phosphatidylethanolamine to form lipidated LC3 (LC3-II), which binds to the phagophore membrane and remains bound to complete autophagosome. Thus, LC3-II is widely used as a marker for autophagosome [Citation38]. Since autophagy is a dynamic process, increased LC3-II can reflect increased autophagosome formation and/or suppression of autophagosome clearance. Therefore, we measured the LC3-II turnover by western blotting in presence and absence of lysosomal inhibitors [Citation35,Citation58,Citation59] (leupeptin, a protease inhibitor; NH4Cl, a lysosomal alkalizer) and found that Mn suppressed LC3-II net flux, indicating an inhibition of autophagic activity. To further investigate the effect of Mn on autophagy flux, we monitored protein accumulation of SQSTM1 and K63-linked ubiquitin chain in Mn-exposed astrocytes. SQSTM1/p62 is a receptor protein that links ubiquitinated proteins to the autophagic machinery to enable their degradation in the lysosome [Citation60]. K63-linked polyubiquitin interacts with SQSTM1, promoting the clearance of inclusions by autophagy [Citation61]. Thus, their amounts are inversely correlated with autophagic activity and increased accumulation of both proteins in Mn-treated cells () suggested a blockade in autophagic degradation. Consistent with the data obtained in vitro, sub-acute Mn exposure resulted in decreased LC3-II flux and increased SQSTM1 accumulation in mouse striatum, one of the primary target regions of Mn toxicity [Citation1,Citation62]. Specifically, the SQSTM1 accumulation mainly localized in striatal astrocytes, which is likely due to astrocytes being the principal storage site of Mn in the brain. Collectively, our results provide both in vitro and in vivo evidence that Mn exposure causes autophagic dysfunction.
The ultimate step in the autophagy process is degradation of the cargo in lysosomes. Here, we determined whether perturbation of lysosomal function is involved in Mn-impaired autophgic degradation. The results showed that Mn decreased lysosomal abundance, altered lysosomal pH, and inhibited lysosomal catalytic capacity. Whether the integrity of the lysosome is also compromised requires further investigation; however, we detected reduced level of lysosomal-associated membrane protein LAMP1 and LAMP2 in Mn-treated cells. LAMPs are major protein components of lysosomal membrane which play a role in regulating the structural integrity of the lysosome and participating in autophagic pathways [Citation63,Citation64]. Decreased LAMPs expression may reflect a reduction of total lysosome number; whereas it may also relate to disintegration of lysosomes.
Astrocytes play crucial roles in supporting neuronal activity and preserving their optimal environments, including neurotransmitter recycling and ion buffering. These functions require energy and therefore depend on the functionality of mitochondrial network [Citation65]. Selective removal of damaged mitochondria by autophagic pathway is an essential mechanism of mitochondrial quality control and presumably important for maintaining a healthy mitochondrial population [Citation23,Citation66–Citation68]. Poor quality mitochondria that are not degraded may further impact the remaining healthy mitochondrial population through release of ROS and calcium from the organelle [Citation19]. Inhibition of autophagy by pharmacological and genetic methods has been shown to suppress mitochondrial respiration and enhance mitochondrial superoxide generation [Citation66,Citation69,Citation70], possibly through accumulation of damaged mitochondria. Therefore, if a toxin targets both mitochondria and autophagy, the synergistic effects may exacerbate the pathological changes of mitochondrial function. Mitochondria have been proposed as a preferential target for Mn accumulation and toxicity. Previous studies in our lab have reported that Mn induces reduction in ATP and dissipation of the ΔΨm in astrocyte cultures [Citation71–Citation73]. We hypothesized that Mn-induced autophagic dysfunction accelerated mitochondrial pathology. Our results showed that activation of autophagy by rapamycin in presence of Mn rescued mitochondrial respiratory capacity, ATP production, membrane potential, and superoxide production. These rescuing effects were abolished by Atg7 knockdown, demonstrating a crucial role of autophagy in maintaining mitochondrial function during Mn exposure. Induction of autophagy has been reported to confer cytoprotection against heavy metal toxicity, including Mn [Citation32], cadmium [Citation53,Citation74], and methyl-mercury [Citation75]. The present study suggested that the beneficial role of rapamycin may relate to improving mitochondrial function. These findings are consistent with previous reports that overexpression of PRKN/parkin, a protein that targets damaged mitochondria for autophagic degradation, prevented Mn-induced SH-SY5Y cell death [Citation76]; whereas knockdown of PRKN aggravated Mn-induced apoptosis [Citation77]. In addition to autophagic dysregulation, Mn may also impair mitochondrial quality control by altering the expression of proteins that involved in mitochondrial fusion and fission, such as MFN2 (misofusin 2), OPA1 (mitochondrial dynamin like GTPase) and DNM1L (dynamin 1-like) [Citation78,Citation79]. Dysregulation of these mitochondria-shaping proteins may cause imbalance in mitochondrial dynamics and contribute to mitochondrial compromise.
Our study highlighted a novel mechanism that loss of TFEB function underlies the Mn-induced autophagic dysfunction and identified this transcription factor as a promising target for rectifying mitochondrial dysfunction in Mn toxicity. TFEB is a member of the MiT-TFE family of transcription factors and binds to a promoter motif responsible for regulating the expression of coordinated lysosomal expression and regulation (CLEAR) gene network [Citation80]. Through activation of CLEAR network, TFEB orchestrates the expression of genes involved in autophagosome formation, autophagosome-lysosome fusion and lysosomal biogenesis and function [Citation43–Citation45]. Importantly, TFEB expression and subcellular localization are altered in neurodegenerative disorders, implicating impaired TFEB function in defective cellular clearance linked to disease pathogenesis [Citation81]. Our study observed a decrease in nuclear TFEB expression concomitantly with reduction of its transcriptional activity in Mn-exposed astrocytes, suggesting that TFEB nuclear exclusion and loss-of-function may be involved in autophagic dysregulation in these cells. Many lines of evidence have shown that pharmacological or genetic activation of TFEB represents a successful therapeutic strategy in animal models of neurodegenerative diseases [Citation81]. Although in general this therapeutic effect has been attributed to clearance of toxic protein aggregates, TFEB activation has also been reported to confer protection via maintenance of mitochondria homeostasis by inducing lysosomal degradation of damaged mitochondria [Citation82]. Indeed, our results demonstrated that overexpressing TFEB enhanced cellular autophagy flux, and more importantly, alleviated the Mn-impaired mitochondrial respiration. In addition, a previous study has reported that deletion of TFEB in mouse brain results in the accumulation of neurotoxic proteins, accompanied by axon degeneration and apoptotic cell death [Citation83]. Our study showed that TFEB knockdown exacerbated Mn-induced autophagic failure and mitochondrial dysfunction, which further strengthens the notion that loss of TFEB function potentially contributes to compromised autophagy in Mn toxicity. It is noteworthy that TFEB may also rescue mitochondria dysfunction through directly promoting mitochondrial biogenesis [Citation84]; therefore, the rescuing effects of TFEB may not be entirely attributed to clearance of dysfunctional mitochondria.
The cytosol-to-nucleus shuttling of TFEB is mainly modulated by its phosphorylation state. In particular, phosphorylation at Ser142 [Citation45,Citation50] and/or Ser211 [Citation48–Citation50] mediates TFEB cytoplasmic retention. MAPK1 and MTORC1 have been identified as two main kinases that phosphorylate TFEB at these sites. In the current study, we found that Mn enhanced MAPK1/3 phosphorylation at 24 h exposure, whereas MTORC1 signaling remained unchanged. Inhibition of MAPK/ERK activity in the presence of Mn promoted TFEB nuclear accumulation and enhanced the expression of its target genes, implicating MAPK activation in TFEB dysfunction. However, the current study cannot exclude the possibility that a transient increase in MTOR activity during early Mn exposure may affect the phosphorylation and cytoplasmic localization of TFEB. Previous studies have identified serine residue S142 as a site for MAPK/ERK-mediated phosphorylation. We therefore transfected astrocytes with a mutant form of TFEBS142A-GFP to test whether S142 phosphorylation mediates Mn-induced TFEB nuclear-cytoplasmic shuttling. We observed that the S142A mutation abolished Mn-induced TFEB nuclear exclusion. Meanwhile, the TFEBS142A-GFP mutant exhibited a significant increase in its nuclear localization compared with WT TFEB-GFP. It is noteworthy that TFEBS142A mutant is not entirely localized in the nucleus. We speculate that this is because in addition to S142, other serine residues, such as S211 also play a role in controlling TFEB subcellular localization [Citation49,Citation50,Citation85]. Besides post-translational modifications, Mn-induced intracellular SNCA (synuclein, alpha) accumulation may also play a role in regulating TFEB localization since excess SNCA might sequester and inactivate TFEB [Citation86].
In conclusion, the present study demonstrates that autophagy-lysosome pathway is impaired following Mn exposure in astrocytes, and that compromised autophagy underlies mitochondrial dysfunction in the pathology of Mn toxicity. Furthermore, our study identifies a mechanistic link between impaired TFEB activity and compromised autophagy, highlighting TFEB as a promising therapeutic target for antagonizing Mn toxicity.
Materials and methods
Primary astrocyte culture and treatments
Primary cultures of astrocytes were prepared from the striatal tissue of C57BL/6J mice at postnatal day 0–1 with the approval by the Institutional Animal Care and Use Committees of Albert Einstein College of Medicine. Briefly, the striata were separated and harvested under sterile conditions. Minced striatal tissue was washed with Hanks Balanced Salt Solution (HBSS; Thermo Fisher Scientific, 14025092) and trypsinized with 0.05% trypsin (Sigma Aldrich, T1005) for 40 min at 37°C. The tissues were then dissociated by pipetting 20–30 times using a fire-polished glass pipette. The suspended cells were seeded on poly-L-lysine coated plates/coverslips and maintained in fresh Dulbecco’s Modified Eagle Medium (DMEM; Thermo Fisher Scientific, 11995073) supplemented with 10% horse serum (Thermo Fisher Scientific, 16050114) and 100 U/ml penicillin/streptomycin (Thermo Fisher Scientific, 15140122). The culture medium was changed after 24 h and then replaced every 3 d. Cells were used for respective experiments on day 10–14. Immunostaining confirmed that >95% of the cell population were positive for the astrocyte-specific marker GFAP (Figure S13).
Besides (the doses and time periods are indicated in the figure legends), all Mn treatments were for 24 h at 100 μM (MnCl2 · 4H2O, Sigma Aldrich, 203734). Rapamycin (EMD Millipore, 553211) treatment (100 nM) was initiated 2 h prior to and continued during Mn exposure. U0126 (10 μM, Cell Signaling Technology, 9903) was added to astrocyte cultures 6 h after initiation of Mn exposure. For the LC3-II flux assay, lysosomal inhibitors (Lys Inh), i.e., a combination of 100 μM leupeptin (Thermo Fisher Scientific, 266225) that specifically inhibits lysosomal proteases and 20 mM NH4Cl, which neutralizes lysosomal pH (Sigma Aldrich, 254134) were added 2 h before the end of Mn exposure.
Astrocyte-neuron co-culture system
Primary cultures of midbrain dopaminergic neurons were prepared from E13 embryos of C57BL/6J mice as previously described [Citation87]. Briefly, the embryonic ventral midbrain was isolated under sterile conditions. Minced midbrain tissue was washed with HBSS and trypsinized with 0.05% trypsin for 20 min at 37°C. The tissues were then mechanically dissociated by pipetting using a fire-polished glass pipette in DMEM supplemented with 10% horse serum. The suspended cells were seeded on poly-L-lysine coated 24-well plates and maintained in DMEM supplemented with 10% horse serum and 50 U/ml penicillin/streptomycin for 4 h. The culture medium was then changed to Neurobasal medium (Thermo Fisher Scientific, 21103049) supplemented with 2% B-27 plus (Thermo Fisher Scientific, A3582801) and 2 mM L-glutamine (Thermo Fisher Scientific, 25030081). Neurons were used for respective experiments on day 14.
For astrocyte-neuron co-culture, neurons were plated at a density of 3500 cells/cm2 on poly-L-lysine-coated 24-well plates. Astrocytes were seeded at 2.5 × 10⁴ per well on the 24-well transwell cell culture inserts (pore size, 0.4 μm) and transfected with lentivirus expressing TFEB or empty vector. Two days after transfection, the astrocyte medium was replaced with neuronal culture medium and maintained for 2 d. The transwell inserts containing astrocytes were then placed into wells of primary neurons and incubated for 48 h. Mn was added to the neuronal culture medium both inside and outside of the inserts to a final concentration of 100 μM, and neuronal cell viability was assessed by PI staining following 24 h Mn exposure.
Lactate dehydrogenase (LDH) assay
The cytotoxic effect of Mn in primary astrocytes was evaluated by LDH release using the CyQUANT LDH Cytotoxicity Assay Kit (Thermo Fisher Scientific, C20301) according to manufacturer’s instruction. Briefly, astrocytes cultured in 96-well plates were exposed to 100 μM or 500 μM MnCl2 for the time periods indicated in Figure S1. Cell culture supernatant was transferred to a new 96-well plate and incubated with the reaction mixture for 30 min at room temperature. LDH absorbance was measured at 490 nm. Background absorbance (690 nm) was subtracted from 490 nm absorbance value according to the manufacturer’s guidelines.
Western blotting assay
For whole-cell protein extraction, primary astrocytes were lysed in RIPA Cell Lysis Buffer (Sigma Aldrich, R0278) supplemented with protease inhibitor cocktail (Sigma Aldrich, P8340) and phosphatase inhibitor cocktail (Sigma Aldrich, P2850). The lysates were sonicated and centrifuged at 12,000 g at 4°C for 10 min to collect whole-cell proteins in supernatant. For subcellular fraction samples, cytoplasmic and nuclear fractions were isolated with NE-PER Nuclear and Cytoplasmic Extraction Reagents (Thermo Fisher Scientific, 78,833) according to manufacturer’s instructions. For animal tissue samples, striatal tissue was homogenized in RIPA supplemented with protease/phosphatase inhibitor cocktail, sonicated for 20 s, and centrifuged at 12,000 g at 4°C for 10 min to collect whole-cell proteins in the supernatant.
The protein concentrations were measured using the Pierce BCA Protein Assay Kit (Thermo Fisher Scientific, 23225), and an equal quantity of total protein in each sample was resolved by SDS-PAGE (sodium dodecyl sulfate-polyacrylamide gel electrophoresis) and transferred to nitrocellulose membranes. Blots were blocked with 5% bovine serum albumin (Sigma Aldrich, A3059) for 1 h and probed overnight with primary antibodies. For whole-cell protein sample, band densitometry was normalized to ACTB as a loading control. For nuclear and cytoplasmic fraction, Histone H3 and TUBA were used as loading controls, respectively. The densitometric values were quantified using ImageJ (NIH). Net LC3 flux was quantified by subtracting densitometric values of samples in absence of lysosomal inhibitors (Lys Inh -) from values of corresponding inhibitors-treated samples (Lys Inh +). Higher values indicate increased LC3 net flux.
Primary antibodies used for western blotting included rabbit anti-LC3B (Cell Signaling Technology, 2775S), rabbit anti-SQSTM1/p62 (Enzo Life Sciences, BML-PW9860), rabbit anti-K63 (Cell Signaling Technology, 5621S), rabbit anti-LAMP1 (Abcam, ab24170), rabbit anti-TFEB (Santa Cruz Biotechnology, sc-48784), rabbit anti-histone H3 (Abcam, ab1791), mouse anti-TUBA/α tubulin (Cell Signaling Technology, 3873S), rabbit anti-BECN1/Beclin-1 (Cell Signaling Technology, 3495S), rabbit anti-p-p42/44 MAPK1/3 (ERK2/1) (Thr202/Tyr204) (Cell Signaling Technology, 9101S), rabbit anti-p42/44 MAPK1/3 (ERK2/1) (Cell Signaling Technology, 9102S), rabbit anti-MTOR (Cell Signaling Technology, 2972), rabbit anti-p-MTOR (Ser2448) (Cell Signaling Technology, 2971S), rabbit anti-p-RPS6KB1/p70S6K (Thr389) (Cell Signaling Technology, 9205S), rabbit anti-RPS6KB1/p70S6K (Cell Signaling Technology, 9202S), rabbit anti-GFP (Thermo Fisher Scientific, A-11122), and mouse anti-ACTB/β-actin (Sigma Aldrich, A1978).
Immunocytochemistry
Primary astrocytes cultured on poly-L-lysine coated coverslips were fixed with 4% paraformaldehyde (PFA, Santa Cruz Biotechnology, sc-281692). Following fixation, cells were blocked and permeabilized in PBS (Thermo Fisher Scientific, 10010–023) containing 0.25% Triton X100 (Sigma Aldrich, X100) and 5% goat serum blocking solution (Vector Laboratories, S1000) for 1 h and then incubated with primary antibodies at 4°C overnight to probe for SQSTM1/p62 (rabbit anti-p62, 1:400, Enzo Lifescience, BML-PW9860), LAMP1 (1:300, rabbit anti-LAMP1, Abcam, ab24170), LAMP2 (1:150, rat anti-LAMP2, Developmental Studies Hybridoma Bank, GL2A7), TFEB (rabbit anti-TFEB, 1:100, Santa Cruz Biotechnology, sc-48784) along with GFAP (mouse anti-GFAP 1:500, Millipore, MAB3402) in PBS containing 0.25% Triton X100 and 1% goat serum medium (Vector Laboratories, S1000). This was followed by incubation with matching Alexa Fluor 488 or 555-conjugated secondary antibodies (Alexa Fluor 488 goat anti-rabbit, 1:200–1:400, A-11008; Alexa Fluor 488 goat anti-rat, 1:300, A-11006; Alexa Fluor 555 goat anti-mouse, 1:500, A-21422; Thermo Fisher Scientific) for 1 h at room temperature. Coverslips were mounted with Vectashield mounting medium (Vector Laboratories H-1200) with DAPI. The images were acquired with a Leica SP5 confocal microscope (63× objective). At least 3 coverslips for each biological replicate per group and multiple areas per slide selected on a random basis were used for quantification analysis. The integrated puncta intensity for a given cell was quantified and normalized to the area of the cell body. To make comparisons between experiments involving different batches of astrocytes, we used the same immunochemistry procedure and included all control and treatment groups in each preparation. Moreover, laser settings of the microscope were uniform across all preparations.
Monitoring of mitophagy
In order to monitor mitophagy, primary astrocytes were incubated with MitoTracker Green and LysoTracker Red. MitoTracker labels mitochondria whereas LysoTracker labels lysosomes. Co-localization of two fluorophores indicates delivery of mitochondria to lysosome and therefore a decrease in co-localization suggests decreased mitophagy. Primary astrocytes were cultured on poly-d-lysine coated MatTek glass-bottom dish (35 mm, MatTek Corporation, P35GC-1.5-14C). At the end of Mn (100 μM) exposure, astrocytes were washed and incubated with 50 nM MitoTracker Green (Thermo Fisher Scientific, M7514) and 50 nM LysoTracker Red DND-99 (Thermo Fisher Scientific, L7528) in HBSS for 30 min at 37°C. The cells were then rinsed twice with warm HBSS, and the live cells were immediately examined using a Zeiss confocal microscope with a 40x objective. Immunofluorescence images were captured from randomly selected microscopic fields. Mitochondrial length was measured with the ImageJ software using MitoTracker Green staining. Only in-focus mitochondria with defined borders were used for the measurements. Calculation of Pearson’s correlation coefficient for co-localization of MitoTracker Green and LysoTracker Red was performed using ImageJ.
Lysosomal staining
Two fluorescent probes, LysoTracker and LysoSensor were employed to label lysosome in live primary astrocytes. LysoSensor exhibits a pH-dependent increase in fluorescence intensity upon acidification, whereas LysoTracker exhibits fluorescence independent of pH. Therefore, we used LysoTracker to examine lysosome abundance and LysoSensor to measure relative changes in lysosomal pH. Primary astrocytes were cultured in poly-d-lysine coated glass-bottom dish (35 mm). At the end of Mn (100 μM) exposure, astrocytes were washed and incubated with 50 nM LysoTracker Red DND-99 or 500 nM LysoSensor Green DND-189 (Thermo Fisher Scientific, L7535) in HBSS for 30 min at 37°C. The cells were then rinsed twice with warm HBSS, and the live cells were immediately examined using a Zeiss confocal microscope with a 40x objective. Immunofluorescence images were captured from randomly selected microscopic fields. ImageJ was used to quantify the number of red vesicles/cell in LysoTracker staining and the average fluorescence intensity/puncta area in LysoSensor staining.
Furthermore, acridine orange (AO, Thermo Fisher Scientific, A1301) [Citation88] was used to estimate the amount of acidic organelles in astrocytes. Cells were incubated with 1 µg/ml AO in full medium for 15 min at 37°C, rinsed twice with warm HBSS, and immediately examined using an Olympus IX81 fluorescence microscope. Immunofluorescence images were captured from randomly selected microscopic fields and analyzed by ImageJ. Since AO staining can be observed as red granular fluorescence in acidic organelles and a diffuse green fluorescence in cytosol and nucleus, the number of red fluorescent vesicles in each cell was quantified to estimate the amount of acidic vesicular organelles per cell.
DQ-BSA lysosomal activity assay
Lysosomal proteolytic activity was measured by DQ-BSA based on that the proteolysis of DQ-BSA releases protein fragments that are fluorescent. Astrocytes were cultured in black-walled 96-well plates and loaded with 10 μg/ml DQ™ Red BSA (Thermo Fisher Scientific, D12051) at 37°C for the last 2 h of Mn exposure. The cells were washed with PBS and the fluorescence was measured using a plate reader at Ex/Em = 590/620 nm.
Lysosomal isolation and CTSD activity assay
Lysosomes from primary astrocytes were isolated using a lysosomal enrichment kit from Thermo Fisher Scientific (89839) following the manufacturer’s instructions. The cell lysates were mixed with OptiPrep Media to a final concentration of 15% and placed on top of a discontinuous density gradient with the following steps from top to bottom: 17%, 20%, 23%, 27%, and 30%. After centrifugation for 2 h at 145,000 g, the top fraction containing the lysosomes was collected. The lysosomal fractions were diluted with 2–3 volumes of PBS, and pelleted by centrifugation for 1 h at 18,000 g.
CTSD activity was measured using a Fluorometric CTSD Activity Assay Kit from Abcam (ab65302). The assay utilized the preferred CTSD substrate GKPILFFRLK(Dnp)-D-R-NH2, which can be cleaved by CTSD and release fluorescence. Isolated lysosomes were assayed in a 96-well plate. Reaction mix was added to each well and the plate was incubated for 2 h in the dark. The fluorescence was measured by a plate reader at Ex/Em = 328/460 nm. Values measured within the linear range of the reaction were used for the calculations.
In vivo Mn and Rapamycin administrations
All procedures using animals were approved by the Institutional Animal Care and Use Committees of Albert Einstein College of Medicine and conformed to the National Institutes of Health Guidelines for use of animals in research. Twelve-week old mice were injected with MnCl2 · 4H2O (50 mg/kg, s.c.) or vehicle (water) or on experimental day 0, 3, and 6 and sacrificed on day 7. Mn exposure using this protocol has been reported to induce a significant increase in striatal Mn levels [Citation89,Citation90]. Rapamycin was dissolved in 100% ethanol and diluted in 5% Tween 80 + 5% polyethylene glycol 400 (Sigma Aldrich, P1754 and 1546445) to obtain a final concentration of 0.75 mg/ml [Citation91,Citation92]. Rapamycin (7.5 mg/kg) or vehicle were administrated intraperitoneally daily for 9 consecutive days, starting 2 d before Mn administration. For the combined treatment, rapamycin was injected 2 h before Mn administration. Vehicle contained equivalent amounts of ethanol, Tween 80, and polyethylene glycol 400 as the rapamycin solution. For ex vivo LC3-II flux assay, freshly collected tissue explants were placed in dishes with high glucose DMEM in presence or absence of lysosomal inhibitors (100 μM leupeptin and 20 mM NH4Cl) and then transferred to a 37°C incubator at 5% CO2 for 2 h. Explants were then homogenized and lysates were immunoblotted for LC3.
In vivo virus injection
To label astrocytes, mice were injected with adeno-associated virus (AAV) expressing eGFP under control of Gfap promoter (Addgene, 105549-AAV5; deposited by James M. Wilson’s lab) to striatum (CPu) one week before Mn injection according to a previous study [Citation40]. Briefly, mice were placed in a stereotaxic frame (David Kopf Instruments), anesthetized with 4% isoflurane and maintained in anesthesia with 2% isoflurane. Prior to injection, the incision site was scrubbed with Betadine (Purdue, PUF6761815004) and a small burr hole was drilled in the skull. An ultra-precise stereotactic apparatus were located to the CPu area at coordinates of (AP, +1.1 mm; ML, –1.2 mm; DV, –2.8 mm), as previously described [Citation93]. Concentrated viruses (~x1011 virus per ul) suspended in 0.4 μl artificial cerebrospinal fluid was injected via a 26-gauge guide cannula and a 33-gauge internal injector (Plastics One) driven by a Quintessential Stereotaxic Injector (Stoelting Company) at a flow rate of 0.2 µl/min. The injector and cannula were left in place for an additional 3 min and then gently withdrawn. The incision was closed with a tissue absorbable suture.
Immunohistochemistry
Mice were transcardially perfused with 4% PFA, and brains were isolated, post-fixed in 4% PFA for 24 h, and infiltrated with 20–30% sucrose. Brain sections (20-μm thick) were permeabilized and blocked with PBS containing 0.25% Triton X100 and 5% goat serum, and then incubated with primary antibodies at 4°C overnight (rabbit anti-SQSTM1/p62, Enzo Life Science BML-PW9860; mouse anti-GFP, Thermo Fisher Scientific A-11120). Sections were then washed and incubated with Alexa Fluor 555 goat anti-rabbit (Thermo Fisher Scientific, A-21428) and 488 goat-anti mouse secondary antibodies (Thermo Fisher Scientific, A-11001). DAPI staining was used to reveal all cells in brain sections. Consecutive Z-section images were obtained with a Zeiss LSM880 Airyscan Confocal Microscope (40x objective). Images taken at 0.5 µm depth intervals were averaged four times and processed using the Image Pro Premier 9.3 version. GFP labeled astrocytes were chosen randomly for quantification.
Vectors and lentivirus
Mouse Atg7 shRNA sequence: GCAGCTCATTGATAACCAT [Citation94] and control non-targeting shRNA sequence: ATCTCGCTTGGGCGAGAGT were cloned to the pGIPZ vector carrying GFP (Dharmacon, RMM4532). Mouse Tfeb shRNA sequence (TRCN0000085548): CGGCAGTACTATGACTATGAT and control non-targeting shRNA sequence: CTCGCTTGGGCGAGAGTAA were cloned to the pLKO.1 vector by the shRNA Core Facility of Albert Einstein College of Medicine. The human TFEB cDNA [Citation95] was cloned into the lentivirus vector plenti-CMV-GFP to replace the sequence of GFP. Empty plenti-CMV-GFP vector was used for control. pL_ESIP vector containing wild type human TFEB-GFP cDNA was kindly provided by Dr. Ricardo A. Feldman, University of Maryland [Citation96]. The S142A serine-to-alanine site mutation of TFEB-GFP were created by a biotech company, GeneScript, and confirmed with full length sequencing. Lentiviruses were produced by calcium phosphate–mediated transfection (Clontech Laboratories, 631312) of HEK293T cells with vector plasmids and packaging plasmids (psPAX2, Addgene, 12260 and pMD2.G, Addgene, 12259). Viruses were purified via ultra-centrifugation as described [Citation97]. Viral titers were determined by transducing HeLa cells (ATCC, CCL-2) and the final titer was diluted to 1 × 10⁶ units/μl for transfection.
Seahorse bioenergetic analysis
Real-time oxygen consumption rate (OCR) was simultaneously assessed in live astrocytes using a Seahorse Bioscience XF24 extracellular flux analyzer. Mouse primary astrocytes were seeded (2x10⁴ cells/well) and transfected in XF 24-well microplates. Before initiation of measurements, cells were rinsed and incubated with XF base medium (Agilent, 102353–100) supplemented with 25 mM glucose, 2 mM L-glutamine (Thermo Fisher Scientific, 25030081) and 1 mM sodium pyruvate (Thermo Fisher Scientific, 11360070), pH 7.4. After 45 min incubation in a CO2-free incubator at 37°C, OCR was recorded at baseline, followed by sequential additions of 0.8 μM oligomycin (Sigma Aldrich, 75351), 1.5 μM FCCP (Sigma Aldrich, C2920), and a mix of 1 μM antimycin A (Sigma Aldrich, A8674) and 1 μM rotenone (Sigma Aldrich, R8875) (based on optimization experiments). These compounds target different components of the mitochondrial electron transport chain to characterize bioenergetic parameters. Oligomycin was used to inhibit ATP synthase (complex V), and the decrease in OCR in response to oligomycin (OCRbaseline – OCRoligomycin) represented the mitochondrial respiration associated with cellular ATP production (ATP-linked OCR). Next, an uncoupler, FCCP (carbonyl cyanide-4-[trifluoromethoxy] phenylhydrazone) was added to collapse the electrochemical gradient to allow the respiratory chain to operate at its maximal rate. Finally, a mix of rotenone (complex I inhibitor) and antimycin A (complex III inhibitor) were added to shut down all mitochondrial respiration and reveal residual non-mitochondrial OCR, which enables the calculation of mitochondrial-specific respiration. The OCR was automatically recorded and calculated by the Seahorse XF24 software. The readouts in different conditions were used to define bioenergetic parameters as following: (1) Basal OCR = OCRbaseline – OCRRot+AA; (2) ATP-linked OCR = OCRbaseline – OCRoligomycin; (3) Maximal OCR = OCRFCCP – OCRRot+AA. Outliers of technical replicates outside the 2-standard deviation of the mean were discarded. Each experiment had 3 biological replicates. OCR values were normalized to total protein in each well (measured by BCA assay).
ATP assay
Intracellular ATP was determined by the luciferin/luciferase method using an ATP-Lite Assay Kit (Perkin-Elmer, 6016941) following manufacturer’s instruction. Briefly, primary astrocytes were cultured in a 96-well black-walled plate. At the end of Mn exposure, cells were lysed in the plate, and the substrate solution containing ATP-dependent enzyme luciferase and its substrate luciferin was added to each well. The plate was placed on an orbital shaker (700 rpm) for 5 min and incubated for 10 min. Luminescence was then measured by microplate reader. A standard curve was prepared to calculate the ATP values of the samples. The ATP content was normalized with the protein content in each sample.
Measurement of mitochondrial membrane potential (ΔΨm)
The mitochondrial membrane potential was measured by JC-1 dye using JC-1 Mitochondrial Membrane Potential Assay Kit (Abcam, ab113850). JC-1 dye exhibits potential-dependent accumulation in mitochondria, indicated by a fluorescence emission shift from green (~530 nm) to red (~590 nm). Consequently, mitochondrial depolarization is indicated by a decrease in the red/green fluorescence intensity ratio. Briefly, primary astrocytes were cultured in a 96-well black-walled plate. At the end of Mn (100 μM) exposure, cells were washed and incubated with 5 μM JC-1 at 37°C for 30 min and washed twice with dilution buffer. The fluorescence of JC-1 was measured by a multifunctional microplate reader at Ex/Em = 475/530 nm for the green fluorescence and Ex/Em = 535/590 nm for the red fluorescence. Mitochondrial membrane potential is calculated as the ratio of the red/green fluorescence after subtracting background signal.
Mitochondrial ROS production
MitoSOX Red (Thermo Fisher Scientific, M36008) was used to determine mitochondrial-derived superoxide (O2•−) generation. Primary astrocytes cultured on coverslips were washed and loaded with 1 µM MitoSOX Red in full medium for 20 min at 37°C. After 3 washes with PBS, coverslips were mounted on glass slide and immediately examined using an Olympus IX81 fluorescence microscope. Images were captured from randomly selected microscopic fields and fluorescent intensities were quantified by ImageJ software.
Transmission electron microscopy
Monolayer cell cultures were fixed with 2.5% glutaraldehyde (Sigma Aldrich, G5882), in 0.1 M sodium cacodylate buffer (Thermo Fisher Scientific, 50980232), postfixed with 1% osmium tetroxide (Sigma Aldrich, 75633) followed by 2% uranyl acetate (VWR International, 102092–284), dehydrated through a graded series of ethanol, cells were lifted from the monolayer with propylene oxide and embedded as a loose pellet in LX112 resin (LADD Research Industries, 21210) in eppendorf tubes. Ultrathin sections were cut on a Leica Ultracut UC7, stained with uranyl acetate followed by lead citrate and viewed on a JEOL 1400Plus transmission electron microscope at 80kv.
Quantitative RT-PCR
Total RNAs from cells were isolated using RNeasy® Mini Kit (Qiagen, 74106) and then reverse transcribed to cDNA using a High Capacity cDNA Reverse Transcription Kit (Thermo Fisher Scientific, 4368814) following the manufacturer’s instructions. Gene expression was detected by Taqman gene-expression assay probes (Thermo Fisher Scientific, Mouse Map1lc3b, Mm00782868_sH; Mouse Lamp1 Mm00495262_m1; Mouse Atp6v1h, Mm00505548_m1; Mouse Uvrag, Mm00724370_m1; Mouse Wipi1, Mm00461219_m1; Mouse Gapdh, Mm99999915_s1; GFP, Mr03989638_mr). The comparative 2−ΔΔCt method was used to determine fold difference and normalized to Gapdh.
PI staining
Neurons were treated with PI (Thermo Fisher P3566, 1:20,000 dilution in culture medium) for 15 min to assess neuronal death. Images of neurons with PI staining were taken with a fluorescence microscope and numbers of PI-positive neurons were quantified by a researcher blinded to group information.
Quantification and statistical analyses
All results were expressed as means ± SD. The Student t-test was used for two-group comparisons, and one-way ANOVA followed by Tukey’s post hoc test was used for experiments with more than 2 groups (R 3.1.1). Statistical significance was defined as p < 0.05.
Supplemental Material
Download MS Word (1.6 MB)Acknowledgments
The authors would like to thank Dr. David E. Fisher (Massachusetts General Hospital, Harvard Medical School) for providing human TFEB plasmid, and Dr. Ricardo A. Feldman (University of Maryland) for providing human TFEB-GFP plasmid. We thank Dr. Peng Guo and Leslie Cummins (Analytical Imaging Facility, Albert Einstein College of Medicine) for invaluable assistance with imaging.
Disclosure statement
No potential conflict of interest was reported by the authors.
Supplementary material
Supplemental data for this article can be accessed here.
Additional information
Funding
Related Research Data
References
- Bouabid S, Tinakoua A, Lakhdar-Ghazal N, et al. Manganese neurotoxicity: behavioral disorders associated with dysfunctions in the basal ganglia and neurochemical transmission. J Neurochem. 2016;136:677–691.
- Kwakye GF, Paoliello MM, Mukhopadhyay S, et al. Manganese-induced parkinsonism and parkinson’s disease: shared and distinguishable features. Int J Environ Res Public Health. 2015;12:7519–7540.
- Olanow CW. Manganese-induced parkinsonism and parkinson’s disease. Ann N Y Acad Sci. 2004;1012:209–223.
- Aschner M, Erikson KM, Herrero Hernandez E, et al. Manganese and its role in parkinson’s disease: from transport to neuropathology. Neuromolecular Med. 2009;11:252–266.
- Chen P, Chakraborty S, Mukhopadhyay S, et al. Manganese homeostasis in the nervous system. J Neurochem. 2015;134:601–610.
- Martinez-Finley EJ, Gavin CE, Aschner M, et al. Manganese neurotoxicity and the role of reactive oxygen species. Free Radic Biol Med. 2013;62:65–75.
- Khan K, Wasserman GA, Liu X, et al. Manganese exposure from drinking water and children’s academic achievement. Neurotoxicology. 2012;33:91–97.
- Oulhote Y, Mergler D, Barbeau B, et al. Neurobehavioral function in school-age children exposed to manganese in drinking water. Environ Health Perspect. 2014;122:1343–1350.
- Bouchard MF, Sauve S, Barbeau B, et al. Intellectual impairment in school-age children exposed to manganese from drinking water. Environ Health Perspect. 2011;119:138–143.
- Finkelstein MM, Jerrett M. A study of the relationships between parkinson’s disease and markers of traffic-derived and environmental manganese air pollution in two Canadian cities. Environ Res. 2007;104:420–432.
- Lynam DR, Roos JW, Pfeifer GD, et al. Environmental effects and exposures to manganese from use of methylcyclopentadienyl manganese tricarbonyl (MMT) in gasoline. Neurotoxicology. 1999;20:145–150.
- Morello M, Canini A, Mattioli P, et al. Sub-cellular localization of manganese in the basal ganglia of normal and manganese-treated rats an electron spectroscopy imaging and electron energy-loss spectroscopy study. Neurotoxicology. 2008;29:60–72.
- Sidoryk-Wegrzynowicz M, Aschner M. Role of astrocytes in manganese mediated neurotoxicity. BMC Pharmacol Toxicol. 2013;14:23.
- Karki P, Smith K, Johnson J Jr., et al. Role of transcription factor yin yang 1 in manganese-induced reduction of astrocytic glutamate transporters: putative mechanism for manganese-induced neurotoxicity. Neurochem Int. 2015;88:53–59.
- Bowman AB, Kwakye GF, Herrero Hernandez E, et al. Role of manganese in neurodegenerative diseases. J Trace Elem Med Biol. 2011;25:191–203.
- Karki P, Lee E, Aschner M. Manganese neurotoxicity: a focus on glutamate transporters. Ann Occup Environ Med. 2013;25:4.
- Farina M, Avila DS, da Rocha JB, et al. Metals, oxidative stress and neurodegeneration: a focus on iron, manganese and mercury. Neurochem Int. 2013;62:575–594.
- Smith MR, Fernandes J, Go YM, et al. Redox dynamics of manganese as a mitochondrial life-death switch. Biochem Biophys Res Commun. 2017;482:388–398.
- Hill BG, Benavides GA, Lancaster JR Jr., et al. Integration of cellular bioenergetics with mitochondrial quality control and autophagy. Biol Chem. 2012;393:1485–1512.
- Twig G, Shirihai OS. The interplay between mitochondrial dynamics and mitophagy. Antioxid Redox Signal. 2011;14:1939–1951.
- Lionaki E, Markaki M, Palikaras K, et al. Mitochondria, autophagy and age-associated neurodegenerative diseases: new insights into a complex interplay. Biochim Biophys Acta. 2015;1847:1412–1423.
- Nguyen TN, Padman BS, Lazarou M. Deciphering the molecular signals of PINK1/parkin mitophagy. Trends Cell Biol. 2016;26:733–744.
- Ashrafi G, Schwarz TL. The pathways of mitophagy for quality control and clearance of mitochondria. Cell Death Differ. 2013;20:31–42.
- Yoshimori T. Autophagy: a regulated bulk degradation process inside cells. Biochem Biophys Res Commun. 2004;313:453–458.
- Levine B, Klionsky DJ. Development by self-digestion: molecular mechanisms and biological functions of autophagy. Dev Cell. 2004;6:463–477.
- Nixon RA. The role of autophagy in neurodegenerative disease. Nat Med. 2013;19:983–997.
- Ryan BJ, Hoek S, Fon EA, et al. Mitochondrial dysfunction and mitophagy in parkinson’s: from familial to sporadic disease. Trends Biochem Sci. 2015;40:200–210.
- Gao F, Yang J, Wang D, et al. Mitophagy in parkinson’s disease: pathogenic and therapeutic implications. Front Neurol. 2017;8:527.
- Kerr JS, Adriaanse BA, Greig NH, et al. Mitophagy and alzheimer’s disease: cellular and molecular mechanisms. Trends Neurosci. 2017;40:151–166.
- Neuronal M-VM. Mitophagy in neurodegenerative diseases. Front Mol Neurosci. 2017;10:64.
- Gorojod RM, Alaimo A, Porte Alcon S, et al. The autophagic- lysosomal pathway determines the fate of glial cells under manganese- induced oxidative stress conditions. Free Radic Biol Med. 2015;87:237–251.
- Zhou Q, Fu X, Wang X, et al. Autophagy plays a protective role in Mn-induced toxicity in PC12 cells. Toxicology. 2018;394:45–53.
- Ma Z, Wang C, Liu C, et al. The role S-nitrosylation in manganese-induced autophagy dysregulation in SH-SY5Y cells. Environ Toxicol. 2017;32:2428–2439.
- Harris H, Rubinsztein DC. Control of autophagy as a therapy for neurodegenerative disease. Nat Rev Neurol. 2011;8:108–117.
- Klionsky DJ, Abdelmohsen K, Abe A, et al. Guidelines for the use and interpretation of assays for monitoring autophagy (3rd edition). Autophagy. 2016;12:1–222.
- Bowman AB, Aschner M. Considerations on manganese (Mn) treatments for in vitro studies. Neurotoxicology. 2014;41:141–142.
- Stanwood GD, Leitch DB, Savchenko V, et al. Manganese exposure is cytotoxic and alters dopaminergic and GABAergic neurons within the basal ganglia. J Neurochem. 2009;110:378–389.
- Mizushima N, Yoshimori T, Levine B. Methods in mammalian autophagy research. Cell. 2010;140:313–326.
- Tan JM, Wong ES, Kirkpatrick DS, et al. Lysine 63-linked ubiquitination promotes the formation and autophagic clearance of protein inclusions associated with neurodegenerative diseases. Hum Mol Genet. 2008;17:431–439.
- Ortinski PI, Dong J, Mungenast A, et al. Selective induction of astrocytic gliosis generates deficits in neuronal inhibition. Nat Neurosci. 2010;13:584–591.
- Chen H, Chan DC. Mitochondrial dynamics–fusion, fission, movement, and mitophagy–in neurodegenerative diseases. Hum Mol Genet. 2009;18:R169–76.
- Dodson M, Wani WY, Redmann M, et al. Regulation of autophagy, mitochondrial dynamics, and cellular bioenergetics by 4-hydroxynonenal in primary neurons. Autophagy. 2017;13:1828–1840.
- Martini-Stoica H, Xu Y, Ballabio A, et al. The autophagy–lysosomal pathway in neurodegeneration: a TFEB perspective. Trends Neurosci. 2016;39:221–234.
- Napolitano G, Ballabio A. TFEB at a glance. J Cell Sci. 2016;129:2475–2481.
- Settembre C, Di Malta C, Polito VA, et al. TFEB links autophagy to lysosomal biogenesis. Science. 2011;332:1429–1433.
- Palmieri M, Impey S, Kang H, et al. Characterization of the CLEAR network reveals an integrated control of cellular clearance pathways. Hum Mol Genet. 2011;20:3852–3866.
- Settembre C, Ballabio A. TFEB regulates autophagy: an integrated coordination of cellular degradation and recycling processes. Autophagy. 2011;7:1379–1381.
- Martina JA, Chen Y, Gucek M, et al. MTORC1 functions as a transcriptional regulator of autophagy by preventing nuclear transport of TFEB. Autophagy. 2012;8:903–914.
- Roczniak-Ferguson A, Petit CS, Froehlich F, et al. The transcription factor TFEB links mTORC1 signaling to transcriptional control of lysosome homeostasis. Sci Signal. 2012;5:ra42.
- Settembre C, Zoncu R, Medina DL, et al. A lysosome-to-nucleus signalling mechanism senses and regulates the lysosome via mTOR and TFEB. Embo J. 2012;31:1095–1108.
- Martinez-Vicente M. Autophagy in neurodegenerative diseases: from pathogenic dysfunction to therapeutic modulation. Semin Cell Dev Biol. 2015;40:115–126.
- Nah J, Yuan J, Jung YK. Autophagy in neurodegenerative diseases: from mechanism to therapeutic approach. Mol Cells. 2015;38:381–389.
- Pi H, Li M, Tian L, et al. Enhancing lysosomal biogenesis and autophagic flux by activating the transcription factor EB protects against cadmium-induced neurotoxicity. Sci Rep. 2017;7:43466.
- Song XB, Liu G, Liu F, et al. Autophagy blockade and lysosomal membrane permeabilization contribute to lead-induced nephrotoxicity in primary rat proximal tubular cells. Cell Death Dis. 2017;8:e2863.
- Song X, Li Z, Liu F, et al. Restoration of autophagy by puerarin in lead-exposed primary rat proximal tubular cells via regulating AMPK-mTOR signaling. J Biochem Mol Toxicol. 2017;31(3). doi:10.1002/jbt.21869.
- Kimura A, Ishida Y, Nosaka M, et al. Exaggerated arsenic nephrotoxicity in female mice through estrogen-dependent impairments in the autophagic flux. Toxicology. 2016;339:9–18.
- Zhang J, Cao R, Cai T, et al. The role of autophagy dysregulation in manganese-induced dopaminergic neurodegeneration. Neurotox Res. 2013;24:478–490.
- Rubinsztein DC, Cuervo AM, Ravikumar B, et al. In search of an “autophagomometer”. Autophagy. 2009;5:585–589.
- Mizushima N, Yoshimori T. How to interpret LC3 immunoblotting. Autophagy. 2007;3:542–545.
- Liu WJ, Ye L, Huang WF, et al. p62 links the autophagy pathway and the ubiqutin-proteasome system upon ubiquitinated protein degradation. Cell Mol Biol Lett. 2016;21:29.
- Shaid S, Brandts CH, Serve H, et al. Ubiquitination and selective autophagy. Cell Death Differ. 2013;20:21–30.
- O’Neal SL, Zheng W. Manganese toxicity upon overexposure: a decade in review. Curr Environ Health Rep. 2015;2:315–328.
- Schwake M, Schroder B, Saftig P. Lysosomal membrane proteins and their central role in physiology. Traffic. 2013;14:739–748.
- Eskelinen EL. Roles of LAMP-1 and LAMP-2 in lysosome biogenesis and autophagy. Mol Aspects Med. 2006;27:495–502.
- Kubik LL, Philbert MA. The role of astrocyte mitochondria in differential regional susceptibility to environmental neurotoxicants: tools for understanding neurodegeneration. Toxicol Sci. 2015;144:7–16.
- Motori E, Puyal J, Toni N, et al. Inflammation-induced alteration of astrocyte mitochondrial dynamics requires autophagy for mitochondrial network maintenance. Cell Metab. 2013;18:844–859.
- Wang K, Klionsky DJ. Mitochondria removal by autophagy. Autophagy. 2011;7:297–300.
- Youle RJ, Narendra DP. Mechanisms of mitophagy. Nat Rev Mol Cell Biol. 2011;12:9–14.
- Redmann M, Benavides GA, Berryhill TF, et al. Inhibition of autophagy with bafilomycin and chloroquine decreases mitochondrial quality and bioenergetic function in primary neurons. Redox Biol. 2017;11:73–81.
- Wu JJ, Quijano C, Chen E, et al. Mitochondrial dysfunction and oxidative stress mediate the physiological impairment induced by the disruption of autophagy. Aging (Albany NY). 2009;1:425–437.
- Milatovic D, Yin Z, Gupta RC, et al. Manganese induces oxidative impairment in cultured rat astrocytes. Toxicol Sci. 2007;98:198–205.
- Yin Z, Aschner JL, Dos Santos AP, et al. Mitochondrial-dependent manganese neurotoxicity in rat primary astrocyte cultures. Brain Res. 2008;1203:1–11.
- Milatovic D, Zaja-Milatovic S, Gupta RC, et al. Oxidative damage and neurodegeneration in manganese-induced neurotoxicity. Toxicol Appl Pharmacol. 2009;240:219–225.
- Li M, Pi H, Yang Z, et al. Melatonin antagonizes cadmium-induced neurotoxicity by activating the transcription factor EB-dependent autophagy-lysosome machinery in mouse neuroblastoma cells. J Pineal Res. 2016;61:353–369.
- Yuntao F, Chenjia G, Panpan Z, et al. Role of autophagy in methylmercury-induced neurotoxicity in rat primary astrocytes. Arch Toxicol. 2016;90:333–345.
- Higashi Y, Asanuma M, Miyazaki I, et al. Parkin attenuates manganese-induced dopaminergic cell death. J Neurochem. 2004;89:1490–1497.
- Zhang HT, Mi L, Wang T, et al. PINK1/parkin-mediated mitophagy play a protective role in manganese induced apoptosis in SH-SY5Y cells. Toxicol In Vitro. 2016;34:212–219.
- Alaimo A, Gorojod RM, Miglietta EA, et al. Manganese induces mitochondrial dynamics impairment and apoptotic cell death: a study in human Gli36 cells. Neurosci Lett. 2013;554:76–81.
- Sarkar S, Malovic E, Harischandra DS, et al. Manganese exposure induces neuroinflammation by impairing mitochondrial dynamics in astrocytes. Neurotoxicology. 2018;64:204–218.
- Puertollano R, Ferguson SM, Brugarolas J, et al. The complex relationship between TFEB transcription factor phosphorylation and subcellular localization. Embo J. 2018;37(11):e98804.
- Cortes CJ, La Spada AR. TFEB dysregulation as a driver of autophagy dysfunction in neurodegenerative disease: molecular mechanisms, cellular processes, and emerging therapeutic opportunities. Neurobiol Dis. 2019;122:83–93.
- Siddiqui A, Bhaumik D, Chinta SJ, et al. Mitochondrial quality control via the PGC1alpha-TFEB signaling pathway is compromised by parkin Q311X mutation but independently restored by rapamycin. J Neurosci. 2015;35:12833–12844.
- Reddy K, Cusack CL, Nnah IC, et al. Dysregulation of nutrient sensing and CLEARance in presenilin deficiency. Cell Rep. 2016;14:2166–2179.
- Mansueto G, Armani A, Viscomi C, et al. Transcription factor EB controls metabolic flexibility during exercise. Cell Metab. 2017;25:182–196.
- Li L, Friedrichsen HJ, Andrews S, et al. A TFEB nuclear export signal integrates amino acid supply and glucose availability. Nat Commun. 2018;9:2685.
- Decressac M, Mattsson B, Weikop P, et al. TFEB-mediated autophagy rescues midbrain dopamine neurons from alpha-synuclein toxicity. Proc Natl Acad Sci U S A. 2013;110:E1817–26.
- Gaven F, Marin P, Claeysen S. Primary culture of mouse dopaminergic neurons. J Vis Exp. 2014;(91):e51751.
- Pierzynska-Mach A, Janowski PA, Dobrucki JW. Evaluation of acridine orange, LysoTracker red, and quinacrine as fluorescent probes for long-term tracking of acidic vesicles. Cytometry A. 2014;85:729–737.
- Dodd CA, Ward DL, Klein BG. Basal ganglia accumulation and motor assessment following manganese chloride exposure in the C57BL/6 mouse. Int J Toxicol. 2005;24:389–397.
- Madison JL, Wegrzynowicz M, Aschner M, et al. Disease-toxicant interactions in manganese exposed huntington disease mice: early changes in striatal neuron morphology and dopamine metabolism. PLoS One. 2012;7:e31024.
- Drion CM, van Scheppingen J, Arena A, et al. Effects of rapamycin and curcumin on inflammation and oxidative stress in vitro and in vivo - in search of potential anti-epileptogenic strategies for temporal lobe epilepsy. J Neuroinflammation. 2018;15:212.
- Meikle L, Pollizzi K, Egnor A, et al. Response of a neuronal model of tuberous sclerosis to mammalian target of rapamycin (mTOR) inhibitors: effects on mTORC1 and Akt signaling lead to improved survival and function. J Neurosci. 2008;28:5422–5432.
- Fritz M, Klawonn AM, Nilsson A, et al. Prostaglandin-dependent modulation of dopaminergic neurotransmission elicits inflammation-induced aversion in mice. J Clin Invest. 2016;126:695–705.
- Singh R, Xiang Y, Wang Y, et al. Autophagy regulates adipose mass and differentiation in mice. J Clin Invest. 2009;119:3329–3339.
- Salma N, Song JS, Kawakami A, et al. Tfe3 and Tfeb transcriptionally regulate peroxisome proliferator-activated receptor gamma2 expression in adipocytes and mediate adiponectin and glucose levels in mice. Mol Cell Biol. 2017;37(15):e00608-16.
- Awad O, Sarkar C, Panicker LM, et al. Altered TFEB-mediated lysosomal biogenesis in Gaucher disease iPSC-derived neuronal cells. Hum Mol Genet. 2015;24:5775–5788.
- Yan J, Porch MW, Court-Vazquez B, et al. Activation of autophagy rescues synaptic and cognitive deficits in fragile X mice. Proc Natl Acad Sci U S A. 2018;115:E9707-E16.