
ABSTRACT
Chaperone-mediated autophagy (CMA) is the most selective form of lysosomal proteolysis. CMA modulates proteomic organization through selective protein degradation, with targets including metabolic enzymes, cell growth regulators, and neurodegeneration-related proteins. CMA activity is low in ad libitum-fed rodents but is increased by prolonged fasting. AKT negatively regulates CMA at the lysosomal membrane by phosphorylating and inhibiting the CMA regulator GFAP. We have previously reported that long-lived Pou1f1/Pit1 mutant (Snell) mice and ghr (growth hormone receptor) knockout mice (ghr KO) have lower AKT activity when fed compared to littermate controls, suggesting the hypothesis that these mice have increased baseline CMA activity. Here, we report that liver lysosomes from fed Snell dwarf mice and ghr KO mice have decreased GFAP phosphorylation and increased CMA substrate uptake activity. Liver lysosomes isolated from fed Snell dwarf mice and ghr KO mice injected with the protease inhibitor leupeptin had increased accumulation of endogenous CMA substrates, compared to littermate controls, suggesting an increase in CMA in vivo. Mice with liver-specific ablation of GH (growth hormone) signaling did not have increased liver CMA, suggesting that a signaling effect resulting from a loss of growth hormone in another tissue causes enhanced CMA in Snell dwarf and ghr KO mice. Finally, we find Snell dwarf mice have decreased protein levels (in liver and kidney) of CIP2A, a well-characterized CMA target protein, without an associated change in Cip2a mRNA. Collectively, these data suggest that CMA is enhanced downstream of an endocrine change resulting from whole-body ablation of GH signaling.
Abbreviations: CMA: chaperone-mediated autophagy; GH: growth hormone; ghr KO: growth hormone receptor knockout; LAMP2A: splice variant 1 of Lamp2 transcript; LC3-I: non-lipidated MAP1LC3; LC3-II: lipidated MAP1LC3; Li-ghr KO: liver-specific ghr knockout; MA: macroautophagy; MTORC1: mechanistic target of rapamycin kinase complex 1; MTORC2: mechanistic target of rapamycin kinase complex 2; PBS: phosphate-buffered saline.
Introduction
Autophagy is a process by which lysosomes recycle intracellular organelles and macromolecules. Four broad categories of autophagy are defined by their mechanisms of substrate delivery to the lysosome and include macroautophagy (MA), microautophagy, crinophagy, and chaperone-mediated autophagy (CMA) [Citation1]. MA is the best-studied mechanism of autophagy because of its conservation across eukaryotic phyla; it occurs when cytosolic substrates are sequestered in double-membraned vesicles called autophagosomes, which deliver cargo into lysosomes via membrane fusion [Citation2]. A nascent autophagosome, called a phagophore, is capable of semi-selective engulfment of a diverse range of cargo, including damaged/redundant organelles, proteins/aggregates, glycogen, nucleic acids, and lipid droplets [Citation1,Citation2]. Microautophagy occurs via the direct invagination of the lysosomal membrane, forming an autophagic tube that engulfs cytosol or pieces of organelles, which are internalized for degradation upon the scission of vesicles from the autophagic tube [Citation3]. A subset of cytosolic proteins can be taken-up selectively by late endosomes in the form of microautophagy (endosomal microautophagy), before fusion of the late endosomes with lysosomes [Citation4]. Crinophagy, the degradation of excess secretory material, occurs when secretory vesicles fuse directly with lysosomes – this is distinct from MA because it does not require double-membrane autophagosomes [Citation1,Citation5]. Chaperone-mediated autophagy (CMA) is a selective, vesicle-independent, lysosomal degradation pathway for intracellular proteins, which are translocated directly across the lysosomal membrane [Citation6]. CMA has only been identified biochemically in mammals and birds [Citation7]; however, recent gene expression analyses have revealed several species of fish express homologs of CMA genes, suggesting the hypothesis that CMA appeared early in vertebrate evolution [Citation8].
The relationship between autophagy and longevity has recently been a topic of intense research interest. Most studies have focused on MA, due to its conservation across model organisms, and due to the availability of tools to measure MA flux. Lysosomal protein degradation declines with age in C. elegans, Drosophila, and rodents [Citation9], and interventions that increase MA are sufficient to extend the healthy lifespans of all of these model systems [Citation10–15].
In mice, global overexpression of ATG5 increases MA, improves metabolic function, enhances insulin sensitivity, and extends the lifespan of both males and females for multiple transgenic lines [Citation10]. Corroborating these findings, mice with a knockin mutation, disrupting the inhibitory interaction between BCL2 and BECN1/Beclin1, show increased MA, reduced age-associated pathologies in heart and kidney tissues, a lower burden of cancer, and an extended lifespan for both males and females [Citation11]. Collectively, these data suggest that enhancing MA is sufficient to abrogate at least some age-related pathologies and extend the lifespan of mice.
The relationship between longevity and the other categories of autophagy, including CMA, is not well characterized. However, there is increasing evidence that CMA plays an important role in maintaining healthy tissue function with age. CMA activity declines with age in mice and rats [Citation16,Citation17]. The age-related decline in CMA is attributed to a reduction, at the lysosomal membrane, of LAMP2A (LAMP2A is the only LAMP2 isoform that can participate in CMA; it is encoded by splice variant 1 of the Lamp2 transcript), the primary component of the CMA translocation complex. Lower LAMP2A, in turn, is due to age-related changes in lysosomal membrane lipid dynamics, resulting in diminished LAMP2A stability [Citation18–20]. Rescuing the age-related decline of CMA in the liver by overexpression of LAMP2A reduces the age-associated intracellular accumulation of damaged proteins and results in improved organ function [Citation17].
The hypothesized primary function of CMA in healthy tissues of young animals is to modulate the abundance of a subset (approximately 40%) of cytosolic proteins through selective degradation [Citation7]. In mice, inhibition of CMA in the liver leads to global metabolic derangement and liver steatosis, resulting from the dysregulation of the levels of dozens of metabolic enzymes. CMA degrades neurodegeneration-associated proteins, including MAPT/Tau, HTT/Huntingtin, SNCA/α-synuclein, APP/amyloid precursor protein, and others, as reviewed by [Citation7]. Inhibition of CMA in the rat brain, via shRNA-mediated knockdown of LAMP2A, leads to the death of dopaminergic neurons in the substantia nigra, and the manifestation of Parkinson’s-like motor symptoms [Citation21]. Overexpression of LAMP2A in the rat brain is sufficient to protect against SNCA-mediated neuronal death [Citation22]. In cultured fibroblasts, inhibition of CMA by knocking down LAMP2A sensitizes cells to death by oxidative stress [Citation23]. CMA is also implicated in cellular transformation through its role in degrading CIP2A (cell proliferation regulating inhibitor of protein phosphatase 2A) [Citation24]. Selective blockage of CMA results in an accumulation of CIP2A, which decreases the activity of tumor suppressor PPP2/protein phosphatase 2A. When CIP2A levels are high, PPP2 is no longer able to dephosphorylate MYC/c-myc, leading to enhanced MYC stability, and cellular transformation [Citation24–26]. These examples, and numerous others, suggest that modulation of CMA, in the context of specific cell types, nutritional states, and other control pathways, is essential to maintaining healthy physiological function in multiple tissues. Collectively, these findings are consistent with the emerging hypothesis that the age-associated decline in CMA contributes to the manifestation of a range of age-associated pathologies [Citation7,Citation27].
In normal animals, CMA levels are relatively low in baseline state, i.e., in animals allowed ad libitum access to food, but increase in response to prolonged fasting of 16 h or more [Citation28]. CMA is regulated at the lysosomal membrane by the protein kinase AKT [Citation29]. AKT activity is regulated downstream of insulin signaling in response to food. When mice are fed, AKT activity is elevated, and CMA is suppressed [Citation29,Citation30]. Previous work in our lab has found that mice with longevity-promoting mutations that diminish signaling through the GH-IGF1 (insulin-like growth factor 1) axis, do not show the normal robust activation of AKT when they are re-fed after a period of food deprivation [Citation31]. This work suggests the hypothesis that mice with reduced GH-IGF1 signaling may have elevated CMA activity, even in their baseline, i.e., ad libitum fed, state. Moreover, mice deficient in GH-IGF1 signaling have reduced activity of MTOR complex 1 (MTORC1) when re-fed after food deprivation [Citation31,Citation32]. MTORC1 activity suppresses MA both through signaling events and the transcriptional downregulation of the expression of essential components of MA machinery, and inhibition of MTORC1 enhances MA [Citation33]. The decrease in MTORC1 activity in mice with reduced GH-IGF1 suggests the hypothesis that these long-lived mutant mice might also have increased MA.
Mice with genetic ablation of GH production (i.e., Snell dwarf or Ames dwarf) or disruption of GHR signaling (i.e., ghr KO) are dwarfs with reduced circulating IGF1 levels, low rates of cancer, altered carbohydrate metabolism, increased insulin sensitivity, and significant lifespan extension [Citation34–36]. Cultured dermal fibroblasts from Snell dwarf mice have enhanced resistance to multiple stressors, including H2O2, paraquat, cadmium, and ultraviolet radiation [Citation37]. Cultured fibroblasts from both ghr KO and Snell mice have increased MA under stress conditions, compared to fibroblasts from normal sibling controls [Citation38]. While these findings from fibroblasts are interesting, they provide only a limited insight into the ways in which the endocrine environment of a whole organism affects the regulation of autophagy [Citation1], justifying an exploration of changes to autophagy in Snell and ghr KO mice.
The endocrine basis of CMA control is unknown. We have therefore evaluated CMA and MA function in Snell and ghr KO mice. We found that liver lysosomes from ad libitum-fed Snell dwarf mice had a significant enhancement in the uptake of CMA substrates in vitro and in vivo. We observed a similar upregulation of baseline CMA in the liver lysosomes of ghr KO mice, suggesting that this CMA increase results from lower GH signaling. Liver-specific deletion of Ghr did not lead to enhanced CMA, suggesting that the effects of GHR reduction in some non-hepatic tissue indirectly enhances liver CMA in Snell and ghr KO mice. There were modest changes to hepatic MA in these mice, with a slight decrease in Snell, a slight increase in ghr KO, and no consistent change in Li-ghr KO. Finally, we showed that Snell dwarf mice had decreased kidney and liver levels of CIP2A, a well-characterized CMA target protein, without an associated change in Cip2a mRNA.
Results
Liver lysosomes from snell mice have increased uptake of CMA substrates and reduced uptake of MA substrates
The well-characterized decreases in both MTORC1 and AKT activity in multiple tissues of Snell dwarf mice [Citation31] suggest the hypotheses that there might be an increase in CMA (downstream of reduced AKT) and MA (downstream of reduced MTORC1). We first tested the hypothesis that these mice have increased CMA in liver tissue. To determine if Snell liver lysosomes have increased uptake of CMA substrates, we used a modified version of an in vivo lysosomal substrate uptake assay [Citation39]. Ad libitum-fed animals were injected with the protease inhibitor leupeptin, or with PBS, as vehicle control. We euthanized the animals 2 h later, and lysosomes were isolated from liver tissue. The increase of a lysosomal substrate protein in the lysosome fraction in response to leupeptin treatment (over the PBS treatment control) strongly suggests that under the testing conditions, lysosomes actively degraded the substrate protein. Leupeptin injection caused the accumulation of three well-characterized CMA substrates (ENO1, ACADL, and GAPDH [Citation39,Citation40]) in Snell liver lysosomes much more than in the lysosomes of sibling controls (). PPID/cyclophilin 40 is a substrate of endosomal microautophagy [Citation4,Citation39] used in previous reports to control for changes in this pathway when examining changes in CMA [Citation39]. PPID accumulated to a similar extent in lysosomes from control and Snell mice ( and ), suggesting that the relative increase in ENO1, ACADL, and GAPDH in Snell lysosomes over control lysosomes could not be attributed to endosomal microautophagy. To control for successful administration of leupeptin, we blotted for the presence of CTSD (cathepsin D) in liver lysosomes (). CTSD, a lysosomal protease, has been shown to have decreased lysosomal levels after leupeptin treatment [Citation39]. We only included in our analysis, sample sets (both lysosomes and whole tissue lysates from the same animals) where lysosomal CTSD was undetectable in leupeptin-treated samples (this control was used for the experiments shown in and all subsequent experiments relying on leupeptin treatment). There was no difference between the genotypes in the enrichment of lysosomal markers in the lysosomal fraction, or its purity (Fig. S1). Together, these data suggest that the differences between the control and Snell lysosomes did not arise from differences in leupeptin administration or fraction preparation.
Figure 1. Liver lysosomes of fed Snell mice show more uptake of CMA substrates than lysosomes from littermate controls. (A) Representative western blots of liver lysosomes from control (C) and Snell (S) mice 2 h after treatments with leupeptin (100 mg/kg body weight) or PBS vehicle control. (B-D) Quantifications of the abundance of CMA substrates GAPDH, ENO1, and ACADL in lysosomes shown in (A). (E) Quantification of PPID, endosomal microautophagy substrate. (F) Quantification of HSPA8, CMA chaperone. (G) Representative western blots for binding and uptake assays for CMA substrate GAPDH, quantified in (H). (I) Representative western blots for binding and uptake assays for CMA substrate MAPT, quantified in (J). For (B-F), n = 9 of each treatment group, 2-way ANOVA results are reported below each bar graph. Comparisons plotted on the bar graphs are results of Student’s t-test. For (H & J), n = 6 of each treatment group, the results of Student’s t-test are shown on the graphs. Error bars are S.E.M
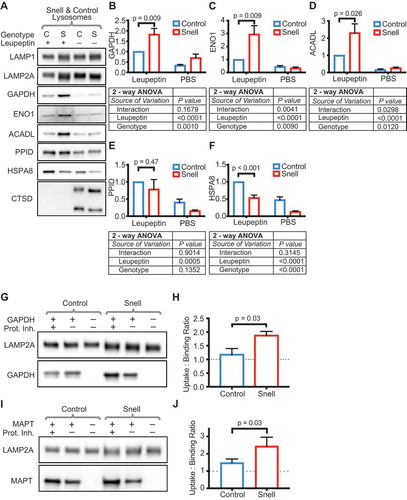
HSPA8/Hsc70 is the cytosolic chaperone responsible for CMA substrate selection. HSPA8 recognizes a pentapeptide motif related to KFERQ [Citation41,Citation42], present in CMA substrates, which make up about 40% of cytosolic proteins [Citation7]. HSPA8 participates in the trafficking of substrates to the lysosomal membrane and the unfolding of substrates for translocation into the lysosomal lumen, in cooperation with DNAJB1/HSP40, HSP90AB1/HSP90, ST13/HSP70-interacting protein, and STIP1/HSP70-HSP90 organizing protein [Citation43]. HSPA8 contains a KFERQ CMA targeting motif, and it is taken into the lysosomal lumen via CMA machinery [Citation44]. In the lysosomal lumen, HSPA8 is thought to participate in CMA [Citation44]. Leupeptin treatment has been shown to cause a lumenal accumulation of HSPA8 [Citation44]. We hypothesized that lysosomes from Snell liver would have more HSPA8 than lysosomes from sibling controls, but unexpectedly, Snell lysosomes had less HSPA8 ( and ); we note, however, that leupeptin treatment caused lysosomal accumulation of HSPA8 (in both genotypes), consistent with previous reports. These data suggest that the increase in the uptake in CMA substrates in Snell lysosomes is not due to having more lumenal HSPA8.
In rat liver, CMA is performed by a subpopulation of lysosomes that can be isolated by multi-step density centrifugation [Citation30,Citation44]. Isolation of this subpopulation for experimental evaluation is not practical when starting with the much smaller amount of material available from Snell dwarf mice (approximately 4–5% of the body size of the male Wistar rats used in previously reported experiments [Citation45], 7–12 g vs. 200–250 g). Despite this experimental limitation, we decided to confirm biochemically that there was indeed an increase in CMA in Snell lysosomes, using an in vitro binding and uptake assay, an established method for testing CMA activity, that was originally used to measure CMA from mixed populations of lysosomes [Citation21,Citation40,Citation45]. Briefly, the lysosomal fraction is incubated with recombinant HSPA8 and a known CMA substrate, either with or without protease inhibitors. After the incubation, the lysosomes are washed, pelleted, and analyzed by western blotting for the accumulation of the CMA substrate. The ratio of CMA substrate present in the lysosomes treated with protease inhibitor over lysosomes not treated with protease inhibitor is taken to represent the “uptake” of the substrate into the lysosomes. Previous work in rats found that GAPDH uptake was nearly undetectable in liver lysosomes from ad libitum-fed rats, but increased dramatically after prolonged (16 h or more) starvation [Citation28]. We isolated lysosomes from untreated (no leupeptin or PBS injections) Snell and littermate control mice, to use for uptake assays. Consistent with previous findings, lysosomes from ad libitum-fed control mice showed little uptake of GAPDH and MAPT (well-characterized CMA substrates [Citation7,Citation22,Citation45]), and lysosomes from Snell mice showed significantly more uptake of GAPDH and MAPT (). The method of lysosome isolation used in this study enriches highly for LAMP2A, the rate-limiting component of CMA, but does not enrich for key components of ESCRT complex-mediated endosomal microautophagy [Citation4] (Fig. S1). This result suggests that in vitro substrate uptake is facilitated by CMA machinery, rather than microautophagy machinery. Collectively, these data indicate the Snell dwarf mice, when fed ad libitum, have elevated levels of CMA in the liver. This suggests that the endocrine signals that distinguish Snell mice from littermate control mice influence CMA activity.
Liver lysosomes from ghr KO mice have increased in vivo uptake of CMA substrates
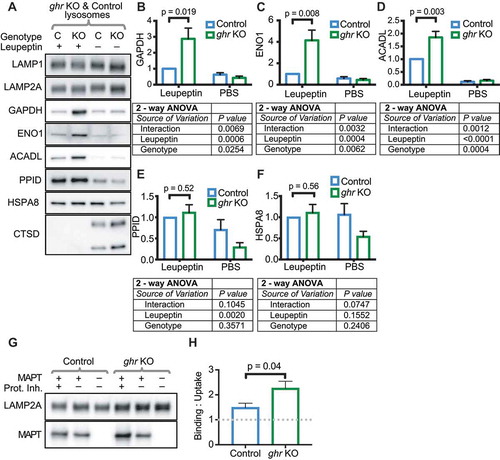
The Pou1f1/Pit1 mutation in Snell dwarf mice causes underdevelopment of the anterior pituitary, causing a loss of the secretion of GH, thyroid-stimulating hormone, and PRL (prolactin) [Citation46], resulting in many downstream endocrine and metabolic changes [Citation47]. Many of the Snell dwarf phenotypes, including slowed aging and increased lifespan, are shared with ghr KO mice [Citation34,Citation35]. ghr KO mice show the same reduced response in AKT activation when re-fed after fasting [Citation31], suggesting the hypothesis that they will show the same changes to CMA as Snell dwarf mice. We injected ad libitum-fed ghr KO and sibling control mice with leupeptin or PBS (control), and isolated lysosomes to examine substrate accumulation. Just as with Snell dwarf lysosomes, lysosomes from ghr KO liver accumulated significantly more GAPDH, ACADL, and ENO1 than lysosomes from sibling controls, suggesting an increase in CMA activity (). Liver lysosomes from ghr KO mice accumulated PPID to the same extent as lysosomes from sibling controls in response to leupeptin treatment, suggesting no change in endosomal microautophagy ( and ). There was no significant difference in the abundance of HSPA8 between the lysosomes of ghr KO and control mice ( and ). To verify that ghr KO lysosomes are more active for CMA, we performed an in vitro binding and uptake assay with CMA substrate MAPT using liver lysosomes isolated from untreated (no leupeptin or PBS injection) mice. Indeed, lysosomes from ghr KO liver showed significantly more uptake of MAPT than lysosomes from sibling controls ( and ). Collectively, these data suggest that GH, or a signaling event downstream of GH, suppresses hepatic CMA. Genetic abrogation of GH signaling promotes hepatic CMA, even in mice with ad libitum access to food.
Figure 2. Liver lysosomes of fed ghr KO mice show more uptake of CMA substrates than lysosomes from littermate controls. (A) Representative western blots of liver lysosomes from control (C) and ghr KO (KO) mice 2 h after treatments with leupeptin (100 mg/kg body weight) or PBS vehicle control. (B-D) Quantifications of the abundance of CMA substrates GAPDH, ENO1, and ACADL in lysosomes shown in (A). (E) Quantification of PPID, endosomal microautophagy substrate. (F) Quantification of HSPA8, CMA chaperone. (G) Representative western blots for binding and uptake assays for CMA substrate MAPT, quantified in (H). For (B-F), n = 6 of each treatment group, 2-way ANOVA results are reported below each bar graph. Comparisons plotted on the bar graphs are results of Student’s t-test. For (H), n = 6 of each treatment group; the results of Student’s t-test are shown on the graphs. Error bars are S.E.M
Liver lysosomes from mice with a liver-specific ghr knockout do not show increased CMA activity
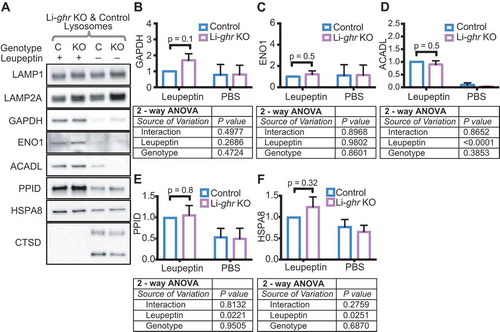
The increase in hepatic CMA in ghr KO and Snell mice could arise from a direct effect of reduced growth hormone signaling in the liver, or from another uncharacterized endocrine change resulting from the loss of GH signaling in another tissue. To distinguish between these possibilities, we examined lysosomal substrate degradation in liver lysosomes of mice with a liver-specific knockout of the Ghr (Li-ghr KO) [Citation48]. We injected control and Li-ghr KO mice with leupeptin or PBS, and isolated lysosomes to measure the accumulation of CMA substrates. The CMA substrates, GAPDH, ENO1, and ACADL, did not show more accumulation in the lysosomes of Li-ghr KO mice than in the lysosomes of their sibling controls (). PPID accumulated to an equal extent in the lysosomes of Li-ghr KO mice, indicating no change in endosomal microautophagy ( and ). There was no significant difference in the abundance of HSPA8 between the lysosomes of Li-ghr KO and control mice ( and ). These data suggest that the increase in liver CMA found in the Snell and ghr KO mice is not a direct effect of reduced GH signaling in the liver, but is more likely to be the result of an endocrine change downstream of loss of GH signaling in another tissue.
Figure 3. Liver lysosomes of fed Li-ghr KO mice do not show more uptake of CMA substrates than lysosomes from littermate controls. (A) Representative western blots of liver lysosomes from control (C) and Li-ghr KO (KO) mice 2 h after treatments with leupeptin (100 mg/kg body weight) or PBS vehicle control. (B-D) Quantifications of the abundance of CMA substrates GAPDH, ENO1, and ACADL in lysosomes shown in (A). (E) Quantification of PPID, endosomal microautophagy substrate. (F) Quantification of HSPA8, CMA chaperone. For (B-F), n = 5 of each treatment group, 2-way ANOVA results are reported below each bar graph. Comparisons plotted on the bar graphs are results of Student’s t-test. Error bars are S.E.M
Snell and ghr KO mice have changes in LAMP2A
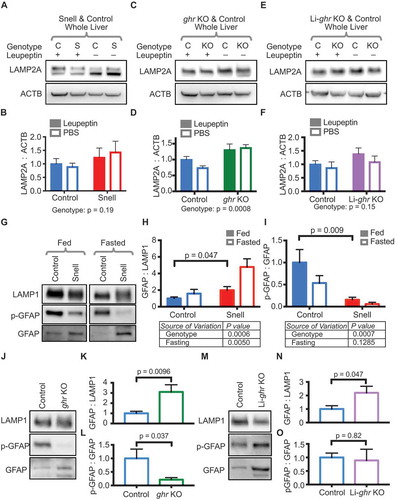
The translocation of CMA substrates into the lysosomal lumen through the LAMP2A translocation complex is the rate-limiting step of CMA. An age-associated decrease in LAMP2A protein abundance causes a decline in CMA with age [Citation16,Citation49]. The transcript abundance for LAMP2A does not decline with age; instead, LAMP2A protein levels decrease because of changes to membrane dynamics that reduce the half-life of the protein [Citation18,Citation20]. Genetic manipulations that boost LAMP2A protein levels protect against age-associated diseases in the liver and brain [Citation17,Citation22]. We tested the possibility that the enhancement of CMA in Snell and ghr KO mice might relate to an increase in LAMP2A protein levels or stability. We measured LAMP2A abundance in whole liver lysate from Snell, ghr KO, and Li-ghr KO mice, with leupeptin or PBS vehicle treatment (). 2-way ANOVA did not detect a significant interaction between the genotype and the leupeptin treatment for any of the models tested (Snell, ghr KO, Li-ghr KO, and their respective controls), suggesting that there was no difference between the genotypes in LAMP2A turnover/degradation, over the 2-h course of the leupeptin treatment. For ghr KO mice, but not Snell or Li-ghr RKO, the 2-way ANOVA revealed a significant genotype effect on LAMP2A abundance, with ghr KO mice having significantly more LAMP2A in total liver tissue than their sibling controls ().
Figure 4. Liver lysosomes from Snell and ghr KO mice have changes in LAMP2A and lysosomal GFAP. (A, C, and E) Representative western blots showing LAMP2A levels in the liver tissue of Snell (S), ghr KO (KO), Li-ghr KO (KO), and their appropriate controls (C). In the Snell dwarf mice and littermate controls, where two specific bands of LAMP2A are present, LAMP2A levels are presented as the sum of both bands. (B, D, and F) Quantifications of LAMP2A levels in liver tissue. Solid bars represent data from leupeptin-treated mice; open bars are for PBS vehicle controls. (G) Representative western blots of GFAP and p-GFAP on lysosomes from fed and fasted control and Snell mice. The side-by-side images shown are from the same blot with intervening lanes cropped out. Solid bars are data from fed mice; open bars are for fasted mice. (H) Quantification of total GFAP on liver lysosomes from (G), with LAMP1 used to adjust for loading. (I) Quantifications of p-GFAP:GFAP of data shown in (G). (J) Representative western blots of lysosomes from fed ghr KO and control mice, showing relative GFAP and p-GFAP levels, using LAMP1 to control for loading. Total lysosomal GFAP is quantified in (K), with p-GFAP/GFAP quantified in (L). (M) Representative western blots of lysosomes from fed Li-ghr KO and control mice, showing relative GFAP and p-GFAP levels, using LAMP1 to control for loading. Total lysosomal GFAP is quantified in (N), with p-GFAP:GFAP quantified in (O). In (B, D, and F), 2-way ANOVA was performed, and there was no significant interaction detected between genotype and leupeptin treatment, and there was no significant effect of leupeptin treatment. The genotype effect (significant only for ghr KO) is shown below the bar graphs. In (H and I), 2-way ANOVA found no significant interaction between genotype and fasting state; individual effects of genotype and fasting are shown below the bar graphs. In all bar graphs where comparisons are plotted directly on the graph, the p-value is derived by unpaired t-test. Error bars are S.E.M
We noticed a shift in the molecular weight of LAMP2A in liver lysosomes (wider band migrating lower on the gel) and in liver tissue (higher abundance of a lower band) of Snell dwarf mice (Fig. S2A and B). Like other lysosomal transmembrane proteins, LAMP2A is post-translationally modified by N-linked glycans [Citation49]. To confirm that the molecular weight shift in LAMP2A in Snell mice was due to a change in the glycosylation pattern (as opposed to another post-translational modification), we treated liver lysosomal preparations with PNGaseF to remove all N-linked glycans. The predicted molecular weight of LAMP2A is 45 kDa, but in liver tissue, the protein typically migrates at approximately 90 kDa. After PNGaseF treatment, LAMP2A from both Snell and control mice migrated at the same molecular weight, around 45 kDa, suggesting that a change in glycosylation accounts for the effects of the Snell dwarf genotype on LAMP2A molecular weight (Fig. S2C). The reduced molecular weight of LAMP2A in Snell dwarf mice is not necessarily a result of reduced glycosylation, in that treatment of lysosomal protein extracts with Neuraminidase to remove negatively charged sialic acid modifications caused an upward shift in apparent molecular weight of LAMP2A (to approximately the same size) from both Snell and control mice (Fig. S2D). Further biochemical analysis is needed to identify the exact changes in glycosylation of LAMP2A. N-linked oligosaccharides are essential to protect LAMP1 and LAMP2 from proteolysis [Citation50]. Because LAMP2A is the rate-limiting component of CMA [Citation7], we used an established method to monitor LAMP2A degradation, incubating purified lysosomes at 37ºC, allowing baseline levels of lysosomal turnover of LAMP2A to occur. We found that there was no change in the degradation rate of lysosomal LAMP2A between Snell and control animals (Fig. S2E and F). For some glycosylated proteins, glycosylation patterns change depending upon translation rates [Citation51]. Snell dwarf mice have reduced total protein translation rates, compared to sibling controls, based on reduced deuterium incorporation into new proteins when the animals are administered deuterated water [Citation52]. To test the hypothesis that reducing the translation rate can cause a shift in LAMP2A glycosylation, we treated primary mouse tail-tip fibroblasts with 4EGI-1, a mild and reversible inhibitor of cap-dependent translation. We found that there was a shift in the molecular weight of LAMP2A, similar to what we observed in Snell dwarf liver (Fig. S2G), suggesting that the previously reported reduction in translational flux in Snell dwarf mice is upstream of the LAMP2A glycosylation change.
Snell, ghr KO, and Li-ghr KO mice have changes in lysosomal GFAP
Many of the subcellular regulators of CMA act by regulation of GFAP (glial fibrillary acidic protein, which despite its name, is expressed in many cell types) [Citation29,Citation30,Citation53]. Unphosphorylated GFAP is active at the lysosomal membrane, where it stabilizes the multimerization of LAMP2A to form the CMA translocation complex, promoting CMA, in the fasting state [Citation30,Citation53]. Phosphorylation of GFAP at S8 by AKT (after feeding) promotes GFAP self-association, sequestering GFAP away from LAMP2A, leading to the disassembly of the CMA translocation complex and thus to lower CMA activity [Citation29].
Lower AKT activation in response to re-feeding in Snell and ghr KO mice could lead to lower GFAP phosphorylation, and thus to higher CMA. By western blotting, we quantified total GFAP and p-GFAP on lysosomes from control and Snell mice, either fasted (18 h) or given ad libitum access to food (). As we hypothesized, there was a significant reduction in GFAP phosphorylation on Snell lysosomes (), when compared to the sibling controls, even when the mice were fed. Unexpectedly, we found that there was an increase in the total amount of GFAP on lysosomes from Snell dwarf mice (both fed and fasted; ). Similar to the Snell lysosomes, lysosomes from fed ghr KO mice also showed a significant increase in the total abundance of lysosomal GFAP and a significant decrease in lysosomal GFAP phosphorylation ().
Lysosomes from fed Li-ghr KO mice had an increase in total GFAP levels, like the Snell and ghr KO mice ( and ). However, the GFAP phosphorylation was proportionally increased; and thus, there was no change in the ratio of GFAP phosphorylation. ( and ). The ratio of GFAP phosphorylation is what regulates CMA because a phosphorylated GFAP molecule can sequester an unphosphorylated GFAP molecule away from the LAMP2A translocation complex [Citation29,Citation30]. Thus, based on the observation that there is no change in the ratio of phosphorylated GFAP on Li-ghr KO lysosomes, we would not expect an increase in CMA, consistent with the fact that we saw no increase in CMA substrate accumulation in Li-ghr KO lysosomes (compared to littermate controls) after leupeptin treatment.
The snell and ghr KO mutations have opposite effects on MA
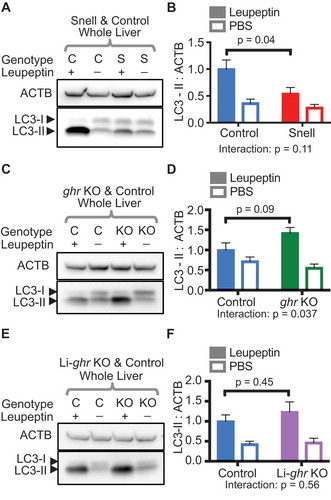
After identifying an enhancement of CMA in Snell and ghr KO mice, we examined changes to MA in Snell, ghr KO, and Li-ghr KO mice. We analyzed liver tissue from leupeptin- and PBS-treated mice of all three genotypes (and their respective controls) for LC3-II (lipidated MAP1LC3) flux. Leupeptin treatment is an established method for measuring LC3-II flux in several mouse tissues, including the liver, because it works well at low doses without causing inhumane discomfort to test animals [Citation54]. Drugs that block the fusion of the autophagosome and lysosome, such as bafilomycin and chloroquine, are often preferred for MA flux experiments in cultured cells. However, these drugs are not well suited for in vivo use. Chloroquine has low potency in vivo, and bafilomycin induces symptoms of pain and distress in mice [Citation54]. Leupeptin injection caused a much lower accumulation of LC3-II in livers of Snell mice compared to control mice, suggesting a decrease in MA in Snell liver ( and ). The lysosomal fraction of Snell liver tissue also showed less accumulation of SQSTM1/p62 and LC3-II, in response to leupeptin treatment, than the sibling controls (Fig. S3A-C). Unlike Snell dwarf mice, ghr KO mice had more liver LC3-II flux (2-way ANOVA interaction p = 0.037; and ), showing a similar trend in the liver lysosomal fraction (Fig. S3D-F). Collectively, these data suggest that the hormonal differences between the Snell and ghr KO mice have opposing influences on the regulation of MA. In Li-ghr KO whole liver tissue, there was no change in LC3-II flux compared to their sibling controls ( and ); however, in the lysosomal fraction, Li-ghr KO mice had much more lysosomal SQSTM1 (2-way ANOVA genotype effect p = 0.0087), and slightly more LC3-II accumulation (Fig. S3G-I). While these data may suggest a change in lysosomal biology in Li-ghr KO mice, whole liver MA flux is unchanged. In all the mouse models tested, there were no differences in LC3-II levels between the PBS-treated mutants, and their PBS-treated controls.
Figure 5. LC3-II flux is decreased in the liver of Snell mice, increased in the liver of ghr KO mice, and unchanged in Li-ghr KO. (A) Representative western blots of LC3 from the whole liver of fed control (C) and Snell (S) mice, treated with leupeptin or PBS (2 h before euthanasia), quantified in (B). (C) Representative western blots of LC3 from the whole liver of fed control (C) and ghr KO (KO) mice, treated with leupeptin or PBS (2 h before euthanasia), quantified in (D). (E) Representative western blots of LC3 from the whole liver of fed control (C) and Li-ghr KO (KO) mice, treated with leupeptin or PBS (2 h before euthanasia), quantified in (F). For all bar graphs, solid bars represent data from leupeptin-treated mice, and open bars are from PBS vehicle controls. 2-way ANOVA was conducted to determine if the genotype of the mice modified the effect of the leupeptin treatment (interaction term), with the interaction p-value plotted below each bar graph. In all bar graphs, p-values plotted directly on the graph are derived by unpaired t-test. Error bars are S.E.M
Snell dwarf mice have a reduction in the levels of CMA substrate CIP2A in multiple tissues
Others have proposed that the primary purpose of CMA is to modulate protein abundance, thus shaping the organization of the proteome [Citation7]. While a number of studies have examined the role of CMA in controlling the abundance of specific proteins in cultured cells and rat brain [Citation22,Citation24,Citation55], much work remains to clarify how CMA shapes the proteome in vivo. We chose to test the hypothesis that CMA is affecting protein abundance in Snell dwarf tissues by examining changes in the tissue abundance of CIP2A, a protein whose levels have been demonstrated to be controlled by CMA [Citation24].
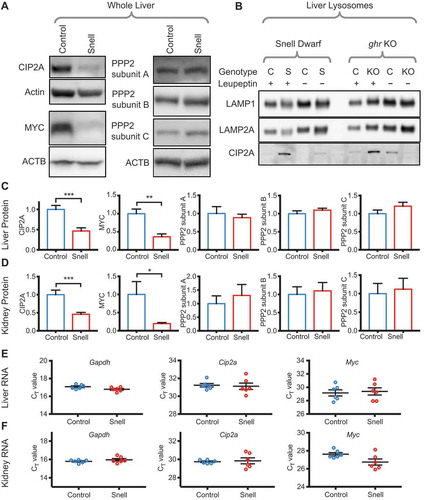
Activation of CMA in cultured mouse cells reduces the level of CIP2A through selective degradation [Citation24]. CIP2A is a well-characterized inhibitor of the tumor-suppressor PPP2, and CIP2A-mediated inhibition of PPP2 leads to an increase in MYC levels, by preventing the PPP2-mediated dephosphorylation of MYC that precedes MYC ubiquitination and proteasomal degradation [Citation25,Citation26]. High CIP2A expression is characteristic of aggressive breast cancer, suggesting a link to human neoplasia [Citation56]. We hypothesized that the increase in CMA in Snell dwarf mice would result in a decrease in CIP2A protein levels. We found a decrease in the ratio of p-GFAP to total GFAP in the liver, kidney, and muscle of Snell dwarf mice (Fig. S4A and B), consistent with the hypothesis that CMA is upregulated in all three of these tissues. We found a significant reduction in CIP2A protein levels in all three tissues in Snell dwarf mice (, and S4C), consistent with the hypothesis of augmented degradation of this CMA-sensitive protein. In addition, CIP2A protein was enriched in liver lysosomes from both Snell and ghr KO mice after leupeptin injection, suggesting that this protein has enhanced uptake in vivo (). We found no change in mRNA levels of Cip2a in the liver and kidney ( and ), suggesting that the decrease in CIP2A protein level is not due to altered mRNA levels. Because CIP2A-dependent inhibition of PPP2 is an important regulator of MYC levels, we hypothesized that decreased CIP2A would lead to a decrease in MYC protein levels, without a change in Myc mRNA. MYC protein levels were indeed significantly decreased in all three tissues (, and S4C), and this decline could not be attributed to alterations in PPP2, whose three subunits were unaltered in these tissues. qPCR of Myc mRNA from liver and kidney revealed that the decreases in protein level were not attributable to decreases in mRNA ( and ). Together, these data are consistent with the hypothesis that activating CMA results in changes in protein abundance; however, large-scale proteomic analyses will be necessary to produce a comprehensive picture of how CMA activation modifies proteomes in long-lived Snell and ghr KO mice.
Figure 6. Snell dwarf mice have a reduction in the levels of CMA substrate CIP2A in the liver and kidney. (A) Representative western blots of whole liver lysate, showing relative protein levels of CIP2A, MYC, and the three PPP2 subunits (the antibody for subunit A recognizes PPP2R1A and PPP2R1B; the antibody for subunit B recognizes PPP2R2A, PPP2R2B, PPP2R2G, PPP2R2D, and the antibody subunit C recognizes PPP2CA and PPP2CB). (B) Western blot of isolated lysosomes from the liver of fed Snell and sibling control mice and ghr KO and sibling control mice injected with leupeptin or PBS control, showing accumulation of CIP2A in lysosomes of Snell and ghr KO mice. (C) Quantification of relative protein levels of CIP2A, MYC, and the PPP2 subunits from the liver, as shown in (A), normalized to the sibling controls. (D) Quantification of relative protein levels of CIP2A, MYC, and the PPP2 subunits from kidney, normalized to the sibling controls. (E & F) Relative mRNA levels of Myc and Cip2a mRNA from liver and kidney, respectively. Gapdh is shown as a control. Error bars are S.E.M. Where applicable, significant t-test results are indicated. * p < 0.05, ** p < 0.01, *** p < 0.001
Discussion
Prior to our work, there has been little information about the endocrine basis of CMA control, or about the possible role of augmented CMA in prolonging the healthy lifespan of ghr KO and Snell dwarf mice. Here we reported that hepatic CMA, which usually has low activity in normal mice given free access to food, was increased in two long-lived mouse stocks with diminished GH and IGF1 signals, i.e., ghr KO and Snell dwarf mice. CMA regulation in fed Snell and ghr KO mice share many features of CMA regulation in normal, non-mutant mice in the fasted condition, suggesting that long-lived mice, through augmentation of CMA, might gain some of the physiological benefits of fasting, even when fed. Our data suggested the conclusion that life-long reduction in GH signaling is sufficient to promote enhancement of CMA, but our data do not allow us to determine if this increased level of baseline CMA requires deprivation of GH in adult life, or if instead, it reflects enduring effects of the early-life neuroendocrine environment. Notably, CMA is not enhanced in Li-ghr KO mice, which are not long-lived despite their decline in serum IGF1 levels [Citation48,Citation57]. Augmenting CMA activity by overexpression of LAMP2A in a tissue-specific manner has been shown to abrogate the development of some age-related pathologies [Citation17,Citation22], and the role of CMA in healthspan and lifespan is of great scientific interest.
Disrupting CMA by genetic methods in adult rodent tissues has been shown to lead to dysregulation of a number of proteins, leading to tissue dysfunction and/or cell death [Citation21,Citation23,Citation24,Citation39]. These findings suggest that one of the primary functions of CMA may be to shape the architecture of the proteome by removing specific proteins related to distinct physiological pathways (as opposed to simply removing damaged proteins). To see if an increase in CMA could alter the levels of a target protein in vivo, we measured protein levels of CIP2A in tissues from Snell mice and noted a decrease in CIP2A protein that is not dependent on a change in its mRNA. CIP2A can be oncogenic through its inhibition of the tumor-suppressor PPP2, resulting in an increase in MYC, by preventing the PPP2-mediated dephosphorylation of MYC that precedes MYC ubiquitination and proteasomal degradation [Citation25,Citation26]. Interestingly, we also observed a decrease in MYC protein levels in the liver, kidney, and muscle in Snell dwarf mice (without mRNA decrease), consistent with the observed decrease in CIP2A. Notably, reducing MYC levels alone is sufficient to increase mouse lifespan and healthspan [Citation58].
We hypothesize that elevated CMA may play a role in increased longevity and cancer resistance shown by Snell and ghr KO mice, an idea consistent with the lack of CMA alteration in the Li-ghr KO stock, which is not long-lived [Citation34,Citation35,Citation47,Citation48]. Moreover, our findings are consistent with the emerging hypothesis that elevating CMA levels in normal mice may promote increased healthspan and lifespan [Citation7]. Further work is warranted to characterize the endocrine control of CMA so that methods can be developed to enhance CMA in normal mice and to investigate the role of CMA in healthspan and lifespan further.
The changes to MA that we observed in Snell and ghr KO mice provide some new insight into how endocrine signals control MA. While the decrease in circulating INS/IGF1 and increase in circulating ADIPOQ (adiponectin, C1Q and collagen domain containing) found in Snell mice might be expected to increase hepatic MA by way of decreasing MTORC1 activity [Citation59–61], we unexpectedly observed a decrease in MA. Snell dwarf mice are hypothyroid, and mice with mutations inactivating the thyroid hormone receptor have a reduction in hepatic MA [Citation62], most likely because of the transcriptional downregulation of autophagy genes downstream of thyroid reduction. This notion suggests the hypothesis that MA activating effects of reduced INS/IGF1 and increased ADIPOQ are dependent upon the presence of thyroid hormones to promote MA. Consistent with this hypothesis, we found that ghr KO mice have a slight increase in hepatic MA. Similar to the Snell mice, ghr KO mice have similar decreases in circulating INS/IGF1 [Citation63], an increase in circulating ADIPOQ [Citation64], and a decrease in hepatic MTORC1 activity [Citation31]. However, unlike Snell mice, ghr KO mice have approximately normal circulating levels of thyroid hormones T3 and T4 (the published data are inconsistent, with one report showing a small decrease in thyroid hormones, and another showing a small increase) [Citation65,Citation66]. Future studies may further address the epistatic interactions between the thyroid hormone signaling axis and the GH/IGF1 signaling axis in controlling MA.
Our data show that mutations, which extend the healthy lifespan of mice by interfering with GH signals, upregulate hepatic CMA, and in this way, simulate one of the major consequences of food deprivation. CMA-sensitive proteins are thus likely to be altered in tissues of ghr KO and Snell mice, and indeed, there is a reduction, in multiple tissues, of CIP2A and MYC, both of high relevance to cell cycle regulation and neoplastic transformation. Our work provides the foundation for several new lines of experimentation that may well be productive, including studies of the cellular pathways that upregulate CMA in Snell and ghr KO mice, searches for drugs that might augment CMA in normal cells, and surveys to provide a more comprehensive understanding of proteomic changes attributable to CMA. Studies of mice in which GHR disruption is induced in young adults or middle-aged mice will clarify whether altered CMA in long-lived mice reflects an acute role for GH in controlling CMA, or instead, long-lasting effects of physiological changes induced by early-life deprivation of GH signaling.
Materials and methods
Animal husbandry
Snell dwarf mice were bred and maintained as described previously [Citation35]. ghr KO and Li-ghr KO were generated and maintained, as previously described [Citation48,Citation63,Citation67]. For all three of these three mouse stocks (Snell, ghr KO, Li-ghr KO), experiments were conducted in mice 5–6 months of age, using approximately equal numbers of male and female mice for all treatment groups. There are currently no studies reporting sex-effects on the regulation of CMA, and our own results found no significant effects of sex on any of the outcomes (apart from LAMPA glycosylation in Snell mice), and therefore data from males and females were pooled. Where sex effects on LAMP2A glycosylation were observed, side-by-side westerns from both sexes are shown. To control for effects of circadian rhythms on autophagic processes, mice were euthanized between 9 and 10 AM, approximately 3–4 h after the end of the dark period. For leupeptin-injection experiments, mice were injected at approximately 9 am, and euthanized 2 h later, at 11 AM.
All animal experiments were approved by the University of Michigan Institutional Animal Care and Use Committee. Mice were housed in Specific Pathogen Free facilities. Sentinel animals were checked quarterly for infection; all tests were negative. Mice were maintained with free access to water for all experiments. Mice were allowed free access to Laboratory Rodent Diet 5L0D (LabDiet, 0067138), unless otherwise specified. Upon dissection, mice were qualitatively assessed for the presence of food in the stomach, with no differences in eating noted between control and mutant mice. For fasting experiments, mice were deprived of food for 18 h before euthanasia.
For leupeptin injection experiments, 100 mg/kg (of mouse body weight) leupeptin (Sigma, 108,976) or sterile PBS (ThermoFisher, 20,012,027) vehicle control was administered by intraperitoneal injection 2 h before the animals were euthanized.
Preparation of lysosome-enriched fractions
Freshly dissected liver tissue was immediately washed in ice-cold PBS to remove blood, and tissue was gently dounce homogenized on ice in commercially available fractionation buffers (Thermo, 89,839). All subsequent steps were performed on ice or in centrifuges pre-chilled to 4ºC. Nuclei, extracellular matrix, and unbroken cells were removed by 10-min centrifugation at 500 x g. The post-nuclear sample was loaded onto a discontinuous 10%-30% OptiPrep (Sigma, D1556) density gradient in ultracentrifuge tubes (Beckman Coulter, 344,057) for a 55Ti-SW rotor (Beckman Coulter, 342,194). Samples were subjected to ultracentrifugation at 145,000 x g for 2 h in a Beckman Coulter L-70 ultracentrifuge. During ultracentrifugation, the sample resolved into visible bands on the density gradient. The highest (least dense) visible band was the most enriched with lysosomal markers and was used for all experiments. After the lysosome-containing band was removed from the density gradient, the sample was diluted in PBS to decrease the OptiPrep density, allowing the lysosomes to be pelleted, washed, and resuspended. Protein concentration was measured by BCA assay kit (ThermoFisher, 23,225), and all samples were adjusted to the same concentration.
For CMA substrate uptake assays, where keeping lysosome membranes intact during purification is essential to the assay, lysosomal membrane integrity was evaluated by hexosaminidase leakage. Briefly, when uptake assays were set-up, an additional sample of lysosomes was set aside in assay buffer and exposed to similar conditions as the lysosomes being assayed for substrate uptake. At the end of the assay, the lysosomes were pelleted, and the supernatant was carefully collected. The samples of whole lysosomes and supernatant (with the leaked enzymes) were subjected to a 4-nitrophenyl-N-acetyl-b-D-glucosaminide (Sigma, N9376) based hexosaminidase assay, as described by [Citation68]. Only preparations containing fewer than 10% broken lysosomes were used.
Western blotting and antibodies
Western blotting was performed by standard procedures, using BioRad electrophoresis chambers and transfer chambers. The following antibodies were used: ACTB (Cell Signaling Technologies; CST, 4967L), PPP2 subunit A (CST, 2039S; recognizes PPP2R1A and PPP2R1B), PPP2 subunit B (CST, 2290S; recognizes PPP2R2A, PPP2R2B, PPP2R2G, PPP2R2D), PPP2 subunit C (CST, 2259S; recognizes PPP2CA and PPP2CB), ENO1 (CST, 3810S), GAPDH (CST, 2118S), ACADL (AbCam, ab196655), MAP1LC3B (CST, 2775S), CTSD (AbCam, ab75852), LAMP1 (AbCam, ab24170), LAMP2A (AbCam, ab125068), CIP2A (Novus Biologicals, NB110-59722 & NB100-68264), MYC (AbCam, ab32072), GFAP (AbCam, ab7260), pS8 GFAP (ThermoFisher, PA5-12991), EEF1A (AbCam, ab37969), MAPT (CST, 46687S).
In vitro lysosomal substrate uptake assays
Isolated lysosomes were incubated in uptake assay buffer: 300 mM sucrose, 10 mM MOPS, pH 7.2, 10 mM ATP (Sigma, A26209), 10 mg/mL recombinant HSPA8 (AbCam, ab78431). Recombinant GAPDH (Sino Biological, 51,221-M07E), MAPT (Sino Biological, 10,058-H07E), and/or protease inhibitors (Sigma, 11,836,153,001) were added, as indicated.
qPCR and other reagents
For mRNA quantification, RNA was isolated from powdered tissue (flash frozen in liquid nitrogen upon dissection), using Qiagen RNeasy kits (Qiagen, 74,106), with QIAshredder (Qiagen, 79,654) tissue homogenizers. cDNA was synthesized using iScript cDNA synthesis reagents (BioRad, L010174A), according to the manufacturer’s instructions. qPCR was conducted in an Applied Biosystems Step One Plus Real-Time PCR System, using Fast SYBR Green Master Mix (Thermo, 4,385,612) as a detection reagent. The following primer sequences were used:
Gapdh (Forward-TGTCAAGCTCATTTCCTGGTAT, Reverse-GGGTCTGGGATGGAAATTGT), Cip2a (Forward-GATTTCCCTGCCTTCGTACTT, Reverse-CAGCCTGCAGTTTCTCTATGA), Myc (Forward-CGACTCTGAAGAAGAGCAAGAA, Reverse-GCTGGATAGTCCTTCCTTGTG).
For de-glycosylation experiments, protein extracts were incubated with PNGaseF (NEB: P0704S), with the supplied buffer, in accordance with the manufacturer’s instructions.
Cell culture
Primary mouse tail-tip fibroblasts were generated by standard methods from UM HET3 mice (UM HET3 were bred in-house and maintained as previously described [Citation69,Citation70]) and maintained in DMEM (Gibco, 11,965–092) with 10% FBS (Gibco, 16,140–071) in a hypoxic incubator (3% O2, 5% CO2) at 37ºC.
Statistical analysis
All statistical analyses and plotting were conducted in GraphPad Prism (version 8). The exact analyses used are indicated in the figure legends, with p-values derived from 2-way ANOVAs indicated directly in each figure.
Supplemental Material
Download Zip (7.7 MB)Acknowledgments
We thank Roxann Alonzo, Ilkim Erturk, Lori Roberts, Jacob Sheets, and Natalie Perry for mouse husbandry.
Disclosure statement
No potential conflict of interest was reported by the authors.
Supplementary material
Supplemental data for this article can be accessed here.
Additional information
Funding
Related Research Data
References
- Sinha RA, Singh BK, Yen PM. Reciprocal crosstalk between autophagic and endocrine signaling in metabolic homeostasis. Endocr Rev. 2017;38:69–102.
- Feng Y, He D, Yao Z, et al. The machinery of macroautophagy. Cell Res. 2013;24:24–41.
- Li -W-W, Li J, Bao J-K. Microautophagy: lesser-known self-eating. Cell Mol Life Sci. 2011;69:1125–1136.
- Sahu R, Kaushik S, Clement CC, et al. Microautophagy of cytosolic proteins by late endosomes. Dev Cell. 2011;20:131–139.
- Smith RE, Farquhar MG. Lysosome function in the regulation of the secretory process in cells of the anterior pituitary gland. J Cell Biol. 1966;31:319–347.
- Kaushik S, Bandyopadhyay U, Sridhar S, et al. Chaperone-mediated autophagy at a glance. J Cell Sci. 2011;124:495–499.
- Kaushik S, Cuervo AM. The coming of age of chaperone-mediated autophagy. Nat Rev Mol Cell Biol. 2018;19:365–381.
- Lescat L, Herpin A, Mourot B, et al. CMA restricted to mammals and birds: myth or reality? Autophagy. 2018;14:1267–1270.
- Cuervo AM, Bergamini E, Brunk UT, et al. Autophagy and aging: the importance of maintaining “Clean” cells. Autophagy. 2005;1:131–140.
- Pyo J-O, Yoo S-M, Ahn -H-H, et al. Overexpression of Atg5 in mice activates autophagy and extends lifespan. Nat Commun. 2013:4:1–9.
- Fernández ÁF, Sebti S, Wei Y, et al. Disruption of the beclin 1-BCL2 autophagy regulatory complex promotes longevity in mice. Nature. 2018;558:136–140.
- Simonsen A, Cumming RC, Brech A, et al. Promoting basal levels of autophagy in the nervous system enhances longevity and oxidant resistance in adult Drosophila. Autophagy. 2014;4:176–184.
- Chen S-F, Kang M-L, Chen Y-C, et al. Autophagy-related gene 7 is downstream of heat shock protein 27 in the regulation of eye morphology, polyglutamine toxicity, and lifespan in Drosophila. J Biomed Sci. 2012;19:1.
- Meléndez A, Talloczy Z, Seaman M, et al. Autophagy genes are essential for dauer development andlife-span extension in C. elegans. Science. 2003;301:1387–1391.
- Tóth ML, Sigmond T, Borsos É, et al. Longevity pathways converge on autophagy genes to regulate life span in Caenorhabditis elegans. Autophagy. 2014;4:330–338.
- Cuervo AM, Dice JF. Age-related decline in chaperone-mediated autophagy. J Biol Chem. 2000;275:31505–31513.
- Zhang C, Cuervo AM. Restoration of chaperone-mediated autophagy in aging liver improves cellular maintenance and hepatic function. Nat Med. 2008;14:959–965.
- Kiffin R, Kaushik S, Zeng M, et al. Altered dynamics of the lysosomal receptor for chaperone-mediated autophagy with age. J Cell Sci. 2007;120:782–791.
- Rodriguez-Navarro JA, Kaushik S, Koga H, et al. Inhibitory effect of dietary lipids on chaperone-mediated autophagy. PNAS. 2012;109:E705–14.
- Kaushik S, Massey AC, Cuervo AM. Lysosome membrane lipid microdomains: novel regulators of chaperone-mediated autophagy. Embo J. 2006;25:3921–3933.
- Xilouri M, Brekk OR, Polissidis A, et al. Impairment of chaperone-mediated autophagy induces dopaminergic neurodegeneration in rats. Autophagy. 2016;12:2230–2247.
- Xilouri M, Brekk OR, Landeck N, et al. Boosting chaperone-mediated autophagy in vivo mitigates α-synuclein-induced neurodegeneration. Brain. 2013;136:2130–2146.
- Massey AC, Kaushik S, Sovak G, et al. Consequences of the selective blockage of chaperone-mediated autophagy. PNAS. 2006;103:5805–5810.
- Gomes LR, Menck CFM, Cuervo AM. Chaperone-mediated autophagy prevents cellular transformation by regulating MYC proteasomal degradation. Autophagy. 2017;13:928–940.
- Junttila MR, Puustinen P, Niemelä M, et al. CIP2A inhibits PP2A in human malignancies. Cell. 2007;130:51–62.
- Westermarck J, Hahn WC. Multiple pathways regulated by the tumor suppressor PP2A in transformation. Trends Mol Med. 2008;14:152–160.
- Xilouri M, Stefanis L. Chaperone mediated autophagy in aging: starve to prosper. Ageing Res Rev. 2016;32:13–21.
- Cuervo AM, Knecht E, Terlecky SR, et al. Activation of a selective pathway of lysosomal proteolysis in rat liver by prolonged starvation. Am J Physiol. 1995;269:C1200–C1208.
- Arias E, Koga H, Diaz A, et al. Lysosomal mTORC2/PHLPP1/Akt regulate chaperone-mediated autophagy. Mol Cell. 2015;59:270–284.
- Bandyopadhyay U, Sridhar S, Kaushik S, et al. Identification of regulators of chaperone-mediated autophagy. Mol Cell. 2010;39:535–547.
- Dominick G, Berryman DE, List EO, et al. Regulation of mTOR activity in Snell dwarf and GH receptor gene-disrupted mice. Endocrinology. 2015;156:565–575.
- Dominick G, Bowman J, Li X, et al. mTOR regulates the expression of DNA damage response enzymes in long-lived Snell dwarf, GHRKO, and PAPPA-KO mice. Aging Cell. 2016;16:1–9.
- Paquette M, El-Houjeiri L, Pause A. mTOR pathways in cancer and autophagy. Cancers (Basel). 2018;10:1–15.
- Coschigano KT, Holland AN, Riders ME, et al. Deletion, but not antagonism, of the mouse growth hormone receptor results in severely decreased body weights, insulin, and insulin-like growth factor I levels and increased life span. Endocrinology. 2003;144:3799–3810.
- Flurkey K, Papaconstantinou J, Miller RA, et al. Lifespan extension and delayed immune and collagen aging in mutant mice with defects in growth hormone production. Proc Natl Acad Sci USA. 2001;98:6736–6741.
- Anisimov VN, Bartke A. The key role of growth hormone-insulin-IGF-1 signaling in aging and cancer. Crit Rev Oncol Hematol. 2013;87:201–223.
- Murakami S, Salmon A, Miller RA. Multiplex stress resistance in cells from long-lived dwarf mice. Faseb J. 2003;17:1565–1566.
- Wang M, Miller RA. Fibroblasts from long lived mutant mice exhibit increased autophagy and lower TOR activity after nutrient deprivation or oxidative stress. Aging Cell. 2012;11:668–674.
- Schneider JL, Suh Y, Cuervo AM. Deficient Chaperone-mediated autophagy in liver leads to metabolic dysregulation. Cell Metab. 2014;20:417–432.
- Cuervo AM, Terlecky SR, Dice JF, et al. Selective binding and uptake of ribonuclease A and glyceraldehyde-3-phosphate dehydrogenase by isolated rat liver lysosomes. J Biol. 1994;269:26374–26380.
- Dice JF. Peptide sequences that target cytosolic proteins for lysosomal proteolysis. Trends Biochem Sci. 1990;15:305–309.
- Chiang H-L, Terlecky T, Plant CP, et al. A role for a 70-kilodalton heat shock protein in lysosomal degradation of intracellular proteins. Science. 1989;246:382–385.
- Agarraberes FA, Dice JF. A molecular chaperone complex at the lysosomal membrane is required for protein translocation. J Cell Sci. 2001;114:2491–2499.
- Cuervo AM, Dice JF, Knecht E. A population of rat liver lysosomes responsible for the selective uptake and degradation of cytosolic proteins. J Biol Chem. 1997;272:5606–5615.
- Aniento F, Roche E, Cuervo AM, et al. Uptake and degradation of glyceraldehyde-3-phosphate dehydrogenase by rat liver lysosomes. J Biol Chem. 1993;268:10463–10470.
- Lin S-C, Sen L, Drolet DW, et al. Pituitary ontogeny of the Snell dwarf mouse reveals Pit-1-independent and Pit-1-dependent origins of the thyrotrope. Development. 1994;120:515–522.
- Bartke A, Westbrook R. Metabolic characteristics of long-lived mice. Front Genet. 2012;3:288.
- List EO, Berryman DE, Funk K, et al. Liver-specific GH receptor gene-disrupted (LiGHRKO) mice have decreased endocrine IGF-I, increased local IGF-I, and altered body size, body composition, and adipokine profiles. Endocrinology. 2014;155:1793–1805.
- Cuervo AM, Dice JF. Regulation of lamp2a levels in the lysosomal membrane. Traffic. 2000;1:570–583.
- Kundra R, Kornfeld S. Asparagine-linked oligosaccharides protect lamp-1 and lamp-2 from intracellular proteolysis*. J Biol Chem. 1999;274:31039–31046.
- Újvári A, Aron R, Eisenhaure T, et al. Translation rate of human tyrosinase determines its N-linked glycosylation level. J Biol Chem. 2001;276:5924–5931.
- Drake JC, Bruns DR, Peelor FF III, et al. Long-lived Snell dwarf mice display increased proteostatic mechanisms that are not dependent on decreased mTORC1 activity. Aging Cell. 2015;14:474–482.
- Bandyopadhyay U, Kaushik S, Varticovski L, et al. The chaperone-mediated autophagy receptor organizes in dynamic protein complexes at the lysosomal membrane. Mol Cell. 2008;28:5747–5763.
- Haspel J, Shaik RS, Ifedigbo E, et al. Characterization of macroautophagic flux in vivo using a leupeptin-based assay. Autophagy. 2014;7:629–642.
- Kaushik S, Cuervo AM. AMPK-dependent phosphorylation of lipid droplet protein PLIN2 triggers its degradation by CMA. Autophagy. 2016;12:432–438.
- Come C, Laine A, Chanrion M, et al. CIP2A is associated with human breast cancer aggressivity. Clin Cancer Res. 2009;15:5092–5100.
- Young JA, List EO, Kopchick JJ. Deconstructing the Growth Hormone Receptor(GHR): physical and metabolic phenotypes of tissue-specific GHR gene-disrupted mice. Prog Mol Biol Transl Sci. 2016;138:27–39.
- Hofmann JW, Zhao X, De Cecco M, et al. Reduced expression of MYC increases longevity and enhances healthspan. Cell. 2015;160:477–488.
- Troncoso R, Vicencio JM, Parra V, et al. Energy-preserving effects of IGF-1 antagonize starvation-induced cardiac autophagy. Cardiovasc Res. 2011;93:320–329.
- Brooks NL, Trent CM, Raetzsch CF, et al. Low utilization of circulating glucose after food withdrawal in Snell dwarf mice. J Biol Chem. 2007;282:35069–35077.
- Liu Y, Palanivel R, Rai E, et al. Adiponectin stimulates autophagy and reduces oxidative stress to enhance insulin sensitivity during high-fat diet feeding in mice. Diabetes. 2014;64:36–48.
- Sinha RA, You S-H, Zhou J, et al. Thyroid hormone stimulates hepatic lipid catabolism via activation of autophagy. J Clin Investig. 2012;122:2428–2438.
- Coschigano KT, Clemmons D, Bellush LL, et al. Assessment of growth parameters and life span of GHR/BP gene-disrupted mice*. Endocrinology. 2000;141:2608–2613.
- Al-Regaiey KA, Masternak MM, Bonkowski M, et al. Long-lived growth hormone receptor knockout mice: interaction of reduced insulin-like growth factor I/insulin signaling and caloric restriction. Endocrinology. 2005;146:851–860.
- Hauck SJ, Hunter WS, Danilovich N, et al. Reduced levels of thyroid hormones, insulin, and glucose, and lower body core temperature in the growth hormone receptor/binding protein knockout mouse. Exp Biol Med. 2001;226:552–558.
- Westbrook R, Bonkowski MS, Strader AD, et al. Alterations in oxygen consumption, respiratory quotient, and heat production in long-lived GHRKO and ames dwarf mice, and short-lived bGH transgenic mice. J Gerontol A. 2009;64A:443–451.
- Zhou Y, Xu BC, Maheshwari HG, et al. A mammalian model for Laron syndrome produced by targeted disruption of the mouse growth hormone receptor. PNAS. 1997;94:13215–13220.
- Wendeler M, Sandhoff K. Hexosaminidase assays. Glycoconj J. 2008;26:945–952.
- Miller RA, Harrison DE, Astle CM, et al. An aging interventions testing program: study design and interim report. Aging Cell. 2007;6:565–575.
- Miller RA, Burke D, Nadon NL. Announcement: four-way cross mouse stocks: a new, genetically heterogeneous resource for aging research. J Gerontol. 1999;54A:B358–B360.