
ABSTRACT
In an ex vivo rat glaucoma model using dissected retinas, the neurosteroid allopregnanolone (AlloP) protects retinal ganglion cells (RGCs) via GABR/GABAA receptors. To determine the involvement of macroautophagy/autophagy in neuroprotection by AlloP, we examined the effects of autophagy activators, rapamycin and torin 2, and autophagy inhibitors, bafilomycin A1 and SAR405, on retinal retinal morphology and expression of MAP1 LC3B/LC3B (microtubule-associated protein 1 light chain 3 beta) and SQSTM1 (sequestosome 1). Administration of rapamycin or torin 2 exerted partial histological neuroprotection, while combined administration of AlloP with bafilomycin A1 or SAR405 induced severe degeneration in a hyperbaric condition. Electron microscopic analyses showed that the addition of AlloP significantly increased autophagosomes and degenerative autophagic vacuoles in the retinal nerve fiber layer. Immunoblotting showed that the addition of AlloP or autophagic activators increased the lipidated form of LC3B (LC3B-II) and suppressed SQSTM1. Moreover, bafilomycin A1 increased LC3B-II and SQSTM1 protein levels in the presence of AlloP without changes in corresponding mRNAs compared to AlloP-treated retinas in a hyperbaric condition. These data indicate that AlloP likely induces a protective form of autophagy in this model. In an in vivo rat model of glaucoma, we also observed neuroprotective effects of AlloP. Injection of polystyrene microbeads into the anterior chamber increased intraocular pressure about 3-fold and induced RGC apoptosis. A single intravitreal injection of AlloP or autophagy activators prevented apoptosis and protected RGCs with autophagy activation. We conclude that AlloP may serve as a potential therapeutic agent for the treatment of glaucoma via diverse mechanisms.
Abbreviations: 2HBCD: 2-Hydroxypropyl)-β-cyclodextrin; 3-MA: 3-methyladenine; AlloP: allopregnanolone; AP: autophagosome; AVd: degradative autophagic vacuoles; GCL: ganglion cell layer; INL: inner nuclear layer; IOP: intraocular pressure; IPL: inner plexiform layer; LC3B-I: cytosolic form of LC3B; LCB-II: lipidated form of LC3B; MAP1LC3B/LC3B: microtubule-associated protein 1 light chain 3 beta; mPTP: mitochondrial permeability transition pore; NDS: neuronal damage score; NFL: nerve fiber layer; OH: ocular hypertension; ON: optic nerve; ONL: outer nuclear layer; OPL: outer plexiform layer; p-STR: scotopic threshold response; RGC: retinal ganglion cells; RT-PCR: real-time reverse transcription polymerase chain reaction; SQSTM1: sequestosome 1; TUNEL: TdT-mediated dUTP Nick End Labeling
Introduction
Glaucoma is a leading cause of irreversible blindness [Citation1] and involves selective damage to retinal ganglion cells (RGCs) [Citation2]. Increased intraocular pressure (IOP) is a major risk factor for glaucoma [Citation3]. However, the pathogenesis underlying RGC damage by IOP remains unclear.
Autophagy is an intracellular degradation system induced by cellular stress to digest cytoplasmic constituents or organelles to maintain nutrient and energy homeostasis [Citation4]. Autophagy begins with an expanding double-membrane structure called a phagophore in the cytoplasm [Citation5]. The phagophore sequesters cytosolic materials and organelles to form a double-membrane vesicle called an autophagosome (AP) [Citation6]. APs fuse with lysosomes to degrade their contents, thus becoming degenerative autophagic vacuoles (AVd) [Citation6–8] (Fig. S1). Autophagy also maintains intracellular homeostasis by eliminating damaged organelles and misfolded proteins and plays an important role in neurodegenerative diseases, including glaucoma [Citation9–14].
Neurosteroids are endogenous modulators generated in the nervous system in response to cellular stress and are potent modulators of neurotransmitter systems [Citation15]. Among them, allopregnanolone (AlloP) is a strong enhancer of GABRs/GABAA receptors. Using an ex vivo glaucoma model with isolated rat retinas, we previously reported that AlloP attenuated pressure-induced retinal injury [Citation16–18]. Because a specific GABR antagonist inhibits neuroprotective effects of AlloP, GABAergic signaling likely mediates the neuroprotection by AlloP. However, neuroprotection by AlloP may not exclusively involve GABRs. AlloP was found to activate autophagy in a mouse model of Niemann-Pick Type C disease [Citation19] and primary astrocyte cultures [Citation20], suggesting that upregulation of autophagic flux may contribute to endogenous neuroprotective mechanisms [Citation21].
In the present study, we used a rat ex vivo ocular hypertension (OH) model with a closed chamber incubation system (Fig. S2) and an in vivo OH model following injection of polystyrene microbeads into the anterior chamber to examine neuroprotective effects of AlloP, focusing on the role of autophagy.
Results
Neuroprotective effects of AlloP in an ex vivo glaucoma model
Consistent with our previous reports [Citation17,Citation18], retinas incubated at 10 mm Hg () exhibited normal appearance but those at 75 mm Hg showed axonal swelling in the nerve fiber layer (NFL) (); 1 µM AlloP attenuated this damage (). To confirm that the neuroprotective effects of AlloP involve GABRs, we administered 1 μM picrotoxin, a GABR antagonist. As previously observed [Citation17], picrotoxin overcame the neuroprotective effect of AlloP under hyperbaric conditions ().
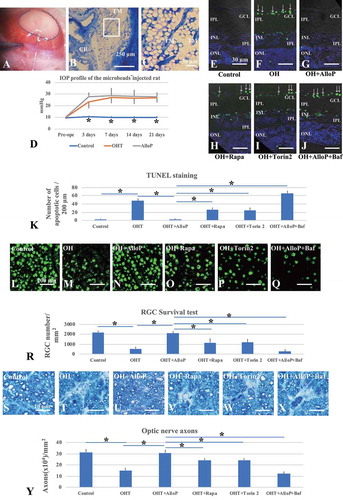
Figure 1. The effects of autophagy activators and autophagy inhibitors on retinal morphology in ex vivo glaucoma models. (A-H) Light micrographs of pressure-loaded retinas. (A) 10 mm Hg. (B) 75 mm Hg. Arrowheads, axonal swelling. (C) AlloP at 75 mm Hg. (D) Co-administration of AlloP and picrotoxin at 75 mm Hg. (E and F) Rapamycin (E) or torin 2 (F) at 75 mm Hg. (G and H) Administration of bafilomycin A1 (G) or SAR405 (H) induced severe degeneration in retinas incubated with AlloP at 75 mm Hg. Arrows, RGC degeneration. Scale bars: 20 μm. (I-P) RGC survival and neuroprotection in pressure-loaded whole mounted retinas. (I) 10 mm Hg. (J) 75 mm Hg. (K) AlloP at 75 mm Hg. (L) Combination of AlloP and picrotoxin at 75 mm Hg. (M) Rapamycin at 75 mm Hg. (N) torin 2 at 75 mm Hg. (O) Combination of AlloP and bafilomycin A1 at 75 mm Hg. (P) Combination of AlloP and SAR405 at 75 mm Hg. Scale bars: 200 μm (Q) The number of RBFOX3-positive cells in whole-mount retinas (n = 5 per experiment, Tukey *p < 0.05). (R-Y) TUNEL staining. (R) 10 mm Hg. (S) 75 mm Hg. Arrows indicate TUNEL-positive cells in the GCL. (T) AlloP significantly decreased the number of TUNEL-positive cells at 75 mm Hg. (U) Combination of AlloP and picrotoxin at 75 mm Hg. (V) Rapamycin at 75 mm Hg. (W) torin 2 at 75 mm Hg. (X) Combination of AlloP and bafilomycin A1 at 75 mm Hg. (Y) Combination of AlloP and SAR405 at 75 mm Hg. Scale bars: 30 μm. (Z) The number of TUNEL-positive RGCs per 200 μm of retina section (n = 5 per experiment, Tukey *p < 0.05)
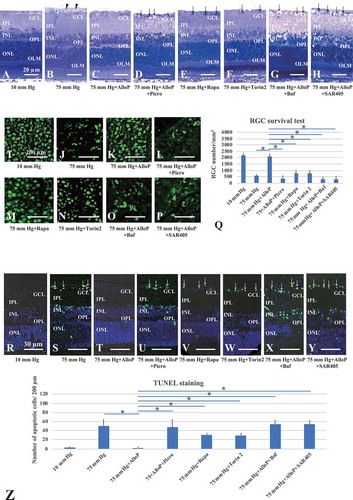
Next, we examined the involvement of autophagy in neuroprotection of pressure-induced retinal injury using autophagy activators (rapamycin, torin 2) and autophagy inhibitors (bafilomycin A1, SAR405). Administration of 100 nM rapamycin () or 1 μM torin 2 (), inhibitors of the MTOR (mechanistic target of rapamycin kinase), also inhibited axonal swelling, although we still observed RGC damage at 75 mm Hg. These findings indicate that AlloP is a more effective neuroprotectant against pressure-induced injuries than rapamycin or torin 2. Administration of 500 nM bafilomycin A1 () or 1 μM SAR405 (), inhibitors of autophagy flux, induced severe degeneration in retinas incubated with 1 μM AlloP at 75 mm Hg. A quantitative assessment of structural changes induced by pressure elevation and administration of AlloP, picrotoxin, rapamycin, torin 2, bafilomycin, or SAR405 is summarized in (also see Source data of ).
Table 1. Effects of AlloP on the NFLT, NDS, and density of damaged cells in the GCL
AlloP preserves neuronal nuclear antigen under high pressure
In whole-mounted retinas, we visualized RGC damage induced by pressure elevation as a reduction in cells positive for RBFOX3/NeuN (RNA binding protein, fox-1 homolog [C. elegans] 3). illustrates examples of confocal images of RBFOX3-labeled RGCs that we obtained from a control eye incubated at 10 mm Hg. Pressure elevation (75 mm Hg) reduced the number of cells positive for RBFOX3 (). The confocal images in illustrates the neuroprotective effects of AlloP (1 μM) on RGC survival in hyperbaric conditions. Administration of picrotoxin () dampened neuroprotective effects of AlloP.
Autophagy activators, rapamycin () or torin 2 (), partially protected RGC at 75 mm Hg. A combination of bafilomycin A1 () or SAR405 () with AlloP significantly decreased in the number of RBFOX3-labeled RGCs. The graph in shows the number of RBFOX3-positive RGCs in the retina in each condition.
AlloP prevents pressure-induced apoptosis
At 10 mm Hg, we observed a few TUNEL-positive cells in retinas (). Exposure to elevated pressure (75 mm Hg) induced apoptosis that was apparent in the ganglion cell layer (GCL), inner nuclear layer (INL), and the outer nuclear layer (ONL) (). AlloP remarkably reduced the number of TUNEL-positive cells (), as previously reported [Citation18]. Co-administration of AlloP and picrotoxin increased the number of apoptotic cells (). Autophagy activator, rapamycin () or torin 2 (), moderately decreased apoptotic cells in the GCL at 75 mm Hg. A combination of autophagy inhibitor, bafilomycin A1 () or SAR405 (), with AlloP resulted in an increased number of apoptotic cells. The graph in shows the number of TUNEL-positive cells in the retina in each condition.
Autophagy markers and effects of AlloP on autophagy flow
Because it has been reported that AlloP activates autophagy in primary astrocyte cultures [Citation20], we examined if AlloP activates autophagy in the isolated retina. LC3B is a core contributor to autophagy (Fig. S1), playing a crucial role in the elongation of phagophore membranes and serving as a marker of autophagy.
To investigate the role of AlloP in autophagy flow, we performed western blot analysis of MAP1LC3B/LC3B (microtubule-associated protein 1 light chain 3 beta). LC3B antibodies displayed double bands, the cytosolic form of LC3B (LC3B-I) and lipidated form of LC3B (LC3B-II) at approximately 14–16 kDa (). Quantitative western blot analysis demonstrated that administration of AlloP slightly reduced LC3B-I expression at 75 mm Hg (), but significantly increased LC3B-II in the hyperbaric condition compared to drug-free pressure elevation ().
Figure 2. Western blot and real-time RT-PCR analysis of LC3B and SQSTM1 in ex vivo retinas. (A and B) Western blot analyses of LC3B (A) and SQSTM1 (B) in ex vivo retinas. (Ai) Representative western blot analyses of LC3B. AlloP was administrated at 75 mm Hg. (Aii and Aiii) Quantitative western blot analysis of LC3B-I (Aii) and LC3B-II expression (Aiii) (n = 4 per experiment, Tukey *p < 0.05). (Bi) Representative western blot analyses of SQSTM1. (Bii) Quantitative western blot analysis of SQSTM1 expression (n = 4 per experiment, Tukey *p < 0.05). SQSTM1 expression significantly increased at 75 mm Hg compared with the control pressure (10 mm Hg). Administration of AlloP significantly decreased SQSTM1 expression at 75 mm Hg compared with the hyperbaric condition. (Ci) Representative western blot analyses of LC3B. (Cii and Ciii) Quantitative western blot analysis of LC3B-I (Cii) and LC3B-II expression (Ciii) (n = 4 per experiment, Tukey *p < 0.05). Treatment with rapamycin or torin 2 significantly increased in the expression of LC3B-I and LC3B-II at 75 mm Hg compared with AlloP (75 mm Hg). Co-administration of AlloP with bafilomycin A1 induced an increase in LC3B-II expression compared with AlloP administration at 75 mm Hg. Co-administration of AlloP with SAR405 induced a significant decrease in LC3B expression compared with AlloP administration at 75 mm Hg. (Di) Representative western blot analyses of SQSTM1. (Dii) Quantitative western blot analysis of SQSTM1 expression (n = 4 per experiment, Tukey *p < 0.05). Treatment with Rapamycin or torin 2 induced significant decreases in SQSTM1 expression compared with AlloP at 75 mm Hg. At 75 mm Hg, co-administration of AlloP with bafilomycin A1 or AlloP with SAR405 induced a remarkable increase in SQSTM1 expression. (E) Real-time RT-PCR analysis of Lc3b (Ei) and Sqstm1 mRNA (Eii) (n = 10 per experiment, Tukey *p < 0.05). (Ei) Lc3b mRNA expression significantly increased in a retina treated with AlloP at 75 mm Hg compared with a retina incubated without AlloP treatment at 75 mm Hg. Co-administration of AlloP with bafilomycin A1 induced no remarkable difference in Lc3b mRNA expression compared with AlloP administration at 75 mm Hg. (Eii) Administration of AlloP or co-administration of AlloP with bafilomycin A1 induced no remarkable difference in Sqstm1 mRNA expression at 75 mm Hg compared with a retina incubated without AlloP treatment at 75 mm Hg
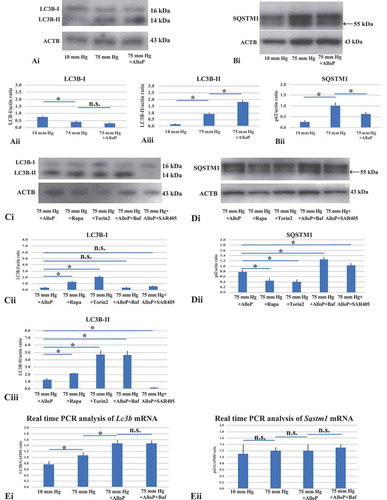
Because AlloP increased LC3B-II, we examined another autophagy marker to assess changes in autophagic flow. SQSTM1 (sequestosome 1) is a protein that is incorporated into completed APs and accumulates when autophagy is impaired [Citation22,Citation23]. SQSTM1 antibodies displayed double bands at approximately 57 kDa and 55 kDa (). We determined that the lower band (55 kDa) is specific for SQSTM1 protein (Fig. S3). In the hyperbaric condition, western blot analysis demonstrated that AlloP decreased expression of SQSTM1 compared to retinas incubated at 75 mm Hg ( and ).
Next, we determined whether the autophagy activators (rapamycin, torin 2) altered the protein levels of autophagic markers. Rapamycin and torin 2 induced an increase in LC3B-II levels (-) (also see Fig. S4 concerning LC3B-II:LC3B-I ratio) and a decrease in SQSTM1 levels ( and ) at 75 mm Hg compared to retinas incubated with AlloP at 75 mm Hg.
The increase of LC3B-II could result from either the induction of autophagy or the inhibition of late stages of autophagic flux. To further show the effect of AlloP on autophagic flux, we treated pressure-loaded retinas with bafilomycin A1 (a vacuolar-type H+-translocating ATPase [V-ATPase] inhibitor) in the presence of AlloP, and examined effects on LC3B and SQSTM1. Bafilomycin A1 significantly increased LC3B-II and SQSTM1 levels in the presence of AlloP at 75 mm Hg compared to retinas treated with AlloP alone.
SAR405 (a low-molecular-mass kinase inhibitor of PIK3 C3/VPS34), which inhibits downstream and upstream steps of autophagy [Citation24], significantly reduced LC3B-II levels (Ci-Ciii) but increased SQSTM1 levels ( and ) in the presence of AlloP compared to retinas treated with AlloP alone (also see Fig. S5 concerning 3-methyladenine, 3-MA).
To obtain an accurate interpretation of protein levels, we also examined mRNA expression of Lc3b and Sqstm1 in the ex vivo glaucoma model by quantitative real-time RT-PCR analysis (Ei and ). These results demonstrated a significant increase in Lc3b mRNA in retinas incubated at 75 mm Hg compared to 10 mm Hg (). Furthermore, AlloP significantly increased in Lc3b mRNA at 75 mm Hg compared to retinas incubated without AlloP at 75 mm Hg. However, we did not detect remarkable changes in Lc3b mRNA in retinas incubated with AlloP plus bafilomycin A1 compared to retinas incubated with AlloP alone at 75 mm Hg.
Concerning the expression of Sqstm1 mRNA (), we did not detect significant changes in retinas incubated at 75 mm Hg compared to 10 mm Hg. Furthermore, we did not detect remarkable changes in retinas incubated with AlloP or AlloP plus bafilomycin A1 compared to retinas incubated without AlloP at 75 mm Hg.
To extend the results of western blotting, we also performed immunofluorescence staining with the anti-LC3B antibody. Although there was no remarkable immunofluorescence in the retina at normobaric pressure (), LC3B-positive reactions were observed mostly in the swollen axons in the NFL at 75 mm Hg (). Administration of AlloP increased fluorescent reactions in the GCL, INL, outer plexiform layer (OPL), and outer limiting membrane (OLM) at 75 mm Hg (). Retinas treated with AlloP and bafilomycin A1 induced a significant increase in immunofluorescence (). Fluorescence reactions are summarized in .
Figure 3. Immunohistochemical analyses of LC3B and SQSTM1 in ex vivo retinas. (A–D) Merge of differential interference contrast images and fluorescence images using DAPI and an antibody against LC3B. Panels A–D are at the same magnification. Scale bars, 30 μm. (A) Immunostaining was not detected in a retina incubated at 10 mm Hg. (B) Strong immunofluorescence was observed in the axonal swelling at 75 mm Hg (arrowheads). (C) At 75 mm Hg in the presence of AlloP, the retina showed prominent fluorescence against LC3B. Open arrows indicate strong reaction in the NFL. Weak fluorescence was present in the INL, OPL, and OLM. (D) Co-administration of AlloP and bafilomycin A1 enhanced positive immunofluorescence in the NFL, GCL, and IPL. Open arrows indicate the NFL. (E) Summary of immunostaining studies shows fluorescence intensity by anti-LC3B antibody (n = 5 per experiment, *p < 0.05). (F–I) Merge of differential interference contrast images and fluorescence images using DAPI and an antibody against SQSTM1. Panels F–I are at the same magnification. Scale bars, 30 μm. Open arrows and arrows indicate the NFL and cells in the GCL, respectively. (F) Only weak immunostaining was detected in the NFL at 10 mm Hg. (G) Positive immunofluorescence was observed in the NFL, GCL, and IPL at 75 mmHg. (H) At 75 mm Hg, the administration of AlloP reduced fluorescence in a retina. (I) Co-administration of AlloP and bafilomycin A1 enhanced positive immunofluorescence in the NFL, GCL, IPL, and INL. (J) Summary of immunostaining studies shows fluorescence intensity by anti- SQSTM1 antibody (n = 5 per experiment, *p < 0.05)
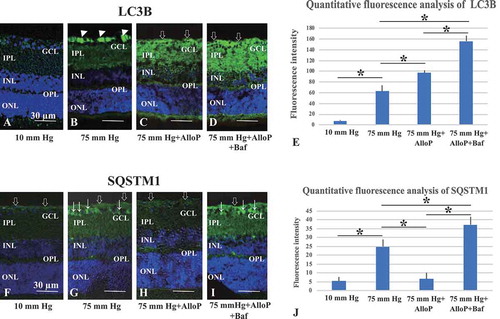
Consistent with changes in western blotting, SQSTM1-positive immunofluorescence was not prominent in the retina at 10 mm Hg (), but became prominent in the NFL and GCL at 75 mm Hg (). Although AlloP significantly reduced fluorescent reactions in the GCL and the inner plexiform layer (IPL) at 75 mm Hg (), co-administration of AlloP with bafilomycin A1 increased immunofluorescence in the NFL, GCL and IPL (). Fluorescence reactions are summarized in .
Autophagy vacuoles induced by high pressure and effects of AlloP
Electron microscopy revealed that retinas incubated at 10 mm Hg remained intact (), while we observed substantial swelling of axons after exposure to high pressure (75 mm Hg; ). AlloP () protected RGC axons from high pressure. We then examined retinas for the presence of APs and AVds. These structures are present even at control pressure (10 mm Hg; -). Elevated pressure significantly increased numbers of APs, AVds and other autophagy components in the NFL (-). The number of APs and AVds was significantly increased by AlloP administration compared to the retina incubated at 75 mm Hg without AlloP ( and ).
Figure 4. Electron micrographic analyses of ex vivo retinas. (A) 10 mm Hg. Mu, Müller cell. (B) 75 mm Hg. Arrowheads; swollen axons. Mu, Müller glia. (C) AlloP at 75 mm Hg. Mu, Müller glia. NFL; Nerve fiber layer. (D-F) AVds (double arrows in D, E) and AP (single arrow, F) in the NFL at 10 mm Hg. (G-I) AVds (double arrows in G, H) and phagophore (arrowheads in I) in the NFL at 75 mm Hg. (J and K) AP (single arrow) and AVds (double arrows) in the retina incubated with 1 μM AlloP. (L) The number of AP per 25 μm2 of retina (n = 30 per experiment, Tukey *p < 0.05). (M) The number of AVd per 25 μm2 of retina (n = 30 per experiment, Tukey *p < 0.05)
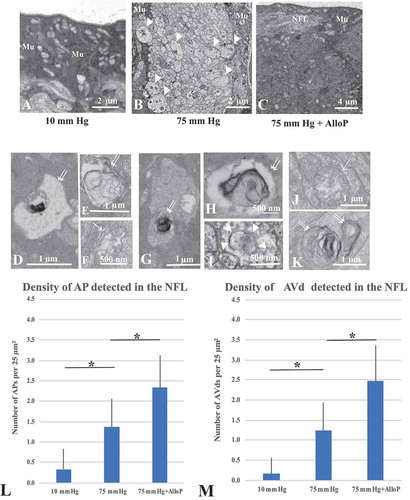
A quantitative assessment of APs and AVds induced by pressure elevation and administration of AlloP is summarized in and , respectively.
Rat in vivo OH model induced by intracameral injection of microbeads
To determine whether results from the ex vivo studies translate to an in vivo glaucoma model, we examined the effects of AlloP and other agents in a model using the intracameral injection of microbeads. For induction of OH in vivo, sterile 6-μm polystyrene microbeads were injected into the anterior chamber of the right eye of each animal using a single-step, sclero-corneal tunnel approach with a 35-G nanoneedle (). At 3 weeks after intracameral bead injection, the beads localized in the iridocorneal angle ( and ). One week after microbead injection, we randomly divided animals into 2 groups (non-treated OH and AlloP injection). We administered AlloP as a one-time intravitreal injection. Non-treated OH animals received sterile vehicle intravitreally. As a further control, the vehicle was intravitreally injected one week after intracameral administration of 10 μl of PBS. Three weeks after bead injections, IOP was 26.7 ± 3.7 mm Hg in non-treated OH eyes compared to 9.9 ± 0.9 mm Hg in control eyes. At each measurement time point (days 3, 7, 14, and 21), IOP in the two bead-injected groups (non-treated OH and AlloP injection) became significantly higher compared to control eyes (p < 0.05, Tukey’s multiple comparison test) (). AlloP did not alter IOP at any measurement point.
Figure 5. The effects of autophagy activators and autophagy inhibitors on retinal morphology in an in vivo glaucoma model. (A) Injection of microbeads with a 35 G-gauge nanoneedle (surrounded with a broken line) into the anterior chamber. (B and C) Light micrographs of the iridocorneal angle (B). TM, trabecular meshwork. CB, ciliary body. (C) Enlargement of the rectangular area in Figure 5B. (D) IOP profiles. (E-J) TUNEL staining. Arrows indicate TUNEL-positive cells in the GCL. (E) Control eye. (F) Non-treated OH eye. (G-I) Administration of AlloP (G), rapamycin (H), or torin 2 (I) in OH eyes. (J) Co-administration of AlloP with bafilomycin A1 in OH eyes. Scale bars, 30 μm. (K) The number of TUNEL-positive RGCs per 200 μm of retinal sections (n = 5 per experiment, Tukey *p < 0.05). (L-Q) Confocal images of RBFOX3-labeled RGCs. (L) Control eye. (M) Microbead-injected OH eye without AlloP administration. (N-P) Administration of AlloP (N), rapamycin (O), or torin 2 (P) in OH eyes. (Q) Co-administration of AlloP with bafilomycin A1 in OH eyes. Scale bars, 200 μm. (R) The number of RBFOX3-positive cells in the whole mount retina under each condition (n = 5 per experiment, Tukey *p < 0.05). (S-X) Light micrographs of the optic nerve axons three weeks after microbead injection. (S) Control eye. (T) Microbead-injected eyes with OH. (U-W) Administration of AlloP (U), rapamycin (V), or torin 2 (W) in OH eyes. (X) Co-administration of AlloP with bafilomycin A1 in OH eyes. Scale bars, 10 μm. (Y) Axonal number in whole mount retinas under each condition (n = 5 per experiment, Tukey *p < 0.05)
Pressure-induced apoptosis and neuroprotection with AlloP in vivo
Three weeks after intracameral administration of PBS, we observed a few TUNEL-positive cells in the INL and ONL in control eyes (). In contrast, TUNEL-positive cells markedly increased in the GCL, INL, and ONL in non-treated OH eyes (). The number of TUNEL-positive cells reduced to control levels when AlloP was administered intravitreally in the OH eyes (). Although intraperitoneal injection of rapamycin () or torin 2 () partially protected retinal neurons, some TUNEL-positive cells remained in the GCL and INL in non-treated OH eyes. Intraperitoneal injection of bafilomycin significantly increased TUNEL-positive cells in the retina of AlloP-treated OH eyes (). The graph in shows the number of apoptotic cells in the retina in each condition.
RGC survival by AlloP during IOP elevation in vivo
Compared with control eyes (), glaucomatous damage was visible as reduced numbers of cells that were positive for RBFOX3 in whole mounted retinas three weeks after microbead injection in non-treated OH eyes (). Administration of AlloP () prevented the loss of RBFOX3-positive RGCs in OH eyes. Intraperitoneal injection of rapamycin () or torin 2 () partially protected RGC in non-treated OH eyes. Compared to AlloP-treated OH eyes, intraperitoneal injection of bafilomycin A1 significantly decreased in the number of RBFOX3-labeled RGCs in the retina of AlloP-treated OH eyes (). RGC density at each pressure is summarized in .
Compared with control eyes (), the axonal loss was detected 3 weeks after microbead injection in non-treated OH eyes in sections of optic nerves stained with 2% toluidine blue (). However, the administration of AlloP () induced significant protective effects in OH eyes. Intraperitoneal injection of rapamycin () or torin 2 () partially protected axons in non-treated OH eyes. Compared to AlloP-treated OH eyes, intraperitoneal injection of bafilomycin A1 significantly decreased the number of axons in the retina of AlloP-treated OH eyes (). The density of axons in each experiment is summarized in .
Autophagy markers after IOP elevation and effects of neurosteroids in vivo
Quantitative western blot analysis demonstrated that an LC3B-I expression was slightly reduced in OH eyes and AlloP-treated OH eyes compared with control eyes three weeks after microbead injection ( and ). By contrast, the level of LC3B-II significantly increased in OH eyes compared to control eyes (). In addition, AlloP significantly increased the level of LC3B-II in OH eyes compared to non-treated OH eyes 3 weeks after microbead injection (). Western blotting also demonstrated that SQSTM1 was significantly increased in eyes with OH compared with control eyes 3 weeks after microbead injection ( and ). Administration of AlloP significantly depressed the level of SQSTM1 in OH eyes compared to non-treated OH eyes without neurosteroid administration ( and ).
Figure 6. Western blot and real-time RT-PCR analysis of LC3B and SQSTM1 with in vivo retinas. (A and B) Western blot analyses of LC3B (A) and SQSTM1 (B) with in vivo retinas. (Ai) Representative western blot analyses of LC3B. (Aii and Aiii) Quantitative western blot analysis of LC3B-I (Aii) and LC3B-II expression (Aiii) (n = 4 per experiment, Tukey *p < 0.05). (Bi) Representative western blot analyses of SQSTM1. (Bii) Quantitative western blot analysis of SQSTM1 expression (n = 4 per experiment, Tukey *p < 0.05). (Ci) Representative western blot analyses of LC3B. (Cii and Ciii) Quantitative western blot analysis of LC3B-I (Cii) and LC3B-II expression (Ciii) (n = 4 per experiment, Tukey *p < 0.05). Treatment with rapamycin or torin 2 significantly increased in the expression of LC3B-II in OH eyes compared with AlloP-treated OH eyes. Co-administration of AlloP with bafilomycin A1 induced a remarkable increase in LC3B-II expression compared with AlloP administration in OH eyes. (Di) Representative western blot analyses of SQSTM1. (Dii) Quantitative western blot analysis of SQSTM1 (n = 4 per experiment, Tukey *p < 0.05). Treatment with rapamycin or torin 2 decreased SQSTM1 expression in OH eyes compared with AlloP-treated OH eyes. Co-administration of AlloP with bafilomycin A1 significantly increased SQSTM1 expression compared with AlloP-treated OH eyes. (E) Real-time RT-PCR analysis of Lc3b (Ei) and Sqstm1 mRNA (Eii) (n = 10 per experiment, Tukey *p < 0.05). (Ei) Lc3b mRNA was significantly increased in OH eyes treated with AlloP compared with non-treated OH eyes. Co-administration of AlloP with bafilomycin A1 induced no remarkable difference in Lc3b mRNA expression compared with AlloP-treated OH eyes. (Eii) AlloP induced no remarkable changes in Sqstm1 mRNA expression in OH eyes compared with non-treated OH eyes. Administration of AlloP or co-administration of AlloP with bafilomycin A1 induced no remarkable difference in Sqstm1 mRNA expression in OH eyes
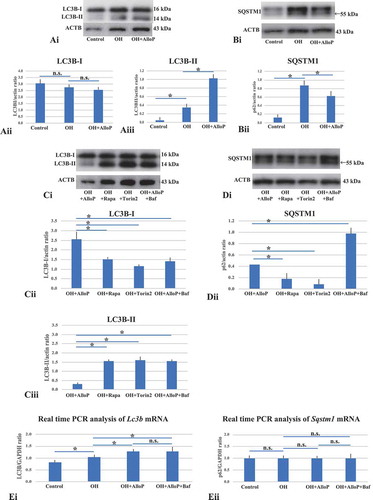
Additionally, we determined that intraperitoneal injection of rapamycin and torin 2 induced increases in LC3B-II levels and decreases in SQSTM1 in retinas of non-treated OH eyes compared to retinas in AlloP-treated OH eyes ( and ). We then examined retinas of AlloP-treated OH eyes with intraperitoneal administration of bafilomycin A1 and found that bafilomycin A1 altered the effects of AlloP on the accumulation of LC3B-II compared to retinas of AlloP-treated OH eyes without bafilomycin A1 (). We also confirmed that the combination of AlloP with bafilomycin A1 induced accumulation of SQSTM1 compared to retinas of AlloP-treated OH eyes without bafilomycin A1 ().
Furthermore, we examined the mRNA expression of Lc3b and Ssqstm1 in the in vivo glaucoma model using quantitative real-time RT–PCR analysis. The level of Lc3b mRNA significantly increased in non-treated OH eyes compared to control eyes (). PCR analysis further revealed significant increases in Lc3b mRNA in retinas of AlloP-treated OH eyes compared to non-treated OH eyes (). Significant changes in Sqstm1 mRNA were not detected in AlloP-treated OH eyes compared to non-treated OH eyes () despite the decrease in SQSTM1 protein levels.
We did not detect significant changes in the expression of Lc3b or Sqstm1 mRNA in retinas of AlloP-treated OH eyes with an intraperitoneal injection of bafilomycin A1 compared to AlloP-treated OH eyes without bafilomycin A1 treatment ( and ). Compared to a single administration of AlloP, a combination of AlloP plus bafilomycin A1 induced higher LC3B-II and SQSTM1 protein levels without increasing corresponding mRNA levels, indicating that AlloP likely acts by enhancing autophagic flow.
Autophagy vacuoles by IOP elevation and effects of neurosteroids in vivo
Electron microscopy revealed the presence of APs and AVd in the NFL of control eyes (Ai-Aiii), and these autophagy vacuoles significantly increased in OH eyes compared to control eyes (Bi-Biii). AlloP significantly increased the number of APs and AVds in the NFL in OH eyes compared to OH eyes without AlloP (Ci-Ciii).
Figure 7. Electron micrographs with in vivo OH eyes. (A-C) Electron micrographs of the NFL. (Ai – Aiii) Control eyes. (Ai) Low magnification. (Aii and Aiii) AVd (double arrows, Aii) and the phagophore (arrowheads, Aiii). (Bi – Biii) Non-treated OH eye. (Bi) Low magnification. (Bii and Biii) AP (single arrow, Bii) and AVd (double arrows, Biii). (Ci – Ciii) OH eyes treated with AlloP. (Ci) Low magnification. (Cii and Ciii) AVds (double arrows). (Di and Dii) The number of APs (Di) and AVds (Dii) (n = 30 per experiment, Tukey *p < 0.05). (E-G) Electron micrographs of optic nerves. E. Control eyes. (Fi – Fiii) OH eye. (Fi) Low magnification. (Fii and Fiii) AP (single arrow, Fii) and AVd (double arrows, Fiii). (Gi – Giii) OH eye treated with AlloP. (Gi) Low magnification. (Gii) AP (single arrow). (Giii) AVd (double arrows). (H) The number of APs (Hi) and AVds (Hii). (n = 30 per experiment, Tukey *p < 0.05)
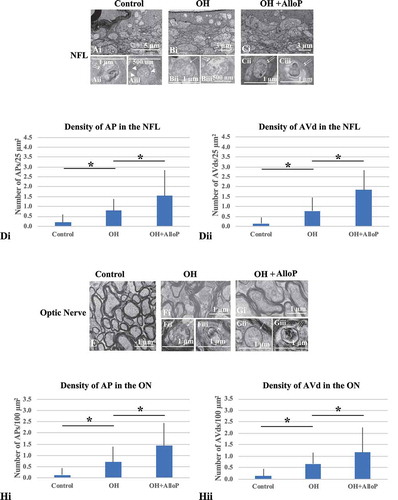
A quantitative assessment of APs and AVds induced by OH and administration of AlloP is summarized in Di and 7Dii, respectively.
We also observed APs and AVds in the optic nerves (ON) of control eyes (). Compared to non-treated OH eyes (Fi-Fiii), the number of APs and AVds significantly increased in the ON of OH eyes treated with AlloP (Gi-Giii). A quantitative assessment of APs and AVds in the ON induced by OH and administration of AlloP is summarized in Hi and 7Hii, respectively.
Intravitreal neurosteroid injection preserves scotopic threshold responses in rat in vivo OH model
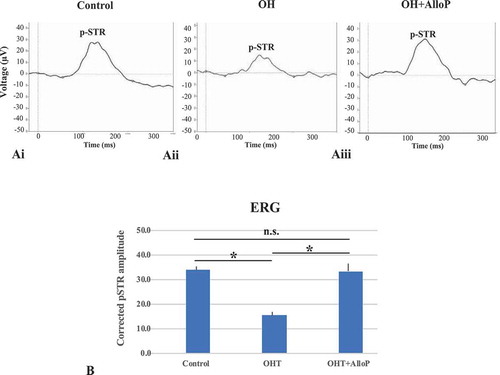
The positive component of the scotopic threshold response (p-STR) amplitude was measured to evaluate the RGC function at 3 weeks after the induction of elevated IOP. Although there were a small number of beads still retained in the center of the corneal endothelium, the visual axis of rats became almost clear at this time. The corrected amplitude of the p-STR at day 21 decreased significantly in OH eyes compared to control eyes (Ai and Aii). A single intravitreal injection of AlloP prevented a decrease in corrected p-STR amplitude (Aiii). A quantitative assessment of p-STR is summarized in .
Figure 8. ERG analyses in in vivo OH eyes. (Ai – Aiii) Representative trace of p-STR in each condition 3 weeks after intracameral bead injection. (Ai) Control. (Aii) OH. (Aiii) Intravitreal administration of AlloP. (B) Summary of corrected p-STR amplitude (n = 5 per each experiment, Tukey *p < 0.05)
Discussion
The present study provides further support that AlloP protects RGCs via GABAA receptors in an ex vivo rat glaucoma model using dissected retinas. To determine whether autophagy also contributes to neuroprotection by AlloP, we examined the effects of autophagy activators (rapamycin, torin 2) and autophagy inhibitors (bafilomycin A1, SAR405) on retinal morphology. In three different lines of histological experiments, we found that administration of rapamycin or torin 2 exerted partial neuroprotection, while combined administration of AlloP with bafilomycin A1 or SAR405 induced severe degeneration in retinal neurons at 75 mm Hg. These data support the idea that autophagy likely contributes to AlloP-induced neuroprotection in the ex vivo glaucoma model.
We next examined whether AlloP promoted autophagy flux. Immunoblotting and quantitative real-time RT-PCR analysis revealed that AlloP increased LC3B-II protein and corresponding mRNA. Because phagophore or autophagosomal membranes recruit LC3, the induction of Lc3b mRNA may be necessary to compensate for the depletion of LC3B protein that is metabolized during AlloP-induced autophagy, similar to what occurs during extensive endoplasmic reticulum stress [Citation25] or hypoxia-induced autophagy [Citation26]. Consistent with the upregulation of LC3B, electron microscopy demonstrated that AlloP significantly increased the number of APs compared to retinas incubated at 75 mm Hg without AlloP. By contrast, AlloP decreased SQSTM1 protein without remarkable changes in Sqstm1 mRNA. However, an increase in LC3B-II or a decrease in SQSTM1 does not directly indicate the induction of autophagy, and flux measurements of autophagy using inhibitors are needed. Thus, we examined the effects of the autophagy inhibitor, bafilomycin A1 (a potent V-ATPase inhibitor), on LC3B and SQSTM1 proteins to determine the activation of autophagy by AlloP. A relatively short duration of bafilomycin A1 treatment (4 h or less) predominantly inhibits lysosomal degradation activity (due to increased lysosomal pH) [Citation27,Citation28]. In the present study, bafilomycin A1 in the presence of AlloP increased LC3B-II and SQSTM1 protein levels without increasing corresponding mRNA levels at 75 mm Hg compared to retinas incubated with AlloP alone at 75 mm Hg. These findings support the possibility of enhanced autophagic flux by AlloP, and that LC3B-II and SQSTM1 accumulate when bafilomycin A1 inhibits AlloP-induced autophagy flux.
SAR405 is a PIK3C3/VPS34 inhibitor that inhibits autophagy flux by blocking AP formation [Citation24]. In our ex vivo glaucoma model, we found that SAR405 completely attenuated the conversion of LC3B-I to LC3B-II (Ci), and significantly increased SQSTM1 levels (Di) in the presence of AlloP at 75 mm Hg compared to retinas treated with AlloP alone at 75 mm Hg. Levels of SQSTM1 inversely correlate with autophagy activity, and when autophagy is inhibited, SQSTM1 accumulates [Citation22,Citation23]. Under pathological conditions, there is a constitutively high level of SQSTM1, which can lead to the accumulation of damaged mitochondria and subsequent ROS production [Citation29]. In the present study, SAR405 significantly increased SQSTM1 protein in the presence of AlloP (Di and Dii). Although further investigation is needed concerning SAR405-induced changes in Sqstm1 mRNA expression, it is plausible that the inhibition of AlloP-induced autophagy flow by SAR405 results in the accumulation of SQSTM1 in the ex vivo glaucoma model.
We also examined the effects of autophagy activators, rapamycin and torin 2, on autophagy markers as positive controls for inducing autophagy in the ex vivo glaucoma model. Rapamycin [Citation30] and torin 2 [Citation31] are allosteric and ATP-competitive inhibitors of MTOR complex 1 (MTORC1), a major suppressor of autophagy induction [Citation32], respectively. In the present study, rapamycin and torin 2 significantly elevated LC3B-II (Ci-Cii), and induced changes in the LC3B-II:LC3B-I ratio comparable to AlloP (Fig. S4). Consistent with an increase in LC3B-II, levels of SQSTM1 protein were markedly reduced following treatment with rapamycin or torin 2 at 75 mm Hg compared to retinas incubated with AlloP at 75 mm Hg (Di and Dii). Considering that rapamycin and torin 2 exerted partial neuroprotection, it appears that autophagy may be a mechanism involved in neuroprotection in the ex vivo glaucoma model.
In an in vivo animal model of glaucoma, a single intravitreal injection of AlloP prevented apoptosis and protected RGCs. Consistent with the ex vivo model, administration of rapamycin or torin 2 exerted partial neuroprotection, while bafilomycin A1 induced severe retinal degeneration in AlloP-treated OH eyes. Western blotting and quantitative real-time RT-PCR analysis revealed that AlloP increased LC3B-II protein and corresponding mRNA, but decreased SQSTM1 protein without remarkable changes of Sqstm1 mRNA. Furthermore, bafilomycin A1 increased LC3B-II and SQSTM1 protein levels in the presence of AlloP without increasing corresponding mRNA levels in OH eyes. These results support the involvement of autophagy as a protective mechanism in an in vivo glaucoma model.
From other studies, it remains uncertain whether autophagy in RGCs is neuroprotective or neurodegenerative [Citation13,Citation33,Citation34]. While apoptosis is a type I programmed cell death (PCD), autophagy is a type II PCD, possibly contributing to RGC death. Park et al. (2012) [Citation11] reported that autophagy activation in RGCs results in apoptosis, suggesting that autophagy may be neurodegenerative. However, the primary role of autophagy is to promote cell survival by recycling cellular debris [Citation35], resulting in neuroprotection, as observed in a mouse model of optic nerve transection [Citation10]. Similarly, in a rat chronic ocular hypertension model, rapamycin, an activator of autophagy, aids RGC survival [Citation36]. Rapamycin also protects RGCs from damage induced by reactive oxygen species (ROS) [Citation10]. In this latter report, 3-MA was neurodegenerative even in controls, suggesting the possibility that autophagy inhibition is deleterious in the retina. However, it is important to note that 3-MA is not a specific autophagy inhibitor [Citation37,Citation38].
Recently, it has been reported that autophagy is protective rather than degenerative when the mitochondrial permeability transition pore (mPTP) remains closed [Citation39]. Additionally, AlloP was reported to activate autophagy in a mouse model of Niemann-Pick Type C disease [Citation19] and primary astrocyte cultures [Citation20], and directly inhibits the mPTP resulting in substantial decreases in mitochondrial cyt c release [Citation40]. Furthermore, a synthetic photoaffinity mimic of AlloP labels the voltage-dependent anion channel that is part of the mPTP [Citation41]. Consistent with these observations, pretreatment with AlloP exerted a neuroprotective effect via reduction of ROS and improvement in mitochondrial respiration in cells transfected by amyloid precursor protein [Citation42].
Although rapamycin and torin 2 induced autophagy in the retina in both the ex vivo and in vivo glaucoma models, neuroprotective effects of these autophagy activators were limited compared with AlloP. By contrast, the effects of AlloP on GABAA receptors also contribute significantly to neuroprotection. These results indicate that the RGC death in glaucoma is a complex process triggered by different molecular mechanisms, and it appears that optimal neuroprotective molecules may have multiple therapeutic targets.
In summary, using rat ex vivo and in vivo glaucoma models, we again demonstrate the neuroprotective effects of AlloP. Along with neuroprotection by AlloP via GABAA receptors, the present data concerning the effects of autophagy activators (rapamycin and torin 2) and autophagy inhibitors (bafilomycin A1, SAR405) on retinal morphology and expression of autophagy markers indicate that AlloP most likely induces a protective form of autophagy in these models. From these observations, we conclude that AlloP may serve as the basis for potential therapeutic agents for the treatment of glaucoma via diverse pharmacological effects.
Materials and methods
Protocols for animal use were approved by the Akita University Animal Studies Committee in accordance with the guidelines of the Policies on the Use of Animals and Humans in Neuroscience Research.
Rat ex vivo eyecup preparation
Rat ex vivo eyecups were prepared from 28–32 d old male Sprague-Dawley rats (Charles River Laboratories International Inc., Crl:CD [SD]), as previously described [Citation17]. The anterior half of the enucleated eyes were carefully removed to make eyecup preparations. Eyecups were placed at the bottom of a 100 ml glass beaker filled with aCSF (artificial cerebrospinal fluid) containing (in mM): 124 NaCl, 5 KCl, 2 MgSO4, 2 CaCl2, 1.25 NaH2PO4, 22 NaHCO3, 10 glucose, pH 7.4 and incubated at 30°C for 24 h using a closed pressure-loading system (Fig. S2). pH was maintained at 7.35 to 7.40. In the closed-pressure system, a glass beaker with the eyecup was placed at the bottom of an acrylic pressure chamber (2,000-ml volume). A 95% O2-5% CO2 gas mixture was delivered through disposable plastic tubing with an infusion valve and a control dial on the lid of the pressure chamber and an air filter (Merck Millipore, SLGP033RS). The plastic tubing delivering the gas terminated 1 cm above the bottom of the beaker.
Acutely prepared eyecups were incubated in gassed aCSF for at least 1 h at 30°C before pressure loading. In some experiments, AlloP (1 μM; MP Biomedicals, Inc., 516-54-1) and autophagy activators, rapamycin (100 nM; LKT Labs, Inc., 1292/1) and torin 2 (1 μM; R & D systems, 4248/10) were dissolved in aCSF at the time of experiment, and administered by bath perfusion for 24 h. Eyecup preparations were pre-treated with these drugs for 1 h at 30°C before pressure loading. Autophagic flux inhibitors, bafilomycin A1 (vacuolar-type H+-ATPase [V-ATPase] inhibitor, 500 nM; BioViotica, BVT-0252) or SAR405 (PIK3C3/VPS34 inhibitor, 1 μM; Cayman, 16979), were co-administered with AlloP during the last 4 h of the treatment period. For pressure loading, the 95% O2-5% CO2 gas mixture was infused until the pressure reading given by a manometer reached the appropriate level. The pressure was then locked by adjusting the control dial of the effusion valve and monitored continuously for 24 h at 30°C. After maintaining the chamber at the set pressure (10 mm Hg and 75 mm Hg) for the indicated time, the pressure inside the chamber was carefully decreased by opening the effusion valve.
Rat in vivo OH model
Eight-week-old male Sprague-Dawley rats were deeply anesthetized with an intraperitoneal injection of a mixture of medetomidine hydrochloride (Wako Pure Chemical Industries Ltd., 133–17474; 0.15 mg/kg), midazolam (Wako Pure Chemical Industries Ltd., 135–13791; 2 mg/kg), and butorphanol tartrate (Wako Pure Chemical Industries Ltd., 021–19001; 2.5 mg/kg), and intraocular pressure was increased unilaterally to induce corneal edema, by intracameral injection of polystyrene microbeads using a single-step, sclerocorneal tunnel approach with a 35 G (gauge) nanoneedle (Saito Medical Instruments Inc., LNAN-3505 LM) connected to a 100 μl WPI Nanofil-100 microsyringe (World Precision Instruments, Inc., Nanofil-100). Sterile 6 μm polystyrene microbeads in a 1 × 10⁶ microbeads/ml solution (Polysciences Inc., 07312) were concentrated to obtain a 1 × 10⁷ microbeads/ml solution. This solution was suspended in PBS (Tocris, 5564). The microbeads suspended in PBS were aspirated into a 100-μl Hamilton microsyringe (Hamilton, 4015–44,010) and injected into the anterior chamber of the right eye of each animal. 10 μl of the microbead suspension were injected without contacting the corneal endothelium or iris with the needle. After stabilization of the elevated IOP (one week after microbead injection), animals were randomly divided into 2 groups (non-treated OH and AlloP injection). AlloP was dissolved in 20% w/v 2-hydroxypropyl)-β-cyclodextrin (2HBCD; Sigma Aldrich, 332,607–25 G) in saline solution 0.05% (w/v), and injected into the vitreous chamber under halothane anesthesia in a total volume of 1 μl using a Hamilton syringe adapted with a 35 gauge (G) nanoneedle 1 week after the beads were injected. OH animals (vehicle control) received sterile 1 μl 20% 2HBCD with PBS. As a further control, 1 μl 20% 2HBCD was intravitreally injected 7 d after intracameral injection with 10 μl of PBS. The tip of the needle was inserted into the superior hemisphere of the eye at a 45° angle through the sclera into the vitreous body to avoid retinal detachment or injury to eye structures.
In some experiments, rapamycin (0.2 mg/kg/d), torin 2 (2 mg/kg/day), or bafilomycin A1 (0.3 mg/kg/d) dissolved in 10% dimethyl sulfoxide (DMSO) was intraperitoneally injected every day for two weeks beginning 7 d after intracameral injection with microbeads.
OH was monitored pre-operatively and at 3 d, 1 week, 2 weeks or 3 weeks after the beads were injected. IOP was measured using a laboratory tonometer (TonoLab, Icare Finland, Vantaa, Finland).
Electron microscopy
Retinal specimens were trimmed to a smaller size, and ultrathin sections (75 nm) were cut with a diamond knife (NEM, Ultra35-3.0) and suspended over formvar-coated slot grids (1 x 2 mm opening) (NEM, 649). The sections were stained with uranyl acetate and lead citrate and viewed in a transmission electron microscope (H-7650, Hitachi High-Technologies Corp., Tokyo, Japan).
In electron microscopy, autophagic vacuoles can be identified as membrane-bound vesicles containing cytosolic material or organelles (ribosomes, endoplasmic reticulum, mitochondria). Morphologically, autophagic vacuoles can be further classified into AP containing morphologically intact cytosol or organelles, and late AV or AVd containing degraded cytoplasmic electron-dense materials [Citation7] or whorls of membranous material [Citation11]. Numbers of AP and AVd inside NFLs were determined as the sum of 30 different areas of 25 μm2 each from each sample (n = 5 for each condition). This same method was used to measure the numbers of AP and AVd inside axons (n = 5 for each condition). These morphometrical parameters were assessed by three raters, who remained unaware of the experimental conditions. Upon completion of data assessment, the significance of individual differences among raters was evaluated using five randomly selected samples in each morphometric parameter by one-way analysis of variance (one-way ANOVA) followed by post hoc testing. There were no significant differences among the raters in any of the morphometric measurements. All data of the density of AP and AVd are expressed as mean ± SEM, and evaluated by Tukey’s multiple comparison test compared to controls.
Data analysis of morphometry
We examined the middle portion of the retina, greater than 1,200 μm away from the center of the optic disc along the inner limiting membrane (ILM), according to previously described methods [Citation17]. The nerve fiber layer thickness (NFLT) was measured by light microscopy along five lines perpendicular to the pigment epithelium at a distance of 15 μm from each other around 1,200 μm away from the center of the optic disc. The average NFLT was determined in nine different light micrographs taken from five eyecup samples in each condition, divided by total retinal thickness, and mean ± standard deviation (%) was analyzed and compared with controls.
The density of degenerated cells characterized by nuclear chromatin clumping or necrosis in theGCL was determined by counting nine fields of 500 μm length in light micrographs taken from the block of the middle retinal part 950 to 1450 μm away from the center of the optic disc [Citation17].
The severity of neuronal damage was assessed by light microscopy using a neuronal damage score (NDS), as previously described [Citation18]. The NDS was determined in nine different light micrographs taken from five eyecup samples in each condition. The NDS rates neuronal damage in the INL and IPL on a 0–4 scale with 0 signifying no neuronal damage and 4 indicating very severe damage. Criteria used in establishing the degree of neuronal damage included the extent of cytoplasmic swelling in the IPL and the number of neurons in the INL showing signs of severe cytoplasmic swelling and coarse clumping of nuclear chromatin. The highest NDS rating (4) is given when the IPL shows apparent spongiform appearance due to dendritic swelling and when most cell bodies in the INL show severe cytoplasmic swelling and coarse clumping of nuclear chromatin. If the damage is of a lesser degree, a rating of 3 is given. NDS 2 is assigned when cell bodies in the INL are sporadically swollen. In NDS 1, damage does not fulfill higher criteria but the retinas differ from controls (NDS 0). Fine dendritic swelling in a limited area of the IPL without damage in the INL is described by NDS 1.
NFLT, the density of degenerated cells in the GCL, and NDS were determined as the measurement of 9 different areas from five eyes per experimental condition. These morphometrical parameters were assessed by three raters, who remained unaware of the experimental conditions. Upon completion of data assessment, the significance of individual differences among raters was evaluated using five randomly selected samples in each morphometric parameter by one-way ANOVA followed by a post-hoc test. There were no significant differences among the raters in any of the morphometric measurements. All data of the NFLT (% vs. retinal thickness), NDS, and the density of degenerated cells in the GCL were expressed as mean ± SEM, and evaluated by Tukey’s multiple comparison test compared to controls incubated in aCSF at 10 mm Hg or 75 mm Hg.
The number of axons was determined by measurement of five different optic nerves from five eyes per experimental condition, and data are presented as axon density per mm2.
Preparation of whole mounted retinas and immunostaining
The retina was carefully detached from the eye by making cuts along the ora serrata and optic nerve. Whole retinas were then flat-mounted, pinned in an acrylic plate with the GCL facing upward using stainless steel pins, and fixed in 4% paraformaldehyde-0.1 M phosphate buffer overnight at 4°C. After the samples were fixed, the tissue was rinsed with PBS three times. To block nonspecific binding, the tissue was incubated in 2% bovine serum albumin (Wako Pure Chemical Industries, Ltd., 018–15,154) in PBS containing 0.5% Triton X-100 (Nakarai tesque, 35,501–02). The whole mounted retinas were incubated in the rabbit anti-RBFOX3 polyclonal antibody solution (Abcam, ab104225, RRID:AB_10711153; 1:100) by gently shaking at 4°C, overnight. After rinsing 3 times using PBS, the retina was incubated in FITC-conjugated secondary antibody (goat anti-rabbit IgG [H&L; Alexa Fluor®️488]) (abcam, ab150077, RRID:AB_2630356; 1:300). The retina tissue was then rinsed 3 times with PBS and mounted on glass slides using 50% PBS and 50% glycerol. Retinal flat-mounts were imaged throughout the GCL in each of the four defined retinal quadrants 4 mm from the optic nerve head using a confocal microscope. Each quadrant was analyzed using a 1 mm2 frame, and counted using Image-Pro Plus software (Media Cybernetics, Inc. Rockville, MD). The density of RBFOX3-positive RGCs per square millimeter was averaged and compared in experimental retinas treated with 1 μM AlloP at 75 mm Hg and control retinas incubated with aCSF at 75 mm Hg by Tukey’s multiple comparison test. RGC counts were analyzed using Image-Pro Plus software (Media Cybernetics, Image-Pro Pl6 USD.3). RBFOX3-positive RGCs were determined as the measurement of five different areas from five eyes per experimental condition. This same method was used to measure the density of RBFOX3-positive RGCs in retinas of AlloP-treated OH eyes compared to non-treated OH eyes in the in vivo model.
Apoptosis
To visualize apoptotic cells, we used the DeadEndTM Colorimetric TUNEL System (Promega, G7130) according to the manufacturer’s instructions. The nuclei were counterstained with DAPI (Merk, S7113). After the length of each retinal section was measured (Image-Pro Plus software), the cells were counted in the whole section length and the number of cells was normalized per 200 μm of retinal section. The number of apoptotic cells was evaluated by Tukey’s multiple comparison test to determine changes in the density of apoptotic cells among experimental retinas treated with 1 μM AlloP at 75 mm Hg and control retinas incubated with aCSF at 75 mm Hg. Apoptotic cells were determined as the measurement of five different areas from five eyes per experimental condition. This same approach was used to measure the number of apoptotic cells in retinas of AlloP-treated OH eyes compared to non-treated OH eyes in the in vivo model.
Western blot analysis
At the end of each experiment, the posterior segments of the eye were placed on a flat cutting surface and immersed in ice-cold aCSF. With a surgical blade, the retina was carefully and gently detached from the sclera with fine forceps. The isolated retinas were frozen at −80°C. Retinas were then homogenized in lysis buffer solution (CelLytic MT; Sigma-Aldrich, Inc.) with protease inhibitor cocktail (Sigma-Aldrich, Inc.), prepared according to the manufacturer’s instructions. The tissue extracts were ultrasonicated and clarified by centrifugation at 12,000 g for 20 min at 4°C. The protein concentrations in supernatants were assayed (Quant-iT assay kit; Invitrogen Corp., Carlsbad, CA). Twenty micrograms of retinal extract were subjected to SDS polyacrylamide gel electrophoretic analysis using NuPAGETM 12% Bis-Tris Gel (Invitrogen, NP0342BOX) for MAP1LC3B/LC3B and NuPAGETM 4-12% Bis-Tris Gel (Invitrogen, NP0322BOX) for SQSTM1 (sequestosome 1). The proteins were then transferred to a PVDF membrane (Invitrogen, IB4010-02). Immunoblots by polyclonal rabbit anti-LC3B antibody (Novus Biologicals, NB100-2220, RRID:AB_10003146) or anti-SQSTM1 mouse monoclonal antibody (abcam, ab91526, RRID:AB_2050336) were visualized using WesternBreeze Chemiluminescent Immunodetection system (Invitrogen, WB7104, WB7106) with the exposure time to autoradiography film (MXJB Plus; Kodak, Rochester, NY) adjusted to avoid over- or undersaturation. Precision Plus ProteinTM Western Standard (Bio-Rad, 1610376) followed by Precision ProteinTM strep Tactin-AP conjugate (Bio-Rad, 1610382) was used as a molecular marker of LC3B. MagicMarkTM XP Western Protein Standard (Invitrogen, LC5602) was used as a molecular marker for SQSTM1.
The density of western blot bands of the cytosolic form of LC3B (LC3B-I), a lipid-anchored form of LC3B (LC3B-II), and SQSTM1 were quantified using Image-Pro Plus software. Quantification was adjusted to protein expression at 10 mm Hg after normalization to the ACTB (actin, beta) band at each pressure, and the relative gray-scale value was calculated by densitometric analysis of the obtained bands. Four independent experiments were performed for each condition, and the results are presented as relative units numerically. Differences in expression levels were evaluated using Tukey’s multiple comparison test.
Quantitative real-time RT-PCR
We quantified mRNA levels of Lc3b (Map1lc3b), an autophagic marker, and Sqstm1 in pressure-loaded eyecup specimens incubated at 10 and 75 mm Hg for 24 h and in retinas of in vivo glaucoma models based on previously reported methods [Citation43] (Ishikawa et al). In some ex vivo experiments, AlloP (1 μM) was dissolved in aCSF at the time of the experiment, and bafilomycin A1 (500 nM) was co-administered with AlloP during the last 4 h of the treatment period. At the end of each experiment, the retina of the empty eyecup was detached from the sclera and immersed in RNAlater solution (Qiagen, 76104). In the present study, ten independent experiments were performed for each condition. All PCR reactions were repeated in duplicate, and the average values were used for statistical analysis. The list of primers used in the present study is summarized as followings;
Gene Map1lc3b
GenBank accession number NM _022867.2
Forward (F) and reverse (R) primer sequences
F: CATGCCGTCCGAGAAGACCT
R: GATGAGCCGGACATCTTCCACT
Product size (bp) 70
Gene Sqstm1
GenBank accession number NM_175843.4
Forward (F) and reverse (R) primer sequences
F: AGGCTTTCAGGCGCACTACC
R: TGGCCATTGTCAGTTCCTCATC
Product size (bp) 77
Gene Gapdh
GenBank accession number NM _017008.4
Forward (F) and reverse (R) primer sequences
F: GGCACAGTCAAGGCTGAGAATG
R: ATGGTGGTGAAGACGCCAGTA
Product size (bp) 143
The primers were designed using the Perfect Real Time® Support System (Takara). Quantification of the relative expression levels of Map1lc3b or Sqstm1 gene was achieved by normalizing to Gapdh using the ΔΔCt method.
Immunohistochemistry
Frozen sections were incubated with a rabbit anti-LC3B polyclonal antibody (MBL International, PM036B, RRID:AB_1953096) at a 1:500 dilution or a rabbit anti-SQSTM1 polyclonal antibody (abcam, ab91526, RRID:AB_2050336) at a 1:1000 dilution for 1 h at 37°C. After incubation for 1 h at 37°C with the corresponding secondary antibody, samples were counterstained with DAPI in PBS for 5 min. A goat anti-rabbit IgG H&L (Alexa Fluor® 488; abcam, ab150077, RRID:AB_2630356) was used for a rabbit anti-LC3B polyclonal antibody or a rabbit anti-SQSTM1 polyclonal antibody.
Stained sections were imaged by confocal laser scanning microscopy (LSM510 Axiovert200 M; Carl Zeiss Meditec, Goettingen, Germany). For the quantification of immunohistochemical data, images of each section without DAPI staining were captured. Digital images were analyzed, and the intensity of FITC fluorescence was measured using Image-Pro Plus software (Media Cybernetics, Rockville, MD).
ERG recording
The positive components of the p-STR were measured to evaluate the RGC function at 3 weeks after the induction of elevated IOP. The rats were dark-adapted overnight and were prepared for the electroretinogram (ERG) recording under dim red light. Each animal underwent additional dark adaptation for approximately 30 min before starting the ERG recording. The rats were anesthetized with an intraperitoneal injection of a mixture of medetomidine hydrochloride, midazolam, and butorphanol tartrate. The pupils were maximally dilated with topical 0.5% tropicamide (Sigma-Aldrich, T9778), and the corneas were anesthetized with topical 0.4% oxybuprocaine hydrochloride (Sigma-Aldrich, O0270000). A contact lens electrode embedded with gold wire was placed on the cornea as an active electrode (Mayo, Nagoya, Japan), and a chloride silver plate was placed in the mouth as a reference electrode. A grounded aluminum sheet placed under the animal served as the ground electrode. Body temperature was kept at 37°C with a heating pad.
Full-field ERGs were recorded simultaneously from both eyes using a PuRec system (Mayo Co., Nagoya, Japan). Stimuli were delivered via a Hemisphere Stimulator consisting of an acrylic hemisphere and a LED photic stimulator (LS-100; Mayo Co., Nagoya, Japan). p-STR was obtained for stimulus intensities ranging from −7.00 to 1.0 log(cds)/m2 in 0.5 log unit increments by averaging 20 responses per intensity, with an interstimulus interval of 3–5 s. We chose 120 ms as the criterion time to measure the amplitudes of the waves of positive STRs (−4 log[cds]/m2). Amplitude of p-STR was normalized to the increased b-wave amplitude [Citation44]. Sample numbers were five per each experimental condition.
Chemicals
AlloP was purchased from Wako Pure Chemical Industries, Ltd. (596–30841). All other chemicals were purchased from Sigma-Aldrich Corp. or Nacalai Tesque (Kyoto, Japan). AlloP was dissolved in DMSO as a 10 mM stock solution.
Statistical analysis
Data were double-checked and analyzed using a biomedical statistical computer program (http://www.gen-info.osaka-u.ac.jp/MEPHAS/dunnett.html) on a personal computer. Descriptive statistical results were presented using the mean values (mean) ± standard deviation (SD). For comparison with both the control and other conditions, we used Tukey’s multiple comparison test. For all analyses, p values were considered statistically significant, when the values were less than 0.05 (two-tailed).
Supplemental Material
Download Zip (33 MB)Acknowledgments
Authors thank Yoko Hayami for technical support.
Disclosure Statement
Competing Interests: C.F.Z. serves on the Scientific Advisory Board of Sage Therapeutics. C.F.Z. and D.F.C. own stock in Sage Therapeutics. M.I. and T.Y. receive lecture fees from Santen, Pfizer, Kowa, Otsuka, and Alcon. S.T. and Y.I. has no financial conflicts of interest. DFC has an unpaid and non-financially supported collaboration involving research on cataracts with Viewpoint Therapeutics. Other authors declare no non-financial competing interests.
Supplementary Material
Supplemental data for this article can be accessed here.
Additional information
Funding
Related Research Data
References
- Tham YC, Li X, Wong TY, et al. Global prevalence of glaucoma and projections of glaucoma burden through 2040: a systematic review and meta-analysis. Ophthalmology. 2014;121(11):2081–2090.
- Quigley HA. Neuronal Death in Glaucoma. Prog Retin Eye Res. 1999;18(1):39–57.
- The AGIS Investigators. The advanced glaucoma intervention study (AGIS): 7. The relationship between control of intraocular pressure and visual field deterioration. Am J Ophthalmol. 2000;130(4): 429–440. .
- de Waal EJ, Vreeling-Sindelárová H, Schellens JP, et al. Starvation-induced microautophagic vacuoles in rat myocardial cells. Cell Biol Int Rep. 1986;10(7):527–533.
- Takeshige K, Baba M, Tsuboi S, et al. Autophagy in yeast demonstrated with proteinase-deficient mutants and conditions for its induction. J Cell Biol. 1992;119(2):301–311.
- Mizushima N. Autophagy: process and function. Gens Dev. 2007;21(22):2861–2873. .
- Eskelinen EL. Maturation of autophagic vacuoles in Mammalian cells. Autophagy. 2005;1(1):1–10.
- Hasegawa J, Maejima I, Iwamoto R, et al. Selective autophagy: lysophagy. Methods. 2015;75:128–132.
- Liton PB, Lin Y, Gonzalez P, et al. Potential role of lysosomal dysfunction in the pathogenesis of primary open angle glaucoma. Autophagy. 2009;5(1):122–124.
- Rodríguez-Muela N, Germain F, Mariño G, et al. Autophagy promotes survival of retinal ganglion cells after optic nerve axotomy in mice. Cell Death Differ. 2012;19:162–169.
- Park HY, Kim JH, Park CK. Activation of autophagy induces retinal ganglion cell death in a chronic hypertensive glaucoma model. Cell Death Dis. 2012;3:e290.
- Kitaoka Y, Munemasa Y, Kojima K, et al. Axonal protection by Nmnat3 overexpression with involvement of autophagy in optic nerve degeneration. Cell Death Dis. 2013;4:e860.
- Munemasa Y, Kitaoka Y. Autophagy in axonal degeneration in glaucomatous optic neuropathy. Prog Retin Eye Res. 2015;47:1–18.
- Russo R, Nucci C, Corasaniti MT, et al. Autophagy dysregulation and the fate of retinal ganglion cells in glaucomatous optic neuropathy. Prog Brain Res. 2015;220:87–105.
- Locci A, Pinna G. Neurosteroid biosynthesis down-regulation and changes in GABAA receptor subunit composition: a biomarker axis in stress-induced cognitive and emotional impairment. Bri J Pharmacol. 2017;174(19):3226–3241. .
- Ishikawa M, Yoshitomi T, Zorumski CF, et al. Effects of acutely elevated hydrostatic pressure in a rat ex vivo retinal preparation. Invest Ophthalmol Vis Sci. 2010;51(12):6414–6423.
- Ishikawa M, Yoshitomi T, Zorumski CF, et al. Neurosteroids are endogenous neuroprotectants in an ex vivo glaucoma model. Invest Ophthalmol Vis Sci. 2014;55(12):8531–8541.
- Ishikawa M, Yoshitomi T, Covey DF, et al. TSPO activation modulates the effects of high pressure in a rat ex vivo glaucoma model. Neuropharmacology. 2016;111:142–159.
- Liao G, Cheung S, Galeano J, et al. Allopregnanolone treatment delays cholesterol accumulation and reduces autophagic/lysosomal dysfunction and inflammation in Npc1-/- mouse brain. Brain Res. 2009;1270:140–151.
- Kim HN, Lee SJ, Koh JY. The neurosteroids, allopregnanolone and progesterone, induce autophagy in cultured astrocytes. Neurochem Int. 2012;60(2):125–133.
- Liu X, Tian F, Wang S, et al. Astrocyte autophagy flux protects neurons against oxygen-glucose deprivation and ischemic/reperfusion injury. Rejuvenation Res. 2017;21(5):405–415.
- Bjørkøy G, Lamark T, Brech A, et al. P62/sqstm1 forms protein aggregates degraded by autophagy and has a protective effect on Huntingtin-induced cell death. J Cell Biol. 2005;171(4):603–614.
- Bjørkøy G, Lamark T, Pankiv S, et al. Monitoring autophagic degradation of p62/SQSTM1. Methods Enzymol. 2009;452:181–197.
- Ronan B, Flamand O, Vescovi L, et al. A highly potent and selective Vps34 inhibitor alters vesicle trafficking and autophagy. Nat Chem Biol. 2014;10(12):1013–1019.
- Kouroku Y, Fujita E, Tanida I, et al. ER stress (PERK/eIF2 [alpha] phosphorylation) mediates the polyglutamine-induced LC3 conversion, an essential step for autophagy formation. Cell Death Differ. 2007;14:230–239.
- Rouschop KM, van den Beucken T, Dubois L, et al. The unfolded protein response protects human tumor cells during hypoxia through regulation of the autophagy genes MAP1LC3B and ATG5. J Clin Invest. 2010;120(1):127–141.
- Yoshimori T, Yamamoto A, Moriyama Y, et al. Bafilomycin A1, a specific inhibitor of vacuolar-type H(+)-ATPase, inhibits acidification and protein degradation in lysosomes of cultured cells. J Biol Chem. 1991;266(26):17707–17712.
- Sarkar S, Korolchuk V, Renna M, et al. Methodological considerations for assessing autophagy modulators: a study with calcium phosphate precipitates. Autophagy. 2009;5(3):307–313.
- Johansen, T, Lamark T. Selective autophagy mediated by autophagic adapter proteins. Autophagy. 2011;7(3):279–296.
- Thoreen CC, Sabatini DM. Rapamycin inhibits mTORC1, but not completely. Autophagy. 2009;5(5):725–726.
- Liu Q, Xu C, Kirubakaran S, et al. Characterization of Torin2, an ATP-competitive inhibitor of mTOR, ATM, and ATR. Cancer Res. 2013;73(8):2574–2586.
- Li M, Khambu B, Zhang H, et al. Suppression of lysosome function induces autophagy via a feedback down-regulation of MTOR complex 1 (MTORC1) activity. J Boil Chem. 2013;288(50):35769–35780.
- Wang Y, Huang C, Zhang H, et al. Autophagy in glaucoma: crosstalk with apoptosis and its implications. Br Res Bull. 2015;117:1–9.
- Davis BM, Crawley L, Pahlitzsch M, et al. Glaucoma: the retina and beyond. Acta Neuropathol. 2016;132(6):807–826.
- Levy JM, Thorburn A. Targeting autophagy during cancer therapy to improve clinical outcomes. Pharmacol Ther. 2011;131(1):130–141.
- Su W, Li Z, Jia Y, et al. Rapamycin is neuroprotective in a rat chronic hypertensive glaucoma model. PLoS One. 2014;9(6):e99719.
- Heckmann BL, Yang X, Zhang X, et al. The autophagic inhibitor 3-methyladenine potently stimulates PKA-dependent lipolysis in adipocytes. Br J Pharmacol. 2013;168(1):163–171.
- Dembitz V, Lalic H, Visnjic D. 5-Aminoimidazole-4-carboxamide ribonucleoside-induced autophagy flux during differentiation of monocytic leukemia cells. Cell Death Discov. 2017;3:17066.
- Zhou B, Kreuzer J, Kumsta C, et al. Mitochondrial permeability uncouples elevated autophagy and lifespan extension. Cell. 2019;177(2):299–314.
- Sayeed I, Parvez S, Wali B, et al. Direct inhibition of the mitochondrial permeability transition pore: a possible mechanism for better neuroprotective effects of allopregnanolone over progesterone. Brain Res. 2009;1263:165–173.
- Cheng WWL, Budelier MM, Sugasawa Y, et al. Multiple neurosteroid and cholesterol binding sites in voltage-dependent anion channel-1 determined by photo-affinity labeling. Biochim Biophys Acta Mol Cell Biol Lipids. 2019;1864(10):1269–1279.
- Lejri I, Grimm A, Miesch M, et al. Allopregnanolone and its analog BR 297 rescue neuronal cells from oxidative stress-induced death through bioenergetic improvement. Biochim Biophys Acta Mol Basis Dis. 2017;1863(3):631–642.
- Ishikawa M, Yoshitomi T, Zorumski CF, et al. Downregulation of glutamine synthetase via GLAST suppression induces retinal axonal swelling in a rat ex vivo hydrostatic pressure model. Invest Ophthalmol Vis Sci. 2011;52(9):6604–6616.
- Frankfort BJ, Khan AK, Tse DY, et al. Elevated intraocular pressure causes inner retinal dysfunction before cell loss in a mouse model of experimental glaucoma. Invest Ophthalmol Vis Sci. 2013;54(1):762–770.