
ABSTRACT
ATM (ataxia telangiectasia mutated) protein is found associated with multiple organelles including synaptic vesicles, endosomes and lysosomes, often in cooperation with ATR (ataxia telangiectasia and Rad3 related). Mutation of the ATM gene results in ataxia-telangiectasia (A-T), an autosomal recessive disorder with defects in multiple organs including the nervous system. Precisely how ATM deficiency leads to the complex phenotypes of A-T, however, remains elusive. Here, we reported that part of the connection may lie in autophagy and lysosomal abnormalities. We found that ATM was degraded through the autophagy pathway, while ATR was processed by the proteasome. Autophagy and lysosomal trafficking were both abnormal in atm−/− neurons and the deficits impacted cellular functions such as synapse maintenance, neuronal survival and glucose uptake. Upregulated autophagic flux was observed in atm−/− lysosomes, associated with a more acidic pH. Significantly, we found that the ATP6V1A (ATPase, H+ transporting, lysosomal V1 subunit A) proton pump was an ATM kinase target. In atm−/− neurons, lysosomes showed enhanced retrograde transport and accumulated in the perinuclear regions. We attributed this change to an unexpected physical interaction between ATM and the retrograde transport motor protein, dynein. As a consequence, SLC2A4/GLUT4 (solute carrier family 4 [facilitated glucose transporter], member 4) translocation to the plasma membrane was inhibited and trafficking to the lysosomes was increased, leading to impaired glucose uptake capacity. Together, these data underscored the involvement of ATM in a variety of neuronal vesicular trafficking processes, offering new and therapeutically useful insights into the pathogenesis of A-T.
Abbreviations: 3-MA: 3-methyladenine; A-T: ataxia-telangiectasia; ALG2: asparagine-linked glycosylation 2 (alpha-1,3-mannosyltransferase); AMPK: adenosine 5‘-monophosphate (AMP)-activated protein kinase; ATG5: autophagy related 5; ATM: ataxia telangiectasia mutated; ATP6V1A: ATPase, H+ transporting, lysosomal V1 subunit A; ATR: ataxia-telangiectasia and Rad3 related; BFA1: bafilomycin A1; CC3: cleaved-CASP3; CGN: cerebellar granule neuron; CLQ: chloroquine; CN: neocortical neuron; CTSB: cathepsin B; CTSD: cathepsin D; DYNLL1: the light chain1 of dynein; EIF4EBP1/4E-BP1: eukaryotic translation initiation factor 4E binding protein 1; Etop: etoposide; FBS: fetal bovine serum; GAPDH: glyceraldehyde-3-phosphate dehydrogenase; HBS: HEPES-buffered saline; HEPES: 4-(2-hydroxyethyl)-1-piperazineethanesulfonic acid; HOMER1: homer protein homolog 1; KU: KU-60019; LAMP1: lysosomal-associated membrane protein 1; LC3B-II: LC3-phosphatidylethanolamine conjugate; Lyso: lysosome; LysopH-GFP: lysopHluorin-GFP; MAP1LC3B/LC3B: microtubule-associated protein 1 light chain 3 beta; MAP2: microtubule associated protein 2; MAPK14: mitogen-activated protein kinase 14; MAPK8/JNK1: mitogen-activated protein kinase 8; MCOLN1/TRPML1: mucolipin 1; OSBPL1A: oxysterol binding protein like 1A; PIKK: phosphatidylinositol 3 kinase related kinase; Rapa: rapamycin; RILP: rab interacting lysosomal protein; ROS: reactive oxygen species; SEM: standard error of mean; SLC2A4/GLUT4: solute carrier family 2 (facilitated glucose transporter), member 4; TSC2/tuberin: TSC complex subunit 2; ULK1: unc-51 like kinase 1; UPS: ubiquitin-proteasome system; VE: VE-822; WCL: whole-cell lysate; WT: wild type.
Introduction
Ataxia-telangiectasia (A-T) is an autosomal recessive disorder characterized by ataxia associated with degeneration of cerebellar Purkinje cells, immunodeficiency, telangiectasia, susceptibility to X-rays, predisposition to cancer, sterility and other symptoms. It is caused by the mutation of a single gene – ATM (ataxia telangiectasia mutated) – that encodes a 370 kDa member of the phosphatidylinositol 3 kinase-related kinase (PIKK) family. ATM and its PIKK sister kinase, ATR (ataxia telangiectasia and Rad3 related), play roles in the DNA damage response [Citation1,Citation2]. ATR is primarily involved in the repair of single-strand DNA breaks; ATM is more involved with double-strand break repair. Some of the A-T phenotypes seem logically related to DNA damage repair (radiation sensitivity and cancer predilection). For the neurological deficits, however, the path from impaired DNA repair to actual symptoms of A-T is less clear. In addition to their roles in DNA damage repair in the cell nucleus, ATM and ATR are also found in the cytoplasm. Peroxisomes [Citation3], synaptic vesicles [Citation4–6] and lysosomes [Citation7] are all associated with ATM protein. Moreover, glucose transporters are targets of the ATM kinase [Citation8] suggesting a presumed extra-nuclear role for ATM in regulating glucose metabolism.
Lysosome numbers are increased in mouse atm−/− neurons [Citation7], although the underlying molecular mechanism remains unknown. Lysosomes are organelles that degrade a wide variety of intracellular or extracellular biomaterials [Citation9]. Their interior is kept at an acidic pH and they are filled with acid hydrolases and proteases, including CTSB, CTSD and CTSH [Citation10]. While most misfolded or damaged proteins are degraded by the ubiquitin-proteasome system (UPS) [Citation10,Citation11], many are sorted to lysosomes for degradation. Unlike the UPS, fully functional lysosomes must also be able to deal with larger cellular structures such as endosomes and autophagosomes. They are also able to fuse with the plasma membrane, resulting in the exocytosis of their contents [Citation12]. In neurons, lysosome exocytosis is important for regulating neurite outgrowth [Citation13], and thus for synaptogenesis and neuronal plasticity. Lysosomes are not static structures; when autophagy is induced, they move centripetally toward the perinuclear region of the cell. Defects in this trafficking are associated with lysosomal storage disease [Citation14], and likely contribute to neurodegenerative diseases [Citation15,Citation16]. In the current study, we sought to investigate whether and how the increased lysosomes in A-T contributes to the neurodegeneration phenotype.
Macroautophagy/autophagy is a lysosome-dependent degradation process characterized by increased autophagosome formation and is essential for neuron survival [Citation17,Citation18]. The nucleation and elongation of the autophagosome membrane are dependent on several Atg family proteins. In the elongation step, two forms of LC3B/Atg8 (microtubule-associated protein 1 light chain 3 beta), LC3B-I and LC3B-II, are found [Citation19]. LC3B-I is the cytosolic form of LC3B. When covalently conjugated to phosphatidylethanolamine, it undergoes proteolysis and forms an LC3B-II (LC3-phosphatidylethanolamine conjugate) after which it is recruited to the phagophore membrane and a portion of the total population remains associated with the completed autophagosome [Citation19,Citation20]. Formation of LC3B-II is thus a marker of autophagosome maturation. The mature autophagosome then fuses with the lysosome to form the autolysosome [Citation19]. This highly organized process is not only important for misfolded protein degradation, but also crucial for managing damaged long-lived cytosolic proteins taken up by endocytosis to be recycled [Citation10]. ATM has been reported to play multifaceted roles in autophagy, mitophagy and pexophagy [Citation21–26].
Previous research found that basal autophagy was increased while mitophagy was decreased in atm-null thymocytes [Citation22]. Other studies showed that as a reactive oxygen species (ROS) sensor, ATM was involved in autophagy induction via various pathways such as the TSC2/tuberin and MTOR (mechanistic target of rapamycin kinase) complex 1 signaling node, the MAPK14 (mitogen-activated protein kinase 14) pathway, the adenosine 5‘-monophosphate (AMP)-activated protein kinase (AMPK), ULK1 (unc-51 like autophagy activating kinase 1) pathway and the BECN1-PIK3C3 complex [Citation23,Citation24,Citation27]. In A-T, autophagy is upregulated [Citation28,Citation29], while the ubiquitin pathway is downregulated [Citation30]. This is not unexpected since, while autophagy and the UPS are traditionally regarded as independent, there is significant crosstalk between the two pathways [Citation31,Citation32]. Consistent with this idea, the UPS and autophagic pathways are often concurrently affected during the pathogenesis of neurodegenerative diseases [Citation33]. Thus, in the present study, we start with the investigation into the crosstalk of the autophagy and UPS degradation pathway of the two complementary proteins, ATM and ATR.
In this study, we extended earlier findings on the complementary roles of ATM and ATR to now include their pathways of degradation: ATM by autophagy, ATR by UPS. We demonstrated that autophagic flux was upregulated in atm−/− cells. Additionally, lysosome trafficking was affected, and lysosome pH shifted toward more acidic values. Vesicle trafficking problems led to aberrant protein trafficking as illustrated by the trafficking of SLC2A4/GLUT4 (solute carrier family 2 member 4) to the lysosome instead of the cell membrane. Our findings offered a fresh perspective on the complex and pleiotropic phenotypes of A-T.
Results
ATM and ATR were degraded by different mechanisms
We have previously described a reciprocal relationship between ATM and ATR proteins [Citation4] in their function as synaptic vesicle binding proteins. Extending this observation, we found that ATM inhibition induced opposite changes in the protein levels of ATM and ATR ()), even as their mRNA levels remained unchanged [Citation4]. To test the idea that the protein differences were due to differential degradation, we induced autophagy in neurons with rapamycin and found an increase in ATR protein and a decrease in ATM ()). We next treated the neuronal cell line, HT22, with three different autophagy inhibitors (3-methyladenine, bafilomycin A1 and chloroquine) for 24 h. All three inhibitors led to a significant increase in ATM protein with no changes in ATR ()). We next used siRNA against Atg5 (autophagy related 5) to inhibit autophagy and monitored the effects on ATM and ATR protein levels. We again found a significant increase in ATM protein and an obvious decrease of ATR protein ()). The results suggested that autophagy mediated ATM, but not ATR, degradation.
Figure 1. Non-overlapping degradation pathways of ATM and ATR. (A) Representative blots of ATM and ATR in WT cortical neurons treated with 1 µM KU-60019 (KU) or DMSO for 24 h. TUBA (tubulin, alpha) served as a loading control. (B) Protein levels normalized to TUBA. Error bars = SEM; n = 4–5 batches of cells, p values are as marked (unpaired t test). (C) Representative blots of ATM and ATR in WT cortical neurons treated with 0.1 µM rapamycin (Rapa) or DMSO for 1 h. TUBA served as a loading control. (D) Protein levels normalized to TUBA. Error bars = SEM; n = 3 batches of cells, p values are as marked (unpaired t test). (E) Representative blots of ATM and ATR in HT22 cells treated with autophagy inhibitors (5 mM 3-methyladenine, 0.1 μM bafilomycin A1, 50 μM chloroquine) for 24 h. GAPDH served as a loading control. (F) Protein levels normalized to GAPDH. Error bars = SEM; n = 3 batches of cells, p values are as marked (unpaired t test). (G) Representative blots of ATG5, ATM, ATR in wildtype cortical neurons treated with control siRNA and siRNA targeted to Atg5. TUBA served as a loading control. (H) Protein levels of ATG5, ATM and ATR normalized to TUBA. Error bars = SEM; n = 3–4 batches of cultures; p values are as marked (unpaired t test). (I) Representative blots of ATM and ATR in the lysates of HT22 cells treated with 10 μM MG132 or DMSO for 24 h. TUBA served as a loading control. (J) Protein levels normalized to TUBA. Error bars = SEM; n = 3 batches of cultures; p values are as marked (unpaired t test). (K) Protein level of ATM and ATR normalized to TUBA in lysates of HT22 cells treated with 10 μM MG132 in time course. Error bars represent SEM; n = 3 batches of cells; ns, p = 0.9289, *, p = 0.0383 (paired t test). (L) Normalized Atm and Atr mRNA level in WT cortical neurons treated with MG132 or rapamycin with B27-free medium (Rapa). Error bars = SEM; n = 2–3 batches of cells; ns, p = 0.2649, 0.7940, 0.8179, 0.4289 (unpaired t test). (M) ATM or ATR immunoprecipitates from lysates of HT22 cells treated with 10 μM MG132 or DMSO for 24 h blotted with the indicated antibodies. (N) Ubiquitinated-ATR to total ATR ratio. Error bars = SEM; n = 3 batches of cells; p = 0.0084 (unpaired t test). (O) Representative immunostaining images of ATM (red) or ATR (red) and LC3B (green) or LAMP1 (green) in WT cortical neurons
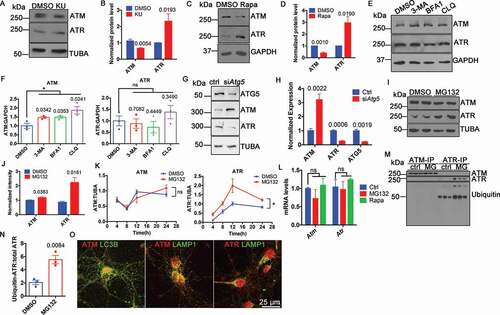
Another pathway of protein degradation is by the ubiquitin-proteasome system (UPS) [Citation10]. In contrast to autophagy inhibition, the proteasome inhibitor, MG132, caused a significant increase in ATR protein levels yet had little effect on ATM ()). The effect on ATR was progressive up to the point of cell death () and S1). To make sure that the change of protein levels resulted solely from aberrant protein degradation, the mRNA levels of Atm and Atr were determined at the same time. With either rapamycin-induced autophagy or MG132-inhibited proteasome treatments, neither Atm nor Atr message showed any significant change ()). To test the involvement of ATR ubiquitination, we immunoprecipitated ATM and ATR from cell lysates of cultures treated with MG132 then blotted against ubiquitin. We found that ubiquitinated ATR significantly increased ()), supporting the idea that it was degraded by the ubiquitin proteasome pathway. Finally, we showed that ATM but not ATR was colocalized with autophagic proteins, such as LC3B and LAMP1 (lysosomal-associated membrane protein 1) ()), which was additional evidence for autophagy as the degradation pathway of ATM. To summarize, ATM and ATR proteins were degraded by completely different pathways.
Induced autophagy caused synaptic loss and neuronal death
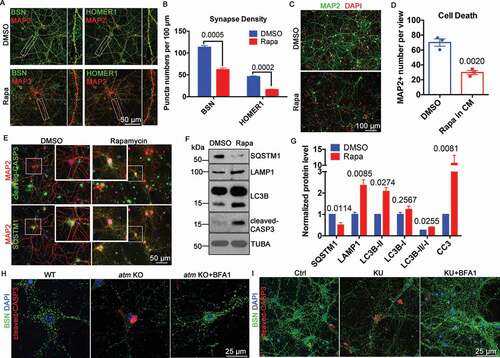
The rapamycin results suggested that some of the symptoms of A-T might be due to altered autophagic flux. In support of this idea, autophagy upregulation with rapamycin mimicked the effects of ATM deficiency, namely synapse loss (Fig. S2), neuronal atrophy and death [Citation4]. We treated DIV14 neuronal cultures with rapamycin and analyzed synaptic changes and neuronal viability. The density of both the presynaptic protein BSN (bassoon) and the post-synaptic protein HOMER1 (homer scaffolding protein 1) were significantly reduced ()). Neuronal cell death was also increased (), most likely due to apoptotic cell death ()). We verified that rapamycin had induced autophagy by finding decreased levels of SQSTM1/p62 protein, increased LAMP1 and increased LC3B-II:LC3B-I ratio ()). While rapamycin potentially has many effects on a cell, its ability to induce autophagy suggests that upregulation of autophagy contributes to many of the A-T-associated neurodegenerative symptoms [Citation4]. Given this idea, we asked whether the inhibition of autophagy could rescue the neurodegenerative phenotypes caused by ATM deficiency. We incubated atm−/− cortical neurons with the autophagy inhibitor, bafilomycin A1 for 24 h, then examined the responses of the synaptic protein BSN, and the apoptotic cell death protein, cleaved CASP3. Bafilomycin A1 rescued both the loss of synapse density and increased apoptotic cell death ()). The effects of chemical inhibition of ATM with KU-60019 on synapse loss and neuronal death were also reversed by bafilomycin A1 ()).
Figure 2. Induced autophagy caused synapse loss and cell death in neurons. (A) Immunostaining of BSN (green) or HOMER1 (green) and MAP2 (red) in WT cortical neurons treated with 0.1 µM rapamycin (Rapa) or DMSO for 1 h. Insets represent higher magnification of the regions indicated. (B) Synapse density as estimated by BSN and HOMER1 puncta. Error bars = SEM; n = 3 batches of cells, p values are as marked (unpaired t test). (C) MAP2 (green) staining of WT cortical neurons treated with 1 µM rapamycin (Rapa) or DMSO for 1 h. DAPI (red) was used as a counterstain for nucleus. (D) MAP2-positive neuron numbers in the two groups. Error bars = SEM; n = 3 batches of cells, p = 0.002. (E) Representative co-immunostaining of cleaved-CASP3 (green) or SQSTM1 (green) and MAP2 (red) in WT cortical neurons treated with 1 µM rapamycin or DMSO for 1 h. DAPI (blue) was used as a counterstain. (F) Representative blots of SQSTM1, LAMP1, LC3B, and cleaved-CASP3 (CC3) in WT cortical neurons treated with 1 µM rapamycin or DMSO for 1 h. TUBA served as a loading control. (G) Quantification of blots in panel F. Error bars = SEM; n = 2–4 batches of cells, p values are as marked (unpaired t test). (H) Representative immunostaining images of BSN (green) and cleaved-CASP3 (red) in WT and atm KO cortical neurons and atm KO neurons treated with bafilomycin A1 (BFA1, 0.1 μM) for 24 h. DAPI (blue) was used as a counterstain for nucleus. (I) Representative immunostaining images of BSN (green) and cleaved-CASP3 (red) in WT cortical neurons treated with KU-60019 (KU, 1 μM) or KU-60019 (KU, 1 μM) together with bafilomycin A1 (BFA1, 0.1 μM) for 24 h. DAPI (blue) was used as a counterstain for nucleus
Upregulation of autophagy in ATM-deficient cells
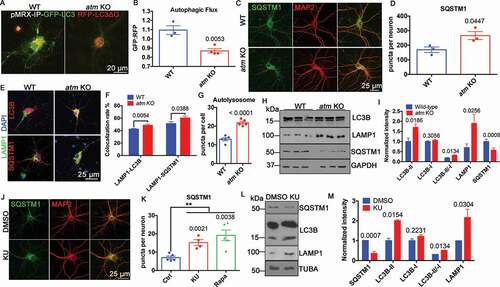
Autophagy was enhanced in atm−/− neurons as measured with the reporter construct, pMRX-IP-GFP-LC3-RFP-LC3ΔG ()). With this reporter system, the GFP:RFP ratio decreases as the rate of autophagic flux increases [Citation34] and atm−/− cortical neurons had a decreased GFP:RFP ratio ()). To confirm this, we used the degradation of SQSTM1 as an independent measure. We found that the number of SQSTM1 puncta per neuron was significantly increased in atm−/− compared to wild type neurons ()), consistent with elevated levels of autophagy in the absence of ATM. We also found that both SQSTM1 and LC3B levels were increased in lysosomes isolated from cortex of atm−/− mice (Fig. S3A), even though the total cellular levels of SQSTM1 were decreased ()). The size of the SQSTM1 puncta was larger and, similar to the autophagosome puncta, were more concentrated in the perinuclear region of atm−/− neurons ()). We also checked the colocalization of LAMP1 and LC3B as well as LAMP1 and SQSTM1. Both showed a significant increase in atm−/− compared to wild type neurons ()). The LAMP1 and LC3B-double-positive autolysosome numbers also increased in atm−/− neurons ()). We next compared the levels of autophagy-related protein markers in lysates from wild type and atm−/− mouse cortex ()). These results showed a significant elevation of LC3B-II and an increased LC3B-II to LC3B-I ratio in the mutant ()). In contrast to a decrease of SQSTM1 protein levels, the lysosome membrane protein, LAMP1 was increased ()). The ATM loss induced autophagy upregulation was highly dependent on ATM kinase activity as the SQSTM1 puncta responded similarly when neurons were treated with the ATM kinase inhibitor, KU-60019 ()). Also, western blots of KU-60019-treated cell lysates showed increased LAMP1, LC3B-II, and the LC3B-II to LC3B-I ratio as well as decreased SQSTM1 ()), parallel to ATM deficiency. These changes were autophagy-dependent as rapamycin alone caused a response similar to KU-60019 treatment with respect to the SQSTM1 puncta (Fig. S3D and S3E). Finally, we extended these findings to human fibroblast cultures. As predicted by the mouse brain data, the levels of LC3B-II as well as LAMP1 were significantly increased in A-T fibroblasts (Fig. S3B and S3C). Thus, blocking ATM kinase activity replicated the phenotype of elevated autophagic flux in genetically ATM-deficient cells.
Figure 3. Autophagy was upregulated in ATM-deficient cells. (A) WT and atm−/− (atm KO) cortical neurons transfected with pMRX-IP-GFP-LC3-RFP-LC3ΔG. (B) Quantification of the GFP/RFP ratio (autophagic flux). Error bars = SEM; n = 3–4 batches of cultures; p = 0.0053 (unpaired t test). (C) Representative SQSTM1 (green) and MAP2 (red) immunolabeling images of WT and atm−/− cortical neurons. (D) SQSTM1 puncta density per neuron shown in Panel C. Error bars = SEM; n = 3 cultures; p = 0.0447 (unpaired t test). (E) Representative co-immunostaining images of LAMP1 (green) with LC3B (red) and LAMP1 (green) with SQSTM1 (red) in WT and atm−/− cortical neurons. DAPI (blue) was used as a counterstain for nucleus. (F) Colocalization rate of LAMP1 and LC3B, LAMP1 and SQSTM1 in WT and atm−/− cortical neurons. Error bars = SEM; n = 10 coverslips from 3 batches of neuronal cultures; p = 0.0054, 0.0388 (unpaired t test). (G) Quantification of autolysosome numbers per cell in both WT and atm−/− cortical neurons. Error bars = SEM; n = 5 coverslips from 3 batches of neuronal cultures; p < 0.0001 (unpaired t test). (H) Representative blots of LC3B, LAMP1, SQSTM1 and GAPDH in lysates from WT and atm KO mouse cortex. (I) Quantification of the blots in panel H. Error bars = SEM; n = 3–6 animals each group; p values are as marked (unpaired t test). (J) Representative SQSTM1 (green) and MAP2 (red) immunostaining of WT cortical neurons treated with KU-60019 (1 µM) or DMSO for 24 h. (K) SQSTM1 puncta density per neuron shown in panel J. Error bars = SEM; n = 3 batches of cultures; p values are as marked (unpaired t test). (L) Representative blots of SQSTM1, LC3B, LAMP1, and TUBA in HT22 cells treated with 1 µM KU-60019 or DMSO for 24 h. (M) Quantification of the blots in panel L. Error bars = SEM; n = 4–6 batches of cultures; p values are as marked (unpaired t test)
ATM regulated lysosomal pH and enzyme activity
Next, we sought to look at whether this upregulated autophagic flux was associated with changes in lysosomal enzyme activity. CTSD, a major endolysosomal protease [Citation35,Citation36], showed increased enzymatic activity in the cerebral cortex of atm−/− mice ()) as well as in cultured cortical neurons silenced with Atm-shRNA ()). This increased enzymatic activity came in the absence of any increase in CTSD protein () and S4A). In addition to CTSD, CTSB, another endolysosomal protease, showed similar increases in activity in the cerebral cortex of atm−/− mice ()), also with no increase in protein levels () and S4B). We used the Bodipy-FL-pepstatin A reporter to track the location of CTSD and found it significantly more colocalized with LysoTracker-Red-labeled lysosomes in atm−/− than in wild type neurons ()). CTSD activity is highly sensitive to pH [Citation37]. Therefore, to search for the cause of the increased enzyme activity, we measured lysosome pH in atm−/− neurons with lysopHluorin-GFP (LysopH-GFP). We found atm−/− lysosomes to be much more acidic than wild type ()). All these changes were ATM kinase-dependent as CTSD activity also increased in KU-60019-treated wild type neurons ()), again in the absence of any change in CTSD protein levels () and S4B). As expected, lysosomal pH was also decreased in KU-60019-treated wild type neurons ()).
Figure 4. ATM regulated lysosomal enzyme activity and pH. (A) CTSD activity in mouse cortex lysate. Error bars = SEM; n = 6 animals each group; p = 0.0026 (unpaired t test). (B) CTSD activity in WT cortical neurons transfected with Atm- or scrambled shRNA. Error bars = SEM; n = 6 batches of neurons; p = 0.0241 (unpaired t test). (C) CTSD protein levels normalized to GAPDH. Error bars = SEM; n = 3 animals each group; p = 0.7761 (unpaired t test). (D) CTSB activity in mouse cortex lysate and purified lysosomes from mouse cortex. Error bars = SEM; n = 5 animals each group; p values are as marked (unpaired t test). (E) CTSB protein levels normalized to TUBA. Error bars = SEM; n = 3 animals each group; p = 0.5296 (unpaired t test). (F) Representative BODIPY-FL-pepstatin A stained CTSD (green) and LysoTracker-Red stained lysosomes (red) in WT and atm KO cortical neurons. (G) Colocalization rate of CTSD and lysosomes in WT and atm KO cortical neurons. Error bars = SEM; n = 10 coverslips from 3 batches of neuronal cultures; p = 0.0181 (unpaired t test). (H) WT and atm−/− cortical neurons transfected with LysopH-GFP. (I) Normalized to WT, the LysopH-GFP intensity of atm−/− cortical neurons. Error bars = SEM; n = 4 batches of neurons; p = 0.0009 (unpaired t test). (J) CTSD activity in WT cortical neurons treated with KU-60019 or DMSO for 24 h. Error bars = SEM; n = 9 readings from 3 batches of cells; p = 0.0258 (unpaired t test). (K) CTSD protein levels normalized to GAPDH in WT cortical neurons treated with KU-60019 (1 µM) or DMSO for 24 h. Error bars = SEM; n = 3 batches of cultures; p = 0.3744 (unpaired t test). (L) LysopH-GFP transfected WT cortical neurons treated with KU-60019 (1 µM) or DMSO for 24 h. (M) Normalized to DMSO control, the lysopH-GFP intensity of KU-treated cortical neurons. Error bars = SEM; n = 6 batches of cultures; p = 0.0175 (unpaired t test). (N) Predicted ATM phosphorylation sites on ATP6V1A using NetPhos 3.1. (O) ATM immunoprecipitation (ATM-IP) from WT mouse cortical lysates blotted with ATP6V1A or p-[S/T]Q (ATM substrate)
![Figure 4. ATM regulated lysosomal enzyme activity and pH. (A) CTSD activity in mouse cortex lysate. Error bars = SEM; n = 6 animals each group; p = 0.0026 (unpaired t test). (B) CTSD activity in WT cortical neurons transfected with Atm- or scrambled shRNA. Error bars = SEM; n = 6 batches of neurons; p = 0.0241 (unpaired t test). (C) CTSD protein levels normalized to GAPDH. Error bars = SEM; n = 3 animals each group; p = 0.7761 (unpaired t test). (D) CTSB activity in mouse cortex lysate and purified lysosomes from mouse cortex. Error bars = SEM; n = 5 animals each group; p values are as marked (unpaired t test). (E) CTSB protein levels normalized to TUBA. Error bars = SEM; n = 3 animals each group; p = 0.5296 (unpaired t test). (F) Representative BODIPY-FL-pepstatin A stained CTSD (green) and LysoTracker-Red stained lysosomes (red) in WT and atm KO cortical neurons. (G) Colocalization rate of CTSD and lysosomes in WT and atm KO cortical neurons. Error bars = SEM; n = 10 coverslips from 3 batches of neuronal cultures; p = 0.0181 (unpaired t test). (H) WT and atm−/− cortical neurons transfected with LysopH-GFP. (I) Normalized to WT, the LysopH-GFP intensity of atm−/− cortical neurons. Error bars = SEM; n = 4 batches of neurons; p = 0.0009 (unpaired t test). (J) CTSD activity in WT cortical neurons treated with KU-60019 or DMSO for 24 h. Error bars = SEM; n = 9 readings from 3 batches of cells; p = 0.0258 (unpaired t test). (K) CTSD protein levels normalized to GAPDH in WT cortical neurons treated with KU-60019 (1 µM) or DMSO for 24 h. Error bars = SEM; n = 3 batches of cultures; p = 0.3744 (unpaired t test). (L) LysopH-GFP transfected WT cortical neurons treated with KU-60019 (1 µM) or DMSO for 24 h. (M) Normalized to DMSO control, the lysopH-GFP intensity of KU-treated cortical neurons. Error bars = SEM; n = 6 batches of cultures; p = 0.0175 (unpaired t test). (N) Predicted ATM phosphorylation sites on ATP6V1A using NetPhos 3.1. (O) ATM immunoprecipitation (ATM-IP) from WT mouse cortical lysates blotted with ATP6V1A or p-[S/T]Q (ATM substrate)](/cms/asset/8e1b7249-7877-491a-be0d-be10c76cf77e/kaup_a_1805860_f0004_oc.jpg)
We postulated that the lower pH in the atm−/− cortical neurons was the result of changes in the lysosomal proton pump ATP6V1A (ATPase, H+ transporting V1, lysosomal subunit A), a membrane protein that uses its ATPase activity to acidify the lysosome. We had previously identified ATP6V1A to be physically associated with ATM [Citation4] and were encouraged to find that Ser111 and Ser260 of ATP6V1A were predicted as ATM phosphorylation sites ()). We were unable to repeat the pulldown of ATP6V1A with ATM ()), suggesting that the physical interaction of the two proteins is weak and context-dependent. Despite the lack of direct physical interaction, however, ATP6V1A proved to be a possible ATM substrate ()). Indeed, we found a robust phospho-[S/T]Q signal in ATP6V1A immunoprecipitates ()).
Abnormal lysosome motility in ATM-deficient cells
Basal autophagy is hyperactivated in A-T cells [Citation29,Citation30], making them more vulnerable to neurodegenerative changes [Citation38]. Based on the altered distribution of SQSTM1 puncta when ATM activity was reduced, we hypothesized that autophagosome-lysosome trafficking was a critical part of the function of ATM. To test this hypothesis, we stained lysosomes in live cortical neurons with LysoTracker-Red. In wild type cortical neurons, lysosomes were uniformly distributed, while they accumulated in a perinuclear location in atm−/− cells ()), consistent with earlier reports of increased lysosome numbers in ATM-deficient mouse neuronal cell bodies [Citation7]. Using LysoTracker-Red, we analyzed lysosome trafficking in axons of both wild-type and atm−/− cortical neurons ()). There was an increased lysosome density both in cell bodies and axons of atm−/− neurons ()). Kinetic analysis revealed that lysosomes in atm−/− neurons were approximately 50% more prone to undergo retrograde transport than those in wild type cells. ()). There was also a decrease in anterograde transport; only about 2% of the lysosomes in atm−/− neurons were undergoing anterograde transport, which was about a quarter of the percentage found in wild type axons ()). The speed of retrograde transport was slightly faster in atm−/− neurons, although the difference did not reach statistical significance (Fig. S5A). The percentages of stationary or bidirectional lysosomes were similar (Fig. S5B). It was most likely the enhanced retrograde transport of lysosomes in atm−/− neurons that accounted for their perinuclear accumulation.
Figure 5. Lysosome trafficking was abnormal in atm−/− cells. (A) LysoTracker-Red (red) staining of WT and atm−/− (atm KO) cortical neurons transfected with pAAV-SYN-EGFP (green, Addgene, 50,465; Bryan Roth). (B) Time-lapse images of transfected WT and atm−/− cortical neuron neurites. (C) Quantification of total lysosome numbers (left), the percentage of lysosomes moving in retrograde (middle) and anterograde (right) directions. Error bars = SEM; n = 4 batches of cultures; p values are as marked (unpaired t test). (D) Models of the predicted atomic interactions between ATM (white, PDB ID: 5NP1) and DYNLL1 (rainbow, PDB ID: 3RJS), shown with intermolecular hydrogen bonds (pink dashed lines). (E) Representative blots of DYNLL1 and p-[S/T]Q (ATM substrate) with ATM and DYNLL1 immunoprecipitates in WT cortex lysates. (F) Western blots of DYNLL1 (dynein light chain1), DNAH (dynein heavy chain), DNAIC (dynein intermediate chain) and LAMP1 in isolated lysosomes from WT and atm−/− mouse cortical lysates. (G) DYNLL1, DNAH (dynein heavy chain), DNAIC (dynein intermediate chain) protein levels normalized to LAMP1 in isolated lysosomes from both WT and atm KO cortex. Error bars = SEM; n = 4 batches of cultures; p values are as marked (unpaired t test)
![Figure 5. Lysosome trafficking was abnormal in atm−/− cells. (A) LysoTracker-Red (red) staining of WT and atm−/− (atm KO) cortical neurons transfected with pAAV-SYN-EGFP (green, Addgene, 50,465; Bryan Roth). (B) Time-lapse images of transfected WT and atm−/− cortical neuron neurites. (C) Quantification of total lysosome numbers (left), the percentage of lysosomes moving in retrograde (middle) and anterograde (right) directions. Error bars = SEM; n = 4 batches of cultures; p values are as marked (unpaired t test). (D) Models of the predicted atomic interactions between ATM (white, PDB ID: 5NP1) and DYNLL1 (rainbow, PDB ID: 3RJS), shown with intermolecular hydrogen bonds (pink dashed lines). (E) Representative blots of DYNLL1 and p-[S/T]Q (ATM substrate) with ATM and DYNLL1 immunoprecipitates in WT cortex lysates. (F) Western blots of DYNLL1 (dynein light chain1), DNAH (dynein heavy chain), DNAIC (dynein intermediate chain) and LAMP1 in isolated lysosomes from WT and atm−/− mouse cortical lysates. (G) DYNLL1, DNAH (dynein heavy chain), DNAIC (dynein intermediate chain) protein levels normalized to LAMP1 in isolated lysosomes from both WT and atm KO cortex. Error bars = SEM; n = 4 batches of cultures; p values are as marked (unpaired t test)](/cms/asset/5953ac3e-63c4-477e-8903-88fb4592971b/kaup_a_1805860_f0005_oc.jpg)
To search for the mechanism by which ATM deficiency led to these changes, we returned to our published dataset of proteins pulled down by ATM from wild type but not atm−/− mouse brains [Citation4]. We identified DYNLL1 (the light chain1 of dynein), as a potential target for ATM. Dynein is responsible for retrograde organelle trafficking [Citation39]. By in silico analysis, DYNLL1 is predicted to physically interact with ATM ()) with a first ranked cluster conformation score of −950.2 kCal/mol. Thirteen intermolecular hydrogen bonds between DYNLL1 and ATM were predicted to be formed to stabilize the interaction () and S5C). We confirmed a strong physical association between DYNLL1 and ATM ()), but were unable to detect a signal when we blotted the DYNLL1 blots with p-[S/T]Q antibody () and ), suggesting that the physical ATM-DYNLL1 association is not a kinase-substrate interaction. We then isolated lysosomes from both wild type and mutant mouse brains and found that those from atm−/− mouse cortex contained more DYNLL1, dynein heavy chain and dynein intermediate chain than wild type lysosomes ()). LAMP1 served as an internal control ()). The accumulation of lysosomal dynein in atm−/− mouse brains suggested that ATM inhibited axonal retrograde transport through dynein motor proteins.
Table 1. Antibodies used in this study
SLC2A4 in atm−/− neurons was sorted to lysosomes
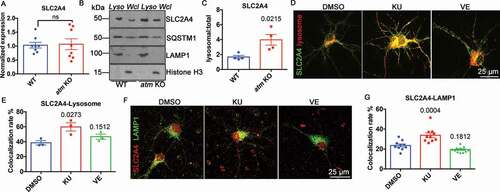
To determine whether the upregulated autophagy-lysosomal pathway affected other key proteins, we assessed the behavior of SLC2A4, a glucose transporter [Citation40] whose cell surface levels are INS (insulin) sensitive. It was found that ATM-deficiency leads to oxidative stress [Citation41,Citation42], and such stress diverts SLC2A4 to lysosomes for degradation [Citation43]. While overall, the levels of Slc2a4 mRNA ()) and protein ()) were unchanged in atm−/− mouse cortex, SLC2A4 levels in isolated lysosomes increased by more than 2-fold ()). The increased CTSD and CTSB activity confirmed the effective isolation of the lysosomes in the preparation (Fig. S6 and )). To determine whether the altered localization of SLC2A4 was activity-dependent, wild type cortical neurons were transfected with GFP-tagged SLC2A4 (N1-Slc2a4-GFP) and a mCherry-tagged lysosomal marker (mCherry-Lysosome-20). After 24 h, the transfected cultures were treated with either KU-60019 or VE-822 for 48 h. We found that ATM, but not ATR, inhibition increased the amount of SLC2A4 associated with lysosomes ()). In addition, KU-60019, but not VE-822, caused a significant increase in the colocalization rate of SLC2A4 and the lysosomal protein, LAMP1 ()). Consistent with this finding, in atm−/− neurons ()), both exogenous mCherry-Lysosome-20 ()) and endogenous LAMP1 ()) adopted a perinuclear pattern in KU-60019-treated cells while the lysosomes of control, DMSO-treated, wild type neurons showed a more evenly dispersed pattern ()). These findings suggested that ATM kinase activity contributed to the maintenance of glucose metabolism by preventing SLC2A4 from being sorted to the lysosomes for degradation.
Figure 6. SLC2A4 trafficking switched to lysosomes in the absence of ATM. (A) Normalized Slc2a4 mRNA expression level in WT and atm−/− (atm KO) mouse cortex. Error bars = SEM; n = 8 animals each group; ns, p = 0.8746 (unpaired t test). (B) Representative SLC2A4, SQSTM1, LAMP1 and Histone H3 blots in isolated lysosomes (Lyso) or whole-cell lysates (Wcl) from WT or atm−/− mouse cortex lysates. (C) The ratio of lysosomal SLC2A4 to total SLC2A4 in WT and atm−/− mouse cortex. Error bars = SEM; n = 3–4 animals each group; p = 0.0215 (unpaired t test). (D) Representative images of WT cortical neurons transfected with N1-Slc2a4-GFP and mCherry-Lysosome-20 treated with DMSO, KU-60019 (1 µM) or VE-822 (0.2 µM) for 24 h. (E) Colocalization rate of GFP-SLC2A4 and the mCherry-lysosome. Error bars = SEM; n = 3 batches of cultures; p values are as indicated (unpaired t test). (F) Representative co-immunostaining images of SLC2A4 (red) and LAMP1 (green) in WT cortical neurons treated with DMSO, KU-60019 (1 µM) or VE-822 (0.2 µM) for 24 h. (G) Colocalization rate of endogenous SLC2A4 and LAMP1. Error bars = SEM; n = 10–11 coverslips from 3 batches of cultures; p values are as indicated (unpaired t test)
ATM regulated SLC2A4 translocation to plasma membrane
The misrouting of SLC2A4 impedes the cells’ response to INS. Live imaging of EGFP-tagged SLC2A4 showed that the 10 min of INS stimulation in wild type neurons triggered SLC2A4 translocation to plasma membrane, but not in atm−/− neurons () and S7A). This INS response was ATM kinase-dependent as the pretreatment of wild type neurons with KU-60019 for 24 h blocked INS-induced SLC2A4 translocation while inhibition of ATR activity with VE-822 was ineffective ()). To test whether hyperactivation of ATM kinase activity would have the reverse effect, we used etoposide to induce DNA damage and thus activate ATM. Even without INS, etoposide-induced ATM activation caused an accumulation of SLC2A4 on the plasma membrane ()). Together, the data suggested that ATM kinase activity was both sufficient and necessary to induce SLC2A4 translocation to the plasma membrane in neurons.
Figure 7. Atm−/− cells showed abnormal SLC2A4 translocation to plasma membrane and deficient glucose uptake. (A) GFP-SLC2A4 and mCherry-lysosome were co-transfected into wild type (WT) and atm KO cortical neurons before INS treatment. (B) Changes in EGFP-SLC2A4 intensity in WT and atm KO during 10 min of INS treatment (normalized to the start point intensity). (C) Representative immunostaining images of clathrin (red) and surface SLC2A4 (green) in cerebellar granule neurons (CGN) treated with KU-60019 (KU, 1 µM), VE-822 (VE, 0.2 µM) or etopside (Etop, 1 µM) for 24 h with or without INS exposure (10 µM, 10 min). (D) The colocalization rate of surface SLC2A4 and clathrin in CGN cultures pretreated with DMSO, KU, VE or Etop for 24 h with/without INS (10 µM, 10 min) exposure. (E) Representative 2-NBDG uptake images of WT or atm KO CGN. (F) 2-NBDG intensity of WT and atm KO CGN. Error bars = SEM; n = 10 coverslips from 3 batches of cultures; p < 0.0001 (unpaired t test). (G) Representative 2-NBDG uptake images of cultured CN. (H) 2-NBDG intensity of WT and atm KO CN. Error bars = SEM; n = 22–39 coverslips from 3 batches of cultures; p < 0.0001 (unpaired t test). (I) Representative 2-NBDG uptake images of WT CN treated with KU (1 μM) for 24 h. (J) 2-NBDG intensity of WT CN treated with KU. Error bars = SEM; n = 8–9 coverslips from 3 batches of cultures; p values as shown (unpaired t test)
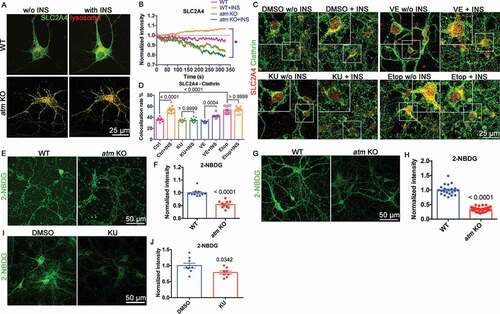
There were important functional consequences of these changes in SLC2A4 trafficking. Using 2-NBDG, a fluorescent glucose analog, to monitor the glucose uptake in cerebellar granule neurons (CGNs) ()), neocortical neurons (CNs) ()), and human fibroblasts (Fig. S7B and S7C), we found that all ATM-deficient cells showed reduced levels of glucose uptake. A similar decrease in glucose uptake was found when we inhibited ATM kinase activity in wild type (WT) cultured mouse cortical neurons with KU-60019 ()). In summary, the data suggested a model in which ATM deficiency or kinase inhibition switched SLC2A4 trafficking to the lysosome instead of the plasma membrane in the presence of INS with the predicted decrease in the ability of the cells to take up exogenous glucose.
Discussion
In this study, we have shown that ATM is degraded by autophagy while ATR is degraded through the UPS. This complementarity in the fate of ATM and ATR is reminiscent of a similar relationship in the regulation of glutamatergic and GABAergic vesicle trafficking [Citation4] as well as in their double-strand and single-strand focus during the DNA damage response [Citation2]. The meaning of these mutually supportive roles remains unclear, however, the persistent finding that the ATM and ATR kinases work together in connected, but non-overlapping roles suggest a deeper set of rules may be at play.
The relationship between ATM and autophagy, while previously recognized, is underscored by our findings. When autophagy is inhibited, ATM protein levels increase and when ATM is inhibited, autophagy goes up [Citation29,Citation30]. Thus ATM activity can both dial up or dial down autophagy. Intriguingly, from the standpoint of complementarity, while basal autophagy (the ATM degradation pathway) is upregulated in A-T cells [Citation28], the UPS (the ATR degradation pathway) is downregulated [Citation30], potentially explaining the higher level of ATR protein in ATM-deficient cells [Citation4].
Lysosomal trafficking, while related to autophagy, appears to be an independent target of this multi-functional kinase. Similar to lysosomal storage diseases, lysosomes accumulate abnormally in the perinuclear region of atm−/− cells. Lysosome motility and positioning are regulated by both the (cholesterol-RAB7A-RILP [Rab interacting lysosomal protein]-OSBPL1A [oxysterol binding protein like 1A]) pathway and by the PtdIns(3,5)P2-MCOLN1 (mucolipin 1)-ALG2 (asparagine-linked glycosylation 2[alpha-1,3-mannosyltransferase])-dynein pathway [Citation14]. Our finding of the physical interaction between ATM and DYNLL1 suggests that ATM might be involved in the second pathway. We propose that the binding of ATM to DYNLL1 blocks the interaction of dynein with its lysosomal cargo thus inhibiting lysosome retrograde transport (). We note that ATM-deficient cells also have an abnormal accumulation of membrane cholesterol [Citation44,Citation45], which makes it possible that the first pathway might control autophagosome and lysosome transport and fusion [Citation46].
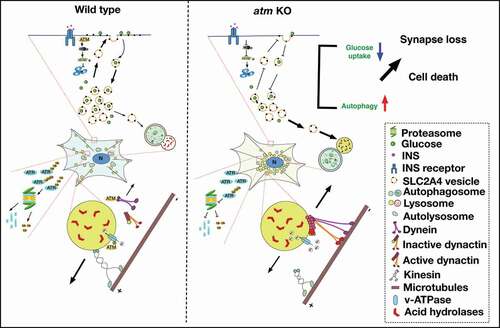
Figure 8. Diagram of the ATM working model in the autophagy-lysosomal pathway. Wild type neurons. ATM was normally degraded by autophagy while ATR was digested through the ubiquitin-proteasome pathway. The crosstalk between these two pathways maintained the balance of ATM and ATR protein levels. The binding of ATM to DYNLL1 inhibited the lysosome from being captured by the retrograde transport machinery. In addition to this control of lysosome localization, ATM also regulated lysosomal pH by phosphorylating the v-ATPase, ATP6V1A. INS stimulated SLC2A4 vesicles to translocate to the plasma membrane with only a few moving to the lysosome for degradation. atm−/− neurons. The upregulation of autophagy and the impaired ubiquitination-proteasome degradation in atm−/− (atm KO) neurons led to increased ATR protein levels. Reduced ATM protein tipped the balance of anterograde and retrograde transport of lysosomes in favor of the latter, inhibited autophagosome-lysosome fusion, and hampered the maintenance of lysosomal pH. Loss of ATM activity led to reduced SLC2A4 presence on the plasma membrane and enhanced degradation in the lysosome
In atm−/− neurons, the behavior of SQSTM1 is symptomatic of cells with increased autophagic flux. The total protein level of SQSTM1 decreases and its distribution changes. Coupled with the enhanced retrograde transport, we observed, it would appear that autophagosomes in the neuronal dendrite are depleted, increasing the neuron’s vulnerability to synapse loss and death. Intriguingly, rapamycin together with serum-free medium significantly induces autophagy in wildtype neurons [Citation47–49], which is indicated by the increased LC3B-II to LC3B-I ratio, the decreased SQSTM1 protein levels as well as the increased LAMP1 protein levels ()). Consistently, the induced autophagy causes synapse loss and neuronal death (), which is reminiscent of the synaptic defects and lower viability of cultured ATM-deficient neurons [Citation4–6,Citation50], and suggests that the absence of ATM is detrimental in part because of the upregulation of autophagy. The acidification of the lysosome and consistent with this idea, mutations in human ATP6V1A cause developmental encephalopathy with epilepsy [Citation51].
ATM is reported to play multiple important roles in glucose metabolism and is involved in INS signaling through the regulation of protein synthesis [Citation52,Citation53] via phosphorylation of EIF4EBP1/4E-BP1 (eukaryotic translation initiation factor 4E binding protein 1) and MAPK8/JNK1 (mitogen-activated protein kinase 8) [Citation54]. INS stimulates glucose uptake by controlling the translocation of its transporters to the plasma membrane and by promoting their accumulation in clathrin-based endocytic structures on the plasma membrane [Citation55]. The SLC2A4 isoform is expressed in neurons often at high levels [Citation40], but the regulation of its trafficking by ATM is found in many cell types [Citation8]. These observations reinforce each other and suggest that ATM regulates glucose uptake through SLC2A4 in a wide variety of cell types and this regulation occurs through a lysosomal trafficking mechanism. The regulation of SLC2A4 by ATM exists in a complex web of cellular interactions. Oxidative stress shifts glucose metabolism from glycolysis to other pathways [Citation42,Citation56]. Further, our lab has recently shown that atm−/− cells have reduced levels of ATP, increased oxidative stress and impaired mitochondrial function [Citation42]. Thus not only glucose uptake but also its cellular processing is altered in the absence of ATM. Altogether, the combination of reduced glycolysis, impaired mitochondrial function and abnormal INS signaling resulting in defective glucose metabolism adds complexity to the phenotype of glucose intolerance in A-T patients and their susceptibility to metabolic syndrome [Citation57].
In conclusion, in addition to its nuclear function in DNA damage repair, ATM is also involved in a variety of cytoplasmic processes, including synaptic vesicle trafficking, lysosome motility, autophagy and glucose utilization. All of these combine to influence cellular metabolism, synaptic density and cell viability and thus contribute to the pleiotropic phenotypes of A-T (). Overall, our study demonstrates a deep involvement of ATM in the regulation of multiple pathways and provides novel insights into the pathogenesis of multiple nervous system diseases and the potential promising therapeutic targets.
Materials and methods
Chemicals and molecular biologicals
KU-60019 (Selleck Chemicals Llc, S1570); VE-822 (Selleck Chemicals Llc, S7102); Bodipy-FL-pepstatin A (Thermo Fisher Scientific, P12271); LysoTracker-Red DND-99 (Life Technologies, L7528); 2-NBDG (Life Technologies, N13195) and Dynabeads Protein G (Life Technologies, 10004D; 30 mg/ml); etoposide (Sigma-Aldrich, E1383), rapamycin (Sigma-Aldrich, R8781); 3-methyladenine (Sigma-Aldrich, M9281); bafilomycin A1 (Sigma-Aldrich, SML1661); chloroquine (Sigma-Aldrich, C6628); INS (insulin; Sigma-Aldrich, I9278); DMSO (Sigma-Aldrich, D2650); MG132 (Santa Cruz Biotechnology, sc-201,270); Cathepsin D Activity Assay Kit (BioVision, K143-100); Cathepsin B Acitivty Assay Kit (BioVision, K140-100); Lysosome Isolation Kit (BioVision, K235-50); Atg5 siRNA (Cell Signaling Technology, 6345); pMRX-IP-GFP-LC3-RFP-LC3ΔG (Addgene, 84,572; Noboru Mizushima); mCherry-Lysosome-20 (Addgene, 55,073; Michael Davidson); pCMV-lyso-pHluorin (Addgene, 70,113; Christian Rosenmund); pAAV-SYN-EGFP (Addgene, 50,465; Bryan Roth); N1-SLC2A4/GLUT4-GFP was a gift from Dr. Tao XU (Institute of Biophysics, Chinese Academy of Sciences); Atm and Atr primers (Tech Dragon Limited).
Animals
The original breeding stock for the C57BL/6 J and ATM mutant line Bal (B6;129S4-Atmtm1Bal/J), were obtained from Jackson Laboratory. All mice used in this study were maintained and bred in the Animal and Plant Care Facility (APCF) of the Hong Kong University of Science and Technology (HKUST). The protocol used for genotyping the mice was the same as that described in our previous study [Citation4]. For all homozygous atm KO mice (atm−/−), C57BL/6 J (wild type) animals were used as controls. All animal protocols were approved by the Animal Ethics Committee at HKUST, and animal care was in accordance with both institutional and Hong Kong guidelines that include government legislation, Hong Kong’s Code of Practice for Care and Use of Animals for Experimental Purposes, as well as International Guides and Codes of Practice on the Care and Use of Animals in Research.
Primary cortical neuronal culture
Cultures of mouse cortical neurons were prepared from embryonic day 16.5 (E16.5) C57BL/6 J (WT) or BAL (Atmtm1Bal/Atmtm1Bal) mouse embryos as described previously [Citation58–60]. Cortices were collected in ice-cold PBS (Thermo Fisher Scientific, 10,010,023) with 5.6 mM glucose (Sigma-Aldrich, G8270), then incubated in 1X trypsin (Thermo Fisher Scientific, 25,300,054) solution for 10–12 min at 37°C. DMEM medium (Thermo Fisher Scientific, 11,965,092) with 10% fetal bovine serum (FBS; Thermo Fisher Scientific, 26,140,079) was used to inactivate the trypsin. The cells were then placed into Neurobasal medium (Thermo Fisher Scientific, 21,103,049), supplemented with 2% B27 (Thermo Fisher Scientific, 17,504,044), 1% Glutamax (Thermo Fisher Scientific, 35,050,079), and 1% penicillin-streptomycin (Thermo Fisher Scientific, 15,140,163; 10,000 U/mL) at a density of 8,500 cells/cm2 on a poly-L-lysine (Sigma, P2636) -coated surface and cultured at 37°C in a humidified incubator in an atmosphere containing 5% CO2 and 95% air.
Primary cerebellar granule neuron culture
Cultures of mouse cerebellar granule neurons were prepared from post-natal day 5 (P5) C57BL/6 J (WT) or BAL (atm KO) mice as described previously [Citation61]. Cerebella were collected in ice-cold PBS/glucose solution, then incubated in papain solution from Papain Dissociation System (Worthington Biochemical, LK 003150) for 20 min at 37°C. FBS (10%) was used to inactivate the papain. The solution was then triturated and centrifuged at 200 x g for 5 min at room temperature, and the loose pellet resuspended. The resulting suspension was carefully layered on top of a discontinuous sucrose density gradient (Worthington Biochemical, LK 003150), followed by centrifugation at 70 x g for 6 min. The cells in the pellet were resuspended in 10% FBS (Thermo Fisher Scientific, 26,140,079) and 90% Neurobasal-A medium (Thermo Fisher Scientific, 10,888,022) and filtered through a cell strainer (FALCON, 352,350; pore size 70 μm). The filtrate containing the granule cells was then centrifuged at 200 x g for 5 min and placed into Neurobasal-A, supplemented with 2% B27 (Thermo Fisher Scientific, 17,504,044), 1% Glutamax (Thermo Fisher Scientific, 35,050,079), and 1% penicillin-streptomycin (Thermo Fisher Scientific, 15,140,163; 10,000 U/mL) at a density of 90,000 cells/cm2 on a poly-L-lysine (Sigma, P2636) coated surface. The cells were then cultured at 37°C in a humidified incubator in an atmosphere of 5% CO2 and 95% air.
Cell culture and transfection
Human fibroblasts (Coriell Institute, GM03397, GM03440) [Citation62] and HT22 cells (Sigma-Aldrich, SCC129) were cultured in DMEM (Thermo Fisher Scientific, 11,965,092) with 10% FBS (Thermo Fisher Scientific, 26,140,079) plus penicillin-streptomycin (Thermo Fisher Scientific, 15,140,163; 10,000 U/mL). Primary neurons were cultured as above. DNA constructs were transfected at 7 DIV using Lipofectamine 2000 (Thermo Fisher Scientific, 11,668,019) or Lipofectamine LTX with Plus Reagent (Thermo Fisher Scientific, 15,338,100). 4 to 6 h after transfection, fresh culture medium was used to replace the transfection medium, and the cells were incubated for another 48 h (HT22) or longer (primary neurons; 5–8 d) to allow recovery and construct expression.
Immunoprecipitation, SDS/PAGE and western blot analysis
Cultured cells or isolated brain tissues were homogenized in ice-cold RIPA buffer (EMD Millipore, 20–188) with 1X PhosSTOP phosphatase inhibitor (Roche Applied Science, 04906837001) and 1X complete protease inhibitor (Roche Applied Science, 04693159001). The homogenates were then centrifuged for 20 min at 21,000 x g to remove debris. The protein concentration of the supernatant was determined by the Bradford assay (Bio-Rad Laboratories, 5,000,006). For immunoprecipitation, a volume of lysate containing 1 mg of total protein was incubated for 30 min with control IgG (Santa Cruz Biotechnology, sc-66,931), precleared with 50 μl of Dynabeads Protein G (Invitrogen, 10004D), and incubated overnight at 4°C with primary antibodies. Beads, along with their bound proteins, were collected with DynaMag-2 magnets (Thermo Fisher Scientific, 12321D) and rinsed three times, followed by elution in 50 μl of 4X bromophenol blue dye (Sigma-Aldrich, B5525) with beta-mercaptoethanol (Sigma-Aldrich, V000590) as well as 150 μl of RIPA buffer containing 1X complete protease inhibitor and 1X PhosSTOP phosphatase inhibitor. The eluted proteins were subjected to 5–12% SDS/PAGE. For western blot analysis, protein sample lysate was run on SDS/PAGE and transferred to Immuno-Blot PVDF membranes (Bio-Rad Laboratories, 1,620,177). For the proteins to be blotted, we loaded 20 µl of a 1 µg/µl protein solution. For the loading controls, either GAPDH (glyceraldehyde-3-phosphate dehydrogenase) or TUBA (tubulin, alpha, detects total protein), we loaded 10 µl of a 1 µg/µl solution. According to the literature, quantification of protein load is expected to be linear from 10–40 µg total protein in a staining-free gel investigation using 5 different conditions [Citation63]. The manufacturer of the GAPDH antibody (Abcam, ab8245; ) recommends 10 µg as a suggested loading amount, which is within their tested linear range. Other literature references cite 10 µg of total protein load as within the linear range for tubulin [Citation64]. After blocking, membranes were probed with primary antibodies and visualized with Super Signal West Pico (Thermo Fisher Scientific, 34,580), Dura (Thermo Fisher Scientific, 34,075), or Femto (Thermo Fisher Scientific, 34,095) chemiluminescent substrate. For each blot, we used multiple exposures, always choosing the exposure that gave a strong signal, but one that was below the maximum intensity seen with longer exposure times. For gels with more than one band, we chose our exposure time based on the optimum density of the band of interest.
Immunocytochemistry
Cells on coverslips were fixed in 4% paraformaldehyde (Sigma-Aldrich, 158,127) for 15 min, rinsed three times with PBS (Thermo Fisher Scientific, 10,010,023), and incubated in 5% donkey serum (Sigma-Aldrich, D9663) with 0.3% Triton X-100 (Sigma-Aldrich, 93,443) for 1 h at room temperature. After blocking, primary antibodies were applied in blocking buffer (5% donkey serum with 0.3% Triton X-100), and coverslips were incubated at 4°C overnight. Coverslips were then rinsed three times with PBS and incubated with secondary antibodies (Alexa Fluor 488: Thermo Fisher Scientific, A32766, A32790; Alexa Fluor 555: Thermo Fisher Scientific, A32773, A32794; Alexa Fluor 647: Thermo Fisher Scientific, A31573, A31571) at room temperature for 1 h. Coverslips were rinsed five times with PBS, and then incubated with DAPI (Thermo Fisher Scientific, D1306) in PBS for 5 min, following by once PBS rinsing. Finally, stained coverslips were mounted with Hydromount (National Diagnostics, HS-106) for confocal imaging.
CTSD/CTSB activity assay
Cells were lysed in 50 μl of chilled CTSD/CTSB cell lysis buffer (BioVision, K143/K140) and centrifuged for 5 min at 21,000 × g to remove large debris. Increasing volumes (5–50 μl) of the clear supernatant was added into individual wells of a 96-well plate. The total volume in each well was then brought to 50 μl with CTSD/B cell lysis buffer. Each well then received 50 µl of a Master Assay Mix (BioVision, K143/K140) containing a 1:25 dilution of the preferred CTSD substrate sequence GKPILFFRLK(Dnp)-D-R-NH2) labeled with MCA or CTSB substrate sequence RR labeled with AFC (amino-4-trifluoromethyl coumarin) in reaction buffer. The plates were then incubated at 37°C for 1–2 h. Substrate cleavage was determined by reading the fluorescence generated in each will using a fluorometer equipped with 328-nm excitation/460-nm emission filter (CTSD) and 400-nm excitation/505-nm emission filter (CTSB).
Bodipy-FL-pepstatin A and LysoTracker-Red co-staining
To label CTSD and lysosomes, the cortical neuron cultures were incubated with 1 μM Bodipy-FL-pepstatin A (Thermo Fisher Scientific, P12271) and 1 μM LysoTracker-Red (Life Technologies, L7528) in Neurobasal medium (Thermo Fisher Scientific, 21,103,049) for 30 min at 37°C. Cultures were then rinsed twice with fresh Neurobasal medium. For image taking, to reduce the fluorescent background, Neurobasal medium was replaced with pre-warmed sterile 1X HBS (HEPES [4-{2-hydroxyethyl}-1-piperazineethanesulfonic acid (Sigma-Aldrich, H4034)]-buffered saline) containing 119 mM NaCl, 5 mM KCl, 2 mM CaCl2, 2 mM MgCl2, 30 mM glucose, and 10 mM HEPES, at pH 7.2.
Live confocal imaging
To track the movement of lysosomes, cortical neurons were incubated with 1 μM LysoTracker-Red (Life Technologies, L7528) in Neurobasal medium (Thermo Fisher Scientific, 21,103,049) for 30 min at 37°C. Cultures were then rinsed twice with fresh Neurobasal medium. To reduce the fluorescent background, Neurobasal medium was replaced with pre-warmed sterile 1X HBS containing 119 mM NaCl, 5 mM KCl, 2 mM CaCl2, 2 mM MgCl2, 30 mM glucose, 10 mM HEPES, pH 7.2. Images were captured at 1 Hz on a confocal microscope (Leica, SP8; Germany) over a period of 100 seconds.
The track the position of SLC2A4 protein, cortical neurons were transfected with N1-Slc2a4-GFP and mCherry-Lysosome-20. After 24 h, 10 uM INS (Sigma-Aldrich, I9278) was applied in Neurobasal medium for 10 min. A total of 500 fluorescent confocal images of the live cells were captured at ~1.5 Hz both before and after INS treatment.
Lysosome isolation
Brain tissue plus lysosome isolation buffer (BioVision, K235; Lysosome Purification Kit) were mixed in a 1:8 ratio (w:v) in a precooled glass homogenizer. Eight to twelve strokes were then applied while the homogenizer was maintained on ice. After transfer of the solution to a fresh tube, 500 μl of lysosome enrichment buffer (BioVision, K235; Lysosome Purification Kit) was added, and the tube inverted several times to mix. The mixture was then centrifuged at 500 x g for 10 min at 4°C. The supernatant was collected and kept on ice until it was carefully overlaid on top of a 5-step density gradient (BioVision, K235; Lysosome Purification Kit). The gradient was then centrifuged in a refrigerated ultracentrifuge for 2 h at 145,000 x g. The lysosomes formed a visible band in the top 1/10th of the gradient volume, which was carefully withdrawn using an extra-long pipette tip (~0.2 ml). To further purify the enriched lysosome preparation, 2 volumes of PBS (Thermo Fisher Scientific, 10,010,023) were added, and the solution vortexed gently. The suspension was then centrifuged at 4°C for 30 min at 18,000 x g. The supernatant containing debris was discarded, leaving only the pellet of purified lysosomes that were resuspended in PBS. Protein concentration was determined using Bradford method. Aliquots were either used immediately or snap-frozen in liquid nitrogen and stored at −80°C until needed.
Glucose uptake assay
Neuron cultures were incubated in Krebs-Ringer bicarbonate buffer (Sigma-Aldrich, K4002) for 1 h to force the neurons to deplete all their endogenous stores of glucose. A 2-NBDG (Life Technologies, N13195) working solution (100 μM) was prepared in Krebs-Ringer bicarbonate buffer and applied to neurons at 37°C for 30 min. Free 2-NBDG dye was then rinsed away, and the medium changed to dye-free Krebs-Ringer bicarbonate buffer. Images were taken immediately by confocal microscopy (Leica, SP8; Germany).
SLC2A4 surface staining
Coverslips of unfixed cultures were rinsed once with ice-cold PBS (Thermo Fisher Scientific, 10,010,023) and incubated with 5% donkey serum (Sigma-Aldrich, D9663) in PBS for 1 h on ice to block nonspecific binding. Next, SLC2A4 antibody () in blocking buffer was applied for 1 h on ice. Coverslips were then rinsed three times with PBS and fixed with 4% paraformaldehyde (Sigma-Aldrich, 158,127) for 15 min, following by a single PBS rinse. Then coverslips were incubated with primary antibodies against clathrin () in 5% donkey serum/0.3% Triton X-100 (Sigma-Aldrich, 93,443) in PBS at 4°C for overnight incubation. The next day, coverslips were rinsed three times with PBS then incubated with secondary antibodies (Alexa Fluor 488: Thermo Fisher Scientific, A32766, A32790; Alexa Fluor 555: Thermo Fisher Scientific, A32773, A32794; Alexa Fluor 647: Thermo Fisher Scientific, A31573, A31571) at room temperature for 1 h followed by five additional PBS rinses. Finally, DAPI (Thermo Fisher Scientific, D1306) counterstaining was applied. After one additional PBS rinse, coverslips were mounted with Hydromount (National Diagnostics, HS-106) for confocal imaging.
Quantitative RT-PCR analysis
Total RNA was isolated from cortex of 1-month-old mice using RNeasy Mini Kit (QIAGEN, 74,106) according to the manufacturer’s instructions. Reverse transcription of equal amounts of total RNA was carried out using a RT-PCR reaction kit (Thermo Fisher Scientific, K1632). Quantitative real-time PCR (45 cycles – LightCycler480 software) was performed using fast SYBR Green Master Mix (Thermo Fisher Scientific, 1,176,250). Actb and Gapdh served as loading controls. The sequence of Atm and Atr primers are as following:
Atm-Forward: GATCTGCTCATTTGCTGCCG;
Atm-Reverse: GTGTGGTGGCTGATACATTTGAT;
Atr-Forward: GAATGGGTGAACAATACTGCTGG;
Atr-Reverse: TTTGGTAGCATACACTGGCGA;
In silico protein docking analysis
Protein-protein docking, energy filtering, clustering, and ranking were done by the ClusPro 2.0 web server (https://cluspro.bu.edu/publications.php) [Citation65,Citation66]. Structures of ATM (PDB ID code 5NP1) and DYNLL1 (PDB ID code 3RJS), were obtained from Protein Data Bank. We simulated ATM and DYNLL1 interaction using ClusPro 2.0 balanced mode. Representative structures for the cluster were obtained from each simulation and docking energy center score of the first ranked cluster conformation was chosen. PyMOL was used to analyze the potential presence of interacting bonds of the most favorable confirmation obtained from ClusPro 2.0 docking.
Statistical analysis
Colocalization analysis was performed on Leica confocal software (LAS X). All data were obtained from at least three independent preparations. All quantifications were performed in a blinded manner. Differences between groups were analyzed using the unpaired/paired t test or one-way ANOVA. All statistical analysis was performed with GraphPad Prism 6. A p value ≤ 0.05 was considered significant. Results were reported as mean ± SEM.
Declaration of interest statement
All the authors declare that no competing interests exist.
Supplemental Material
Download Zip (60.8 MB)Acknowledgments
We thank Dr. Qian Cai, Dr. Ron Hart and Dr. Mark R. Plummer from Rutgers, the State University of New Jersey, for their helpful advices on lysosome trafficking analysis. We thank APCF, the animal facility in HKUST for animal breeding and Ms. Jianping Ren for animal genotyping. This work was supported by the Research Grants Council, Hong Kong Special Administrative Region (Grants HKUST12/CRF/13G, GRF660813, GRF16101315, AoE/M-05/12, GRF16100718, GRF16103317 and GRF16100219); the Offices of Provost, Vice-President for Research and Graduate Studies, and Dean of Science, The Hong Kong University of Science and Technology (HKUST; Grant VPRGO12SC02); RGC/HKUST Initiation Grant (IGN16SC02), CUHK Improvement on Competitiveness in Hiring New Faculties Start-Up Fund (Ref.:133) and Alzheimer’s Association (AARF-17-531566). We also thank the funding provided by Hong Kong Branch of South Marine Science and Engineering Guangdong Laboratory (SMSEGL20Sc01) and the China Ocean Mineral Resources Research and Development Association (COMRRDA17SC01).
Supplementary material
Supplemental data for this article can be accessed here.
Additional information
Funding
Related Research Data
References
- Hiom K. DNA repair: how to PIKK a partner. Curr Biol. 2005;15:R473–475.
- Blackford AN, Jackson SP. ATM, ATR, and DNA-PK: the trinity at the heart of the DNA damage response. Mol Cell. 2017;66:801–817.
- Watters D, Spring K, Bjorkman J, et al. Localization of a portion of extranuclear ATM to peroxisomes. J Biol Chem. 1999;274:34277–34282.
- Cheng A, Zhao T, Tse KH, et al. ATM and ATR play complementary roles in the behavior of excitatory and inhibitory vesicle populations. Proc Natl Acad Sci U S A. 2018;115:E292–E301.
- Vail G, Cheng A, Han YR, et al. ATM protein is located on presynaptic vesicles and its deficit leads to failures in synaptic plasticity. J Neurophysiol. 2016;116:201–209.
- Li J, Han YR, Plummer MR, et al. Cytoplasmic ATM in neurons modulates synaptic function. Curr Biol. 2009;19(24):2091–2096.
- Barlow C, Ribaut-Barassin C, Zwingman, et al. ATM is a cytoplasmic protein in mouse brain required to prevent lysosomal accumulation. Proc Natl Acad Sci U S A. 2000;97(2):871–876.
- Halaby MJ, Hibma JC, He J, et al. ATM protein kinase mediates full activation of Akt and regulates glucose transporter 4 translocation by insulin in muscle cells. Cell Signal. 2008;20:1555–1563.
- Saftig P. Lysosomes. Springer. US2007.
- Lecker SH, Goldberg AL, Mitch WE. Protein degradation by the ubiquitin-proteasome pathway in normal and disease states. J Am Soc Nephrol. 2006;17:1807–1819.
- Rock KL, Gramm C, Rothstein L, et al. Inhibitors of the proteasome block the degradation of most cell proteins and the generation of peptides presented on MHC class I molecules. Cell. 1994;78:761–771.
- Luzio JP, Pryor PR, Bright NA. Lysosomes: fusion and function. Nat Rev Mol Cell Biol. 2007;8:622–632.
- Hui L, Geiger NH, Bloor-Young D, et al. Release of calcium from endolysosomes increases calcium influx through N-type calcium channels: evidence for acidic store-operated calcium entry in neurons. Cell Calcium. 2015;58:617–627.
- Li X, Rydzewski N, Hider A, et al. A molecular mechanism to regulate lysosome motility for lysosome positioning and tubulation. Nat Cell Biol. 2016;18:404–417.
- Tammineni P, Ye X, Feng TC, et al. Impaired retrograde transport of axonal autophagosomes contributes to autophagic stress in Alzheimer’s disease neurons. Elife. 2017;6. DOI:10.7554/eLife.21776
- Ferguson SM. Axonal transport and maturation of lysosomes. Curr Opin Neurobiol. 2018;51:45–51.
- Kotiadis VN, Duchen MR, Osellame LD. Mitochondrial quality control and communications with the nucleus are important in maintaining mitochondrial function and cell health. BBA-Gen Subj. 2014;1840:1254–1265.
- Nixon RA. The role of autophagy in neurodegenerative disease. Nat Med. 2013;19:983–997.
- Xie Z, Klionsky DJ. Autophagosome formation: core machinery and adaptations. Nat Cell Biol. 2007;9:1102–1109.
- Tanida I, Ueno T, Kominami E. LC3 and Autophagy. Methods Mol Biol. 2008;445:77–88.
- Tripathi DN, Zhang J, Jing J, et al. A new role for ATM in selective autophagy of peroxisomes (pexophagy). Autophagy. 2016;12:711–712.
- Valentin-Vega YA, Kastan MB. A new role for ATM: regulating mitochondrial function and mitophagy. Autophagy. 2012;8:840–841.
- Alexander A, Kim J, Walker CL. ATM engages the TSC2/mTORC1 signaling node to regulate autophagy. Autophagy. 2010;6:672–673.
- Liang N, Jia L, Liu Y, et al. ATM pathway is essential for ionizing radiation-induced autophagy. Cell Signal. 2013;25:2530–2539.
- Zhang J, Tripathi DN, Jing J, et al. ATM functions at the peroxisome to induce pexophagy in response to ROS. Nat Cell Biol. 2015;17:1259–1269.
- Liang N, He Q, Liu X, et al. Multifaceted roles of ATM in autophagy: from nonselective autophagy to selective autophagy. Cell Biochem Funct. 2019;37:177–184.
- Zou Y, Wang Q, Li B, et al. Temozolomide induces autophagy via ATMAMPKULK1 pathways in glioma. Mol Med Rep. 2014;10:411–416.
- Valentin-Vega YA, Maclean KH, Tait-Mulder J, et al. Mitochondrial dysfunction in ataxia-telangiectasia. Blood. 2012;119:1490–1500.
- Li J, Chen J, Vinters HV, et al. Stable brain ATM message and residual kinase-active ATM protein in ataxia-telangiectasia. J Neurosci. 2011;31:7568–7577.
- Desai SD, Reed RE, Babu S, et al. ISG15 deregulates autophagy in genotoxin-treated ataxia telangiectasia cells. J Biol Chem. 2013;288:2388–2402.
- Cohen-Kaplan V, Livneh I, Avni N, et al. p62- and ubiquitin-dependent stress-induced autophagy of the mammalian 26S proteasome. Proc Natl Acad Sci U S A. 2016;113:E7490–E7499.
- Nedelsky NB, Todd PK, Taylor JP. Autophagy and the ubiquitin-proteasome system: collaborators in neuroprotection. Biochim Biophys Acta. 2008;1782:691–699.
- Spears L, McKuin MR, Renth AL, et al. Ataxia telangiectasia mutated (ATM) influences AICAR-stimulated glucose transport. Faseb J. 2012;26: 1078.1024-1078.1024.
- Kaizuka T, Morishita H, Hama Y, et al. An autophagic flux probe that releases an internal control. Mol Cell. 2016;64:835–849.
- Sevlever D, Jiang PZ, Yen SHC. Cathepsin D is the main lysosomal enzyme involved in the degradation of alpha-synuclein and generation of its carboxy-terminally truncated species. Biochemistry-Us. 2008;47:9678–9687.
- Benito-Cuesta I, Diez H, Ordonez L, et al. Assessment of autophagy in neurons and brain tissue. Cells. 2017;6. DOI:10.3390/cells6030025
- Gieselmann V, Hasilik A, Vonfigura K. Processing of human cathepsin-D in lysosomes invitro. J Biol Chem. 1985;260:3215–3220.
- Lee JH, Mand MR, Kao CH, et al. ATM directs DNA damage responses and proteostasis via genetically separable pathways. Sci Signal. 2018;11. DOI:10.1126/scisignal.aan5598
- Fejtova A, Davydova D, Bischof F, et al. Dynein light chain regulates axonal trafficking and synaptic levels of bassoon. J Cell Biol. 2009;185:341–355.
- Bakirtzi K, Belfort G, Lopez-Coviella I, et al. Cerebellar neurons possess a vesicular compartment structurally and functionally similar to Glut4-storage vesicles from peripheral insulin-sensitive tissues. J Neurosci. 2009;29:5193–5201.
- Liu N, Stoica G, Yan M, et al. ATM deficiency induces oxidative stress and endoplasmic reticulum stress in astrocytes. Lab Invest. 2005;85:1471–1480.
- Chow HM, Cheng A, Song X, et al. ATM is activated by ATP depletion and modulates mitochondrial function through NRF1. J Cell Biol. 2019;218:909–928.
- Ma J, Nakagawa Y, Kojima I, et al. Prolonged insulin stimulation down-regulates GLUT4 through oxidative stress-mediated retromer inhibition by a protein kinase CK2-dependent mechanism in 3T3-L1 adipocytes. J Biol Chem. 2014;289:133–142.
- Wu D, Yang H, Xiang W, et al. Heterozygous mutation of ataxia-telangiectasia mutated gene aggravates hypercholesterolemia in apoE-deficient mice. J Lipid Res. 2005;46:1380–1387.
- Badalian LO, Kalinina LV. [Lipid metabolism disorder in ataxia-telangiectasia]. Zhurnal nevropatologii i psikhiatrii imeni S.S. Korsakova (Moscow, Russia: 1952). 76(1976):665–669.
- Wijdeven RH, Janssen H, Nahidiazar L, et al. Cholesterol and ORP1L-mediated ER contact sites control autophagosome transport and fusion with the endocytic pathway. Nat Commun. 2016;7:11808.
- Tsvetkov AS, Miller J, Arrasate M, et al. A small-molecule scaffold induces autophagy in primary neurons and protects against toxicity in a Huntington disease model. Proc Natl Acad Sci U S A. 2010;107:16982–16987.
- Boland B, Kumar A, Lee S, et al. Autophagy induction and autophagosome clearance in neurons: relationship to autophagic pathology in Alzheimer’s disease. J Neurosci. 2008;28:6926–6937.
- Bove J, Martinez-Vicente M, Vila M. Fighting neurodegeneration with rapamycin: mechanistic insights. Nat Rev Neurosci. 2011;12:437–452.
- Chen P, Peng C, Luff J, et al. Oxidative stress is responsible for deficient survival and dendritogenesis in purkinje neurons from ataxia-telangiectasia mutated mutant mice. J Neurosci. 2003;23:11453–11460.
- Fassio A, Esposito A, Kato M, et al. De novo mutations of the ATP6V1A gene cause developmental encephalopathy with epilepsy. Brain. 2018;141:1703–1718.
- Yang DQ, Kastan MB. Participation of ATM in insulin signalling through phosphorylation of eIF-4E-binding protein 1. Nat Cell Biol. 2000;2:893–898.
- Chow HM, Shi M, Cheng A, et al. Age-related hyperinsulinemia leads to insulin resistance in neurons and cell-cycle-induced senescence. Nat Neurosci. 2019;22:1806–1819.
- Schneider JG, Finck BN, Ren J, et al. ATM-dependent suppression of stress signaling reduces vascular disease in metabolic syndrome. Cell Metab. 2006;4:377–389.
- Huang S, Lifshitz LM, Jones C, et al. Insulin stimulates membrane fusion and GLUT4 accumulation in clathrin coats on adipocyte plasma membranes. Mol Cell Biol. 2007;27:3456–3469.
- Espach Y, Lochner A, Strijdom H, et al. ATM protein kinase signaling, type 2 diabetes and cardiovascular disease. Cardiovasc Drugs Ther. 2015;29:51–58.
- Mercer JR, Cheng KK, Figg N, et al. DNA damage links mitochondrial dysfunction to atherosclerosis and the metabolic syndrome. Circ Res. 2010;107:1021–1031.
- Cicero S, Herrup K. Cyclin-dependent kinase 5 is essential for neuronal cell cycle arrest and differentiation. J Neurosci. 2005;25:9658–9668.
- Almeida CG, Tampellini D, Takahashi RH, et al. Beta-amyloid accumulation in APP mutant neurons reduces PSD-95 and GluR1 in synapses. Neurobiol Dis. 2005;20:187–198.
- Caldeira MV, Melo CV, Pereira DB, et al. Brain-derived neurotrophic factor regulates the expression and synaptic delivery of alpha-amino-3-hydroxy-5-methyl-4-isoxazole propionic acid receptor subunits in hippocampal neurons. J Biol Chem. 2007;282:12619–12628.
- Lee HY, Greene LA, Mason CA, et al. Isolation and culture of post-natal mouse cerebellar granule neuron progenitor cells and neurons. J Vis Exp. 2009;16(23):990. DOI:10.3791/990.
- Takai H, Smogorzewska A, de Lange T. DNA damage foci at dysfunctional telomeres. Curr Biol. 2003;13:1549–1556.
- Colella AD, Chegenii N, Tea MN, et al. Comparison of stain-free gels with traditional immunoblot loading control methodology. Anal Biochem. 2012;430:108–110.
- Eaton SL, Roche SL, Hurtado ML, et al. Total protein analysis as a reliable loading control for quantitative fluorescent western blotting. Plos One. 2013;8(8):e72457.
- Comeau SR, Gatchell DW, Vajda S, et al. ClusPro: a fully automated algorithm for protein-protein docking. Nucleic Acids Res. 2004;32:W96–W99.
- Comeau SR, Gatchell DW, Vajda S, et al. ClusPro: an automated docking and discrimination method for the prediction of protein complexes. Bioinformatics. 2004;20:45–50.