
ABSTRACT
Autophagy is critical for plant defense against necrotrophic pathogens, which causes serious yield loss on crops. However, the post-translational regulatory mechanisms of autophagy pathway in plant resistance against necrotrophs remain poorly understood. In this study, we report that phosphorylation modification on ATG18a, a key regulator of autophagosome formation in Arabidopsis thaliana, constitutes a post-translation regulation of autophagy, which attenuates plant resistance against necrotrophic pathogens. We found that phosphorylation of ATG18a suppresses autophagosome formation and its subsequent delivery into the vacuole, which results in reduced autophagy activity and compromised plant resistance against Botrytis cinerea. In contrast, overexpression of ATG18a dephosphorylation-mimic form increases the accumulation of autophagosomes and complements the plant resistance of atg18a mutant against B. cinerea. Moreover, BAK1, a key regulator in plant resistance, was identified to physically interact with and phosphorylate ATG18a. Mutation of BAK1 blocks ATG18a phosphorylation at four of the five detected phosphorylation sites after B. cinerea infection and strongly activates autophagy, leading to enhanced resistance against B. cinerea. Collectively, the identification of functional phosphorylation sites on ATG18a and the corresponding kinase BAK1 unveiled how plant regulates autophagy during resistance against necrotrophic pathogens.
Abbreviations: 35s: the cauliflower mosaic virus 35s promoter; A. thaliana: Arabidopsis thaliana; A. brassicicola: Alternaria brassicicola; ABA: abscisic acid; ATG: autophagy-related; ATG18a: autophagy-related protein 18a in A. thaliana; ATG8a: autophagy-related protein 8a in A. thaliana; ATG8–PE: ATG8 conjugated with PE; B. cinerea: Botrytis cinerea; BAK1: Brassinosteroid insensitive 1-associated receptor kinase1 in A. thaliana; BiFC: biomolecular fluorescence complementation; BIK1: Botrytis-insensitive kinase 1 in A. thaliana; BKK1: BAK1-like 1 in A. thaliana; BR: brassinosteroid; Co-IP: coimmunoprecipitation; dai: days after inoculation; DAMPs: damage-associated molecular patterns; E. coli: Escherochia coli; ER: endoplasmic reticulum; ETI: effector-triggered immunity; GFP: green fluorescent protein; HA: hemagglutinin; IP: immunoprecipitation; LC-MS/MS: liquid chromatography-tandem mass spectrometry; LCI: luciferase complementation imaging; MPK3: mitogen-activated protein kinase 3 in A. thaliana; MPK4: mitogen-activated protein kinase 4 in A. thaliana; MPK6: mitogen-activated protein kinase 6 in A. thaliana; N. benthamiana: Nicotiana benthamiana; NES: nuclear export sequence; PAMP: pathogen-associated molecular pattern; PCR: polymerase chain reaction; PE: phosphatidylethanolamine; PRR: pattern recognition receptor; PtdIns(3,5)P2: phosphatidylinositol (3,5)-biphosphate; PtdIns3P: phosphatidylinositol 3-biphosphate; PTI: PAMP-triggered immunity; qRT-PCR: quantitative reverse transcription PCR; SnRK2.6: SNF1-related protein kinase 2.6 in A. thaliana; TORC1: the rapamycin-sensitive Tor complex1; TRAF: tumor necrosis factor receptor-associated factor; WT: wild type plant; Yc: C-terminal fragment of YFP; YFP: yellow fluorescent protein; Yn: N-terminal fragment of YFP
Introduction
Botrytis cinerea is a typical necrotrophic pathogen by killing plant cells to get nutrients [Citation1–3]. It is one of the top ten fungal pathogens on plants because it can infect more than 200 plant species and cause serious damage to crops and fruits before and after harvest [Citation3,Citation4]. However, how plants defend against B. cinerea is still largely unknown. To fight against pathogen infection, plants depend on the two-branched innate immunity: PAMP-triggered immunity (PTI) and effector-triggered immunity (ETI) [Citation5]. Pattern recognition receptors (PRRs) on plant plasma membrane detect conserved microbial molecules (pathogen/microbe-associated molecular patterns, PAMPs/MAMPs) and plant-derived molecules (damage-associated molecular patterns, DAMPs) to activate PTI [Citation6–8]. For successful infection, virulent pathogens secrete a battery of effector proteins, which get into plant cells and suppress PTI to help pathogen infection [Citation9,Citation10]. As a consequence of coevolution, plants generate different resistance (R) proteins to detect effector proteins directly or indirectly; and this interaction activates a strong resistance response, ETI, which is usually accompanied by localized cell death [Citation11]. PTI and ETI have been used to explain plant resistance against biotrophic/hemibiotrophic pathogens very well [Citation12]. But ETI was found to be hijacked by necrotrophs to induce cell death and promote disease development [Citation2,Citation13]. While, PTI plays positive roles in resistance against necrotrophs [Citation14]. Based on the study on molecular genetics of Arabidopsis-necrotroph interaction, plant resistant system against necrotrophs is more complicated than that against biotrophs/hemibiotrophs.
Macroautophagy/autophagy is one of the major pathways required for resistance against necrotrophs. Blocking autophagy by knockout of Arabidopsis autophagy-related (ATG) genes such as ATG5 and ATG18a or autophagy-regulating genes such as TRAF1a/1b causes hypersensitive responses to B. cinerea [Citation15–18]. Autophagy is a conserved catabolic process in eukaryotes that removes dysfunctional proteins and organelles to vacuole for degradation to maintain cellular homeostasis [Citation19,Citation20]. Under stress conditions, the autophagy pathway is activated to engulf cytoplasmic damaged proteins or organelles into double-membrane structures termed autophagosomes; then, the outer membrane of autophagosomes fuses with the membrane of vacuoles, releasing the inner membrane including the enveloped cargo into vacuoles for degradation by proteases and hydrolases [Citation21,Citation22]. The autophagy pathway is processed by five systems organized by ATG proteins: ATG1 kinase complex, PtdIns3K complex, ATG9 complex, ATG8–PE conjugation system and ATG12–ATG5 conjugation systems [Citation22,Citation23]. While, the function of the ATG9 complex in plants including ATG2, ATG9 and ATG18, has not been extensively studied. In yeast, the ATG9 complex recruits lipid from endoplasmic reticulum (ER) and the Golgi to expand the phagophore membrane and ATG18 functions as a modulator of phosphatidylinositol (3,5)-biphosphate (PtdIns [3,5]P2) and PtdIns3P [Citation24–27]. In Arabidopsis, eight ATG18 genes (ATG18a-ATG18h) have been identified and only ATG18a is induced in nutrient starvation and senescence [Citation28]. Under stress conditions, ATG18a interacts with ATG9 and regulates the autophagosome initiation from ER [Citation29]. Mutation of ATG18a gene blocks the formation of autophagosomes and enhances plant sensitivity to oxidative stress and nutrient starvation [Citation28,Citation30]. These observations highlight the importance of understanding how plants activate autophagy through ATG18a. But how plants regulate the function of ATG18a in autophagy and plant immunity is still unclear. In addition to its function in cytoplasm, ATG18a physically interacts with transcription factor WRKY33 in nuclei [Citation17]. WRKY33 is a key resistance regulator against B. cinerea [Citation31]. It positively regulates multiple resistance pathways such as JA/ET signaling pathway and camalexin biosynthesis and also suppresses SA and ABA signaling pathways, which negatively regulate resistance against B. cinerea [Citation31–34]. So, ATG18a involves both of the autophagy-mediated resistance in cytoplasm and the WRKY33-mediated resistance in nuclei. But it is unknown whether the resistance function of ATG18a against B. cinerea is dependent on its cytoplasmic function or nuclear function.
Phosphorylation modification is an important post-translational regulation in autophagy. In yeast, the rapamycin-sensitive Tor complex 1 (TORC1) directly phosphorylates ATG13 to suppress the initiation of autophagy [Citation35] and ATG1 kinase complex phosphorylates ATG9 to enhance its activity in recruitment of ATG8 and ATG18 to autophagosome membrane [Citation36,Citation37]. In Arabidopsis, the ATG1-ATG13 protein kinase complex initiates autophagosome formation in response to stress [Citation38]. But how the phosphorylation modification regulates the function of ATG18a in Arabidopsis is still unknown.
Here, we report that phosphorylation modification of ATG18a suppresses autophagosome formation during B. cinerea infection. By IP-LC-MS/MS, five phosphorylation sites (Thr241, Ser328, Ser344, Ser361 and Thr387) on ATG18a are identified. Overexpression of ATG18a dephosphomimetic form induces strong autophagy signals and enhances resistance against necrotrophic pathogens: B. cinerea and A. brassicicola, while overexpression of the phosphomimetic form of ATG18a only induces basal level of autophagy signal and cannot complement the susceptible phenotype of atg18a mutant against necrotrophs to the wild type completely. Further, BAK1 was identified to be responsible for phosphorylating ATG18a by direct interaction in vivo. Mutation of BAK1 decreases the phosphorylation level of ATG18a and induces strong autophagy signals, resulting in enhanced resistance against necrotrophic pathogens.
Results
The cytoplasm function of ATG18a is sufficient for resistance against B. cinerea
Previously, we reported that autophagy is required for disease resistance to necrotrophic pathogens: B. cinerea and Alternaria brassicicola and mutation of ATG18a enhances plant susceptibility to B. cinerea [Citation17]. In order to confirm the function of ATG18a in resistance to B. cinerea, we generated an ATG18a-GFP construct and transformed it into atg18a mutant (GABI_651D08) to generate complementation lines. Two independent complementation lines (ATG18a-GFP/atg18a) expressing high level of ATG18a-GFP proteins were selected for disease assay (Figure S1A). Before inoculation with B. cinerea, no senescence phenotype was observed on the wild type, atg18a mutant and complementation plants (Figure S1B). At 4 dai (days after inoculation), atg18a mutant showed enhanced chlorosis and necrosis, but the two complementation lines and wild type plants showed limited disease symptoms (). Consistent with the disease phenotype, atg18a mutant accumulated more fungal biomass than wild type, measured by qRT-PCR amplification of B. cinerea ActinA mRNA and the two complementation lines accumulated the wild-type level of B. cinerea biomass (). Thus, expression of ATG18a-GFP restored the disease phenotype of atg18a mutant to the wild type level.
Figure 1. Cytoplasmic function of ATG18a is sufficient to enhance resistance to B. cinerea. (A) Overexpressing ATG18a-GFP complemented atg18a mutant phenotype to resistance against B. cinerea. Four-week-old plants were spray-inoculated with B. cinerea at 2.5 × 10⁵ spores/ml and the phenotype was checked at 4 dai. The experiment was repeated three times with similar results. WT, wild type. Scale bar: 2 cm. (B) Fungal biomass accumulation assay measured by qPCR revealed that overexpression of ATG18a-GFP suppressed B. cinerea growth. Fungal growth was determined by qRT-PCR amplification of the B. cinerea ActinA gene relative to Arabidopsis ACT2 gene. The data represent mean values ± SD (n = 3). The mean values following by different letters are significantly different from each other (p < 0.01, Student’s t-test). The experiment was repeated three times with similar results. (C) Overexpressing NES-ATG18a-GFP suppressed the susceptibility of atg18a mutant to B. cinerea. Four-week-old plants were spray-inoculated with B. cinerea at 2.5 × 10⁵ spores/ml and the phenotype was checked at 4 dai. The experiment was repeated three times with similar results. Scale bar: 2 cm. (D) Fungal biomass accumulation assay measured by qRT-PCR revealed that overexpression of NES-ATG18a-GFP in atg18a mutant suppressed B. cinerea growth. Fungal growth was determined by qPCR amplification of the B. cinerea ActinA gene relative to Arabidopsis ACT2 gene. The data represent mean values ± SD (n = 3). The experiment was repeated three times with similar results
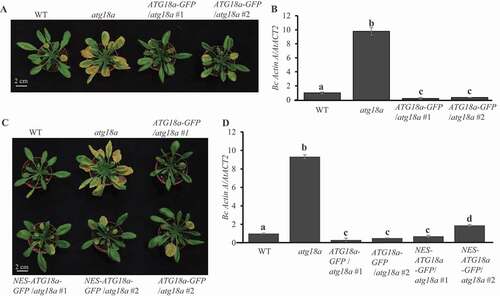
To investigate whether cytoplasm-localized ATG18a plays positive roles in resistance against B. cinerea, we fused a nuclear export sequence (NES) from HIV Rev protein [Citation39] with ATG18a-GFP to generate NES-ATG18a-GFP construct. The construct was transformed into atg18a mutant to generate transgenic lines (NES-ATG18a-GFP/atg18a). Two independent lines expressing high protein level of ATG18a were picked up for further assays (Figure S1C). Confocal microscope assays showed that ATG18a-GFP, as the control, displayed tiny dots in both cytoplasm and nuclei, very similar to previous reports [Citation17,Citation29], while the NES-ATG18a-GFP protein was localized in cytoplasm but not in nuclei before and after B. cinerea infection (Figure S1D). This means the NES-ATG18a-GFP protein is localized in the cytoplasm, but not in nuclei. Next, we tested the disease phenotype of these transgenic plants against B. cinerea. At 4 dai, the NES-ATG18a-GFP/atg18a transgenic lines, similar to the ATG18a-GFP/atg18a transgenic lines, showed more resistance than atg18a mutant (). Biomass accumulation assay also showed that NES-ATG18a-GFP/atg18a transgenic lines accumulated the same level of fungal biomass as the ATG18a-GFP/atg18a transgenic lines (). These observations indicate that accumulation of ATG18a proteins in cytoplasm is sufficient to complement the defense phenotype of atg18a mutant in response to B. cinerea infection.
To further test whether the cytoplasmic function of ATG18a is sufficient for activating autophagy, we transiently co-expressed NES-ATG18a-3xHA construct and ATG18a-3xHA construct individually with GFP-ATG8a construct, an autophagy marker gene, into atg18a mutant protoplasts. Similar to ATG18a-3xHA, NES-ATG18a-3xHA induced the formation of autophagosome in atg18a mutant protoplasts (Figure S1E and S1F). We conclude that the function of ATG18a in cytoplasm is sufficient to induce autophagy and enhance resistance against B. cinerea.
ATG18a is phosphorylated in plant before and after B. cinerea infection
When we checked ATG18a-GFP protein level in transgenic plants by western blot, two clear bands were observed: a large band and a small band (Figure S1A). And similar phenotype was also observed when plants were infected with another necrotrophic pathogen Alternaria brassicicola (Figure S2A). Because phosphorylation is a common way to cause protein shift, we inferred that the large band might be the phosphorylated ATG18a protein. To examine this possibility, the protein samples from ATG18a-GFP/atg18a transgenic plants at 0, 1, 2, and 3 dai were treated with lambda-phosphatase. Compared with samples without lambda-phosphatase treatment, lambda-phosphatase removed the large band of ATG18a-GFP in the samples at 1, 2 and 3 dai (). This indicates that the large band in the samples after infection is the phosphorylated ATG18a-GFP protein. Surprisingly, lambda-phosphatase significantly reduced the level of the large band in the sample at 0 dai, but did not make it disappear (). So, in addition to phosphorylation modification, ATG18a protein contains other post-translational modifications under normal conditions; under B. cinerea infection conditions, the large band presented phosphorylated ATG18a-GFP protein. It was also observed that B. cinerea infection reduced the amount of the large band (phosphorylated ATG18a-GFP) and enhanced the accumulation of the small band (dephosphorylated ATG18a-GFP) (). Thus, phosphorylation modification may regulate the function of ATG18a in resistance against B. cinerea.
Figure 2. ATG18a is phosphorylated before and after B. cinerea inoculation. (A) Mobility shift of ATG18a was reduced by lambda-phosphatase treatment. Total protein was isolated from the leaves of ATG18a-GFP/atg18a transgenic plants at 0, 1, 2, and 3 dai. Half of protein samples were loaded in the SDS-PAGE gel and half of them were loaded after lambda-phosphatase treatment. Those protein samples were separated and western-blotted by anti-GFP antibody. The protein loading control is shown by Ponceau staining. Ratio = large band signal:loading control. The ratio was used to present the relative level of phosphorylated ATG18a protein. The experiment was repeated three times with similar results. (B) ATG18a was phosphorylated at Ser344 before inoculation. To identify the phosphorylation sites on ATG18a before B. cinerea inoculation, the leaf samples of 35s:ATG18a-GFP/atg18a transgenic plants were collected and the ATG18a-GFP protein immunoprecipitated by anti-GFP antibody was sent for LC-MS/MS. The MS analysis covered 78.35% of the total ATG18a protein and identified one monophosphorylated peptide: IAPDSTPSSPSSSLSLFK. The experiment was repeated three times with the same results. (C) Thr241, Ser328, Ser344, Ser361 and Thr387 were phosphorylated after B. cinerea inoculation. To identification the phosphorylation sites on ATG18a after B. cinerea inoculation, the leaf samples of 35s:ATG18a-GFP/atg18a transgenic plants were collected at 24 h after B. cinerea inoculation and the ATG18a-GFP protein immunoprecipitated by anti-GFP antibody was sent for LC-MS/MS. The MS analysis covered 76.71% of the total ATG18a protein and identified five monophosphorylated peptide: TKFVMAHDSR, VNSGSQVKDSSR, IAPDSTPSSPSSSLSLFKGVLPR, YFSSEWSVAQFR, NTVVILGMDGSFYR. The experiment was repeated three times with the same results
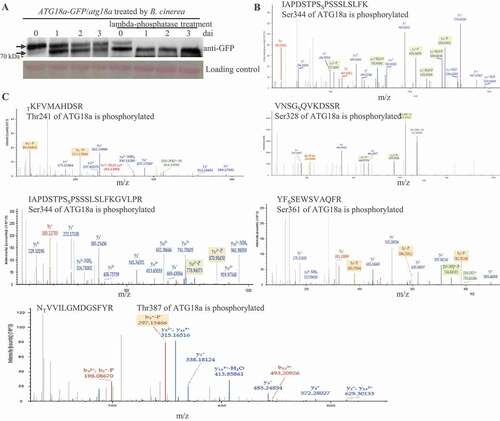
To explore the phosphorylation sites on ATG18a in vivo, the leaf samples of the ATG18a-GFP/atg18a transgenic line before inoculation and those at 1 d after B. cinerea inoculation were collected. Then, ATG18a-GFP proteins immunoprecipitated by anti-GFP antibody were sent for liquid chromatography-tandem mass spectrometry (LC-MS/MS). The results showed that only one serine residue (Ser344) on ATG18a protein was phosphorylated before inoculation (), while three serine residues (Ser328, Ser344, and Ser361) and two threonine residues (Thr241 and Thr387) were identified to be phosphorylated on ATG18a in B. cinerea-treated leaf samples (). This indicates that Ser344 on ATG18a is phosphorylated before and after infection and phosphorylation of Thr241, Ser328, Ser361, and Thr387 on ATG18a are induced by B. cinerea infection. Also, the phosphorylation pattern on ATG18a is different from the reported PpATG18 phosphorylation pattern (Figure S2B) [Citation25].
Phosphorylation of ATG18a suppresses autophagy activity
In order to explore the function of ATG18a phosphorylation on autophagy and identify the important phosphorylation sites on ATG18a, we mutated the five phosphorylation sites to aspartate (D) on ATG18a as phosphomimetic form of ATG18a, or mutated them to alanine (A) as dephosphomimetic form of ATG18a. For simplicity, the five phosphorylation sites in ATG18a were designated with numbers, Ser344 as 1, Ser361 as 2, Thr241 as 3, Ser328 as 4 and Thr387 as 5. A series of Ser/Thr to Asp (D) mutant constructs of ATG18a: ATG18a1D, ATG18a12D, ATG18a2345D, and ATG18a12345D and a series of Ser/Thr to Ala mutant constructs of ATG18a: ATG18a1A, ATG18a12A, ATG18a2345A, and ATG18a12345A were generated. Same as previous reports, mutation of ATG18a compromised the accumulation of autophagosomes and overexpression of ATG18a can complement the phenotype of atg18a mutant to wild type (Figure S1E and S1F). So, we used protoplast system to detect the function of different mutated ATG18a in autophagosome formation. All of those ATG18a constructs were transiently expressed in atg18a mutant protoplasts with GFP-ATG8a construct, and the autophagosomes were detected by confocal microscope. Transient expression of ATG18a1A, ATG18a1D, ATG18a12A and ATG18a2345A in atg18a mutant protoplasts induced similar level of autophagy activity as transient expression of ATG18a; transient expression of ATG18a12D, ATG18a2345D and ATG18a12345D induced significantly lower autophagy activity than that induced by transient expression of ATG18a (, S3A and S3B). Clearly, transient expression of ATG18a12345A induced stronger autophagy activity than that induced by transient expression of ATG18a (). These observations suggest that dephosphorylation of ATG18a significantly enhances the accumulation of autophagosomes in protoplasts. Also, the induction of strong autophagy activity requires dephosphorylation of all five sites (Ser344, Ser361, Thr241, Ser328, and Thr387) on ATG18a protein.
Figure 3. ATG18a12345A and ATG18a12345D affect the induction of autophagy. (A) ATG18a12345A induced strong autophagy signals in the protoplasts of atg18a mutant. Empty vector/atg18a (transient expression of empty vector in the protoplasts of atg18a mutant with GFP-ATG8a), ATG18a/atg18a (transient expression of ATG18a in the protoplasts of atg18a mutant with GFP-ATG8a), ATG18a12345A/atg18a (transient expression of ATG18a12345A in the protoplasts of atg18a mutant with GFP-ATG8a), ATG18a12345D/atg18a (transient expression of ATG18a12345D in the protoplasts of atg18a mutant with GFP-ATG8a). 24 h after transformation, the GFP signal was checked by confocal microscope and typical pictures were presented. The GFP signal was used to present the autophagy signal. The experiment was repeated three times with similar results. Bars: 10 μm. (B) Autophagic activities were detected after empty vector, ATG18a, ATG18a12345A and ATG18a12345D were transferred into atg18a mutant protoplasts. The absolute GFP-ATG8a-labeled puncta per protoplast was counted. For each treatment, at least 30 cells were used to quantify autophagosomes and mean value is the statistical analysis based on more than 30 cells from an individual experiment. Different letter means a significant difference. The experiment was repeated three times with similar results. (C) Detection of autophagic activity in GFP-ATG8a/ATG18a-3xHA/atg18a, GFP-ATG8a/ATG18a12345A-3xHA/atg18a and GFP-ATG8a/ATG18a12345D-3xHA/atg18a transgenic plants before and after B. cinerea infection with or without ConA treatment. The experiment wasrepeated three times with similar results. Bars: 40 μm. (D) Quantification of autophagic activity in GFP-ATG8a/ATG18a-3xHA/atg18a, GFP-ATG8a/ATG18a12345A-3xHA/atg18a and GFP-ATG8a/ATG18a12345D-3xHA/atg18a transgenic plants before and after B. cinerea infection with or without ConA treatment. The absolute GFP-ATG8a-labeled puncta per protoplast was counted. For each treatment, at least 20 cells were used to quantify autophagosomes. The mean value is the statistical analysis based on more than 20 cells from an individual experiment. The experiment was repeated three times with similar results. Different letter means significant difference. (E) Western blot to detect the ATG8 lipidation level in four-week old ATG18a-GFP/atg18a, ATG18a12345A-GFP/atg18a and ATG18a12345D-GFP/atg18a plants before and after B. cinerea inoculation. Four-week old ATG18a-GFP/atg18a, ATG18a12345A-GFP/atg18a and ATG18a12345D-GFP/atg18a plants were spray-inoculated with B. cinerea at 2.5 × 10⁵ spores/ml and leaf samples were collected at 0, 1, 2, and 3 dai, respectively. Membrane fractions were blotted with ATG8 antibody. Western blotting with Arabidopsis CFBP antibody was used as the loading control. Relative intensity of ATG8–PE normalized to the loading control was shown below. The relative level of ATG8–PE was also shown to present the autophagy accumulation. The experiment was repeated three times with similar results. (F) Western blot to detect the vacuolar delivery of GFP in GFP-ATG8a/ATG18a-3xHA/atg18a, GFP-ATG8a/ATG18a12345A-3xHA/atg18a and GFP-ATG8a/ATG18a12345D-3xHA/atg18a transgenic plants before and 2 d after B. cinerea infection. Relative intensity of GFP was normalized to the level of GFP-ATG8a to detect the vacuolar delivery of GFP. The experiment was repeated three times with similar results. (G) Detection of the accumulation of NBR1 protein in GFP-ATG8a/ATG18a-3xHA/atg18a, GFP-ATG8a/ATG18a12345A-3xHA/atg18a and GFP-ATG8a/ATG18a12345D-3xHA/atg18a transgenic plants before and after B. cinerea infection. The ratio (NBR1 protein level divided by Arabidopsis ACT2 protein level) is used to show the relative protein levels of NBR1 in plants. The experiment was repeated three times with similar results
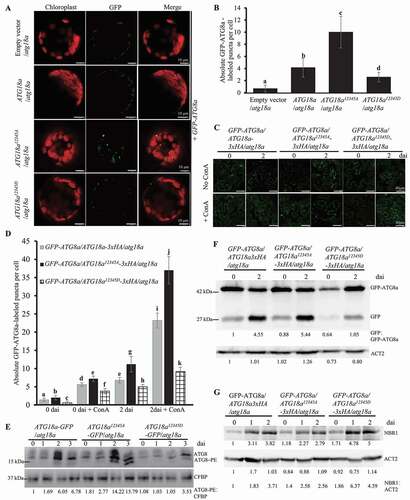
In order to check whether ATG18a12345A and ATG18a12345D can induce different autophagy phenotype in plants, we generated GFP-ATG8a/ATG18a-3xHA/atg18a, GFP-ATG8a/ATG18a12345A-3xHA/atg18a and GFP-ATG8a/ATG18a12345D-3xHA/atg18a transgenic plants. Before B. cinerea infection, the basal level of autophagosomes in GFP-ATG8a/ATG18a12345A-3xHA/atg18a was slightly stronger than that in GFP-ATG8a/ATG18a-3xHA/atg18a transgenic plants and the basal level of autophagosomes in GFP-ATG8a/ATG18a12345D-3xHA/atg18a was slightly lower than that in GFP-ATG8a/ATG18a-3xHA/atg18a transgenic plants with or without concanamycin A (ConA) treatment (). At 2 d after B. cinerea infection, we observed the same pattern and only slightly more autophagosome accumulation was observed before ConA treatment, while much more autophagosome accumulation was detected after ConA treatment in B. cinerea infected plants and it was clear that GFP-ATG8a/ATG18a12345A-3xHA/atg18a transgenic plants accumulated much more autophagosomes than GFP-ATG8a/ATG18a-3xHA/atg18a transgenic plants and GFP-ATG8a/ATG18a12345D-3xHA/atg18a transgenic plants accumulated much fewer autophagosomes than GFP-ATG8a/ATG18a-3xHA/atg18a transgenic plants (). This observation confirms that phosphorylation of ATG18a on the five sites suppresses autophagy activity in plants.
When autophagy is activated, ATG8 proteins are associated with phosphatidylethanolamine (PE) to form ATG8–PE [Citation19,Citation23] and the ATG8–PE level has been taken as a reliable tool to show the strength of autophagy activity [Citation40,Citation41]. In order to test the dynamic change of autophagy activity in resistance against B. cinerea infection, we conducted the lipidation assay to examine the ATG8–PE level at different time points before and after infection. ATG18a-GFP/atg18a, ATG18a12345A-GFP/atg18a and ATG18a12345D-GFP/atg18a transgenic plants were generated. The ATG8–PE level was weakly detected at 0 and 1 dai in those transgenic plants, but clear ATG8–PE accumulation was observed at 2 and 3 dai; interestingly, the level of ATG8–PE conjugates detected in ATG18a12345A-GFP/atg18a plants was more than twice of that in ATG18a-GFP/atg18a plants at 2 and 3 dai, while the accumulated ATG8–PE conjugates observed on ATG18a12345D-GFP/atg18a plants at 2 and 3 dai were only half of that detected on ATG18a-GFP/atg18a (). These data indicate that phosphorylation on ATG18a negatively regulates ATG8 lipidation, and dephosphorylation on ATG18a enhances ATG8 lipidation during resistance against B. cinerea. We also checked the GFP-ATG8a process before and after B. cinerea infection in those transgenic plants, which was used to measure the delivery of autophagosomes to the vacuole. Compared with GFP-ATG8a/ATG18a-3xHA/atg18a transgenic plants, there were more free GFP proteins detected in GFP-ATG8a/ATG18a12345A-3xHA/atg18a transgenic plants and there were less free GFP proteins detected in GFP-ATG8a/ATG18a12345D-3xHA/atg18a transgenic plants (). Further, we examined the protein level of NBR1, which is a substrate of autophagy degraded in the vacuole [Citation42] and has been taken as a marker for detecting autophagy activity [Citation43,Citation44]. At 2 dai, the NBR1 protein level in GFP-ATG8a/ATG18a12345A-3xHA/atg18a transgenic plants was less than that in GFP-ATG8a/ATG18a-3xHA/atg18a transgenic plants and that in GFP-ATG8a/ATG18a12345D-3xHA/atg18a transgenic plants was more than that in GFP-ATG8a/ATG18a-3xHA/atg18a transgenic plants (). Taken together, our results indicate that phosphorylation of ATG18a on the five sites suppresses the autophagy activity induced by B. cinerea infection and dephosphorylation of ATG18a on the five sites enhances it.
Phosphorylation suppresses the resistance function of ATG18a against necrotrophs
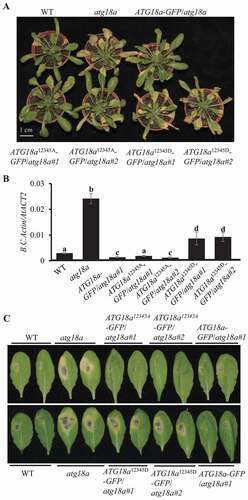
Since ATG18a12345A enhances autophagy activity and ATG18a12345D suppresses autophagy activity, we assumed that ATG18a12345A and ATG18a12345D might have different function in defense against B. cinerea. Before inoculation, wild type plants, atg18a mutant plants, ATG18a-GFP/atg18a, ATG18a12345A-GFP/atg18a, and ATG18a12345D-GFP/atg18a transgenic plants did not show any senescence phenotype (Figure S3C). At 4 dai, atg18a mutant plants showed highly susceptible phenotype (clear necrosis and yellow lesion), ATG18a12345A-GFP/atg18a transgenic plants, same as ATG18a-GFP/atg18a transgenic plants and wild type plants, showed limited phenotype on leaves, while the ATG18a12345D-GFP/atg18a transgenic plants showed more necrosis on leaves than ATG18a-GFP/atg18a transgenic plants and wild type (). The fungal biomass accumulation results by qRT-PCR showed that ATG18a12345A-GFP/atg18a transgenic plants and ATG18a-GFP/atg18a transgenic plants accumulated less amount of fungal biomass than wild type plants; while ATG18a12345D-GFP/atg18a transgenic plants accumulated much more fungal biomass than wild type plants (). Thus, it is apparent that overexpression of ATG18a12345A in atg18a mutant fully complemented the disease phenotype of atg18a mutant against B. cinerea, while overexpression of ATG18a12345D-GFP in atg18a mutant only partially restored the disease phenotype of atg18a mutant. When challenged with A. brassicicola, the atg18a mutant displayed significantly larger lesion size than the wild type plants (). In addition, overexpression of ATG18a12345A in atg18a mutant restored its disease resistance to the wild type, while overexpression of ATG18a12345D in atg18a mutant did not (). These pieces of evidence suggest that phosphorylation of ATG18a represses plant resistance against necrotrophic pathogens; while, dephosphorylation on the five sites (Ser344, Ser361, Thr241, Ser328, and Thr387) of ATG18a enhances plant resistance against necrotrophic pathogens.
Figure 4. ATG18a12345A and ATG18a12345D affect plant defense against necrotrophic fungi. (A) ATG18a12345A-GFP complement the disease phenotype of atg18a mutant to wild type against B. cinerea. Four-week-old plants were spray-inoculated with B. cinerea at 2.5 × 10⁵ spores/ml and the phenotype was checked at 4 dai. Scale bar: 1 cm. (B) Fungal biomass accumulation on plants at 4 dai. Fungal growth was determined by qPCR amplification of the B.cinerea ActinA gene relative to Arabidopsis ACT2 gene. The data represent mean values ± SD (n = 3). The mean values following by different letters are significantly different from each other (p < 0.01, Student’s t-test). The experiment was repeated three times with similar results. (C) The disease phenotype of ATG18a12345A-GFP/atg18a and ATG18a12345D-GFP/atg18a plants to Alternaria brassicicola. Four-week-old plants were drop-inoculated with A. brassicicola at 2.5 × 10⁵ spores/ml and the phenotype was checked at 4 dai. The experiment was repeated three times with similar results. WT, wild type. Scale bar: 1 cm
It was reported that ATG18a interacts with a key resistance protein WRKY33 in resistance against necrotrophic pathogens. So, we assumed that phosphorylation on ATG18a might affect its interaction with WRKY33. At first, the subcellular localization of ATG18a12345A-GFP and ATG18a12345A-GFP proteins in Arabidopsis was checked. ATG18a12345A-GFP was found in the cytoplasm and the nuclei, while ATG18a12345D-GFP was only found in the nuclei. This indicates that phosphorylation on ATG18a changes its subcellular localization (Figure S3D). Next, we check their interaction with WRKY33 in BiFC assay. The results showed that both ATG18a12345A and ATG18a12345D proteins interacted well with WRKY33, similar to ATG18a protein (Figure S3E).
To analyze the function of different ATG18a forms against hemibiotrophic pathogen, those transgenic plants were challenged with Pseudomonas syringae pv. tomato strain DC3000 (Pst DC3000). Similar to the previous report [Citation16], atg18a mutant was more resistant against Pst DC3000 than wild type plants and overexpression of ATG18a complemented the disease phenotype of atg18a mutant to wild type plant (Figure S3F). Overexpression of ATG18a12345A partially complemented the disease phenotype of atg18a mutant, but ATG18a12345D-GFP/atg18a plants showed the same phenotype as atg18a mutant (Figure S3F). The results were consistent with the previous reports that autophagy pathway negatively regulates disease resistance against biotrophic and hemibiotrophic pathogens [Citation16,Citation45,Citation46].
BAK1 physically interacts with and phosphorylates ATG18a
Since phosphorylation modification regulates the resistance function of ATG18a, it prompted us to identify the kinase responsible for phosphorylating ATG18a. It was reported that MPK3, MPK4, MPK6, SnRK2.6, BIK1, BKK1 and BAK1 play important roles in plant stress responses [Citation14,Citation47–51]. So, we took them as the candidate kinases responsible for phosphorylating ATG18a protein. First, we tested whether these kinases could interact with ATG18a by BiFC assay. These kinases were individually fused to the C-terminal domain of the yellow fluorescent protein (YFP) to generate MPK3-Yc, MPK4-Yc, MPK6-Yc, SnRK2.6-Yc, BIK1-Yc, BKK1-Yc and BAK1-Yc constructs; and ATG18a was fused with N-terminal domain of YFP to get ATG18a-Yn construct. When MPK3-Yc, MPK4-Yc, MPK6-Yc, SnRK2.6-Yc, BIK1-Yc and BKK1-Yc were individually co-expressed with ATG18a-Yn in Nicotiana benthamiana leaves, no YFP signal was detected ( and S4). Only co-infiltration of BAK1-Yc with ATG18a-Yn showed clear YFP signals in cytoplasm, which were not merged with the DAPI signal (), indicating that BAK1 interacted with ATG18a in cytoplasm. This conclusion was further consolidated with the luciferase complementation imaging (LCI) assay showing a strong signal with co-expression of ATG18a-cLuc and BAK1-nLuc in N. benthamiana (). Next, we crossed ATG18a-3xHA/atg18a with Pronative:BAK1-GFP/Col-0 [Citation52] to generate Arabidopsis transgenic plants expressing both ATG18a-3xHA and BAK1-GFP and performed co-immunoprecipitation (Co-IP) assay using GFP-conjugated beads followed by anti-HA immune blot to test BAK1 and ATG18a interaction in vivo. As shown in , ATG18a-3xHA was precipitated with BAK1-GFP, while the control experiment where BAK1-GFP was co-expressed with an empty vector expressing the 3xHA epitope alone did not show any interaction signal. Together, the results indicate that ATG18a indeed interacts with BAK1 in vivo.
Figure 5. BAK1 interacts with and phosphorylates ATG18a. (A) BiFC assay to screen ATG18a interacting proteins in N. benthamiana. ATG18a-Yn was co-infiltrated with BAK1-Yc, BKK1-Yc, and Yc in N. benthamiana. Yellow fluorescence signal was checked at 48-h after infiltration, and DAPI staining was used to detect nuclei. The experiment was repeated three times with similar results. Bars: 25 μm. (B) Split luciferase assay to check the interaction between ATG18a and BAK1. The Agrobacterium carrying the indicated constructs were co-ninfiltrated and transiently expressed in N. benthamiana. The positive luminescence monitored by a CCD camera indicates interaction. The experiment was repeated three times with similar results. Scale bar: 1 cm. (C) Coimmunoprecipitation assay to check the interaction of ATG18a with BAK1. Transgenic plants carrying BAK1pro:BAK1-GFP and 35s:ATG18a-3xHA constructs and transgenic plants carrying BAK1pro:BAK1-GFP and 35s:3xHA constructs were used for Co-IP. Proteins isolated from 7-d old seedlings were immunoprecipitated by anti-GFP beads and western-blotted by anti-GFP and anti-HA antibodies. The experiment was repeated three times with similar results. (D) In vitro phosphorylation of ATG18a by BAK1. GST-ATG18a, GST-BAK1 and GST- BAK1D416N were expressed and purified in E. coli and GST tag of those purified proteins were digested by the enzyme. The experiment was repeated three times with similar results. (E) Mutation of BAK1 suppressed the phosphorylation level of ATG18a. Four-week old ATG18a-GFP/WT and ATG18a-GFP/bak1-4 transgenic plants were inoculated with B. cinerea and leaf samples were collected at 0, 1 and 2 dai. ATG18a-GFP proteins were immunoprecipitated by using anti-GFP beads, then they werewestern blotted by using anti-GFP and anti-phosphate antibodies. The signal gotten by anti-GFP was used to present the amount of total ATG18a protein. The signal gotten by using anti-phosphate antibody was used to present the amount of phosphorylated ATG18a protein. Ratio = phosphate signal:total ATG18a, and the ratio was used to present the relative level of phosphorylated ATG18a protein. The experiment was repeated three times with similar results. (F) LC-MS/MS assay showed that only Ser344 on ATG18a was phosphorylated before B. cinerea inoculation in ATG18a-GFP/bak1-4 transgenic plants. To identify the phosphorylation sites on ATG18a in bak1-4 mutant before B. cinerea inoculation, the leaf samples of 35s:ATG18a-GFP/bak1-4 transgenic plants were collected and the ATG18a-GFP protein immunoprecipitated by anti-GFP antibody was sent for LC-MS/MS. The MS analysis covered 60% of the total ATG18a protein and identified one monophosphorylated peptide: IAPDSTPSSPSSSLSLFK. (G) LC-MS/MS assay showed that only Ser344 on ATG18a was phosphorylated at 24 h after B. cinerea inoculation in ATG18a-GFP/bak1-4 transgenic plants. To identify the phosphorylation sites on ATG18a in bak1-4 mutant after B. cinerea inoculation, the leaf samples of 35s:ATG18a-GFP/bak1-4 transgenic plants at 24 h after B. cinerea inoculation were collected and the ATG18a-GFP protein immunoprecipitated by anti-GFP antibody was sent for LC-MS/MS. The MS analysis covered 66.61% of the total ATG18a protein and identified one monophosphorylated peptide: IAPDSTPSSPSSSLSLFK
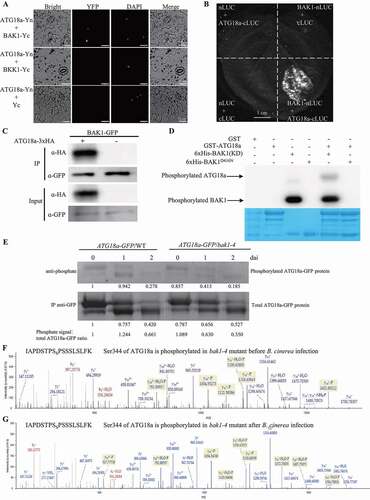
To confirm the function of BAK1 on ATG18a phosphorylation, we generated recombinant constructs encoding GST-ATG18a, 6xHis-BAK1 kinase domain (KD) and 6xHis-BAK1D416N kinase domain (a kinase dead variant). Those constructs were expressed in E. coli, and the purified recombinant proteins were used for in vitro phosphorylation test. As shown in , BAK1, but not BAK1D416N, directly phosphorylated ATG18a in the presence of [32P]-gamma-ATP.
Phosphorylation level of ATG18a is regulated by BAK1
Next, we tried to figure out the phosphorylation level and phosphorylation sites on ATG18a regulated by BAK1. ATG18a-GFP/WT and ATG18a-GFP/bak1-4 transgenic plants were generated and treated with B. cinerea. Leaf samples at 0, 1, and 2 dai were collected individually. ATG18a-GFP proteins immunoprecipitated from those leaf samples by anti-GFP antibody were western blotted by anti-phosphate antibody. The ratio (anti-phosphate signal:total ATG18a-GFP signal) was used to present the relative phosphorylation level. Interestingly, two clear bands in ATG18a-GFP/WT and ATG18a-GFP/bak1-4 transgenic plants were detected by anti-phosphate antibody, indicating both of the two bands in contained phosphorylated ATG18a proteins. In ATG18a-GFP/WT plants, the relative phosphorylation level of ATG18a protein was increased at 1 dai and then reduced at 2 dai (). Compared with wild type plants, mutation of BAK1 does not significantly change the relative phosphorylation level of ATG18a before infection. But the relative phosphorylation level of ATG18a protein in bak1-4 plants was only a half of that detected in wild type plants at 1 and 2 dai (). This data indicates that BAK1 is a major kinase responsible for the phosphorylation level on ATG18a after B. cinerea infection.
In order to check whether knockout of BAK1 also affects phosphorylated sites on ATG18a, we did IP-LC-MS/MS to check the phosphorylation sites on ATG18a-GFP in ATG18a-GFP/bak1-4 transgenic plants. Leaf samples of ATG18a-GFP/bak1-4 transgenic plants were collected before and after B. cinerea infection. Then, ATG18a-GFP proteins were immunoprecipitated by anti-GFP antibody and were sent for LC-MS/MS. Interesting, only phosphorylated Ser344 on ATG18a was detected in ATG18a-GFP/bak1-4 transgenic plants before and after B. cinerea infection (). These observations suggest that phosphorylation on ATG18a at Thr241, Ser328, Ser361, and Thr387 is completely dependent on BAK1 after B. cinerea infection, and phosphorylation of Ser344 on ATG18a may be independent on BAK1.
BAK1 negatively regulates autophagy during resistance against B. cinerea
The relationship between ATG18a and BAK1 proteins indicated that BAK1 might regulate autophagy pathway. To test this possibility, we checked the autophagy phenotype of bak1 mutant through protoplast assay. When GFP-ATG8a was expressed in the protoplasts of bak1-4 mutant, a lot of autophagosomes were observed; but, when GFP-ATG8a and BAK1-3xHA were co-expressed in the protoplasts of bak1-4 mutant, only a few autophagosomes were detected (Figure S5A). In order to confirm the results, we also tested bak1-5 mutant and got the same results (Figure S5B). Those data suggest that BAK1 functions as a suppressor of autophagy pathway. In order to confirm the kinase activity of BAK1 is required for suppressing autophagy, the BAK1 kinase dead variant BAK1D416N-3xHA was coexpressed with GFP-ATG8a in the protoplasts of bak1-4 and bak1-5 mutants, and the same level of autophagosome accumulation as that in bak1 mutants was observed (Figure S5A-S5C). It indicates that the kinase activity of BAK1 is required for inhibiting autophagy.
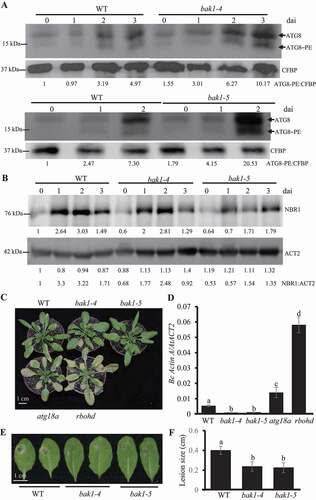
Next, we tried to test the function of BAK1 in inducing autophagy during B. cinerea infection. The wild type plant, bak1-4 mutant and bak1-5 mutant plants were treated with B. cinerea and the ATG8 lipidation assay was used to detect the ATG8–PE level on leaf samples collected before and after B. cinerea infection. As shows, the ATG8–PE levels in bak1-4 and bak1-5 mutants at all time points were higher than that in wild type plants. Also, the protein levels of NBR1 in bak1-4 and bak1-5 mutants were much lower than that in wild type plants before and after B. cinerea infection (). Taken together, those observations indicate that BAK1 negatively regulates autophagy activity.
Figure 6. BAK1 suppresses autophagy and defense against B. cinerea. (A) Western blot to detect the ATG8 lipidation level in wild type and bak1-4 and bak1-5 mutant plants before and after B. cinerea inoculation. Four-week old wild type, bak1-4 mutant and bak1-5 mutant plants were spray-inoculated with B. cinerea at 2.5 × 10⁵ spores/ml and leaf samples were collected at 0, 1, 2, and 3 dai, respectively. Membrane fractions were blotted with ATG8 antibody. Western blotting with Arabidopsis CFBP antibody was used as the loading control. Relative intensity of ATG8–PE normalized to the loading control was shown below to present autophagy accumulation. The experiment was repeated three times with similar results. (B) Western blot to detect the accumulation of NBR1 protein in wild type plants and bak1-4 and bak1-5 mutant plants before and after B. cinerea infection. Four-week old wild type, bak1-4 mutant and bak1-5 mutant plants were spray-inoculated with B. cinerea at 2.5 × 10⁵ spores/ml and leaf samples were collected at 0, 1, 2, and 3 dai, respectively. Total protein was blotted with NBR1 antibody and Arabidopsis ACT2 antibody. The ratio (the protein level of NBR1 divided by the protein level of Arabidopsis ACT2) was used to show the relative protein levels of NBR1. The experiment was repeated three times with similar results. (C) bak1 mutant phenotype to resistance against B. cinerea. Four-week-old plants were spray-inoculated with B. cinerea at 2.5 × 10⁵ spores/ml and the phenotype was checked at 4 dai. The experiment was repeated three times with similar results. WT, wild type. Scalebar: 1 cm. (D) Fungal biomass accumulation assay measured by qRT-PCR revealed that bak1 mutants suppressed B. cinerea growth. Fungal growth was determined by qRT-PCR amplification of the B. cinerea ActinA gene relative to Arabidopsis ACT2 gene. The data represent mean values ± SD (n = 3). The mean values following by different letters are significantly different from each other (p < 0.01, Student’s t-test). The experiment was repeated three times with similar results. (E) The disease phenotype of Arabidopsis bak1 mutant to A. brassicicola. Four-week-old plants were drop-inoculated with A. brassicicola at 2.5 × 10⁵ spores/ml and the phenotype was checked at 4 dai. The experiment was repeated three times with similar results. WT, wild type. Scale bar: 1 cm. (F) The diameter of lesion size of inoculated bak1 mutant leaves by A. brassicicola. Four-week-old plants were drop-inoculated with A. brassicicola at 2.5 × 10⁵ spores/ml and the phenotype was checked at 4 dai. The experiment was repeated three times with similar results. WT, wild type
BAK1 negatively regulates resistance against B. cinerea
In order to validate the function of BAK1 in plant immunity against B. cinerea, we challenged the wild type, bak1-4 and bak1-5 mutant plants with B. cinerea, by taking ATG18a and rbohd mutant plants as controls. Since BAK1 is critical for activating PTI and mutation of BAK1 significantly suppresses PTI [Citation53], we included another PTI-deficient mutant, rbohd mutant in this assay as the control. Before inoculation, all plants grew well and no senescence phenotype was observed; although no macroscopic spots were observed on the leaves of bak1-4 mutant, microscopic spots cannot be excluded (Figure S5D). Interestingly, bak1-4 and bak1-5 mutants showed more resistant response than the wild type plant at 4 dai, while atg18a and rbohd mutants showed a more susceptible response than the wild type plant (). The fungal biomass assay tested by qRT-PCR also supported the results (). These pieces of evidence indicate that BAK1 negatively regulates plant resistance against B. cinerea. The susceptible phenotype of rbohd mutant supported the previous report that PTI positively regulates resistance against B. cinerea [Citation2,Citation14]. The enhanced resistance phenotype of bak1 mutants to B. cinerea indicates that the increased autophagy activity in bak1 mutants is strong enough to fight against B. cinerea even PTI is deficient in bak1 mutants. Next, we inoculated bak1 mutants with A. brassicicola, and it was observed that the wild type plant leaves showed yellow lesions, while the leaves of both bak1-4 and bak1-5 mutants did not show yellow necrosis and the lesion size on bak1 mutants were significantly smaller than that on the wild type plants (). Thus, our results indicate that BAK1 negatively regulates resistance against necrotrophic pathogens.
ATG18a acts genetically downstream from BAK1 in plant defense and autophagy
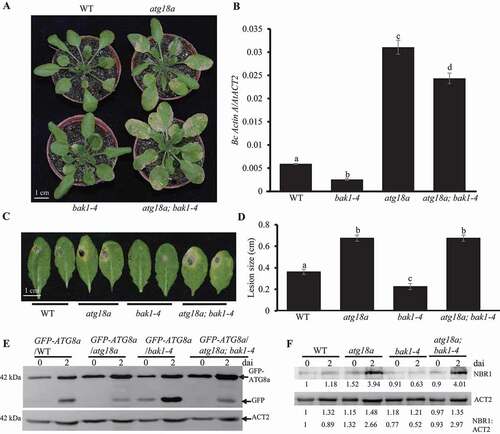
In order to understand the genetic relationship between BAK1 and ATG18a, the atg18a mutant was crossed with bak1-4 mutant to generate atg18a; bak1-4 double mutant and those plants were challenged with B. cinerea. Before inoculation, none of those plants showed senescence phenotype (Figure S5E). As shown in , atg18a mutant was more susceptible and bak1-4 was more resistant than wild type plant; while, the double mutant is susceptible to B. cinerea, similar to the phenotype of atg18a mutant. The fungal biomass assay tested by qRT-PCR also showed that the fungal biomass accumulated on atg18a mutant and atg18a; bak1-4 double mutant was much more than that on wild type plants and the fungal biomass on atg18a; bak1-4 double mutant was similar to that on atg18a mutant (). After inoculation with A. brassicicola, a similar disease phenotype was observed: atg18a; bak1-4 double mutant, similar to atg18a mutant, was more susceptible to A. brassicicola than the wild type plant (). It indicates that ATG18a functions in the downstream of BAK1 in resistance against necrotrophic pathogens. In order to check their relationship in the autophagy pathway, GFP-ATG8a/atg18a; bak1-4 transgenic plants were generated. And the GFP-ATG8a processing assay showed that the free GFP protein level in GFP-ATG8a/atg18a; bak1-4 transgenic plants were similar to that in GFP-ATG8a/atg18a transgenic plants (). Moreover, the NBR1 protein levels in WT, atg18a, bak1-4 and atg18a; bak1-4 double mutant were checked by using anti-NBR1 antibody. The NBR1 protein level in the atg18a; bak1-4 double mutant was similar to that in atg18a mutant plants and was higher than that in bak1-4 mutant and wild type plants at 2 dai (). Together, our results indicate that ATG18a acts genetically downstream from BAK1 in plant defense and autophagy during defense against B. cinerea.
Figure 7. ATG18a functions on the downstream of BAK1 in response to B. cinerea. (A) The disease phenotype of atg18a; bak1 double mutant to B. cinerea. Four-week-old plants were spray-inoculated with B. cinerea at 2.5 × 10⁵ spores/ml and the phenotype was checked at 4 dai. The experiment was repeated three times with similar results. WT, wild type. Scale bar: 1 cm. (B) Fungal biomass accumulation assay measured by qRT-PCR revealed that bak1 mutants suppressed B. cinerea growth. Fungal growth was determined by qRT-PCR amplification of the B. cinerea ActinA gene relative to Arabidopsis ACT2 gene. The data represent mean values ± SD (n = 3). The mean values following by different letters are significantly different from each other (p < 0.01, Student’s t-test). The experiment was repeated three times with similar results. (C) The disease phenotype of atg18; bak1 double mutant to Alternaria brassicicola. Four -week-old plants were drop-inoculated with A. brassicicola at 2.5 × 10⁵ spores/ml and the phenotype was checked at 4 dai. The experiment was repeated three times with similar results. WT, wild type. Scale bar: 1 cm. (D) The diameter of lesion size of inoculated leaves by A. brassicicola. Four -week-old plants were drop-inoculated with A. brassicicola at 2.5 × 10⁵ spores/ml and the phenotype was checked at 4 dai. The experiment was repeated three times with similar results. WT, wild type. (E) The GFP-ATG8a processing assay. GFP-ATG8a/WT, GFP-ATG8a/atg18a, GFP-ATG8a/bak1-4 and GFP-ATG8a/bak1-5 transgenic plants were inoculated with B. cinerea. Leaf samples were taken at 0 and 2 dai for western blot to check the protein levels of GFP-ATG8a and GFP. The protein level of Arabidopsis ACT2 detected by western blot was used as the loading control. (F) The NBR1 protein accumulation level in WT, atg18a, bak1-4, bak1-5 and atg18a; bak1-4 double mutant before and 2 d after B. cinerea inoculation. Four-week old wild type atg18a, bak1-4, bak1-5 and atg18a; bak1-4 double mutant plants were spray-inoculated with B. cinerea at 2.5 × 10⁵ spores/ml and leaf samples were collected at 0 and 2 dai, respectively. Total protein samples were blotted with NBR1 antibody and ACT2 antibody. Relative intensity of NBR1 normalized to the loading control (the intensity of ACT2) was shown below to present the relative NBR1 protein level. The experiment was repeated three times with similar results
Discussion
Autophagy plays critical functions in senescence, nutrient recycling and abiotic stress [Citation20]. Also, it was reported to play positive roles in resistance against necrotrophic pathogens and ATG18a is required for this defense process [Citation17]. But little is known about how plants regulate ATG18a protein to activate autophagy during resistance against necrotrophic pathogens. In this study, we reported that phosphorylation modification on ATG18a plays negative roles in regulating its function in autophagy and defense against B. cinerea and five amino acids (Ser344, Ser361, Thr241, Ser328, and Thr387) on ATG18a were found to be phosphorylated during the early stage of B. cinerea infection. Moreover, BAK1 was identified to physically interact with and directly phosphorylate ATG18a and mutation of BAK1 blocks phosphorylation on four (Ser361, Thr241, Ser328, and Thr387) of the five sites on ATG18a and enhances plant resistance against necrotrophs through increasing autophagy activity. So, it is possible that necrotrophic pathogens hijack BAK1 to suppress autophagy pathway to help disease development.
Protein phosphorylation is a common mode for regulating autophagy. In yeast Pichia pastoris, PpATG18 protein is regulated by phosphorylation and the phosphorylation sites (Ser388, Ser391, Ser492 and Ser495) are in the blades 6 and 7 [Citation25]. Although PpATG18a mutant is defective of autophagy, phosphorylated PpATG18a does not affect its autophagy activity. In this study, we found that phosphorylation modification on ATG18a inhibits its function in activating autophagy. Dephosphorylated form ATG18a12345A enhances ATG8 lipidation and promotes the accumulation of autophagosomes, while phosphorylated form ATG18a12345D suppresses autophagy activity (). Also, five phosphorylation sites (Thr241, Ser328, Ser344, Ser361 and Thr387) on ATG18a in vivo after B. cinerea infection are in blades 4, 6 and 7, different from the PpATG18 phosphorylation pattern in blades 6 and 7 (Figure S2B). This indicates that plants and yeasts may use different mechanisms to regulate the function of ATG18 in autophagy. Another possibility is that the different phosphorylation patterns on ATG18 proteins may regulate different functions of phosphorylated ATG18a and PpATG18 proteins.
ATG18a is critical for resistance against B. cinerea [Citation17]. Since it localizes both in cytoplasm and nuclei, two different resistance mechanisms of ATG18a has been proposed: 1) ATG18a enhances resistance through activating autophagy in cytoplasm, 2) ATG18a activates the expression of resistance gene through interaction with transcription factor WRKY33 in nuclei, which is the key positive regulator in resistance against B. cinerea [Citation17,Citation31–34,Citation54]. In this study, we observed that NES signal peptide fused on the N terminus of ATG18a could efficiently trap ATG18a protein in the cytoplasm. Disease assay showed that NES-ATG18a is sufficient to complement the disease phenotype of atg18a mutant to wild type against B. cinerea (). And NES-ATG18a can effectively induce autophagy when expressed in atg18a mutant (Figure S1E and S1F). Those pieces of evidence confirm that ATG18a regulates resistance response mainly in cytoplasm. We also tried multiple ways to trap ATG18a in the nuclei, but none of them can efficiently keep the ATG18a in the nuclei. So, we cannot exclude the possibility that ATG18a may activate other pathways to defense against B. cinerea. Since it was observed that reduced autophagy activity by expression of phosphorylated ATG18a in ATG18a mutant plants also showed attenuated plant resistance against B. cinerea, we conclude that the cytoplasm activity of ATG18a plays critical roles in resistance.
Several lines of evidence indicate that BAK1 plays critical roles in regulating plant growth, cell death and plant immunity [Citation53]. Initially, BAK1 was identified as the co-receptor for BRI1, the receptor of brassinosteroid (BR) and regulates BR signaling [Citation55,Citation56]; the cell death suppressed by BAK1 involves with protein glycosylation pathway [Citation57]; also, BAK1 positively regulates the initiation of PAMP/DAMP-triggered immunity (PTI) by physically interacting with FLS2 (flagellin sensing 2), EFR (elongation factor [EF]-Tu receptor) and Pep receptors (PEPR1 and PEPR2), which recognize bacteria-derived PAMPs (flagellin and EF-Tu) and plant-derived DAMP (Pep), respectively [Citation58–61]. Here, we show a new function of BAK1 that suppresses autophagy. ATG8–PE assay and the protein level of NBR1 indicates that mutation of BAK1 enhances autophagy activity (); overexpression of BAK1 in bak1 mutant protoplasts suppresses the autophagy signal (Figure S5A-S5C). Interestingly, autophagy has been proved by multiple groups to positively enhances resistance against necrotrophic pathogens [Citation16–18]. It indicates BAK1 plays negative roles in resistance against necrotrophs, and the disease assay also confirmed that bak1 mutant showed enhanced resistance against B. cinerea and A. brassicicola (). It is inconsistent with the previous report that bak1 mutants were more susceptible to B. cinerea than wild type plants [Citation62]. The inconsistent results might be caused by the age of plants or different growth conditions. Normally, older plants are more susceptible than younger plants, which is caused by the enhanced senescence in older plants. Under our growth conditions, bak1-4 mutant starts to show senescence phenotype at 40-d old and autophagy-deficient mutants start to show senescence phenotype at 45-d old. The disease phenotypes of autophagy-deficiency mutant against biotrophs and necrotrophs were reported to be related to the early senescence phenotype [Citation18,Citation46,Citation63]. In order to alleviate the effect of senescence, 30-d old plants were used to test the disease phenotype and autophagy phenotype; and no senescence phenotype was observed on all tested plants before infection (Figure S3C, S5D and S5E). Our results indicate that the function of BAK1 and ATG18a in plant resistance against necrotrophs is not mainly related to senescence. Recently, it is reported that disruption of BAK1 enhances PEP2-mediated growth inhibition and the expression level of PEP2-induced defense genes; moreover, BAK1 suppresses AtPROPEP peptides (PEP epitopes)-mediated resistance to the fungal pathogen Colletotrichum higginsianum [Citation64]. Thus, BAK1 suppresses at least two resistance pathways in defense against pathogens: autophagy and PEP epitopes-mediated resistance.
In vivo assay showed that four of the five phosphorylation sites on ATG18a are dependent on BAK1, and mutation of BAK1 dramatically reduces the phosphorylation level on ATG18a (). It indicates that BAK1 is the major kinase responsible for the phosphorylation modification on ATG18a. While Ser344 site on ATG18a protein is detected in bak1-4 mutant background before and after B. cinerea infection. This means some unknown kinases are responsible for phosphorylating ATG18a on Ser344 site. BKK1, the homolog of BAK1 protein, was chosen as the best candidate but it fails to interact with ATG18a in the BiFC assay (). It indicated that BKK1 might not be the kinase responsible for the Ser344 phosphorylation in bak1-4 mutant. Another possibility is that BKK1 phosphorylates ATG18a through transient interaction, and this interaction cannot be detected by BiFC. Since those kinases targeting ATG18a genetically upstream, identification of the unknown kinases responsible for Ser344 phosphorylation will help to explain what kind of signals from outside regulates autophagy through ATG18a.
Since two bands were detected by anti-phosphate antibody (), both of the two bands in actually contained phosphorylated ATG18a protein and some phosphorylated sites did not cause band shift. Although only Ser344 phosphorylated site on ATG18a protein in ATG18a-GFP/bak1-4 was detected by LC-MS/MS, two phosphorylated bands were identified by anti-phosphate antibody. So, there are more phosphorylated sites unidentified on ATG18a protein, and Ser344 site was not the only phosphorylated site on ATG18a protein in bak1-4 mutant. So, the function of ATG18a is regulated by more phosphorylation sites, and more kinases play important roles in regulating the function of ATG18a. Also, dephosphorylation on ATG18a is critical for activating autophagy; therefore, identification of phosphatases responsible for dephosphorylating ATG18a will also give more details on how plants regulate the function of autophagy in defense in the future.
Materials and methods
Plant materials and growth conditions
Arabidopsis thaliana lines used were in Columbia-0 (Col-0) background. The mutants are atg18a (GABI_651D08), bak1-4 (SALK116202) and the atg18a; bak-1-4 double mutant was generated by genetic crossing. ATG18a coding sequence (CDS), ATG18a (241,328, 344, 361, 387A), ATG18a (241,328 344, 361, 387D) were PCR amplified and fused to GFP, then it was driven by the CaMV 35s promoter in wild type ecotype Col-0 and atg18a mutant plants, resulting in 35s:ATG18a-GFP, 35s:ATG18a(241,328,344,361,387A)-GFP, 35s:ATG18a (241,328 344, 361, 387D)-GFP transgenic plants. Multiple independent transgenic lines were obtained, and two representative lines were assayed in parallel. Agrobacterium-mediated Arabidopsis plant transformation was performed by a modified floral dip method [Citation65]. A. thaliana plants were grown in growth chambers at 22°C and 120 μE m−2 s−1 light on a photoperiod of 12 h light and 12 h dark [Citation17].
Pathogen inoculation
Growth of B. cinerea strain B05-10 and A. brassicicola on 2xV8 agar, conidia collection, and spray inoculation using a Preval sprayer were as previously described [Citation31]. Inoculated plants were covered with a plastic dome to maintain high humidity, and symptom development was observed at 4 dai (days after inoculation).
Growth of P. syringae pv. tomato DC3000 strain on King’B medium (Sigma-Aldrich, 60786) supplemented with 100 μg/ml rifamycin (Sigma-Aldrich, R3501). The infiltration inoculation method was as previously described [Citation66].
Phosphatase treatment
Arabidopsis transgenic seedlings were ground to a fine powder in liquid nitrogen. Proteins were extracted in buffer containing 50 mM Tris-HCl, pH 7.5, 100 mM NaCl; 2 mM EDTA (Sigma-Aldrich, V900106); 1 mM NaF (Sigma-Aldrich, S7920); 1 mM NaVO3 (Sigma-Aldrich, 590088); 1 mM PMSF (Roche, 10837091001); 10 mM beta-glycerol phosphate (Sigma-Aldrich, 50020); 0.5% (v/v) Triton X-100 (Sigma-Aldrich, X100); and 1xprotease inhibitor cocktail (Sigma-Aldrich, P8340). Extracts were incubated 10 min at 4°C and centrifuged for 10 min at 12,000 g at 4°C. Add 10 mg sample, 5 μl of 10 x NEB Buffer, 5 μl of 10 mM MnCl2, H2O2 and 1 µl of Lambda Protein Phosphatase (NEB, 0753) to make a total reaction volume of 50 µl, incubate at 30°C for 30 min, add 6xSDS loading buffer to stop reaction.
ATG8 lipidation assay
The detection of ATG8 and ATG8–PE was conducted according to the previous report [Citation67]. The cell membrane fraction was isolated by 45-min centrifugation at 100,000 g. Then the pellets were separated on 15% SDS-PAGE gel with 6 M urea (Sigma-Aldrich, V900119). Western blot assays were done with antibodies against Arabidopsis ATG8 (Agrisera, AS14 2811) and Arabidopsis CFBP (Agrisera, AS04 043).
BiFC assay
DNA sequences of the N-terminal, 173–amino acid, enhanced YFP (N-YFP) and C-terminal, 64–amino acid (C-YFP) fragments were PCR amplified and cloned into pFGC5941 (TAIR, CD3-447) to generate pFGC-N-YFP and pFGC-C-YFP, respectively [Citation66]. The ATG18a coding sequences were inserted into pFGC-N-YFP to generate the N-terminal in-frame fusions with N-YFP, whereas BAK1, BKK1, BIK1, MPK3, MPK4, MPK6 and SnRK2.6 coding sequences were introduced into pFGC-C-YFP to form N-terminal in-frame fusions with C-YFP. The resulting clones were verified through sequencing, then the plasmids were introduced into Agrobacterium tumefaciens (strain GV3101), and infiltration of N. benthamiana was performed as described previously [Citation66]. Infected tissues were analyzed at ~48 h after infiltration. Fluorescence and DAPI were visualized using a Leica SP8 confocal microscope; YFP was excited with a 489 nm laser line and detected from 500–580 nm.
Luciferase complementation imaging assays
The CDS of ATG18a were inserted into the pCAMBIA1300-nLuc vector [Citation68] using the SalI and BamHI restriction enzyme sites. The CDS sequence of BAK1 was inserted into the pCAMBIA1300-cLuc vector using the KpnI and BamHI sites. Agrobacterium strain GV3101 carrying the indicated constructs were cultured to OD600 0.5 and incubated at room temperature for 3 h before being infiltrated into N. benthamiana leaves. Luciferase activity was detected 2 d after infiltration through the NightSHADE LB 985 imaging system (Berthold Technologies), and ten minutes before detection, 0.1 mM luciferin (Promega, E1602) was sprayed on the infiltrated leaves.
IP-Ms-spec
The ATG18a-GFP fusion sequences were subcloned into the pFGC5941 vectors, and the expression constructs were driven by the CaMV 35s promoter and transferred into the Arabidopsis Col-0 and bak1 mutant. Arabidopsis transgene seedlings were ground to a fine powder in liquid nitrogen. Proteins were extracted in buffer containing 50 mM Tris-HCl, pH 7.5, 100 mM NaCl; 2 mM EDTA (Sigma-Aldrich, V900106); 1 mM NaF (Sigma-Aldrich, S7920); 1 mM NaVO3 (Sigma-Aldrich); 1 mM PMSF (Roche, 10837091001); 10 mM beta-glycerol phosphate (Sigma-Aldrich, 50020); 0.5% (v/v) Triton X-100 (Sigma-Aldrich, X100); and 1x protease inhibitor cocktail (Sigma-Aldrich, P8340). Extracts were incubated 40 min at 4°C and centrifuged for 15 min twice at 13,000 rpm at 4°C. The supernatant was incubated for 3 h at 4°C with GFP-Trap Agarose (ChromoTek, gta-100), and was washed 3–4 times with extraction buffer without protease inhibitor cocktail (Sigma-Aldrich, P8340). For GFP-Trap immunoprecipitation, beads were eluted by pH 2.0 glycine buffer (Thermo Fisher Scientific, BP381-500) to release proteins. Proteins were loaded into SDS-PAGE gel, then the gel was stained with Coomassie Brilliant Blue R 250 (Sigma-Aldrich, 1154440025), and send target bands to Center of biomedical Analysis, Tsinghua University for Ms-Spec analysis.
Co-immunoprecipitation
Arabidopsis transgene seedlings, which grow in MS medium for two weeks, were ground to a fine powder (~0.5 g) in liquid nitrogen. Total proteins were extracted with 1 ml protein extraction buffer (50 mM Tris-HCl, pH 7.5, 100 mM NaCl; 2 mM EDTA [Sigma-Aldrich, V900106]; 1 mM NaF; 1 mM NaVO3 [Sigma-Aldrich, 590088]; 1 mM PMSF [Roche, 10837091001]; 10 mM beta-glycero phosphate [Sigma-Aldrich, 50020]; 0.5% (v/v) Triton X-100 [Sigma-Aldrich, X100]; and 1xprotease inhibitor cocktail [Sigma-Aldrich, P8340]). Extracts were incubated 40 min at 4°C and centrifuged for 15 min twice at 13,000 rpm at 4°C. Supernatants were incubated for 3 h at 4°C with GFP-Trap (ChromoTek, gta-100) and washed 3–4 times with extraction buffer lacking protease inhibitor cocktail; beads were eluted by pH 2.0 glycine buffer (Thermo Fisher Scientific) to release proteins. Twenty percent of the eluted proteins were used as immunoprecipitation control, anti-GFP (Genscript, A00185-40) and anti-HA antibodies (NewEast Biosciences, 28003) were used for the immunological detection of BAK1-GFP and ATG18a-HA fusion proteins, respectively.
Recombinant protein and in vitro phosphorylation assay
In order to generate a 6xHis N-terminal fusion of the BAK1 kinase domain, the sequence coding for the BAK1 kinase domain (255 aa-615 aa) was introduced into the pET-28b expression vector. To produce an inactive kinase fusion protein of BAK1 kinase domain, a point mutation at the kinase active site (D416N) was introduced into the pET-28b (Sigma-Aldrich, 59865) expression vector. The 6xHis- BAK1KD and 6xHis- BAK1D416N fusion proteins were expressed in the E. coli strain BL21 (NEB, C2527H). After overnight induction at 16°C with 0.2 mM IPTG (Sigma-Aldrich, I6758), the bacteria were pelleted by centrifugation, resuspended in 50 ml lysis buffer (50 mM Tris-HCl pH 7.5, 0.4 M NaCl, 10% glycerol [Sigma-Aldrich, V900122], 0.1% PMSF [Roche, 10837091001] and 0.02% mercaptoethanol [Sigma-Aldrich, M6250]), and sonicated it. The soluble His-tagged proteins were affinity purified using a HisTrap column (Cytiva, 17524701) according to the manufacturer’s instructions, purified 6xHis-BAK1KD and 6xHis- BAK1D416N were detected by western blot.
To generate GST-tagged ATG18a, the sequence coding for the ATG18a, ATG18a(344A), ATG18a(344D), ATG18a (344A, 361A), ATG18a (241A, 328A, 361A, 387A), ATG18a (241A, 328A, 344A, 361A, 387A) were introduced into the PGEX-28b (GE Healthcare, 28–9545-49) expression vector, using the E. coli strain BL21 (NEB, C2527H) and purified using GST Trap column (Cytiva, 17513002) following the manufacturer’s instructions. Finally, GST-tagged of purified protein were digested and get target protein of ATG18a, ATG18a (344A, 361A), ATG18a (241A, 328A, 361A, 387A), ATG18a (241A, 328A, 344A, 361A, 387A).
In vitro kinase assay was performed as described previously [Citation69]. Briefly, kinase reactions were performed in 30 μl of kinase buffer (20 mM Tris·HCl, pH 7.5, 10 mM MgCl2, 5 mM EDTA [Sigma-Aldrich, V900106], 100 mM NaCl, and 1 mM DTT [Sigma-Aldrich, 10197777001]) containing 10 μg of fusion proteins with 0.1 mM cold ATP and 5 μCi of [32P]-gamma-ATP (Perkinelmer, BLU502A500UC) at 30°C for 1 h with gentle shaking. The reactions were stopped by adding 4xSDS loading buffer. The phosphorylation of fusion proteins was analyzed by autoradiography after separation through SDS/PAGE.
Transient expression in arabidopsis protoplasts and microscopy analyses
Protoplasts were prepared from Arabidopsis rosette leaves, each transformed using 10–20 μg of plasmid DNA via the PEG method [Citation70]. Transformed protoplasts were incubated in darkness for 20 h, concanamycin A (Sigma-Aldrich, L7647) or dimethyl sulfoxide (DMSO) (Sigma-Aldrich, D8418) was added 9 h before visualization by confocal microscopy. Confocal microscopy was performed with a Leica (Leica Microsystems) SP8 confocal microscope. Excitation and detection wavelengths were the same as those described for BiFC colocalization assays.
For autophagy activity, the absolute number of GFP-ATG8a-labeled autophagic puncta per cell or per protoplast was quantified. More than 20 cells per leaf sample or more than 30 protoplasts for each treatment were checked. Mean value is the statistical analysis based on more than 20 leaf cells or 30 protoplasts from an individual experiment. Every experiment was repeated at least three times.
RNA extraction and qRT-PCR analysis
Total RNA was isolated with Trizol reagent according to the manufacturer’s instructions (Sigma-Aldrich, 93289). DNase treatment (NEB, B0303) and complementary DNA synthesis (NEB, M0277) were performed according to the manufacturer’s instructions (New England Biolabs) using gene-specific primers with Arabidopsis ACT2 gene as an endogenous reference for normalization. Real-time PCR was conducted using the SYBR PCR Master mix (Takara, RR820) and run on the BIO-RAD CFX96 Real time system according to the manufacturer’s instructions. Quantitative real-time PCR was performed using gene-specific primers.
Protein isolation and immunoblot analysis
Arabidopsis transgene seedlings were ground to a fine powder in liquid nitrogen. Proteins were extracted in buffer containing 50 mM Tris-HCl, pH 7.5, 100 mM NaCl; 2 mM EDTA (Sigma-Aldrich, V900106); 1 mM NaF (Sigma-Aldrich, S7920); 1 mM NaVO3 (Sigma-Aldrich, 590088); 1 mM PMSF (Roche, 10837091001); 10 mM beta-glycerol phosphate (Sigma-Aldrich, 50020); 0.5% (v/v) Triton X-100 (Sigma-Aldrich, X100); and 1xprotease inhibitor cocktail (Sigma-Aldrich, P8340). Extracts were incubated 10 min at 4°C and centrifuged for 10 min at 12,000 g at 4°C, and add 6xSDS loading buffer to supernatant, and boiled for 5 min.
For immunoblotting, 10% SDS-PAGE gels were run at 80 to 150 V for 2 h before electroblotting on nitrocellulose membrane (Millipore, HATF00010) at 24 V for 1–1.5 h (according to molecule weight of protein). Membranes were rinsed in TBS-Tween 0.1% (v/v) and blocked in 5% (w/v) nonfat milk powder (Sangon Biotech, A600669) in TBS-Tween for 1 h. Primary antibodies were diluted in TBS-Tween solution to the following ratios: mouse anti-GST (Abmart, M20007) 1:5000; mouse anti-GFP 1:5000 (Genscript, A00185-40); mouse anti-HA (NewEast Biosciences, 28003) 1:5000, and incubated overnight. Membranes were washed two times in TBS-Tween before 1 h incubation with secondary antibodies anti-mouse-HRP (CWBio, CW0102S) (1:10000). Signals were visualized using an enhanced chemiluminescence system (Biosharp, BL520A) and a GeneGnome XRQ (Syngene) scanner following the manufacturer’s instructions.
Statistical analysis
In this study, Student’s t-test was used to analyze statistical significance. Data is presented as mean ± SD. Different letters are presented as ρ < 0.01.
Accession numbers
Sequence data from this article can be found in the GenBank/EMBL database or Arabidopsis Genomic Initiative under the following accession numbers: ATG18a (AT3G62770), ATG8a (AT4G21980), ATG5 (AT5G17290), ATG7 (AT5G45900), BAK1 (AT4G33430), BKK1 (AT2G13790), BIK1 (AT2G39660), CFBP (AT1G43670), MPK3 (AT3G45640), MPK4 (AT4G01370), MPK6 (AT2G43790), RbohD (AT5G47910), SnRK2.6 (AT4G33950), NBR1 (AT4G24690).
Supplemental Material
Download Zip (16.6 MB)Acknowledgments
We thank Dr. Jia Li at Lanzhou University for Pronative:BAK1-GFP/Col-0 transgenic plants, Dr. Jianmin Zhou at Institute of Genetics and Developmental Biology, Chinese Academy of Science for bak1-4 mutant, Dr. Yangrong Cao at Huazhong Agricultural University for providing Pst DC3000 strain and rbohd mutant seeds, Dr. Fengming Song at Zhejiang University for providing B. cinerea strain B05-10 and A. brassicicola, Dr. Mingqiu Dai at Huazhong Agricultural University for providing Agrobacterium tumefaciens strain GV3101, Dr. Feng Li at Huazhong Agricultural University for providing N. benthamiana seeds, Dr. Shunping Yan at Huazhong Agricultural University for providing pCAMBIA1300-nLuc vector and pCAMBIA1300-cLuc vector, Dr. Yueyun Hong at Huazhong Agricultural university for providing ultracentrifuge, Dr. Xia Li at Huazhong Agricultural University and Dr. Zuyu Zheng for critical reading of the manuscript.
Disclosure statement
No potential conflict of interest was reported by the authors.
Supplementary material
Supplemental data for this article can be accessed here.
Additional information
Funding
Related Research Data
References
- Mengiste T. Plant immunity to necrotrophs. Annu Rev Phytopathol. 2012;50:267–294.
- Lai Z, Mengiste T. Genetic and cellular mechanisms regulating plant responses to necrotrophic pathogens. Curr Opin Plant Biol. 2013;16(4):505–512.
- Prins T, Tudzynski P, Tiedemann A, et al. Infection strategies of Botrytis cinerea and related necrotrophic pathogens. In: Kronstad JW, editor. Fungal pathology. Dordrecht, The Netherlands: Kluwer; 2000. p. 33–64.
- Dean R, Van Kan JA, Pretorius ZA, et al. The top 10 fungal pathogens in molecular plant pathology. Mol Plant Pathol. 2012;13(4):414–430.
- Jones JD, Dangl JL. The plant immune system. Nature. 2006;444(7117):323–329.
- Tang DZ, Wang GX, Zhou JM. Receptor kinases in plant-pathogen interactions: more than pattern recognition. Plant Cell. 2017;29(4):618–637.
- Boller T, Felix G. A renaissance of elicitors: perception of microbe-associated molecular patterns and danger signals by pattern-recognition receptors. Annu Rev Plant Biol. 2009;60:379–406.
- Li B, Meng X, Shan L, et al. Transcriptional regulation of pattern-triggered immunity in plants. Cell Host Microbe. 2016;19(5):641–650.
- Lo Presti L, Lanver D, Schweizer G, et al. Fungal effectors and plant susceptibility. Annu Rev Plant Biol. 2015;66:513–545.
- Cui H, Tsuda K, Parker JE. Effector-triggered immunity: from pathogen perception to robust defense. Annu Rev Plant Biol. 2015;66:487–511.
- Dodds PN, Rathjen JP. Plant immunity: towards an integrated view of plant-pathogen interactions. Nat Rev Genet. 2010;11(8):539–548.
- Couto D, Zipfel C. Regulation of pattern recognition receptor signalling in plants. Nat Rev Immunol. 2016;16(9):537–552.
- Lorang J, Kidarsa T, Bradford CS, et al. Tricking the guard: exploiting plant defense for disease susceptibility. Science. 2012;338(6107):659–662.
- Laluk K, Luo H, Chai M, et al. Biochemical and genetic requirements for function of the immune response regulator BOTRYTIS-INDUCED KINASE1 in plant growth, ethylene signaling, and PAMP-triggered immunity in Arabidopsis. Plant Cell. 2011;23(8):2831–2849.
- Lenz HD, Haller E, Melzer E, et al. Autophagy controls plant basal immunity in a pathogenic lifestyle-dependent manner. Autophagy. 2011;7(7):773–774.
- Lenz HD, Haller E, Melzer E, et al. Autophagy differentially controls plant basal immunity to biotrophic and necrotrophic pathogens. Plant J. 2011;66(5):818–830.
- Lai Z, Wang F, Zheng Z, et al. A critical role of autophagy in plant resistance to necrotrophic fungal pathogens. Plant J. 2011;66(6):953–968.
- Qi H, Xia FN, Xie LJ, et al. TRAF family proteins regulate autophagy dynamics by modulating AUTOPHAGY PROTEIN6 stability in arabidopsis. Plant Cell. 2017;29(4):890–911.
- Yu L, Chen Y, Tooze SA. Autophagy pathway: cellular and molecular mechanisms. Autophagy. 2018;14(2):207–215.
- Marshall RS, Vierstra RD. Autophagy: the master of bulk and selective recycling. Annu Rev Plant Biol. 2018;69:173–208.
- Reggiori F, Ungermann C. Autophagosome Maturation and Fusion. J Mol Biol. 2017;429(4):486–496.
- Masclaux-Daubresse C, Chen Q, Have M. Regulation of nutrient recycling via autophagy. Curr Opin Plant Biol. 2017;39:8–17.
- Zhuang X, Chung KP, Luo M, et al. Autophagosome biogenesis and the endoplasmic reticulum: a plant perspective. Trends Plant Sci. 2018;23:677–692.
- Yamamoto H, Kakuta S, Watanabe TM, et al. Atg9 vesicles are an important membrane source during early steps of autophagosome formation. J Cell Biol. 2012;198(2):219–233.
- Tamura N, Oku M, Ito M, et al. Atg18 phosphoregulation controls organellar dynamics by modulating its phosphoinositide-binding activity. J Cell Biol. 2013;202(4):685–698.
- Nair U, Cao Y, Xie Z, et al. Roles of the lipid-binding motifs of Atg18 and Atg21 in the cytoplasm to vacuole targeting pathway and autophagy. J Biol Chem. 2010;285(15):11476–11488.
- Obara K, Sekito T, Niimi K, et al. The Atg18-Atg2 complex is recruited to autophagic membranes via phosphatidylinositol 3-phosphate and exerts an essential function. J Biol Chem. 2008;283(35):23972–23980.
- Xiong Y, Contento AL, Bassham DC. AtATG18a is required for the formation of autophagosomes during nutrient stress and senescence in Arabidopsis thaliana. Plant J. 2005;42(4):535–546.
- Zhuang X, Chung KP, Cui Y, et al. ATG9 regulates autophagosome progression from the endoplasmic reticulum in Arabidopsis. Proc Natl Acad Sci U S A. 2017;114(3):E426–E435.
- Xiong Y, Contento AL, Nguyen PQ, et al. Degradation of oxidized proteins by autophagy during oxidative stress in Arabidopsis. Plant Physiol. 2007;143(1):291–299.
- Zheng Z, Qamar SA, Chen Z, et al. Arabidopsis WRKY33 transcription factor is required for resistance to necrotrophic fungal pathogens. Plant J. 2006;48(4):592–605.
- Birkenbihl RP, Diezel C, Somssich IE. Arabidopsis WRKY33 is a key transcriptional regulator of hormonal and metabolic responses toward Botrytis cinerea infection. Plant Physiol. 2012;159(1):266–285.
- Liu S, Kracher B, Ziegler J, et al. Negative regulation of ABA signaling by WRKY33 is critical for Arabidopsis immunity towards Botrytis cinerea 2100. eLife. 2015;4:e07295.
- Mao G, Meng X, Liu Y, et al. Phosphorylation of a WRKY transcription factor by two pathogen-responsive MAPKs drives phytoalexin biosynthesis in Arabidopsis. Plant Cell. 2011;23(4):1639–1653.
- Kamada Y, Yoshino K, Kondo C, et al. Tor directly controls the Atg1 kinase complex to regulate autophagy. Mol Cell Biol. 2010;30(4):1049–1058.
- Papinski D, Schuschnig M, Reiter W, et al. Early steps in autophagy depend on direct phosphorylation of Atg9 by the Atg1 kinase. Mol Cell. 2014;53(3):471–483.
- Papinski D, Kraft C. Atg1 kinase organizes autophagosome formation by phosphorylating Atg9. Autophagy. 2014;10(7):1338–1340.
- Suttangkakul A, Li F, Chung T, et al. The ATG1/ATG13 protein kinase complex is both a regulator and a target of autophagic recycling in Arabidopsis. Plant Cell. 2011;23(10):3761–3779.
- Caplan JL, Kumar AS, Park E, et al. Chloroplast stromules function during innate immunity. Dev Cell. 2015;34(1):45–57.
- Bassham DC. Methods for analysis of autophagy in plants. Methods. 2015;75:181–188.
- Li F, Chung T, Pennington JG, et al. Autophagic recycling plays a central role in maize nitrogen remobilization. Plant Cell. 2015;27(5):1389–1408.
- Svenning S, Lamark T, Krause K, et al. Plant NBR1 is a selective autophagy substrate and a functional hybrid of the mammalian autophagic adapters NBR1 and p62/SQSTM1. Autophagy. 2011;7(9):993–1010.
- Yang M, Zhang Y, Xie X, et al. Barley stripe mosaic virus gammab protein subverts autophagy to promote viral infection by disrupting the ATG7-ATG8 interaction. Plant Cell. 2018;30(7):1582–1595.
- Xu G, Wang S, Han S, et al. Plant Bax Inhibitor-1 interacts with ATG6 to regulate autophagy and programmed cell death. Autophagy. 2017;13(7):1161–1175.
- Wang Y, Nishimura MT, Zhao T, et al. ATG2, an autophagy-related protein, negatively affects powdery mildew resistance and mildew-induced cell death in Arabidopsis. Plant J. 2011;68(1):74–87.
- Yoshimoto K, Jikumaru Y, Kamiya Y, et al. Autophagy negatively regulates cell death by controlling NPR1-dependent salicylic acid signaling during senescence and the innate immune response in Arabidopsis. Plant Cell. 2009;21(9):2914–2927.
- Yasuda S, Okada K, Saijo Y. A look at plant immunity through the window of the multitasking coreceptor BAK1. Curr Opin Plant Biol. 2017;38:10–18.
- Han L, Li GJ, Yang KY, et al. Mitogen-activated protein kinase 3 and 6 regulate Botrytis cinerea-induced ethylene production in <i>Arabidopsis. Plant J. 2010;64(1):114–127.
- Meng XZ, Xu J, He YX, et al. Phosphorylation of an ERF transcription factor by Arabidopsis MPK3/MPK6 regulates plant defense gene induction and fungal resistance. Plant Cell. 2013;25(3):1126–1142.
- Huang X, Hou L, Meng J, et al. The antagonistic action of abscisic acid and cytokinin signaling mediates drought stress response in Arabidopsis. Mol Plant. 2018;11(7):970–982.
- Qiu JL, Fiil BK, Petersen K, et al. Arabidopsis MAP kinase 4 regulates gene expression through transcription factor release in the nucleus. Embo J. 2008;27(16):2214–2221.
- He K, Gou X, Yuan T, et al. BAK1 and BKK1 regulate brassinosteroid-dependent growth and brassinosteroid-independent cell-death pathways. Curr Biol. 2007;17(13):1109–1115.
- Schwessinger B, Roux M, Kadota Y, et al. Phosphorylation-dependent differential regulation of plant growth, cell death, and innate immunity by the regulatory receptor-like kinase BAK1. PLoS Genet. 2011;7(4):e1002046.
- Lai Z, Li Y, Wang F, et al. Arabidopsis sigma factor binding proteins are activators of the WRKY33 transcription factor in plant defense. Plant Cell. 2011;23(10):3824–3841.
- Li J, Wen J, Lease KA, et al. BAK1, an Arabidopsis LRR receptor-like protein kinase, interacts with BRI1 and modulates brassinosteroid signaling. Cell. 2002;110(2):213–222.
- Nam KH, Li J. BRI1/BAK1, a receptor kinase pair mediating brassinosteroid signaling. Cell. 2002;110(2):203–212.
- de Oliveira MV, Xu G, Li B, et al. Specific control of Arabidopsis BAK1/SERK4-regulated cell death by protein glycosylation. Nat Plants. 2016;2:15218.
- Chinchilla D, Zipfel C, Robatzek S, et al. A flagellin-induced complex of the receptor FLS2 and BAK1 initiates plant defence. Nature. 2007;448(7152):497–500.
- Heese A, Hann DR, Gimenez-Ibanez S, et al. The receptor-like kinase SERK3/BAK1 is a central regulator of innate immunity in plants. Proc Natl Acad Sci U S A. 2007;104(29):12217–12222.
- Schulze B, Mentzel T, Jehle AK, et al. Rapid heteromerization and phosphorylation of ligand-activated plant transmembrane receptors and their associated kinase BAK1. J Biol Chem. 2010;285(13):9444–9451.
- Roux M, Schwessinger B, Albrecht C, et al. The Arabidopsis leucine-rich repeat receptor-like kinases BAK1/SERK3 and BKK1/SERK4 are required for innate immunity to hemibiotrophic and biotrophic pathogens. Plant Cell. 2011;23(6):2440–2455.
- Kemmerling B, Schwedt A, Rodriguez P, et al. The BRI1-associated kinase 1, BAK1, Has a brassinolide-independent role in plant cell-death control. Curr Biol. 2007;17(13):1116–1122.
- Munch D, Rodriguez E, Bressendorff S, et al. Autophagy deficiency leads to accumulation of ubiquitinated proteins, ER stress, and cell death in Arabidopsis. Autophagy. 2014;10(9):1579–1587.
- Yamada K, Yamashita-Yamada M, Hirase T, et al. Danger peptide receptor signaling in plants ensures basal immunity upon pathogen-induced depletion of BAK1. Embo J. 2016;35(1):46–61.
- Clough SJ, Bent AF. Floral dip: a simplified method for Agrobacterium-mediated transformation of Arabidopsis thaliana. Plant J. 1998;16(6):735–743.
- Kim KC, Lai Z, Fan B, et al. Arabidopsis WRKY38 and WRKY62 transcription factors interact with histone deacetylase 19 in basal defense. Plant Cell. 2008;20(9):2357–2371.
- Luo M, Zhuang X. Analysis of autophagic activity using atg8 lipidation assay in Arabidopsis thaliana. Bio-Protocol. 2018;8(12). DOI:https://doi.org/10.21769/BioProtoc.2880
- Chen H, Zou Y, Shang Y, et al. Firefly luciferase complementation imaging assay for protein-protein interactions in plants. Plant Physiol. 2008;146(2):368–376.
- Lu D, Wu S, Gao X, et al. A receptor-like cytoplasmic kinase, BIK1, associates with a flagellin receptor complex to initiate plant innate immunity. Proc Natl Acad Sci U S A. 2010;107(1):496–501.
- Yoo SD, Cho YH, Sheen J. Arabidopsis mesophyll protoplasts: a versatile cell system for transient gene expression analysis. Nat Protoc. 2007;2(7):1565–1572.