
ABSTRACT
Respiratory syncytial virus (RSV) is a leading cause of respiratory tract infections in infants. Macroautophagy/autophagy is a catalytic metabolic process required for cellular homeostasis. Although intracellular metabolism is important for immune responses in dendritic cells, the link between autophagy and immunometabolism remains unknown. Here, we show that the autophagy-related protein ATG5 regulates immunometabolism. Atg5-deficient mouse dendritic cells showed increased CD8A+ T-cell response and increased secretion of proinflammatory cytokines upon RSV infection. Transcriptome analysis showed that Atg5 deficiency alters the expression of metabolism-related genes. Atg5-deficient dendritic cells also showed increased activation of glycolysis and the AKT-MTOR-RPS6KB1 pathway and decreased mitochondrial activity, all of which are cellular signatures for metabolic activation. These cells also showed elevated CD8A+ T-cell priming and surface major histocompatibility complex (MHC) class I expression. Our results suggested that ATG5 regulated host immune responses by modulating dendritic cell metabolism. These findings may help develop potential antiviral therapies that alter host immunity by regulating autophagy and immunometabolism.
Abbreviations : 2-DG: 2-deoxyglucose; AAK1: AP2 associated kinase 1; AKT: AKT serine/threonine kinase; AM: alveolar macrophage; ATG: autophagy; ATP: adenosine triphosphate; BAL: bronchoalveolar lavage; BMDC: bone marrow dendritic cell; CSF2/GM-CSF: colony-stimulating factor 2 (granulocyte-macrophage); CTL: cytotoxic T lymphocyte; ELISA: enzyme-linked immunosorbent assay; GFP: green fluorescent protein; GSEA: gene-set enrichment analysis; H-2Db: H-2 class I histocompatibility antigen, D-B alpha chain; H-2Kb: MHC class I H2-K-b; HIF1A: hypoxia-inducible factor 1 alpha; IFNG: interferon-gamma; IL: interleukin; ITGAX: integrin alpha X; MAP1LC3/LC3: microtubule-associated protein 1 light chain 3; MAP1LC3B/LC3B: microtubule-associated protein 1 light chain 3 beta; MHC: major histocompatibility complex; MTORC1: mammalian target of rapamycin kinase complex 1; PBS: phosphate-buffered saline; PFU: plaque-forming unit; RLR: retinoic acid-inducible-I-like receptor; ROS: reactive oxygen species; RPMI: Roswell Park Memorial Institute; RPS6KB1/S6K: ribosomal protein S6 kinase, polypeptide 1; RSV: respiratory syncytial virus; Th: T helper; TLR: toll-like receptor; Treg: regulatory T cells; UMAP: uniform manifold approximation and projection.
Introduction
Respiratory syncytial virus (RSV) is a leading cause of lower respiratory tract infections in infants, children under 5 years of age, and immuno-compromised older adults in developed countries [Citation1]. Despite many efforts to develop vaccines or drugs for RSV, there is a current lack of therapeutic or preventive interventions for RSV, possibly because the host response to RSV infection is not well understood [Citation2].
Macroautophagy/autophagy, a highly conserved molecular pathway in eukaryotes, is a catalytic process that transports cytoplasmic substrates for lysosomal degradation [Citation3]. Autophagy-related (ATG) proteins are required for the generation of double-membraned structures called autophagosomes [Citation4]. In addition to its function in cellular homeostasis, autophagy also plays a role in pathogen recognition and cytokine responses [Citation5]. Using autophagy inhibitory molecules such as 3-methyladenine and type III phosphoinositide 3-kinase inhibitors, small interfering RNAs of the autophagy proteins, MAP1LC3/LC3 (microtubule-associated protein 1 light chain 3) or BECN1 (beclin 1), autophagy-related Becn1+/− bone marrow-derived dendritic cells (BMDCs), previous studies have shown that autophagy is required for cytokine expression during RSV infection [Citation6,Citation7]. However, it has also been shown that BMDCs lacking the autophagy-associated protein LC3B produce more cytokines, such as IL6 (interleukin 6) and IL1B, upon RSV infection [Citation8], thus implying that autophagy-related proteins may play varied roles during RSV infection.
A recent study showed that intracellular metabolism and metabolic reprogramming in dendritic cells are associated with the control of innate and adaptive immunity [Citation9]. For example, dendritic cell activation by pathogens or toll-like receptor (TLR) agonists causes rapid glycolytic reprogramming that is required for immune activation [Citation10,Citation11]. These metabolic changes are regulated by the AKT (AKT serine/threonine kinase) and MTOR (mechanistic target of rapamycin kinase) complex 1 (MTORC1) pathway [Citation12]. Autophagy is involved in a variety of cellular metabolic pathways, and MTORC1 signaling is important for the negative regulation of autophagy [Citation13]. However, a recent study has shown that autophagy has an important role in restricting MTORC1 activation in regulatory T cells (Treg) [Citation14]. Therefore, the regulation of autophagy and immunometabolism may share common molecular pathways.
In this study, we investigated the function of the autophagy-related protein ATG5 in RSV infection and explored its role in immunometabolism and metabolic reprogramming in dendritic cells.
Results
Cytotoxic CD8A+ T-cell response is elevated in Itgax/Cd11c-atg5−/- mice during RSV infection
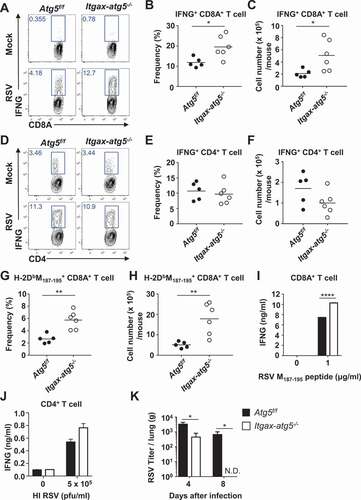
We investigated the role of Atg5 in the adaptive T-cell responses in dendritic cells to RSV infection, which is an important immune response for the elimination of RSV [Citation15]. We crossed Atg5flox/flox mice (Atg5f/f) with Itgax/Cd11c-Cre+ mice (Itgax-atg5−/-), which are selectively defective for autophagosome formation in dendritic cells. Atg5f/f or Itgax-atg5−/- mice were infected with RSV intranasally. The numbers of total CD4+ and CD8A+ T-cells were not affected by Atg5 deficiency in dendritic cells (Fig. S1A and S1B). Next, the production of IFNG/IFN-γ (interferon gamma) in lung CD4+ and CD8A+ T-cells was measured using intracellular cytokine staining. Our results showed that the frequency and number of CD8A+ T-cells secreting IFNG were highly increased in Itgax-atg5−/- mice (), but this effect was not observed in CD4+ T-cells (). Production of another interleukin, IL17A, was unimpaired in Itgax-atg5−/- mice (Fig. S1C and S1D). Consistent with these findings, RSV-specific tetramer staining results showed that the frequency and number of RSV-specific CD8A+ T-cells were also elevated in Itgax-atg5−/- mice (). Ex-vivo re-stimulation experiments, in which Atg5f/f and Itgax-atg5−/- mice were infected with RSV, showed significantly increased secretion of IFNG in CD8A+ T-cells of Itgax-atg5−/- mice, but not in CD4+ T-cells (). Finally, we assessed whether Atg5 deficiency in dendritic cells affected RSV replication. Atg5f/f and Itgax-atg5−/- mice were infected with RSV, and the viral titers were measured using plaque assays of lung homogenates. RSV titers were significantly decreased, and viral clearance was increased in Itgax-atg5−/- mice (), suggesting that dendritic cell-specific Atg5 deficiency decreased RSV replication. However, the number of dendritic cells was not affected by Atg5 deficiency (Fig. S1E). Because alveolar macrophages (AMs) also express ITGAX (integrin alpha X), we checked the effect of Atg5 deficiency in AMs. Itgax-atg5−/- mice showed similar number of AMs compared with control Atg5f/f mice upon RSV infection (Fig. S1F). Furthermore, we confirmed that macrophage-specific deletion of Atg5 did not affect antiviral CD4+ and CD8A+ T-cell responses (Fig. S1G and S1H). Thus, we could exclude the role of AMs in this mechanism. Taken together, Atg5 deficiency in dendritic cells promotes elevated CD8A+ T-cell responses and enhances RSV clearance in vivo.
Figure 1. Activation of CD8A+ cytotoxic T-cells, but not CD4+ Th1 cells in Itgax-specific Atg5-deficient mice during RSV infection in vivo. (A–J) Atg5f/f and Itgax-atg5−/- mice were infected with 5 × 10⁶ PFUs of RSV and lung T cells were analyzed after 7 d post-RSV infection. (A) Total IFNG production of lung CD8A+ T-cells was measured using intracellular cytokine staining after RSV-specific peptide re-stimulation. The frequency (B) and number (C) of IFNG+CD8A+ T-cells are shown. (D) IFNG+CD4+ T-cells were monitored using intracellular cytokine staining after phorbol 12-myristate 13-acetate (PMA)/ionomycin stimulation. The frequency (E) and number (F) of IFNG+CD4+ T-cells are shown. Each dot represents an individual mouse. The frequency (G) and number (H) of RSV M187-195 peptide-specific CD8A+ T-cells were detected by tetramer staining and flow cytometry. (I) Atg5f/f and Itgax-atg5−/- mice were infected with 5 × 10⁶ PFUs of RSV, and after 7 d post-infection, splenic CD8A+ T-cells were enriched using microbeads and then re-stimulated with RSV M187-196 peptide for 72 h. (J) CD4+ T-cells were enriched using microbeads and then re-stimulated with heat-inactivated RSV (HI RSV) for 72 h. IFNG levels in supernatants were measured using ELISA. (K) After 4 and 8 d post-infection, lung tissues were harvested and minced. RSV titer from lung suspensions was measured using plaque assays on HEp-2 cells. Data represent three independent experiments. *p < 0.05, **p < 0.01, ****p < 0.0001
Atg5 deficiency improves production of innate immunity cytokines in BMDCs upon RSV infection
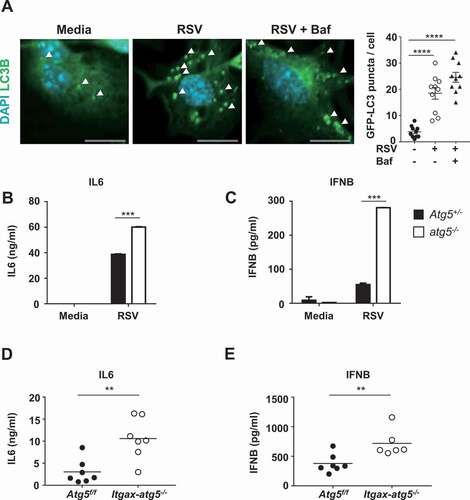
Pathogen infection, including that of RSV, is known to induce the formation of autophagosomes in dendritic cells, suggesting that autophagy is involved in the immune response [Citation16]. Several studies have suggested that autophagy contributes to the production of innate cytokines upon viral infection [Citation17]. To examine if autophagosome formation in BMDCs was induced by RSV infection, BMDCs were generated from the bone marrows of mice expressing GFP (green fluorescent protein)-LC3. Autophagosome production was monitored based on the detection of GFP-LC3 puncta after RSV infection, using immunofluorescence microscopy [Citation18]. The number of GFP-LC3 puncta was significantly increased after RSV infection compared with control (), indicating that RSV infection induced autophagosome assembly in BMDCs. In addition, RSV infection induced LC3B-II accumulation in both atg5−/- and wild-type BMDCs, although atg5−/- BMDCs showed lower LC3B-II levels than wild-type BMDCs (Fig. S2A). To test whether Atg5 deficiency affects the innate immune response to RSV infection in BMDCs, we infected Atg5+/- and atg5−/- BMDCs with RSV and measured the levels of proinflammatory cytokines using enzyme-linked immunosorbent assay (ELISA). Consistent with previous studies, we found increased levels of these cytokines in Atg5-deficient BMDCs after RSV infection (, and S2B). To confirm these results in vivo, Atg5f/f and Itgax-atg5−/- mice were infected with RSV, and proinflammatory cytokine levels in bronchoalveolar lavages (BALs) from each mouse lung were measured using ELISA. We found that the dendritic cell-specific Atg5 deficiency improved innate cytokine production in response to RSV infection (, and S2C). This result indicates that dendritic cell-specific Atg5 deficiency promoted a proinflammatory response, suggesting that Atg5 served as negative regulator of innate cytokine production.
Figure 2. RSV infection induces autophagosome formation in BMDCs and Atg5 deficiency enhances the production of proinflammatory cytokines in dendritic cells upon RSV infection. (A) GFP-LC3 BMDCs were infected with RSV (MOI = 10) for 24 h. Images were captured using confocal microscopy, and GFP-LC3 puncta were counted. Scale bar: 10 μm. (B–C) BMDCs derived from Atg5+/- and atg5−/- chimeric mice were infected with RSV for 12 h in vitro. Levels of cytokines IL6 (B) and IFNB (C) were measured using ELISA. (D–E) Atg5f/f or Itgax-atg5−/- mice were infected with 5 × 10⁶ PFUs of RSV. BALs were collected from each mouse at 8 h post-RSV infection. IL6 (D) and IFNB (E) levels were measured using ELISA. Each dot represents an individual mouse. Error bars represent SD. Data represent three independent experiments
Deficiency of Atg5 in dendritic cells alters the expression of genes involved in cellular metabolism
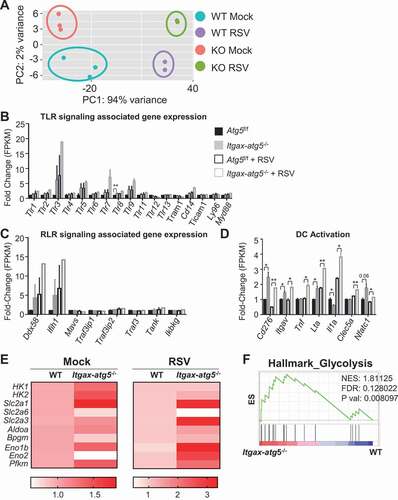
To identify the factors or genes associated with the phenotypes of Atg5 deficiency, we profiled the transcriptome of Atg5f/f and Itgax-atg5−/- dendritic cells. We found that both RSV infection and Atg5 deficiency induced significant transcriptional shift (). We observed that Atg5 deficiency did not change TLR and retinoic acid-inducible-I-like receptor (RLR) genes, which are related to virus recognition (). However, we found that genes related to the activation of dendritic cells were upregulated by Atg5 deficiency (). Likewise, gene ontology and gene-set enrichment analysis (GSEA) showed enrichment of genes belonging to chemokine and cytokine production pathways (Fig. S3A and S3B). Furthermore, Atg5-deficient dendritic cells tended to show characteristics that resembled CD8A+ dendritic cells and cross-presentation by dendritic cells (Fig. S3C and S3D). Thus, we concluded that Atg5 deficiency induced the activation of and cross-presentation by dendritic cells at a transcriptional level. On the other hand, genes related to metabolism, especially glycolysis, such as Hk1, Hk2, and Slc2a1 were strongly increased in expression as a result of Atg5 deficiency (). Upregulated genes of Atg5-deficient dendritic cells were enriched in glycolysis-related genes (). These data suggest that Atg5 deficiency resulted in the activation of dendritic cells via metabolic reprogramming.
Figure 3. RNA transcriptome analysis reveals that Atg5 deficiency alters the expression of metabolic process-related gene expression in dendritic cells. (A–C) BMDCs from Atg5f/f or Itgax-atg5−/- mice were grown and sorted using anti-ITGAX microbeads. BMDCs were infected with RSV for 18 h and RNA sequencing was performed. (A) Data from each group was clustered using principal component analysis. (B–D) TLR signaling-associated gene (Tlr1, Tlr2, Tlr3, Tlr4, Tlr5, Tlr6, Tlr7, Tlr8, Tlr9, Tlr11, Tlr12, Tlr13, Tram1, Cd14, Ticam1, Ly96, Myd88) expression (B), RLR signaling-associated gene (Ddx58, Ifih1, Mavs, Traf3ip1, Traf3ip2, Traf3, Tank, Ikbkg) expression (C), and dendritic cell activation-associated gene (Cd276, Itgav, Tnf, Lta/Tnfsf1b, Il1a, Clec5a, Nfatc1) expression (D) were shown as fold-change of fragments per kilobase of transcripts per million mapped reads (FPKM) values. (E) Heatmap for relative value of glycolysis-associated gene expression. (F) GSEA of gene sets associated with glycolysis. *p < 0.05, **p < 0.01. Error bars represent SD
Atg5 deficiency amplifies the glycolytic capacity of dendritic cells
Recent studies on cellular metabolism in dendritic cells have suggested novel critical regulators of innate and adaptive immunity [Citation19]. TLR agonists stimulate metabolic reprogramming in dendritic cells to promote aerobic glycolysis [Citation20], which is required for dendritic cell activation and immune function [Citation11]. The process of autophagy has been evolutionarily conserved to maintain cellular homeostasis during nutrient deprivation and other metabolic stresses [Citation21]. Therefore, we hypothesized that autophagy influences metabolic changes in dendritic cells upon RSV infection. To test our hypothesis, we used the glycolysis stress test to analyze the glycolytic status of RSV-infected BMDCs. We found that BMDCs infected with RSV showed increased glycolysis and glycolytic capacity compared with the control cells (). Glycolysis stress tests were performed on BMDCs derived from Atg5f/f and Itgax-atg5−/- mice to determine their glycolytic capacity. We found that glycolysis and glycolytic capacity were significantly increased in Itgax-atg5−/- BMDCs compared with Atg5f/f BMDCs upon RSV infection (). Taken together, Atg5 deficiency induced glycolysis during steady-state as well as upon RSV infection in dendritic cells.
Figure 4. Atg5 deficiency increases glycolysis and glycolytic capacity in BMDCs during RSV infection. (A) Wild-type BMDCs were infected with RSV (MOI = 1) for 1 h. Next, a glycolysis stress test was performed, and real-time ECAR level was measured using the XFe96 seahorse metabolic analyzer. (B) Glycolysis and glycolytic capacity were calculated using the seahorse glycolysis stress test report generator based on ECAR value. (C–D) Atg5f/f or Itgax-atg5−/- BMDCs were mock-treated (C) or were infected with RSV (MOI = 1) for 1 h (D). (E–F) A glycolysis stress test was performed, and real-time ECAR level was measured using the XFe96 seahorse metabolic analyzer to calculate glycolysis and glycolytic capacity. Error bars represent SD. Data represent three independent experiments. *p < 0.05, **p < 0.01
Atg5-deficient BMDCs exhibit decreased mitochondrial function
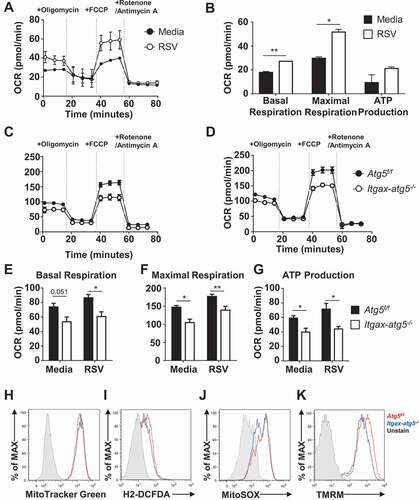
Glycolysis is important for fueling the tricarboxylic acid cycle and activating dendritic cells [Citation22]. Increased glycolysis provides large amounts of substrates and electron donors for oxidative phosphorylation in the mitochondria. During the later stages after activation, dendritic cells remain glycolytic, while mitochondrial oxidative phosphorylation is downregulated to maintain cellular homeostasis [Citation12]. Autophagy is also involved in the qualitative and quantitative regulation of mitochondria through the process of mitophagy [Citation23]. To investigate whether Atg5 deficiency affects mitochondrial function in dendritic cells, mock or RSV-infected dendritic cells were subjected to a mitochondrial stress test. We found that basal respiration, maximal respiration, and adenosine triphosphate (ATP) production were slightly increased in RSV-infected BMDCs (). Next, we measured the mitochondrial function of BMDCs derived from Atg5f/f or Itgax-atg5−/- mice. We found that maximal mitochondrial respiration was significantly decreased in the Itgax-atg5−/- BMDCs compared with control, under both mock and RSV-infected conditions (). Basal and maximal respiration and ATP production were decreased in Itgax-atg5−/- BMDCs compared with control cells, both under mock and RSV-infection conditions (), suggesting that Atg5 deficiency resulted in mitochondrial stress in BMDCs. We then investigated whether Atg5 deficiency directly affects mitochondrial function. Total mitochondrial mass was first measured using MitoTracker Green staining to check for significant differences in mitochondrial mass between Atg5f/f and Itgax-atg5−/- BMDCs (). The level of total reactive oxygen species (ROS) was lower in Itgax-atg5−/- BMDCs compared with Atg5f/f BMDCs (). Additionally, mitochondrial ROS generation was significantly lower in Itgax-atg5−/- BMDCs compared with the control (). Measurement of the mitochondrial membrane potential by tetramethylrhodamine, methyl ester staining also showed that mitochondrial function was decreased in Itgax-atg5−/- BMDCs compared with control (). Taken together, Atg5 deficiency resulted in impaired mitochondrial function in BMDCs, under steady-state conditions as well as upon RSV infection.
Figure 5. Atg5-deficient BMDCs show impaired mitochondrial function. (A) Wild-type BMDCs were infected with RSV (MOI = 1) for 1 h. Next, mito stress tests were performed and real-time OCRs were measured using the XFe96 seahorse metabolic analyzer. (B) Basal respiration, maximal respiration, and ATP production were calculated using the seahorse mitochondrial stress tests report generator based on the OCR value. (C–D) Atg5f/f or Itgax-atg5−/- BMDCs were mock-treated (C) or were infected with RSV at an MOI of 1 for 1 h (D). Mitochondrial stress tests were performed using the XFe96 seahorse metabolic analyzer. Basal respiration (E), Maximal respiration (F) and ATP production (G) were calculated using the seahorse mito stress tests report generator. (H) Total mass of mitochondria in Atg5f/f or Itgax-atg5−/- BMDCs was measured using the MitoTracker Green staining. Total cellular ROS was monitored using 2′,7′-dichlorodihydrofluorescein diacetate (H2-DCFDA) staining (I) and mitochondrial ROS was detected using mitosox staining (J). Mitochondrial membrane potential was measured using tetramethylrhodamine, methyl ester (TMRM) staining (K). Data represent two or three independent experiments. Error bars represent SD. *p < 0.05, **p < 0.01
Atg5 deficiency induces the AKT-MTOR-RPS6KB1 pathway in BMDCs
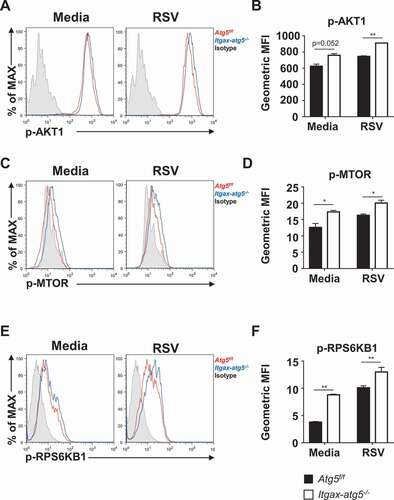
Intracellular anabolic processes are regulated by the serine/threonine kinase, mammalian target of rapamycin (MTOR), which has critical functions in modulating glycolysis and autophagy [Citation13]. AKT and the associated MTOR and RPS6KB1/S6K (ribosomal protein S6 kinase, polypeptide 1) pathways are central regulators of cellular activation and proliferation because of their ability to control glycolysis [Citation24]. To test whether the increased glycolysis observed in Atg5f/f or Itgax-atg5−/- BMDCs during RSV infection was mediated by the AKT-MTOR-RPS6KB1 pathway, we measured the phosphorylation levels of AKT, MTOR, and RPS6KB1 using flow cytometry. Phosphorylation of AKT, MTOR, and RPS6KB1 was increased both in steady-state as well as in RSV-infected Itgax-atg5−/- BMDCs compared with Atg5f/f BMDCs (). However, the expression of HIF1A (hypoxia-inducible factor 1 alpha) was not affected by Atg5 deficiency (Fig. S4). Our results showed that the increased glycolysis observed in Atg5-deficient BMDCs was associated with the upregulation of the AKT-MTOR-RPS6KB1 signaling pathway, under steady-state conditions as well as upon RSV infection.
Figure 6. Activation of the AKT-MTOR-RPS6KB1 pathway in Atg5-deficient BMDCs. Atg5f/f and Itgax-atg5−/- BMDCs were infected with RSV (MOI = 5). Phosphorylated AKT (p-AKT1) (A–B), p-MTOR (C–D), and p-RPS6KB1 (E–F) were measured using phospho-specific antibodies and flow cytometry. (B, D and F) Geometric mean fluorescence intensities (MFIs) of phosphorylated AKT (B), MTOR (D), and RPS6KB1 (F) were measured using flow cytometry. Error bars represent SD. Data represent two independent experiments. *p < 0.05, **p < 0.01
Single-cell transcriptomics revealed Atg5 coordinates the activation of dendritic cells in vivo
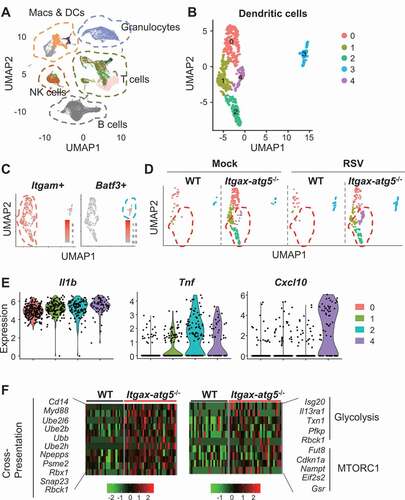
Previous data suggested that Atg5 deficiency reprogrammed the metabolism and activation of dendritic cells. To confirm the role of Atg5 in vivo, we analyzed ~10,000 lung-infiltrated immune cells per group using single-cell RNA sequencing. Using uniform manifold approximation and projection (UMAP), we determined lineages of clusters including dendritic cells (). To avoid possible contamination, we sorted dendritic cells using markers (Ptprc+Cd3e−Lyz2−Cd19−Itgax+). We found five different clusters among dendritic cells (). Clusters 0, 1, 2, and 4 were Itgam+, whereas cluster 3 was Batf3+, which is a major cross-presenting cell (). RSV infection led to an increase in cluster 3, indicating that viral infection induced active cross-presentation of dendritic cells (). On the other hand, unique clusters 2 and 4 emerged as a result of Atg5 deficiency (). Cluster 0 expressed lower levels of cytokines than the other clusters, which indicates that cluster 0 represented resting dendritic cells. On the contrary, cluster 1 showed higher cytokine production than cluster 0. Surprisingly, clusters 2 and 4, which emerged due to Atg5 deficiency, showed higher expression of Il1b and Tnf. Furthermore, cluster 4 showed high expression of Cxcl10 (). These data suggest that Atg5 deficiency led to the formation of distinct subsets of dendritic cells that actively produce cytokines and chemokines. This was consistent with previous data showing an increase in cytokine production in dendritic cells due to Atg5 deficiency. In addition, the Atg5-deficient group showed an increase in Batf3+ cluster 3 compared with wild-type (). We compared gene expressions of cluster 3 between the wild-type and Atg5-deficient dendritic cell groups. Interestingly, Atg5-deficient cluster 3 showed an enrichment of genes related to cross-presentation, glycolysis, and MTOR pathways (). Likewise, we observed a tendency to the enrichment of gene sets for major histocompatibility complex (MHC) class I-mediated antigen presentation and proteasome activity in Atg5-deficient cells (Fig. S5A and S5B). Taken together, our data suggest that Atg5 deficiency created distinct subsets of dendritic cells that actively produce cytokines and chemokines and promoted cross-presentation through metabolic reprogramming.
Figure 7. Single-cell transcriptomic analysis of lung dendritic cells. (A–F) Atg5f/f and Itgax-atg5−/- mice were intranasally infected with 5 x 10⁶ PFUs of RSV. At 7 d post-infection, cells were isolated from lung tissue and analyzed using single-cell RNA sequencing. (A–B) UMAP projection of lung-infiltrated immune cells (A) and dendritic cells (Ptprc+Cd3e−Lyz2−Cd19−Itgax+) (B). (C) Feature plot for expression of Itgam and Batf3 from dendritic cells. (D) Comparison of UMAP projection for dendritic cells by groups. (E) Cytokine and chemokine (Il1b, Tnf, Cxcl10) expression from clusters 0, 1, 2, and 4. (F) Heatmap for expression of cluster 3 genes involved in cross-presentation, glycolysis, and the MTORC1 pathway
The effect of metabolic reprogramming induced by Atg5 deficiency on innate and adaptive immune responses in dendritic cells
To investigate the effects of Atg5 deficiency-induced metabolic changes in dendritic cells on innate and adaptive immune responses, we first analyzed the immune-related effect of increased glycolysis. When glycolysis was blocked using a competitive inhibitor of glucose transport, 2-deoxyglucose (2-DG), we found that the levels of proinflammatory cytokines, such as IL6 and IFNB, which were upregulated upon RSV infection in Itgax-atg5−/- BMDCs, were lowered to levels that were comparable to those of Atg5f/f BMDCs (), although cell death and apoptosis were not affected (Fig. S6A). Therefore, our results suggest that proinflammatory cytokine secretion was significantly upregulated in Itgax-atg5−/- BMDCs due to amplified glycolysis, following RSV infection.
Figure 8. The role of glycolysis in innate and adaptive immune responses in dendritic cells. (A–B) Atg5f/f or Itgax-atg5−/- BMDCs were infected with RSV (MOI = 1), with or without 2-DG treatment. Secretion of IL6 (A) or IFNB (B) was measured using ELISA. (C–D) Atg5f/f or Itgax-atg5−/- mice were infected with 5 × 10⁶ PFUs of RSV. After 12 h post-infection, MHC class I expression in lung ITGAE/CD103+ and ITGAM/CD11b+ dendritic cells were measured using flow cytometry. (D) MFI values of H-2Kb in indicated cells are shown. Each dot represents an individual mouse. (E–G) Wild-type BMDCs were infected with RSV (MOI = 1), with or without 2-DG treatment. After 12 h post-infection, surface H-2Kb and H-2Db expression were measured using flow cytometry (E). MFI values of H-2Kb, H-2Db (F), and MHC class II (G) are shown as bar graphs. (H) Wild-type BMDCs were infected with RSV (MOI = 1), with or without 2-DG treatment. After 12 h post-infection, cells were washed and then co-cultured with CD8A+ T-cells from RSV-infected wild-type mice for 72 h. IFNG levels in supernatants were measured using ELISA. Data represent two or three independent experiments. *p < 0.05, ** p < 0.01, *** p < 0.001
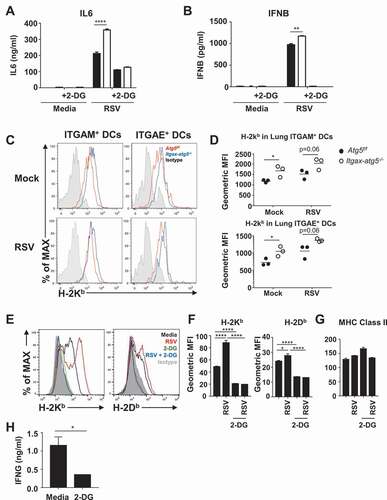
Finally, we investigated the mechanism underlying Atg5 deficiency-induced cytotoxic T lymphocyte (CTL) responses, which are activated by MHC class I presentation, in dendritic cells. The absence of autophagy factors ATG5 and ATG7 has been shown to elevate MHC class I surface levels in dendritic cells due to decreased endocytosis and degradation of MHC class I molecules [Citation25]. To determine if Atg5 deficiency affects the expression of MHC class I molecules, we measured the levels of MHC class I H2-K-b (H-2Kb), a specific MHC class I molecule, in B6 background mice. Expression of H-2Kb was increased in lung ITGAM/CD11b+ and ITGAE/CD103+ dendritic cells in Itgax-atg5−/- mice after mock or RSV infection (). On the other hand, expression levels of MHC class I molecules of macrophages were not affected by Atg5 deficiency specific to both dendritic cells and macrophages (Figure S6B). We also examined the association of increased MHC class I expression with glycolysis. We found that the expression levels of H-2Kb and H-2 class I histocompatibility antigen, D-B alpha chain (H-2Db) on the surface of dendritic cells was increased by RSV infection, and their expression levels were significantly decreased upon treatment with 2-DG. (). On the other hand, MHC class II expression did not change significantly under the same conditions (). To study the effect of increased glycolysis on CD8A+ T-cell priming, BMDCs were infected with RSV in the presence or absence of 2-DG. IFNG secretion was then measured in cultured CD8A+ T-cells from RSV-infected wild-type mice, to assess CD8A+ T-cell priming. We found that the secretion of IFNG was significantly reduced in CD8A+ T-cells co-cultured with BMDCs treated with 2-DG compared with that of the control (). Therefore, our results suggest that Atg5 deficiency-induced MHC class I protein expression and CD8A+ T-cell priming were dependent on elevated glycolysis.
Discussion
Here, we present the role of the autophagy-related protein ATG5 in innate and adaptive immune responses against RSV infection. Atg5 deficiency in dendritic cells promoted an elevated CTL response, but not T helper (Th) type I response, to RSV infection. RSV infection induced autophagosome formation in dendritic cells, and Atg5-deficient dendritic cells produced more proinflammatory cytokines, such as IFNB and IL6, in response to the infection. Increased levels of IL12 and IL1B, important cytokines for CD8A+ T-cell activation, were found in Atg5-deficient dendritic cells in vitro and in vivo [Citation26]. This was also proven in vivo with mice containing dendritic cell-specific Atg5 deficiency. Together, these results highlight the role of Atg5 in immune response activation during RSV infection. RNA sequencing and transcriptome analysis suggest that Atg5 regulated the expression of metabolic genes in dendritic cells. The metabolic status of Atg5-deficient dendritic cells showed increased glycolysis and glycolytic capacity in steady-state and in response to RSV infection. On the other hand, basal and maximal respiration and ATP production were decreased in Atg5-deficient dendritic cells due to mitochondrial dysfunction. We found that the altered metabolism induced by Atg5 deficiency affected the innate and adaptive acquired immune responses against RSV infection in dendritic cells. Inhibition of glycolysis by 2-DG reversed the elevated secretion of proinflammatory cytokines seen in Atg5-deficient dendritic cells upon RSV infection. In addition, CD8A+ CTL priming was significantly reduced in 2-DG-treated dendritic cells infected with RSV, suggesting that Atg5 is involved in the regulation of anti-RSV immune response via regulating immunometabolism in dendritic cells.
In this study, we used dendritic cell-specific Atg5-deficient mouse models to elucidate the role of autophagy during RSV infection. Various ATG proteins are involved in autophagosome formation [Citation4]. Although Atg5 is essential for autophagosome formation, recent studies have shown that Atg5-independent autophagy regulates cellular immunity against intracellular pathogens [Citation27]. Atg5 also plays a unique, autophagy-independent protective role against Mycobacterium tuberculosis by preventing polymorphonuclear neutrophil-mediated immunopathology [Citation28]. Given these findings, additional research involving other ATG proteins is needed to fully understand the roles of Atg5 and other autophagic factors in anti-RSV immunity, and also to obtain a more comprehensive understanding of the role of autophagy in combating RSV infection.
Atg5-deficient lung dendritic cells expressed increased levels of surface MHC class I molecules, and Itgax-atg5−/- mice exhibited an elevated CTL response, but not Th1 and Th17 responses, against RSV infection. A recent study found that Atg5- and Atg7-dependent MHC class I stabilization is associated with elevated CD8A+ T-cell stimulation [Citation25]; and proposed a mechanism in which ATG5 or ATG7 deficiency compromises MHC class I interactions with AAK1 (AP2 associated kinase 1), a protein involved in MHC class I internalization. The results of this study suggested that AAK1 regulates the recycling of MHC class I molecules, which is related to LC3-associated phagocytosis. Our study also suggested a link between cellular metabolism and MHC class I expression, thus metabolism-mediated regulation of MHC class I may be associated with AAK1 and LC3-associated phagocytosis. In our study, we found that RSV-infected ITGAE+ and ITGAM + lung dendritic cells showed elevated MHC class I expression. Because type I IFNs are important cytokines for CD8A+ T-cell activation, it is possible that the CD8A+ T-cell response may be stimulated by elevated type I IFN and MHC class I expression in RSV-infected Itgax-atg5−/- mice. Future studies should monitor AAK1 and LC3 interactions in an RSV infection model to elucidate the specific mechanism of Atg5-related MHC class I internalization. MHC class I expression is associated with cellular metabolic status. For example, the membrane expression of MHC class I molecules is regulated by mitochondrial respiration in cancer cells [Citation29]. Moreover, the upregulation of glycolysis controls MHC class I protein expression in tumor cells [Citation30]. However, little is known about MHC class I expression and its relationship with cellular metabolism in dendritic cells. Our study suggests that the expression of MHC class I molecules was increased in dendritic cells lacking Atg5, which is associated with altered cellular metabolism. These results support a previous study that showed that glycolytic bursts are important for dendritic cell maturation and MHC class I and II expression [Citation11]. Future research is needed to further explore this association and determine why dendritic cell function is inhibited in metabolically stressed sites, such as tumor microenvironments. In this study, we used 2-DG, a glucose analog, to evaluate the effect of glycolysis upon MHC class I expression. In addition, 2-DG blocks N-linked glycosylation by competing with mannose in the endoplasmic reticulum [Citation31]. 2-DG-mediated inhibition of N-linked glycosylation can interfere with expression of various surface receptors, such as NKG2D ligands [Citation32]. N-linked glycosylation also affects MHC class I expression [Citation33]. To obtain direct evidence that 2-DG regulates MHC class I expression through N-glycosylation, MHC class I expression should be evaluated after 2-DG treatment of Atg5-deficient dendritic cells in a future study.
Several studies have suggested that RSV infection activates autophagy in BMDCs. Using GFP-LC3 mice, we also found that RSV infection induced autophagosome formation in dendritic cells. However, different studies have reported conflicting results on the effects of autophagy on the innate immune response against RSV infection. One study has shown that treatment with type III phosphoinositide 3-kinase inhibitors, such as 3-methyladenine, reduces proinflammatory cytokine secretion in BMDCs during RSV infection [Citation7]. Moreover, experiments with Becn1 haplodeficient BMDCs have shown that RSV infection results in decreased dendritic cell maturation and mRNA expression of proinflammatory cytokines [Citation6]. However, a recent study has shown that the secretion of proinflammatory cytokines, such as IL6 and IL1B, is significantly increased in RSV-infected BMDCs that lack the autophagy-associated protein LC3B, compared with wild-type BMDCs [Citation8]. RSV is known to be primarily recognized by the DDX58/RIG-I-MAVS pathway in BMDCs [Citation34]. Autophagy is known to be a negative regulator of the DDX58-MAVS pathway, and previous studies have shown that Atg5-deficient mouse embryonic fibroblasts or macrophages exhibit elevated proinflammatory cytokine secretion in response to vesicular stomatitis viral infection [Citation35,Citation36]. Our results provide further evidence that autophagy is a negative regulator of proinflammatory cytokine production against RSV infection.
Autophagy is closely associated with cellular metabolism. The phylogenetically conserved process of autophagy is related to its role in maintaining cellular homeostasis during nutrient deprivation and other metabolic stresses [Citation21]. Autophagy-deficient eukaryotic cells are more sensitive to nutrient deprivation than wild-type cells. For example, mice with genetic defects in essential components of the autophagic machinery, such as Atg5, Atg7, or Atg16l1, die shortly after birth because they fail to generate adequate energy reserves to survive neonatal starvation [Citation37]. Consistent with these studies, our transcriptome analysis suggests that Atg5 deficiency induced changes in metabolism-associated gene expression.
Past research has focused on the roles of receptor and signaling systems in activating innate and adaptive immune responses in dendritic cells after pathogen infection or damage-associated molecular pattern recognition. TLR agonists have been shown to stimulate metabolic reprogramming in dendritic cells to promote aerobic glycolysis [Citation38]. Additionally, dendritic cells have been shown to store intracellular glycogen, and cell-intrinsic glycogen metabolism is required for the early effector functions of TLR-activated dendritic cells [Citation39]. We also found that Itgax-atg5−/- BMDCs showed increased glycolytic rates in steady-state and RSV-infected conditions, which suggested that autophagy may negatively regulate cytokine secretion via glycolysis modulation following RSV infection. The Hippo-MST pathway has been recently shown to control cellular metabolic homeostasis in dendritic cells and regulate their immunological function [Citation40]. Consistent with this, our study results suggest a role for Atg5 in controlling the immunometabolism of dendritic cells following RSV infection.
As further proof of the hypothesis that autophagy-related proteins control immune cell metabolism, another study has shown that the Treg-specific deletion of Atg7 or Atg5 leads to Treg cell apoptosis. Autophagy deficiency upregulates metabolic regulators such as MTORC1 and glycolysis, which critically contribute to defective Treg function [Citation14]. We also found that Atg5 deficiency increased glycolysis in steady-state and RSV-infected BMDCs, as evidenced by the activation of the AKT-MTOR-RPS6KB1 pathway, which is an important signaling pathway associated with glycolysis upregulation after TLR stimulation [Citation41].
We also observed that Atg5-deficient BMDCs exhibited decreased maximal mitochondrial respiration compared with Atg5f/f BMDCs. Mitochondrial function is required for virus sensing; for example, mitochondrial ROS production is important for RLR-dependent virus detection [Citation35]. Moreover, many viral proteins modify mitochondrial ion permeability and membrane potential to promote their intracellular survival [Citation42]. Mitophagy, the autophagic elimination of damaged mitochondria, is required for mitochondrial quality and quantity control [Citation23]. Although Atg5 is required for mitophagy, we did not observe significantly decreased total mitochondrial mass in Atg5-deficient BMDCs. However, mitochondrial function was noticeably impaired in Itgax-atg5−/- BMDCs. Our findings suggest that mitophagy in dendritic cells were involved in the qualitative regulation of mitochondria. Activated glycolysis and reduced mitochondrial function are signatures of immunometabolically activated dendritic cells, and therefore, our study highlights that Atg5 controls immunometabolic activation in dendritic cells.
In summary, our study has identified a novel role of Atg5 as an immunometabolic regulator in dendritic cells against RSV infection. Our results could have applications in new therapies that control virus immunity through control of autophagy and immunometabolism.
Materials and methods
Ethics
The animal procedures used in this study followed all relevant legal and ethical requirements and were in accordance with the guidelines and protocols (KA2013-55) for rodent research approved by the Institutional Animal Care and Use Committee of KAIST.
Mice
GFP-LC3 Tg mice, B6.129-Atg5 (tm1Nmz) (Atg5+/-) mice and Atg5tm1Myok (Atg5f/f) mice were kindly provided by Akiko Iwasaki (Yale School of Medicine) [Citation43–46]. B6.Cg-Tg (Itgax-Cre)1–1Reiz/J (Itgax-Cre Tg) mice and B6.129P2-Lyz2<tm1(cre)ifo>/J (Lyz2/LysM-Cre Tg) mice were purchased from Jackson Laboratory (Bar Harbor, ME, USA). The mice were bred and housed in a specific pathogen-free facility at the KAIST.
Neonatal liver chimera generation
Atg5 chimeras were produced as described [Citation47,Citation48]. In brief, 2.5 × 10⁶ liver cells were isolated from Atg5+/- and atg5−/- newborn pups and injected into recipient C57BL/6 mice via tail veins. Prior to neonatal liver-cell transfer, recipient mice were subjected to a lethal dose of 475 rad gamma-ray irradiation at two time points that were 3 h apart. Chimerism of these mice was verified using quantitative reverse transcription polymerase chain reaction of Atg5 at 8 weeks post-transfer.
RSV infection in vivo
The A2 strain of RSV was a gift from Dr. Jun Chang (Ewha Women’s University). RSV stock was cultured in HEp-2 cells and titrated to calculate the multiplicity of infection (MOI). HEp-2 cell line (ATCC, CCL-23) was provided by Jun Chang (Ewha Women’s University). Mice were anesthetized by intraperitoneal administration of 80 mg/kg ketamine (Youhanyanghaeng)/16 mg/kg xylazine (BAYER) in phosphate-buffered saline (PBS; Genedepot, CAP08-050) before intranasal inoculation with 5 × 10⁶ plaque-forming units (PFUs) of live RSV in 20 µl PBS. Control animals were mock-inoculated with 20 µl of PBS.
RSV titers in the lung
After indicated time points of RSV infection, mice were euthanized, and their lungs were removed and placed in PBS. The tissues were then processed through a 70-µm cell strainer (SPL, 93070). Supernatants were collected from lung suspensions, and RSV titers were measured using plaque assays on HEp-2 cell monolayers. Data were expressed as PFUs per gram of lung tissue.
BMDC preparation
The cells were prepared by flushing femurs and tibiae of mice. Cells were cultured in Roswell Park Memorial Institute (RPMI) 1640 medium (Wellgene, LM011-01) supplemented with 10% fetal bovine serum (FBS; Wellgene, S001-01), 1% penicillin/streptomycin (Wellgene, LS202-02), and 5% granulocyte-macrophage colony-stimulating factor (CSF2/GM-CSF) conditional medium (supernatants of CSF2-secreting J588L cell cultures). J588L cell line expressing CSF2 was provided from Akiko Iwasaki (Yale University). Fresh medium with CSF2/GM-CSF was added to cultures on day 2 or 4. After 6–7 days, loosely adherent BMDCs were collected by pipetting.
RSV infection in vitro and cytokine measurement
2 × 10⁵ BMDCs were stimulated with live RSV in complete RPMI 1640 medium for 12 or 24 h. Supernatants were collected and analyzed for IL6 (BD Biosciences, 550950) and IFNB (Biolegend, 439407) levels using ELISA, according to the manufacturers’ instructions.
GFP-LC3 puncta measurement
BMDCs from GFP-LC3 Tg mice were cultured in RPMI 1640 medium supplemented with 10% FBS, 1% penicillin/streptomycin, and 5% CSF2 conditional medium. BMDCs were re-plated on cell culture slides (SPL, 301080) and infected with RSV (MOI = 10) for 24 h. Bafilomycin A1 (Sigma Aldrich, B1793) was added 6 h prior to analysis. Cells were fixed with 4% paraformaldehyde and mounted with 4′, 6-diamidino-2-phenylindole (DAPI)-containing solution (Abcam, ab104139). Cells were analyzed using LSM800 confocal microscopy (Zeiss).
T-cell responses
At day 7 post-RSV infection, splenic CD4+ and CD8A+ T-cells were isolated from mice using anti-CD4 and anti-CD8A microbeads (Miltenyi Biotech, 130–117-043; 130–117-044), according to the manufacturer’s protocol. T cells were re-infected with 5 x 10⁵ PFUs/ml of heat-inactivated RSV and 1 µg of RSV M187-195 peptide (NAITNAKII), respectively, for 72 h at 37°C. IFNG levels in the supernatants were measured using IFNG ELISA (eBioscience, BMS606).
Preparation of lung single-cell suspensions
Isolated lung samples were minced using razor blades and incubated in 2 mg/ml collagenase IV (Worthington, LS004189) and 30 μg/ml DNase I (Roche, 10104159001) at 37°C for 30 min. Cells were resuspended in Hank’s balanced salt solution (HBSS; Wellgene, LB003-03) containing 5% FBS and 5 mM ethylenediaminetetraacetic acid at 37°C for 5 min and filtered through a 70-μm cell strainer. To remove cell debris, 30–70% density gradient Percoll centrifugation was used (GE Healthcare, 17–0891-01). The single-cell suspensions were prepared after red blood cell lysis using ammonium-chloride-potassium (ACK) lysis buffer (150 mM NH4Cl, 10 mM KHCO3, 0.1 mM Na2EDTA in 3ʹDW).
Flow cytometry
Single-cell suspensions were pre-treated with anti-FCGR3/CD16 and FCGR2B/CD32 antibody (clone: 2.4G2; TONBO Biosciences, 70–0161-M001) to block Fc receptors prior to staining with antibodies specific to mouse CD3E (clone: 145–2 C11, eBioscience, 25–0031-82), ITGAM/CD11b (clone: M1/70, Biolegend, 101212), ITGAX (clone: N418, Biolegend, 117318), CD44 (clone: IM7; BD Biosciences, 560570), ITGAE/CD103 (clone: 2E7, Biolegend, 121416), MHC class II (clone: M5/114.15.2; eBioscience, 48–5321-82), CD4 (clone: GK1.5, Biolegend, 100412), CD8A (clone: 53–6.7; TONBO Biosciences), CD170/SIGLEC-F (clone: E50-2440; BD Biosciences), H-2Db (clone KH95, Biolegend, 111505), H-2Kb (clone AF6-88.5, Biolegend, 116507) and PTPRCb/CD45.2 (clone: 104; Biolegend, 109822). 4′,6-diamidino-2-phenylindole (DAPI; Invitrogen, D1306) or propidium iodide (eBioscience, 00–6990-50) was used to exclude dead cells.
To analyze RSV-specific CD8A+ T-cells, we prepared H-2Db tetramers specific for the RSV M187-195 peptide (NAITNAKII) using the protocol of the NIH Tetramer Core Facility. The tetramers were labeled with allophycocyanin. Intracellular cytokine staining was performed as described previously [Citation49]. Briefly, we incubated the cells with 50 ng/ml phorbol myristate acetate (Sigma Aldrich, 16561–29-8), 1 μg/ml ionomycin (Sigma Aldrich, L3909), and 2 μM GolgiStop (BD Biosciences, 554724) for 5 h at 37°C. For the RSV-specific re-stimulation of CD8A+ T-cells, we cultured the cells in the presence of 5 µg/ml M187-195 peptide (NAITNAKII) and 2 μM GolgiStop for 5 h. Next, cells were stained with anti-mouse CD4, CD8A, ITGAM/CD11b, CD44, and PTPRCb prior to fixation and permeabilization using the Cytofix/Cytoperm kit (BD Biosciences, 554714), according to the manufacturer’s protocol. For detection of IFNG or IL17A production, an antibody specific to IFNG (clone XMG1.2, BD Biosciences, 505810) or IL17A (clone TC11-18 H10, BD Biosciences, 559502) was used to detect intracellular cytokines.
To analyze phosphorylation of MTOR, AKT, and RPS6KB1, BMDCs were fixed and permeabilization using FOXP3/Transcription Factor Staining Buffer Set (eBioscience, 00–5523-00), according to manufacturer’s protocol. Next, cells were stained with p-MTOR (clone MRRBY, eBioscience, 12–9718-42), p-AKT1 (Ser473; clone SDRNR, eBioscience, 17–9715-42), p-RPS6KB1 (clone cupk43k, eBioscience, 12–9007-42). All samples were analyzed using an LSR Fortessa Cell Analyzer (BD Biosciences), and data were analyzed using FlowJo software (Tree Star).
Analysis of cell death and apoptosis of BMDCs
Bone marrow cells from WT mice were grown and differentiated in CSF2/GM-CSF2 conditional medium. BMDCs were infected with RSV (MOI = 1) and/or treated with 2-DG for 12 h. BMDCs were harvested and stained with anti-ANXAV (annexin A5; clone: PK136, Biolegend, 640907) and 7-AAD (BD Bioscences, 51–68981E). Cells were acquired by FACS Calibur (BD Biosciences. Data were analyzed using FlowJo software (Treestar).
ELISA of BAL samples
Mock and RSV-infected mice were euthanized at indicated time points after infection. The thorax was opened and a 20 GA 1.16 IN 1.1 × 30-mm intravenous catheter (SEWON MEDICAL) was introduced into the trachea at the cricothyroid membrane. The trachea was then flushed with 500 μl PBS, and the resulting fluid was aspirated. Collected BAL fluids were stored at −80°C. Levels of IFNB (Biolegend, 439407), IL6 (BD Biosciences, 550950), IL12B (eBioscience, 88–7120-22), and IL1B (eBioscience, BMS6002) in the BAL fluids were measured using an ELISA kit according to the manufacturers’ protocols.
RNA sequencing
Bone marrow cells from Atg5f/f or Itgax-atg5−/- mice were grown and differentiated in CSF2 conditional medium. BMDCs were infected with RSV (MOI = 1) for 18 h. Total RNA quality was assessed using the Agilent 2100 Bioanalyzer System based on an RNA Integrity Number. Extracted RNA samples were processed using the TruSeq RNA Sample Prep Kit v2 (Illumina) and sequenced using Illumina HiSeq 4000 (Illumina). Reads were trimmed based on the sequencing quality using Trimmomatic. Trimmed reads were aligned on a mus musculus reference sequence (mm10) using HISAT2. Read counts were normalized for effective library size, and differentially expressed genes were analyzed using StringTie. Differentially expressed genes were defined by p < 0.05 and an absolute fold-change > 2. Gene ontology analysis was performed for the prediction of biological and signaling changes. For GSEA, differentially expressed genes were annotated to reference gene set based on MSigDB 7.0.
Single-cell transcriptomic analysis
5 x 10⁶ PFUs of RSV or PBS control were intranasally infected into Atg5f/f or Itgax-atg5−/- mice. After 7 d post-infection, single-cell suspensions from the lung were obtained. Cells were stained with 7-amino-actinomycin D (BD Biosciences, 51–68981E) and separated from dead cells using fluorescence-activated cell sorting Aria II sorter (BD BioSciences) to avoid contamination. Single-cell RNA sequencing was performed using a Chromium Single cell 3ʹ V3 Reagent kit (10X Genomics) according to manufacturer’s protocol. Briefly, 10,000 sorted cells were loaded for gel bead-in-emulsion generation and barcoding. After cDNA amplification, libraries were constructed. Next-generation sequencing was performed using HiSeqXten (Illumina). Data were analyzed according to the Seurat workflow [Citation50]. Briefly, sequencing results were converted into FASTQ files using Cell Ranger (10X Genomics). Mm10 was used as the genome reference for sample alignment. Matrices were analyzed using Seurat V.3. R.3.6.0. was used for statistical analyses. Cells were sorted according to the number of features of RNA and mitochondrial genes for quality control. NormalizeData function was used for normalization and FindVariableFeature function was used to check variance of gene expression. Datasets were integrated using FindIntegrationanchors and IntegrateData functions. Principal component analysis was used to establish data dimensions of 20 significant principal components. Using FindNeighbors and FindClusters functions, data were clustered at a resolution of 0.8. To visualize selected principal components, we used the RunUMAP function. Clusters were identified using the FindMarkers function.
Metabolic stress tests
For glycolysis stress tests, 1 × 10⁵ Atg5f/f or Itgax-atg5−/- BMDCs were infected with RSV (MOI = 1) in XF96 cell culture plates (Agilent Technologies, 101085–004). After 1 h of stimulation, cells were re-plated in XF medium (non-buffered Dulbecco’s modified Eagle medium containing 2 mM l-glutamine; Agilent Technologies, 102353–100). An XFe96 Extracellular Flux Analyzer (Agilent Technologies) was used to measure oxygen consumption rate (OCR) and extracellular acidification rate (ECAR) in response to 2 µM oligomycin (Sigma-Aldrich, O4876), 50 mM D-glucose (Sigma-Aldrich, G7021), and 50 mM 2-DG (Sigma-Aldrich, D8375).
For mitochondrial stress tests, 1 × 10⁵ Atg5f/f or Itgax-atg5−/- BMDCs were infected with RSV (MOI = 1) in XFe96 cell culture plates (Agilent Technologies, 101085–004). After 1 h of stimulation, cells were re-plated in XF medium (non-buffered Dulbecco’s modified Eagle medium containing 2 mM l-glutamine (Gibco, 35050061), 25 mM glucose, and 10 mM pyruvate (Sigma-Aldrich, P5280), Agilent Technologies, 102353–100). An XFe96 Extracellular Flux Analyzer was used to measure oxygen consumption rate response to 2 µM oligomycin, 2 µM carbonyl cyanide 4-(trifluoromethoxy)phenylhydrazone (Sigma-Aldrich, C2920), 0.5 µM rotenone (Sigma-Aldrich, R8875), and 0.5 µM antimycin A (Sigma-Aldrich, A8674).
Statistical analysis
Data were expressed as the mean ± standard error of mean or standard deviation (SD). Differences between groups were analyzed using unpaired, two-tailed Student’s t-tests. All statistical analyses were performed using Prism 7.0 (GraphPad, San Diego, CA, USA) or R software (R Foundation for Statistical Computing). Differences were considered statistically significant when p < 0.05 and were indicated as: *p < 0.05, **p < 0.01, ***p < 0.001, and ****p < 0.0001.
Supplemental Material
Download MS Word (731.3 KB)Acknowledgments
The authors would like to thank the members of the Laboratory of Host Defenses for helpful advice on experiments and data discussions.
Disclosure statement
The authors declare that the research was conducted in the absence of any commercial or financial relationships that could be construed as a potential conflict of interest.
Supplementary material
Supplemental data for this article can be accessed here.
Additional information
Funding
References
- Mazur NI, Higgins D, Nunes MC, et al. The respiratory syncytial virus vaccine landscape: lessons from the graveyard and promising candidates. Lancet Infect Dis. 2018 Oct;18(10):e295–e311. PubMed PMID: 29914800.
- Kim JY, Chang J. In hot pursuit of the first vaccine against respiratory syncytial virus. Yonsei Med J. 2016 Jul;57(4):809–816. PubMed PMID: 27189271; PubMed Central PMCID: PMCPMC4951454.
- Dikic I, Elazar Z. Mechanism and medical implications of mammalian autophagy. Nat Rev Mol Cell Biol. 2018 Jun;19(6):349–364. PubMed PMID: 29618831.
- Yu L, Chen Y, Tooze SA. Autophagy pathway: cellular and molecular mechanisms. Autophagy. 2018;14(2):207–215. PubMed PMID: 28933638; PubMed Central PMCID: PMCPMC5902171.
- Choi Y, Bowman JW, Jung JU. Autophagy during viral infection - a double-edged sword. Nat Rev Microbiol. 2018 Jun;16(6):341–354. PubMed PMID: 29556036.
- Reed M, Morris SH, Jang S, et al. Autophagy-inducing protein beclin-1 in dendritic cells regulates CD4 T cell responses and disease severity during respiratory syncytial virus infection. J Immunol. 2013 Sep 1;191(5):2526–2537. PubMed PMID: 23894198; PubMed Central PMCID: PMCPMC3811020.
- Morris S, Swanson MS, Lieberman A, et al. Autophagy-mediated dendritic cell activation is essential for innate cytokine production and APC function with respiratory syncytial virus responses. J Immunol. 2011 Oct 15;187(8):3953–3961. PubMed PMID: 21911604; PubMed Central PMCID: PMCPMC3186849.
- Reed M, Morris SH, Owczarczyk AB, et al. Deficiency of autophagy protein Map1-LC3b mediates IL-17-dependent lung pathology during respiratory viral infection via ER stress-associated IL-1. Mucosal Immunol. 2015 Sep;8(5):1118–1130. PubMed PMID: 25669150; PubMed Central PMCID: PMCPMC4532659.
- O’Neill LA, Pearce EJ. Immunometabolism governs dendritic cell and macrophage function. J Exp Med. 2016 Jan 11;213(1):15–23. PubMed PMID: 26694970; PubMed Central PMCID: PMCPMC4710204.
- Krawczyk CM, Holowka T, Sun J, et al. Toll-like receptor-induced changes in glycolytic metabolism regulate dendritic cell activation. Blood. 2010 Jun 10;115(23):4742–4749. PubMed PMID: 20351312; PubMed Central PMCID: PMCPMC2890190.
- Everts B, Amiel E, Huang SC, et al. TLR-driven early glycolytic reprogramming via the kinases TBK1-IKKvarepsilon supports the anabolic demands of dendritic cell activation. Nat Immunol. 2014 Apr;15(4):323–332. PubMed PMID: 24562310; PubMed Central PMCID: PMCPMC4358322.
- Pearce EJ, Everts B. Dendritic cell metabolism. Nat Rev Immunol. 2015 Jan;15(1):18–29. PubMed PMID: 25534620; PubMed Central PMCID: PMCPMC4495583.
- Jung CH, Ro SH, Cao J, et al. mTOR regulation of autophagy. FEBS Lett. 2010 Apr 2;584(7):1287–1295. PubMed PMID: 20083114; PubMed Central PMCID: PMCPMC2846630.
- Wei J, Long L, Yang K, et al. Autophagy enforces functional integrity of regulatory T cells by coupling environmental cues and metabolic homeostasis. Nat Immunol. 2016 Mar;17(3):277–285. PubMed PMID: 26808230; PubMed Central PMCID: PMCPMC4755832.
- Openshaw PJ, Chiu C. Protective and dysregulated T cell immunity in RSV infection. Curr Opin Virol. 2013 Aug;3(4):468–474. PubMed PMID: 23806514; PubMed Central PMCID: PMCPMC4295022.
- Owczarczyk AB, Schaller MA, Reed M, et al. Sirtuin 1 regulates dendritic cell activation and autophagy during respiratory syncytial virus-induced immune responses. J Immunol. 2015 Aug 15;195(4):1637–1646. PubMed PMID: 26157176; PubMed Central PMCID: PMCPMC4530059.
- Germic N, Frangez Z, Yousefi S, et al. Regulation of the innate immune system by autophagy: monocytes, macrophages, dendritic cells and antigen presentation. Cell Death Differ. 2019 Mar;26(4):715–727. PubMed PMID: 30737475.
- Mizushima N. Methods for monitoring autophagy using GFP-LC3 transgenic mice. Methods Enzymol. 2009;452:13–23. PubMed PMID: 19200873.
- Buck MD, Sowell RT, Kaech SM, et al. Metabolic Instruction of Immunity. Cell. 2017 May 4;169(4):570–586. PubMed PMID: 28475890; PubMed Central PMCID: PMCPMC5648021.
- Everts B, Pearce EJ. Metabolic control of dendritic cell activation and function: recent advances and clinical implications. Front Immunol. 2014;5:203. PubMed PMID: 24847328; PubMed Central PMCID: PMCPMC4021118.
- Rabinowitz JD, White E. Autophagy and metabolism. Science. 2010 Dec 3;330(6009):1344–1348. PubMed PMID: 21127245; PubMed Central PMCID: PMCPMC3010857.
- Williams NC, O’Neill LAJ. A role for the krebs cycle intermediate citrate in metabolic reprogramming in innate immunity and inflammation. Front Immunol. 2018;9:141. PubMed PMID: 29459863; PubMed Central PMCID: PMCPMC5807345.
- Pickles S, Vigie P, Youle RJ. Mitophagy and Quality Control Mechanisms in Mitochondrial Maintenance. Curr Biol. 2018 Feb 19;28(4):R170–R185. PubMed PMID: 29462587.
- Saxton RA, Sabatini DM. mTOR Signaling in Growth, Metabolism, and Disease. Cell. 2017 Apr 6;169(2):361–371. PubMed PMID: 28388417.
- Loi M, Muller A, Steinbach K, et al. Macroautophagy proteins control MHC class I levels on dendritic cells and shape anti-viral CD8(+) T cell responses. Cell Rep. 2016 May 3;15(5):1076–1087. PubMed PMID: 27117419.
- Ben-Sasson SZ, Hogg A, Hu-Li J, et al. IL-1 enhances expansion, effector function, tissue localization, and memory response of antigen-specific CD8 T cells. J Exp Med. 2013 Mar 11;210(3):491–502. PubMed PMID: 23460726; PubMed Central PMCID: PMCPMC3600912.
- Zhao Z, Fux B, Goodwin M, et al. Autophagosome-independent essential function for the autophagy protein Atg5 in cellular immunity to intracellular pathogens. Cell Host Microbe. 2008 Nov 13;4(5):458–469. PubMed PMID: 18996346; PubMed Central PMCID: PMCPMC2682425.
- Kimmey JM, Huynh JP, Weiss LA, et al. Unique role for ATG5 in neutrophil-mediated immunopathology during M. tuberculosis infection. Nature. 2015 Dec 24;528(7583):565–569. PubMed PMID: 26649827; PubMed Central PMCID: PMCPMC4842313.
- Martinvalet D. The role of the mitochondria and the endoplasmic reticulum contact sites in the development of the immune responses. Cell Death Dis. 2018 Feb 28;9(3):336. PubMed PMID: 29491398; PubMed Central PMCID: PMCPMC5832423.
- Charni S, de Bettignies G, Rathore MG, et al. Oxidative phosphorylation induces de novo expression of the MHC class I in tumor cells through the ERK5 pathway. J Immunol. 2010 Sep 15;185(6):3498–3503. PubMed PMID: 20729331.
- Kurtoglu M, Maher JC, Lampidis TJ. Differential toxic mechanisms of 2-deoxy-D-glucose versus 2-fluorodeoxy-D-glucose in hypoxic and normoxic tumor cells. Antioxid Redox Signal. 2007 Sep;9(9):1383–1390. PubMed PMID: 17627467.
- Andresen L, Skovbakke SL, Persson G, et al. 2-deoxy D-glucose prevents cell surface expression of NKG2D ligands through inhibition of N-linked glycosylation. J Immunol. 2012 Feb 15;188(4):1847–1855. PubMed PMID: 22227571.
- Barbosa JA, Santos-Aguado J, Mentzer SJ, et al. Site-directed mutagenesis of class I HLA genes. Role of glycosylation in surface expression and functional recognition. J Exp Med. 1987 Nov 1;166(5):1329–1350. PubMed PMID: 2445888; PubMed Central PMCID: PMCPMC2189648.
- Oh DS, Kim TH, Lee HK. Differential role of anti-viral sensing pathway for the production of type I interferon beta in dendritic cells and macrophages against respiratory syncytial virus A2 strain infection. Viruses. 2019 Jan 15;11(1). PubMed PMID: 30650519; PubMed Central PMCID: PMCPMC6356365. DOI:https://doi.org/10.3390/v11010062
- Tal MC, Sasai M, Lee HK, et al. Absence of autophagy results in reactive oxygen species-dependent amplification of RLR signaling. Proc Natl Acad Sci U S A. 2009 Feb 24;106(8):2770–2775. PubMed PMID: 19196953; PubMed Central PMCID: PMCPMC2650341.
- Jounai N, Takeshita F, Kobiyama K, et al. The Atg5 Atg12 conjugate associates with innate antiviral immune responses. Proc Natl Acad Sci U S A. 2007 Aug 28;104(35):14050–14055. PubMed PMID: 17709747; PubMed Central PMCID: PMCPMC1955809.
- Hale AN, Ledbetter DJ, Gawriluk TR, et al. Autophagy: regulation and role in development. Autophagy. 2013 Jul;9(7):951–972. PubMed PMID: 24121596; PubMed Central PMCID: PMCPMC3722331.
- Loftus RM, Finlay DK. Immunometabolism: cellular Metabolism Turns Immune Regulator. J Biol Chem. 2016 Jan 1;291(1):1–10. PubMed PMID: 26534957; PubMed Central PMCID: PMCPMC4697146.
- Thwe PM, Pelgrom L, Cooper R, et al. Cell-intrinsic glycogen metabolism supports early glycolytic reprogramming required for dendritic cell immune responses. Cell Metab. 2017 Sep 5;26(3):558–567 e5. PubMed PMID: 28877459; PubMed Central PMCID: PMCPMC5657596.
- Du X, Wen J, Wang Y, et al. Hippo/Mst signalling couples metabolic state and immune function of CD8alpha(+) dendritic cells. Nature. 2018 Jun;558(7708):141–145. PubMed PMID: 29849151; PubMed Central PMCID: PMCPMC6292204.
- Cortese M, Sinclair C, Pulendran B. Translating glycolytic metabolism to innate immunity in dendritic cells. Cell Metab. 2014 May 6;19(5):737–739. PubMed PMID: 24807219; PubMed Central PMCID: PMCPMC4050200.
- Boya P, Pauleau AL, Poncet D, et al. Viral proteins targeting mitochondria: controlling cell death. Biochim Biophys Acta. 2004 Dec 6;1659(2–3):178–189. PubMed PMID: 15576050.
- Mizushima N, Yamamoto A, Matsui M, et al. In vivo analysis of autophagy in response to nutrient starvation using transgenic mice expressing a fluorescent autophagosome marker. Mol Biol Cell. 2004 Mar;15(3):1101–1111. PubMed PMID: 14699058; PubMed Central PMCID: PMCPMC363084.
- Kuma A, Hatano M, Matsui M, et al. The role of autophagy during the early neonatal starvation period. Nature. 2004 Dec 23;432(7020):1032–1036. PubMed PMID: 15525940.
- Lee HK, Mattei LM, Steinberg BE, et al. In vivo requirement for Atg5 in antigen presentation by dendritic cells. Immunity. 2010 Feb 26;32(2):227–239. PubMed PMID: 20171125; PubMed Central PMCID: PMCPMC2996467.
- Hara T, Nakamura K, Matsui M, et al. Suppression of basal autophagy in neural cells causes neurodegenerative disease in mice. Nature. 2006 Jun 15;441(7095):885–889. PubMed PMID: 16625204.
- Oh DS, Lee HK. Autophagy protein ATG5 regulates CD36 expression and anti-tumor MHC class II antigen presentation in dendritic cells. Autophagy. 2019 Mar;22:1–16. PubMed PMID: 30900506.
- Lee HK, Lund JM, Ramanathan B, et al. Autophagy-dependent viral recognition by plasmacytoid dendritic cells. Science. 2007 Mar 9;315(5817):1398–1401. PubMed PMID: 17272685.
- Oh DS, Oh JE, Jung HE, et al. Transient depletion of CD169(+) cells contributes to impaired early protection and effector CD8(+) T cell recruitment against mucosal respiratory syncytial virus infection. Front Immunol. 2017;8:819. PubMed PMID: 28751894; PubMed Central PMCID: PMCPMC5507946. .
- Stuart T, Butler A, Hoffman P, et al. Comprehensive integration of single-cell data. Cell. 2019 Jun 13;177(7):1888–1902 e21. PubMed PMID: 31178118; PubMed Central PMCID: PMCPMC6687398.