
ABSTRACT
The macroautophagy/autophagy-lysosome axis enables the clearance and degradation of cytoplasmic components including protein aggregates, damaged organelles and invading pathogens. Protein aggregation and lysosomal system dysfunction in the brain are common features of several late-onset neurological disorders including Alzheimer disease. Spatial overlap between depletion of the endosomal-sorting complex retromer and MAPT/tau aggregation in the brain have been previously reported. However, whether retromer dysfunction plays a direct role in mediating MAPT aggregation remains unclear. Here, we demonstrate that the autophagy-lysosome axis is the primary mode for the clearance of aggregated species of MAPT using both chemical and genetic approaches in cell models of amyloid MAPT aggregation. We show that depletion of the central retromer component VPS35 causes a block in the resolution of autophagy. We establish that this defect underlies marked accumulation of cytoplasmic MAPT aggregates upon VPS35 depletion, and that VPS35 overexpression has the opposite effect. This work illustrates how retromer complex integrity regulates the autophagy-lysosome axis to suppress MAPT aggregation and spread.
Introduction
Autophagy is a cellular “house-keeping” mechanism that clears protein aggregates, damaged organelles and invading pathogens from the cytoplasm, delivering them to the lysosome for degradation and recycling of their monomers [Citation1]. The selective autophagic turnover of protein aggregates is cytoprotective and termed “aggrephagy” [Citation2]. This process removes aggregated/amyloid species of MAPT/tau (microtubule associated protein tau) that form intracellular inclusions in neurodegenerative diseases termed “tauopathies”. For example, MAPT aggregation can lead to the formation of intraneuronal neurofibrillary tangles and neuropil threads in Alzheimer disease, features that correlate strongly with cognitive decline [Citation3,Citation4].
Amyloids of MAPT do not satisfy all criteria to be considered a true “prion” but instead are said to be “prion-like”. This is because they are not infectious but are capable of strain-specific replication [Citation5,Citation6,Citation7,Citation8,Citation9]. When misfolded oligomers of MAPT (or “seeds”) exit the neuron through exosomes or extracellular vesicles, they can enter anatomically connected neurons through endocytosis and/or micropinocytosis [Citation10,Citation11]. Endo-membrane damage allows misfolded MAPT to escape the endosomal-network and induce aggregation of naïve MAPT in the cytoplasm [Citation12]. This demonstrates how MAPT pathology can spread trans-neuronally to distinct parts of the brain, and how this spread could be controlled by effective lysosomal degradation of autophagic cargo. Importantly, lysosomal degradation becomes highly dysfunctional in tauopathies such as Alzheimer disease [Citation13,Citation14,Citation15,Citation16].
Recently, retromer was demonstrated to be important for the maintenance of autophagy and lysosomal system function [Citation17,Citation18]. Retromer is an evolutionarily conserved endosomal coat-complex consisting of vacuolar protein sorting components VPS35, VPS26 and VPS29 that orchestrates the endosome-to-Golgi and -plasma membrane sorting of numerous transmembrane receptors [Citation19,Citation20,Citation21]. Importantly, the entorhinal cortex shows marked reduction in the retromer complex components VPS35 and VPS26 in Alzheimer disease [Citation22]. Reduction in retromer components is also observed in other tauopathies, including progressive supranuclear palsy and Pick disease [Citation23]. While studies have identified an inverse relationship between MAPT hyperphosphorylation and VPS35 expression, the mechanism behind this phenomenon and whether MAPT aggregation per se is influenced is currently unknown [Citation23,Citation24,Citation25,Citation26].
In the present study, we used cultured cell systems that propagate MAPT aggregates to investigate the relationship between tauopathy, the autophagy-lysosome axis and VPS35 expression. We found the autophagy-lysosome axis is critical for clearing aggregated species of MAPT and/or their precursors from the cytoplasm. We also show that retromer component VPS35 is important for normal autophagic flux, and that its depletion enhances MAPT aggregation in a manner consistent with a block in flux. Through over-expression of VPS35, we demonstrate that MAPT aggregation is minimized. Our results support a model wherein retromer dysfunction lies upstream of lysosomal dysfunction to provide a cellular landscape that permits the accumulation of aggregated tau.
Results
Seeding induces tangle-like pathology in cells expressing mutant MAPT
Six isoforms of MAPT are expressed in the adult human brain and vary by inclusion of N1 and N2 inserts in the projection domain, and R2 in the microtubule-binding repeat domain (RD) (Fig. S1A). Different amyloid conformations of the amino acid sequence within and immediately flanking the RD of MAPT are characteristic to different tauopathies () [Citation27,Citation28,Citation29]. To investigate how defective autophagy and protein trafficking might contribute to tauopathies, we first established accelerated cell culture systems that recapitulate tangle-like pathology similar to those previously published [Citation5,Citation6]. Briefly, HEK293 cells were transduced to express GFP (green fluorescent protein)-tagged MAPT RD carrying MAPTP301L, and MAPTV337M mutations (numbering based on full-length [FL] MAPT; hereafter “MAPT RD-GFP”) that cause frontotemporal dementia and parkinsonism linked to chromosome 17 (Fig. S1A). MAPT aggregation can be accelerated by delivering “corrupted” MAPT (misfolded/aggregated) to the cytoplasm, where these “seeds” can access naïve MAPT and promote their aggregation in a process referred to as “seeding”. To this end, we seeded cells with brain lysate from a six-month-old rTg4510 MAPTP301L transgenic mouse which contained aggregated MAPT ( and S1B). GFP-positive MAPT aggregation was observed in approximately one-third of cells expressing MAPT RD-GFP after seeding with rTg4510 but not non-transgenic littermate brain lysate, or in cells expressing GFP as a control protein (). Notably, expression of MAPT RD-GFP alone did not spontaneously aggregate (). This illustrates that proteopathic seeding requires a supply of both monomeric MAPT and a corrupted form to efficiently induce aggregation. Conversion into an aggregated state after seeding with rTg4510 brain lysate did not alter the amount of MAPT RD-GFP at the whole-cell level after standard lysis (Fig. S1C). Rather, it resulted in a striking increase in the amount resolved in the detergent-insoluble fraction after differential sedimentation, similar to previous reports () [Citation12].
Figure 1. Seeding induces tangle-like pathology in cells expressing mutant MAPT. (A) Amino acid sequence of wild-type MAPT. The regions that form fibril cores in distinct tauopathies are underlined. Blue, residues that when mutated cause frontotemporal dementia and parkinsonism linked to chromosome 17 MAPTP301L, MAPTV337M. (B) Summary of the method for inducing MAPT aggregation in cells after seeding. (C) Confocal images of cells expressing MAPT RD-GFP or GFP, seeded with rTg4510 or non-transgenic brain lysate. Scale bar: 100 µm. Blue, DAPI-stained nuclei. (D) Percentage of cells bearing GFP-positive aggregates in (C). Values are the mean ± SEM from n = 4 fields/condition (>500 cells/field) from two independent experiments (one sample t-test compared to 0; ***p < 0.001; nd, not detected). (E) Immunoblot of fractions recovered after differential sedimentation. Cells expressing MAPT RD-GFP were seeded with rTg4510 or non-transgenic brain lysate. A representative of four independent experiments is shown. (F) Confocal images of HsESC-derived cortical neurons expressing MAPT RD-GFP seeded with rTg4510 or non-transgenic brain lysate. Cells were immunostained for the neuronal marker MAP2. Scale bar: 40 µm. Insets show further 2.5× magnification. Blue, DAPI-stained nuclei. (G) Confocal images of cells expressing GFP-FL MAPTP301L (0N4R) or GFP, seeded as indicated. Scale bar: 10 µm. Blue, DAPI-stained nuclei. (H) Confocal image of cells expressing GFP-FL MAPTP301L (0N4R) seeded with rTg4510. Cells were immunostained for MAPT hyperphosphorylation at S202 and T205 (AT8). Scale bar: 10 µm. Insets show further 2.5× magnification. Blue, DAPI-stained nuclei
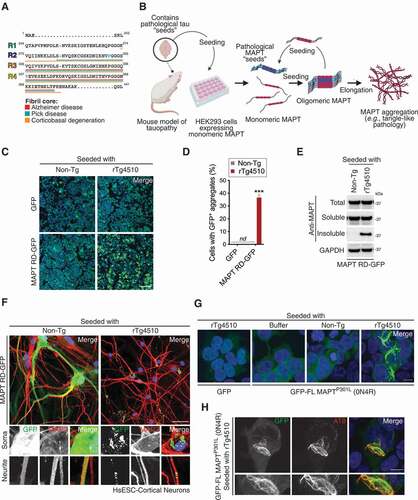
Following this, human embryonic stem cells (HsESC) were used to derive cortical neurons. The neuronal cells were then transduced to express MAPT RD-GFP and seeded with rTg4510 or non-transgenic control brain lysate. Consistent with our observations in HEK293 cells, MAPT aggregation was only observed after seeding with rTg4510 brain lysate (). MAPT aggregation was observed in MAP2 (microtubule associated protein 2)-positive neurons (). Importantly, the MAPT aggregation observed largely reflected human neuronal tauopathy in vivo. Specifically, we observed tangle-like inclusions in the soma and smaller inclusions within neurites ().
Seeded aggregates of FL MAPTP301L (0N4R) are hyperphosphorylated
To confirm that the aggregation observed after seeding was not an artifact of expressing the truncated RD of MAPT, we transiently transfected HEK293 cells with a GFP-tagged FL isoform of MAPT lacking both N-terminal inserts (0N4R) carrying the disease-associated MAPTP301L mutation or GFP alone (). Only cells expressing mutant MAPT could be seeded with rTg4510 brain lysate into aggregates with thread-like appearance, a feature that failed to occur after seeding with non-transgenic brain lysate, homogenization buffer, or in GFP-expressing cells seeded with rTg4510 brain lysate (). Intriguingly, these were found to be hyperphosphorylated at S202/T205, as detected with the well-characterized AT8 antibody (). This illustrates that the MAPT aggregation produced in this system from proteopathic seeding retains several key biological features observed in disease.
Generation of Prion-like cells that stably propagate MAPT aggregates
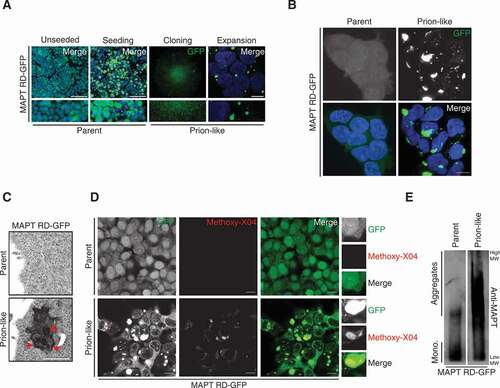
After seeding MAPT RD-GFP-expressing cells with rTg4510 brain lysate to form intracellular MAPT inclusions, we clonally isolated and expanded cells that could stably propagate MAPT aggregates from mother-to-daughter cells with high fidelity, similar to that previously published ( and S2A) [Citation5,Citation6]. These daughter cell lines featured MAPT inclusions in the cytoplasm and nucleus that were maintained after passaging. Cells that faithfully propagated aggregated MAPT were hereafter referred to as “prion-like” to distinguish from their “parent” cell line which were unseeded (). Ultrastructural analysis revealed electron-dense inclusions in the cytoplasm of prion-like cells that were absent in parent cells (). Consistent with such observations, aggregated but not soluble MAPT colocalized with the florescent Congo Red-derivative Methoxy-X04 ( and S2B) [Citation30]. This illustrates that the MAPT aggregation observed in prion-like cells have amyloid/cross-β structure. Crude separation of monomeric and high-order MAPT aggregates showed a low molecular weight MAPT-immunoreactive smear corresponding to monomeric MAPT in both parent and prion-like cells (). However, a much stronger high molecular weight smear was observed in prion-like cell lysate, indicating MAPT aggregation biochemically ().
Figure 2. Generation of cells that stably propagate MAPT aggregates. (A) Different steps in the generation of MAPT RD-GFP prion-like cells. Panels indicate the following steps. Unseeded, MAPT RD-GFP expressing cells that were not seeded with mouse brain lysate. Scale bar: 100 µm. Seeding, cells that were seeded with rTg4510 brain lysate to induce intracellular MAPT RD-GFP aggregation (note: the image presented was duplicated from ). Scale bar: 100 µm. Cloning, a colony of seeded cells that stably propagate MAPT RD-GFP aggregates, imaged at low magnification. Expansion, the colony of seeded cells that stably propagate MAPT RD-GFP aggregates were passaged and used in experiments where they are referred to as “prion-like” cells. Scale bar: 10 µm. Blue, DAPI-stained nuclei in unseeded, seeding and expansion panels. See Fig. S2A for a summary of the process. (B) Confocal images of MAPT RD-GFP parent or prion-like cells. Blue, DAPI-stained nuclei. (C) Transmission electron microscopy images of MAPT RD-GFP parent and prion-like cells. Arrowheads (red) indicate examples of electron-dense aggregation. Scale bar: 1 µm. (D) Confocal images of MAPT RD-GFP parent or prion-like cells stained with the fluorescent amyloid-binding dye Methoxy-X04. Scale bar: 10 µm; insets show further 2.5× magnification. (E) SDD-AGE/immunoblot of MAPT RD-GFP parent or prion-like cell lysates probed for MAPT. Cropped lanes from the same blot with identical exposure are shown. A representative of two independent experiments is shown
MAPT aggregation elicits negligible cell toxicity
To investigate whether MAPT aggregation was toxic, we assessed the uptake of the florescent ANXA5/annexin V (annexin A5) and DAPI by flow cytometry. ANXA5 recognizes extracellular facing phosphatidylserine in cells undergoing apoptosis [Citation31,Citation32,Citation33]. In contrast, DAPI (similar to propidium iodide) binds DNA and is typically excluded from living cells; however, it can enter cells after plasma membrane rupture in dead cells, or during the late stages of apoptosis [Citation31,Citation33]. Therefore, uptake of these dyes can indicate early (ANXA5 positive and DAPI negative) and late stages of cell death (ANXA5 positive and DAPI positive) (Fig. S2C). The distribution of cell populations including or excluding the reporter dyes was found to be largely comparable between parent and prion-like cells (Fig. S2D). Specifically, the fraction of viable cells (ANXA5 negative and DAPI negative) was unchanged at ~87%; however, this was ~7% less than in non-transduced control cells (Fig. S2E). Despite this, significant but minor increases of ~2.7% and ~0.2% in early apoptosis (ANXA5 positive and DAPI negative) and late apoptosis/death (ANXA5 positive and DAPI positive), respectively, were noted in prion-like cells compared to parent cells (Fig. S2E). From this, we conclude that MAPT aggregation elicits negligible cell toxicity in this system.
Small MAPT aggregates rapidly accumulate after autophagy inhibition
Using this system, we next sought to interrogate the role of autophagy in mediating the removal and degradation of cytoplasmic aggregates of MAPT. A critical step in the resolution of autophagy after autophagosomes have fused with lysosomes is the enzymatic digestion of newly-delivered cargo, a process that can be inhibited with the lysosomotropic compound chloroquine (CQ) [Citation34]. After the induction of autophagy, the yeast Atg8 ortholog MAP1LC3B/LC3B (microtubule associated protein 1 light chain 3 beta) undergoes proteolytic processing to form LC3B-I followed by lipidation to form LC3B-II which anchors into the nascent phagophore [Citation35]. Because LC3B is consumed by autophagy, analysis of its processing is an informative way to interrogate the autophagy-lysosome pathway. Under normal conditions the ratio of the autophagic substrate LC3B-II to -I appeared unaltered between prion-like and parent cells ( and S3A). Blocking the resolution of autophagy with CQ for 24 h resulted in a similar degree of LC3B-II accumulation in both cell lines, hinting that basal autophagic flux is unaffected by the structural state of MAPT ( and S3A). Surprisingly, only after harsh lysis conditions (lysis buffer supplemented with 2.5% sodium dodecyl sulfate [SDS] and exclusion of clarification) could prion-like cells be distinguished from parent cells with the appearance of a high molecular mass species of MAPT RD-GFP at ~50 kDa on long exposure of the immunoblot ( and S3B). However, even under such lysis conditions, shorter exposures of the same immunoblots showed the total cellular amount of MAPT RD-GFP was unchanged by exposure to CQ for 24 h (, S3A and B).
Figure 3. MAPT aggregates rapidly accumulate after inhibition of autophagy. (A) Immunoblot of whole-cell lysates from MAPT RD-GFP parent or prion-like cells treated with or without CQ for 24 h, probed for indicated proteins. Stringent lysis conditions were followed. (B) Confocal images of MAPT RD-GFP parent or prion-like cells treated with or without CQ for 24 h. Scale bar: 10 µm. Insets show further 2.5× magnification. Blue, DAPI-stained nuclei. (C) GFP-positive aggregates per cell from MAPT RD-GFP prion-like cells in (B). Values are the mean ± SEM from n = 12–14 fields/condition from two independent experiments (unpaired t-test; ****p < 0.0001). (D) Frequency of different-sized GFP-positive aggregates from (B). Values are observed frequency/cell pooled from two independent experiments. (E) Immunoblot of whole-cell lysates from MAPT RD-GFP prion-like cells exposed to ATG5 or non-targeting control siRNAs for 7-days, probed for the indicated proteins. (F) Confocal images of MAPT RD-GFP prion-like cells exposed to ATG5 or non-targeting control siRNAs for 7-days. Scale bar: 10 µm. Insets show further 2.5× magnification. Blue, DAPI-stained nuclei. (G) GFP-positive aggregates per cell from (F). Values are the mean ± SEM from n = 10 fields/condition from two independent experiments (one-way ANOVA with Dunnett’s multiple comparisons test; *p < 0.05, ****p < 0.0001). (H) Confocal images of MAPT RD-GFP prion-like cells treated with or without a combination of AZD8055 and CQ for 24 h. Cells were immunostained for GFP, LC3B and LAMP2. Scale bar: 10 µm. Insets show further 2.5× magnification, as well as Z-axis profile (Z). (I) Confocal image of MAPT RD-GFP prion-like cells immunostained for ubiquitin (UBC) or SQSTM1. Scale bar: 10 µm. Insets show further 2.5× magnification. Blue, DAPI-stained nuclei
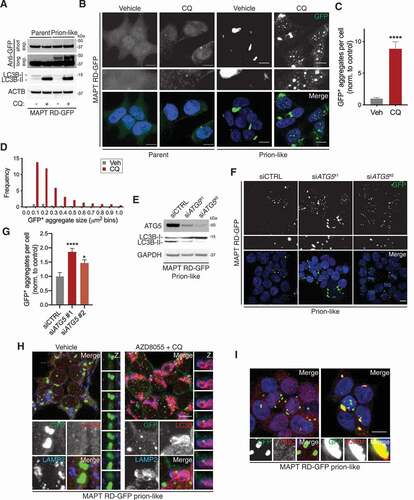
Treatment of parent cells with CQ led to a modest change in the diffuse cytoplasmic distribution of MAPT RD and the formation of some small GFP-positive inclusions, albeit infrequently (). In stark contrast, treatment of prion-like cells with CQ led to a dramatic accumulation of GFP-positive inclusions throughout the cytoplasm and nucleus (). Quantification revealed an ~8.8-fold increase in the number of GFP-positive aggregates per cell after treatment with CQ in prion-like cells, which was supported by an increase in the frequency of small aggregates <0.5 µm2 in size (). In addition, under basal conditions, aggregated MAPT did not show obvious colocalization with the endosomal markers EEA1 (early endosome antigen 1) and VPS26, or lysosomal marker LAMP2 (lysosomal associated membrane protein 2) (Fig. S3C).
To determine if the CQ-dependent increase in MAPT aggregation was attributable to perturbed autophagy, we depleted prion-like cells of ATG5 (autophagy related 5) with short interfering RNA (siRNA). ATG5 plays a critical role during the elongation phase of autophagy by regulating the E3-like lipidation of Atg8 orthologs [Citation36]. The depletion of ATG5 reduced the amount of LC3B-II, in line with defective lipidation and autophagosome biogenesis (). Further, ATG5 depletion led to an ~1.5- to ~1.9-fold increase in MAPT aggregation compared to a control siRNA (). This indicated that the lysosomal degradation of MAPT aggregates requires autophagy as a delivery system. Consistently, treatment of prion-like cells with the serine/threonine protein kinase MTOR (mechanistic target of rapamycin kinase) inhibitor AZD8055 in concert with CQ for 24 h to induce autophagy initiation while simultaneously preventing lysosomal resolution led to the appearance of MAPT aggregates within LC3B- and LAMP2-positive vesicles () [Citation37]. This shows that aggregated MAPT is delivered to the lysosome through autophagy, in agreement with the increase in MAPT aggregation caused by ATG5 depletion.
The prototypical earmark for selective autophagy is covalent target protein modification with UBC (ubiquitin C). Notably, MAPT aggregates largely failed to overlap with UBC in prion-like cells, akin to previous findings () [Citation12]. Instead, considerable overlap between the autophagic cargo receptor SQSTM1/p62 (sequestosome 1) and MAPT aggregates was observed throughout the cytoplasm of prion-like cells, indicating that a UBC-independent form of selective autophagy may contribute to their removal (). These results are similar to another study where SQSTM1 labeled STAT5A aggregates for clearance in a UBC-independent manner [Citation38].
Proteasome inhibition does not affect MAPT aggregation
Despite a remarkable increase in MAPT aggregation after lysosomal inhibition with CQ, we failed to observe any change to the total level of MAPT. To explore the possibility that upregulated proteasomal degradation of MAPT might account for this, the 26S proteasome inhibitor MG-132 was added to cells for the final 12 h of a 24 h treatment with or without CQ. For both parent and prion-like cells, MG-132 alone or in combination with CQ did not alter the total levels of MAPT RD-GFP (~37 and ~50 kDa species), despite increasing the levels of UBC and LC3B-II, respectively (Fig. S3B). Therefore, this likely rules out proteasomal contribution. Proteasome inhibition with MG-132 did not induce spontaneous aggregation of MAPT in parent cells, nor did it affect the number of GFP-positive aggregates per cell in prion-like cells (Fig. S3D and E). These observations indicate that the autophagy-lysosome axis, not the proteasome, is the primary degradative route for MAPT aggregates and/or seed-competent species of MAPT, without obvious impacts on the total amount of MAPT.
Soluble and aggregated MAPT are differentially phosphorylated at S262 in response to CQ-treatment
In vivo MAPT aggregation temporally co-occurs with hyper-phosphorylation of MAPT at numerous sites. With that said MAPT phosphorylation alone is not an absolute predictor of aggregation [Citation39]. We determined whether the structural state of MAPT influences its hyperphosphorylation in response to autophagy inhibition. We chose to assess the phosphorylation state of MAPT at S262 within its RD, a site known to be phosphorylated in tauopathy, in lysates from cells treated with or without CQ for 24 h [Citation40]. Under vehicle-treated conditions, the phosphorylation state of MAPT RD-GFP at S262 was unchanged between parent and prion-like cells (Fig. S3F). Unexpectedly, parent but not prion-like cells showed a strong CQ-dependent reduction in phosphorylation at this site (Fig. S3F). These findings show that MAPT hyper-phosphorylation at S262 alone cannot be used to predict the structural state of MAPT. A change in the balance of phosphatase and kinase activity toward S262 likely accounts for the responsivity to CQ in parent cells. Considering that S262 is adjacent to the sections of MAPT known to constitute fibril cores in disease, a plausible explanation for the lack of response to CQ in prion-like cells is that this residue might be inaccessible for modification when MAPT is aggregated.
VPS35 deficiency perturbs autophagic flux
Perturbations to the endosomal coat-complex retromer are common to numerous neurodegenerative diseases, including several tauopathies and Parkinson disease, hinting toward a common mode of pathology. To disrupt retromer, we used siRNA to silence the expression of its central component VPS35. VPS35 is a stable and long-lived protein, so we first determined the minimum duration of siRNA exposure in HEK293 cells that produced a clear reduction in VPS35 by immunoblot to be five days, at which time a marked accumulation of LC3B-II was apparent (Fig. S4A).
We next interrogated whether autophagic flux was modified by depletion of VPS35 in HeLa cells that stably expressed the red fluorescent protein (RFP)-GFP-LC3B reporter [Citation41]. This system can sensitively measure the delivery of recombinant LC3B to lysosomes during autophagy. This is accomplished through sensitivity and resistance of GFP and RFP, respectively, to quenching in acidic environments such as the lysosome [Citation41,Citation42]. Flow cytometry in live cells revealed an ~3-fold increase in GFP and an ~2.6-fold increase in RFP florescence intensities after VPS35 depletion compared to a control siRNA (). A reduction in the RFP:GFP ratio in VPS35-depleted cells compared to the control condition was illustrated by a leftward skewing on the histogram (). These data indicate that VPS35-deficient cells have reduced autophagic flux, as they are accumulating more of the recombinant LC3B reporter, and a higher fraction of which inhabits a neutral pH environment. We reasoned that this could be attributed to a block in the resolution of autophagy (i.e., autophagosome-lysosome fusion and/or lysosomal hydrolysis).
Figure 4. VPS35-deficiency disrupts autophagic flux. (A) Flow cytometry determination of GFP and RFP florescence intensities from RFP-GFP-LC3B reporter cells exposed to VPS35 or non-targeting control siRNAs for 7-days. Values are the mean ± SEM from n = 4 samples per condition from two independent experiments (unpaired t-test; ****p < 0.0001). (B) Histogram from (A). Values are the cell count normalized to mode respective to RFP:GFP florescence ratio. A representative from n = 4 samples per condition from two independent experiments is shown. (C) Illustration of the retromer complex. (D) Immunoblot of whole-cell lysates from cells exposed to VPS35 or non-targeting control siRNAs for 7-days then treated with or without CQ for 4 h. A representative of three independent experiments is shown. (E) Immunoblot of whole-cell lysates from cells exposed to VPS35 or non-targeting control siRNAs for 10-days, probed for indicated proteins. A representative of three independent experiments is shown. (F) Immunoblot of density gradient purified lysosomes from WT or VPS35-KO cells, probed for CTSD. A representative of three independent experiments is shown
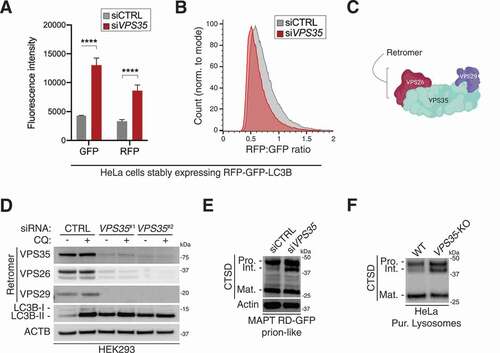
To test this, we treated VPS35-depleted HEK293 cells with or without CQ for 4 h and monitored LC3B processing by immunoblotting. The knockdown of VPS35 led to pronounced reductions in all three core retromer components, consistent with previous findings [Citation43] (). This demonstrated that without VPS35 the assembly of retromer is inhibited and its other components presumably degraded. Indeed, high basal autophagic flux was demonstrated in control knockdown cells after the addition of CQ which led to a large increase in LC3B-II (). In contrast, the high level of LC3B-II in vehicle-treated VPS35-depleted cells was unmodified by the addition of CQ, confirming compromised autophagy resolution (). Similarly, this reduced sensitivity to CQ was observed in VPS35 knockout HeLa cells but not in cells lacking SNX27 (sorting nexin 27), a retromer-interacting protein that is required for endosome-to-plasma membrane trafficking (Fig. S4B) [Citation17]. Taken together, these data indicate that the accumulation of autophagic machinery in retromer-deficient cells is attributable to a block in the resolution of autophagy and occurs independently of altered endosome-to-plasma membrane trafficking.
VPS35-deficient cells have altered lysosomal proteolysis
To explore the possibility that lysosomes from VPS35-deficient cells have reduced degradative capacity, we analyzed the step-wise proteolytic maturation of the lysosomal enzyme CTSD (cathepsin D). Proteolytic activation of CTSD is highly dependent on the activity of other lysosomal proteases, and the accumulation of its precursors indicates an imbalance of their activities [Citation44]. Using an antibody that detects pro- and intermediate precursors as well as mature CTSD, we found that VPS35-depleted cells accumulated both precursor forms but retained a normal amount of the mature form ( and S4C). This observation was consistent in purified lysosomes from VPS35 knockout HeLa cells (). These data show that the steady-state abundance of CTSD in lysosomes is unaffected by VPS35 deficiency but rather that its proteolytic maturation is perturbed, suggesting altered lysosomal proteolysis.
VPS35-deficient cells accumulate MAPT aggregates
We speculated whether the autophagic/lysosomal defect that accompanied VPS35 depletion influenced cellular clearance of MAPT aggregates. Depletion of VPS35 reduced VPS26 and VPS29 levels and led to ~3-fold increases in the amount of LC3B-II as well as the LC3B-II:-I ratio compared to a control knockdown ( and S5A). VPS35 depletion led to a dramatic accumulation of GFP-positive inclusions, predominantly throughout the cytoplasm (). Quantification revealed an ~7-fold increase in the number of GFP-positive aggregates per cell after VPS35 depletion, supported by an increase in the frequency of aggregates between 0.1–1 µm2 in size ().
Figure 5. VPS35-deficiency disrupts the lysosomal clearance of MAPT aggregates. (A) Immunoblot of whole-cell lysates from MAPT RD-GFP prion-like cells exposed to VPS35 or non-targeting control siRNAs for 10-days, probed for indicated proteins. (B) Confocal images of MAPT RD-GFP prion-like cells exposed to VPS35 or non-targeting control siRNAs for 10-days. Scale bar: 10 µm. Insets show further 2.5× magnification. Blue, DAPI-stained nuclei. (C) GFP-positive aggregates per cell from (B). Values are the mean ± SEM from n = 29–30 fields per condition from three independent experiments (Mann-Whitney U-test; **p < 0.01). (D) Frequency of different-sized GFP-positive aggregates from (B). Values are observed frequency per cell pooled from three independent experiments. (E) Confocal images of MAPT RD-GFP prion-like cells exposed to VPS35 or non-targeting control siRNAs for 10-days then treated with or without CQ for 18 h. Scale bar: 10 µm. Insets show further 2.5× magnification. Blue, DAPI-stained nuclei. (F) GFP-positive aggregates per cell from (E). Values are the mean ± SEM from n = 10 fields per condition from two independent experiments (two-way ANOVA with Tukey’s multiple comparisons test; **p < 0.01; ns, not significant)
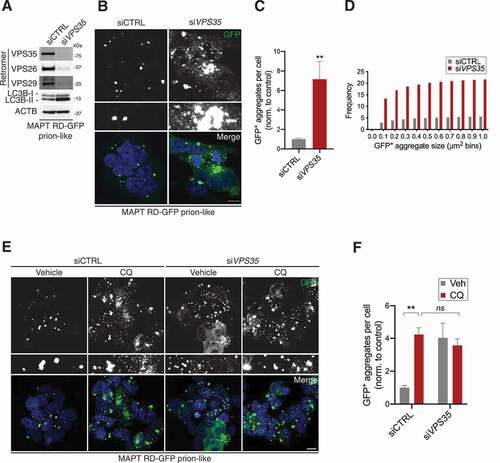
The extent to which perturbed autophagy and lysosomal clearance contributed to the accumulation of MAPT aggregates in VPS35-depleted cells was interrogated by treating cells with or without CQ for 18 h. Indeed, CQ failed to enhance the basally higher number of MAPT aggregates in VPS35-depleted cells, indicating that perturbed lysosomal clearance was the culprit (). Interestingly, only ~20% of MAPT aggregates found to accumulate throughout the cytoplasm in VPS35-depleted cells were SQSTM1 positive, which was ~3-fold less than in control cells (Fig. S5B and C). This indicates that upon retromer depletion, MAPT aggregates accumulate quicker than some autophagy cargo receptors can recognize and bind.
VPS35-deficiency increases MAPT aggregation in human cortical neurons
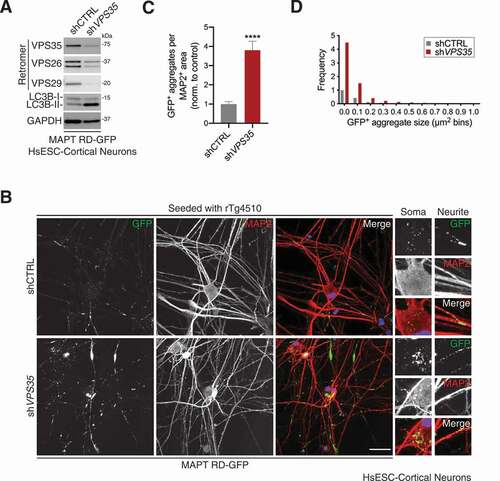
We next examined MAPT aggregation following VPS35 deficiency in HsESC-derived cortical neuronal cultures. The cultured neurons were transduced to express MAPT RD-GFP in concert with short hairpin RNA (shRNA) against VPS35 or a non-targeting control. VPS35 depletion was detectable by immunoblot, along with reductions in VPS26 and VPS29 indicating reduced retromer assembly (). Consistent with a block in autophagic flux described earlier, LC3B-II levels were elevated in VPS35-depleted cultures (). After seeding cultures with rTg4510 brain lysate, quantification revealed an ~3.8-fold increase in MAPT aggregation per µm2 of MAP2-positive area in VPS35-depleted neurons, which was supported by an over-representation of small aggregates <0.3 µm2 in size ().
Figure 6. VPS35-deficiency increases MAPT aggregation in cortical neurons. (A) Immunoblot of whole-cell lysates from HsESC-derived cortical neurons expressing MAPT RD-GFP in combination with shRNA targeting VPS35 or a non-targeting control, probed for the indicated proteins. (B) Confocal images of HsESC-derived cortical neurons expressing MAPT RD-GFP in combination with shRNA targeting VPS35 or a non-targeting control. Cells were seeded with rTg4510 brain lysate. Cells were immunostained for the neuronal marker MAP2. Scale bar: 40 µm. Insets show further 2.5× magnification. Blue, DAPI-stained nuclei. (C) GFP-positive aggregates per MAP2 positive area from (B). Values are the mean ± SEM from n = 21–22 fields per condition from two independent experiments (unpaired t-test; ****p < 0.0001). (D) Frequency of different-sized GFP-positive aggregates from (B). Values are observed frequency/neuronal area pooled from two independent experiments
VPS35 over-expression reduces MAPT aggregation
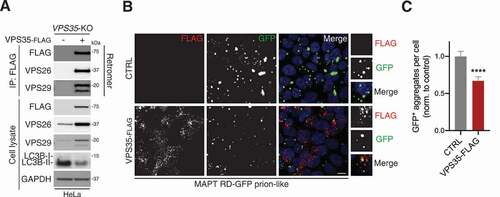
Since VPS35 depletion increased the abundance of aggregated MAPT, we wondered whether its over-expression would result in an opposite effect. We first generated a vector that expresses human VPS35 carrying a C-terminal FLAG-epitope tag. When stably expressed in VPS35 knockout HeLa cells, it co-purified with endogenous VPS26 and VPS29 after anti-FLAG immunoprecipitation (). It also reduced the high LC3B-II levels in VPS35 knockout cells, indicating that the rescue construct was functional (). To determine whether over-expression of VPS35-FLAG in prion-like cells diminished MAPT aggregate burden, cells were transiently transfected with VPS35-FLAG or an empty vector for 48 h. As expected, immunodetection revealed localization of VPS35-FLAG to vesicles throughout the cytoplasm of transfected cells, consistent with the decoration of endosomes (). Cells that over-expressed VPS35-FLAG had one-third fewer GFP-positive aggregates per cell to those transfected with the control plasmid (, C and S6). Collectively, our findings established that VPS35 expression inversely correlates with MAPT aggregation.
Figure 7. VPS35 over-expression reduces MAPT aggregation. (A) Anti-FLAG immunoprecipitation/immunoblot from VPS35-KO cells with or without stable rescue with VPS35-FLAG. A representative of three independent experiments is shown. (B) Confocal images of MAPT RD-GFP prion-like cells transiently transfected with VPS35-FLAG or empty vector for 48 h. Cells were immunostained for FLAG. Scale bar: 10 µm. Insets show further 2.5× magnification. Blue, DAPI-stained nuclei. (C) GFP-positive aggregates per cell from (B). Values are the mean ± SEM from n = 133–144 cells per condition from two independent experiments (Mann-Whitney U-test; ****p < 0.0001)
Discussion
In this study, cells that propagated aggregated species of MAPT were created to study the relationship between autophagy, VPS35 expression and MAPT aggregation. Only when seeded with mouse brain lysate containing “corrupted” MAPTP301L could mutant MAPT RD convert into an insoluble, aggregated and hyper-phosphorylated state. These seeding-based approaches are advantageous when modeling tauopathy in cells because the resulting aggregation closely mirrors human disease in a quick experimental timeframe (<16 h after seeding). The generation of “prion-like” cells fast-tracks this process further as cells can stably propagate MAPT aggregates that are amyloid in nature, negating requirements for further seeding during experiments. This model is highly tractable and enables analysis of individual MAPT aggregates and their morphology at high resolution. In this system, we show that inhibition of autophagy resolution enhances MAPT aggregation, with over-representation of smaller-sized aggregates indicating that they (or their precursors) are favorable substrates for autophagic clearance from the cytoplasm. In addition, the recognition of aggregated forms of MAPT by the autophagic cargo receptor SQSTM1 is largely UBC-independent. Supporting a dominant role for autophagy, we found that proteasome inhibition does not influence the amount of aggregated MAPT.
Because MAPT aggregation co-occurs with retromer depletion in disease, we modeled retromer deficiency using genetic approaches targeting VPS35. VPS35 depletion led to an accumulation of autophagic machinery, namely LC3B-II, that was due to a block in the resolution of autophagy. This appeared to be mediated – at least in part – by perturbed delivery and lysosomal degradation. We found that perturbed autophagy contributed to an increase in cytoplasmic MAPT aggregation in VPS35-depleted prion-like cells, as well as in HsESC-derived cortical neurons after seeding.
Autophagy and lysosomal integrity are critically important for protein homeostasis in terminally differentiated neurons as protein aggregates and damaged organelles cannot be diluted out by mitosis. Here we show that autophagy is important for consuming small seed-competent species of MAPT. In the brain, this circumstance would likely enhance the spread of corrupted MAPT species to interconnected neurons, a feature that correlates well with cognitive decline [Citation4,Citation10,Citation11].
The retromer complex plays a critical role in the maintenance of normal autophagy and lysosomal integrity [Citation17,Citation18]. Multiple neuroprotective roles of retromer have been elucidated in the context of Parkinson disease, for which VPS35D620N is causative [Citation45,Citation46,Citation47,Citation48]. Retromer components VPS35 and VPS26 are downregulated in the entorhinal cortex of people with Alzheimer disease, a brain region that shows some of the earliest signs of MAPT deposition [Citation22,Citation49]. Moreover, retromer prevents pathogenic amyloid-β generation and plaque formation, which is known to drive tangle pathology [Citation22,Citation50,Citation51]. Furthermore, all three core retromer components are reduced in the hippocampus and frontal cortex of other tauopathies such as progressive supranuclear palsy and Pick disease [Citation23]. In addition, Parkinson disease-linked VPS35 mutations enhance SNCA (synuclein alpha) aggregation [Citation48]. Collectively, these observations point toward a multi-faceted role of retromer in protecting against the deleterious effects of aggregate-prone proteins.
Other studies have also examined the relationship between VPS35 and MAPT but these differ from our study in key ways [Citation23–26]. We focused on using bona-fide MAPT aggregation rather than its phosphorylation status as a read-out. Stereotactic injection with adeno-associated virus to silence VPS35 expression in transgenic MAPTP301S mice enhances MAPT phosphorylation [Citation23]. Similar findings have been reported in mouse N2a cells that express human MAPT and in Alzheimer disease patient-derived induced pluripotent stem cell-derived neurons [Citation23,Citation25]. Furthermore, adeno-associated virus-mediated over-expression of VPS35 in 3× Tg mice was found to modestly reduce MAPT phosphorylation and insolubility while rescuing behavioral deficits [Citation24]. Parkinson disease-linked VPS35D620N knockin mice also show appreciably more phosphorylated endogenous MAPT [Citation26]. Collectively, these investigations predominantly used MAPT phosphorylation as a read-out for tauopathy, which is not a direct measure of aggregation. For example, despite being hyperphosphorylated during embryonic development, MAPT is not aggregated [Citation39]. Indeed, we demonstrated that tauopathy-linked phosphorylation at S262 does not correlate well with MAPT aggregation.
Our results indicate that retromer is crucial for the maintenance of lysosomal function and the autophagic clearance of MAPT aggregates. In line with our findings, modest reductions in AT270- and MC-1-dectable MAPT epitopes in N2a cells co-expressing human MAPT and VPS35 are abolished by the lysosomal inhibitor pepstatin A [Citation23]. Together, these observations place retromer dysfunction temporally upstream of lysosomal dysfunction in tauopathy.
How does retromer deficiency perturb lysosomal function and autophagy? Our previous work in VPS35 knockout HeLa cells failed to detect changes in lysosome acidification but rather revealed reduced lysosomal degradation of the DQ-BSA probe, as well as reduced lysosomal targeting and in vitro activity of the lysosomal enzyme GLB1/β-galactosidase (galactosidase beta 1) [Citation17]. Retromer dysfunction has been tied to improper CTSD processing and secretion, thought to be the result of altered retrieval of IGF2R/CI-MPR (insulin like growth factor 2 receptor), a receptor that targets hydrolases to the lysosome [Citation20,Citation52,Citation53,Citation54,Citation55]. Recent findings have challenged these assumptions, showing that trafficking of IGF2R can occur in a manner largely dependent on the retromer-linked protein sorting nexins SNX1, SNX2, SNX5 and SNX6 [Citation56,Citation57,Citation58]. While we did not assess IGF2R trafficking in this study, at steady-state, we found normal lysosomal targeting of CTSD and an accumulation of its precursors, indicating defective intra-lysosomal proteolysis. However, we have previously demonstrated that CTSD immature-to-mature activation kinetics are delayed in cells lacking VPS35 [Citation17]. Further, lysates from VPS35 over-expressing cells display increased CTSD and CTSE (cathepsin E) activity in vitro, which is thought to suppress pathological MAPT phosphorylation [Citation23]. Links between enhanced MAPT pathology and lysosomal abnormalities have previously been observed in Drosophila lacking cathD (CTSD ortholog) [Citation59]. Intriguingly, VPS35 depletion enhances co-sedimentation of hyperphosphorylated, but unaggregated MAPT with endosomes/lysosomes after biochemical fractionation [Citation23]. We failed to observe appreciable colocalization of aggregated mutant MAPT RD-GFP with these compartments.
Our data suggest that a failure to resolve autophagy is likely attributable to impaired delivery and lysosomal proteolysis in VPS35-deficient cells and this increases MAPT aggregation. Autophagic flux is inversely correlated with MAPT secretion and propagation [Citation60]. It is, therefore, conceivable that VPS35 deficiency observed in tauopathies could contribute to the spread of MAPT. In addition, we cannot rule out that altered endo-lysosomal clearance and/or endomembrane integrity co-contribute to MAPT aggregation given the endosomal functions of the retromer [Citation61,Citation62].
Prion-like HEK293 cells that stably produce MAPT aggregates, or seeding approaches in general, are useful for interrogating how genetics, epigenetics and cellular pathways influence MAPT aggregation. Key advantages of this model include the ability to analyze individual aggregates at high resolution, quick experimental timeframes, tolerance to transfection and chemicals, and low maintenance cost. These characteristics are all favorable for discovery-based research (e.g., drug and genetic modifier screens) and mechanistic studies. However, one limitation is that the model does not employ neurons, and findings must be substantiated in models that better represent human disease. To overcome this limitation, we validated our major findings using HsESC-derived cortical neuronal cultures. A second potential limitation was that MAPT aggregation in our prion-like cells was not overtly toxicity; this might be attributed to strain or cell type specific effects, or possibly selection against toxic elements over time with passaging [Citation5]. In saying this, cell death of neurons bearing MAPT aggregates is complex and may involve microglial responses [Citation63]. In addition, neurons in the human brain that contain aggregated MAPT can survive for decades, which argues against an acute toxicity [Citation64].
The use of MAPT RD that carried both MAPTV337M and MAPTP301L mutations was favored in this study as it has been shown to enhance MAPT aggregation propensity [Citation65]. However, this may have some limitations to the application of wild-type MAPT tauopathies (e.g., Alzheimer disease). Expression of mutant forms of MAPT are still the most common way to model these diseases as they accelerate MAPT aggregation in vivo and cause cognitive and behavioral deficits [Citation66]. One study showed that MAPTP301L was less dependent on autophagy for its clearance than wild-type MAPT when over-expressed in N2a cells [Citation67]. Albeit, conflicting data in human induced pluripotent stem cell-derived neurons expressing MAPTP301L that were seeded with MAPT RD fibrils demonstrated reduced MAPT aggregation after pharmacological induction of autophagy [Citation68]. While pathogenic mutations can affect the stability of MAPT, it is likely that the discrepancy is attributed to whether MAPT is aggregated. Our study provides some insight toward answering this question. We demonstrate that autophagy inhibition selectively enhanced MAPT aggregation in cells already propagating aggregated MAPT, whereas the effect was only negligible in unseeded conditions. In addition, alternative pathways that were not directly assessed in this study such as TFEB (transcription factor EB)-driven autophagy/lysosomal system remodeling and chaperone-mediated autophagy may also contribute to MAPT clearance [Citation69,Citation70].
There is a bi-directional relationship between retromer expression and MAPT; that is, reduced retromer causes an accumulation of MAPT aggregates, and there is reduced expression of retromer components in tauopathies [Citation22,Citation23]. It is tempting to speculate that boosting retromer function could be therapeutically beneficial. Indeed, we showed that over-expression of FLAG-tagged VPS35 reduced MAPT aggregation in our prion-like cells. In addition, over-expression of VPS35 in the brain of mice that develop tangles and plaque pathology modestly reduces MAPT phosphorylation and insolubility while improving cognitive and behavioral deficits [Citation24]. In both cell cultures and in transgenic mice prone to develop tangles and amyloid plaque pathology, pharmacological stabilization of retromer reduced MAPT phosphorylation while limiting amyloid-β production [Citation23,Citation25,Citation71,Citation72]. Appreciating that retromer deficiency is upstream of multiple pathways that converge and induce neurodegeneration, it is not surprising that such a therapy would be beneficial in vivo. Importantly, future studies should determine whether a retromer chaperone can rescue the underlying autophagic/lysosomal defect that enhances MAPT aggregation.
In the present study, we have demonstrated a role for the retromer complex in maintaining lysosomal function and the autophagic flux of MAPT aggregates. These findings place retromer dysfunction temporally upstream of the widespread lysosomal dysfunction that is observed in tauopathies. Our data supports a model whereby newly-formed MAPT aggregates and/or their precursors are efficiently cleared from the cytoplasm and delivered to the lysosome through autophagy. The retromer complex and other factors that lie upstream of the autophagy-lysosome axis are critical for suppressing MAPT aggregation. Our findings add to the growing list of retromer functions that are neuroprotective, making this protein complex an attractive target for addressing phenotypic diversity in late-onset neurodegenerative diseases.
Materials and Methods
Molecular cloning
Generation of MAPT RD-GFP and GFP cDNA constructs
A gBlock DNA fragment was designed to contain MAPT RD (cDNA encoding amino acids 244–372; numbering based on FL MAPT) with both MAPTP301L and MAPTV337M mutations fused to GFP via a flexible linker sequence. The cDNA was flanked by 5ʹ AgeI and HpaI sites and a 3ʹ BamHI site, with an EcoRV site situated between MAPT RD and GFP cDNA. Restriction digestion of the gBlock and pUltrahot vector with AgeI and BamHI enabled directional ligation into pUltrahot to form the pUltrahot-MAPT RD(P301L/V337M)-GFP plasmid. This plasmid underwent restriction digest with HpaI and EcoRV to excise MAPT RD(P301L/V337M) cDNA and enable blunt-ended cis-ligation to form the pUltrahot-GFP plasmid.
Generation of VPS35-FLAG cDNA construct
Human VPS35 cDNA was PCR-amplified from the pLenti6/V5/DEST-VPS35 vector. The reverse primer introduced a single FLAG tag (DYKDDDDK) to the C terminus of VPS35. The overhangs of the primer pair contained AgeI and BamHI sites to facilitate restriction cloning into the pUltrahot plasmid.
All bacterial propagations were performed in DH5α under antibiotic (ampicillin) selection and purified plasmids were validated by Sanger sequencing of relevant regions.
Cell culture, treatments, transfection and stable cell line generation
Cell culture
HEK293, Lenti-X 293 T and HeLa cells were maintained at 37°C with 5% CO2 in DMEM containing high glucose and L-glutamine supplemented with 10% fetal bovine serum (culture medium). VPS35 and SNX27 knockout HeLa cells have been previously described [Citation17]. Stable RFP1-EGFP-LC3B-expressing HeLa cells have been previously described [Citation41]. Cells were routinely screened for mycoplasma contamination.
HsESC-derived cortical neuronal culture
H9 HsESC colonies were maintained in mTeSR1 as per manufacturer’s instructions on cell culture ware coated with HsESC-qualified Matrigel. The cells were split by dispase treatment and mechanical scraping every 3–5 days onto fresh Matrigel. An embryoid body-based neural induction was performed based on established protocols [Citation73–75]. Briefly, HsESCs were cultured in an ultra-low attachment plate in neural induction medium consisting of DMEM/F12 with 15 mM HEPES, pH 7.4, 1× NeuroCult SM1, 1× N2 Supplement-A, 10 µM SB431542 and 100 nM LDN193189. Media was exchanged every other day for 7 days to allow embryoid body formation. Embryoid bodies were transferred to a tissue culture dish coated with 10 µg/ml poly-L-ornithine and 5 µg/ml laminin in neural induction medium supplemented with 1 µg/ml laminin. Media was exchanged every other day for 7 days until neural rosettes were clearly visible. Neural rosettes were manually selected under phase contrast and transferred onto fresh Matrigel-coated plates in neural progenitor medium containing DMEM/F12+ GlutaMAX basal medium, 1× SM1, 1× N2-A, 10 ng/ml FGF2, 200 nM ascorbic acid, 1 µg/mL laminin to specify cortical identity. Neuronal progenitor cells were maintained at high density, fed every other day with fresh neural progenitor medium, and split once per week at ratio of 1:3–1:4 onto Matrigel-coated plates using Accutase. For cortical neuronal maturation, neuronal progenitor cells were dissociated and seeded at a density of 1.5 × 10⁵ cells/cm2 onto cell culture plates coated with 10 µg/mL poly-L-ornithine and 5 µg/mL laminin in neural maturation medium. Neural maturation medium was composed of BrainPhys supplemented with 1α NeuroCult SM1 without vitamin A, 1× N2-A, 20 ng/ml BDNF, 20 ng/ml GDNF, 10 ng/ml IGF-I, 0.5 mM dibutyryl cyclic-AMP, 200 nM ascorbic acid, 1 µg/ml laminin. Half of the neural maturation medium was gently replaced every 2–3 days. To improve neuronal culture quality and evenly distribute cells for final neuronal maturation, post-mitotic neuronal cultures 14 days post-maturation were dissociated and 1.5 × 10⁵ cells/cm2 re-plated on poly-L-ornithine- and laminin-coated glass coverslips or on imaging plates in neural maturation medium containing half concentration of growth factors. Neuronal cultures were matured in BrainPhys-based neural maturation medium for 10–12 weeks reaching electrophysiological maturity, as described previously [Citation74,Citation75]. Plates were kept in a humidified incubator at 37°C with 5% CO2 and 21% O2. The osmolarity (~300-305 mOsmol/L) and pH (~7.3–7.4) of the medium were kept constant.
Drug treatment
Cells were plated to achieve ~50% confluence the following day. Culture medium was then replaced with fresh culture medium containing the drug or respective vehicle and incubated for the indicated time until harvest. CQ (in water) was used at a final concentration of 50 µM. AZD8055 (in DMSO) was used at a final concentration of 1 µM. MG-132 (in DMSO) was used at a final concentration of 5 µM.
Plasmid transfections
Cells were plated to achieve ~60-70% confluence the following day and transfected with Lipofectamine-3000 according to the manufacturer’s instructions.
siRNA transfections
Cells were plated in 6-well plates to achieve ~30% confluence the following day during reverse transfection with 30 pmol siRNA oligonucleotides and Lipofectamine-RNAi Max, according to the manufacturer’s instructions. The number of reverse transfections performed depended on the duration of siRNA exposure. Exposures for 3, 5, 7 and 10 days involved 1, 2, 2 and 3 reverse transfections, respectively. Cells were analyzed at least 48 h after the final reverse transfection.
Lentiviral transduction and stable cell line generation
Lenti-X 293 T cells (1.6 × 10⁶) were plated per 6-cm dish and maintained at 37°C overnight. Fresh culture medium was added to the cells before transient transfection with cDNA-expressing lentivector (5 µg), psPAX2 (4 µg) and pCMV-VSV-G (4 µg) to produce cDNA-expressing lentivirus for 48 h post-transfection. The next day, 6 × 10⁵ HEK293 target cells were plated per well of a 6-well plate and maintained at 37°C overnight. Virus-containing culture medium was filtered with 0.45-µm filters and combined with 8 µg/mL polybrene to infect 2 × 6-well plate wells containing target cells for 48 h; 100 transduced target cells were plated in 10-cm dishes and allowed to amplify into visible colonies after ~2 weeks, which were then screened for GFP expression by fluorescence microscopy, isolated with cloning cylinders and expanded. Clones were re-screened by immunoblot for intermediate expression (for MAPT RD-GFP and GFP). A similar approach was used for VPS35-FLAG rescue of VPS35-knock out HeLa cells, except a stable poly-clonal pool of cells was generated.
A similar lentiviral transduction protocol was followed for the transduction of HsESC-derived neuron cultures, with minor differences. Specifically, virus production was scaled up to a 15-cm dish and plasmid transfection was carried out with polyethylenimine (4:1 ratio of PEI to DNA). The culture medium was re-freshed six h after transfection. The supernatants containing lentiviral particles were collected ~66 h post-transfection, filtered and then ultra-centrifuged at 110,000 × g for 2 h at 4°C. Virus pellets were resuspended in HBSS and viral titers determined using the Lenti-X qRT-PCR Titration Kit according to manufacturer’s instructions. Neuron cultures were transduced with virus carrying MAPT RD-GFP (2.67 × 10³ viral RNA copies/cell) alone, or in combination with shRNA virus. VPS35 and control shRNA viruses were titer-matched at 1.33 × 10³ viral RNA copies/cell. Forty-eight h post-transduction the culture medium was refreshed.
Proteopathic seeding and generation of prion-like cells
Proteopathic seeding with mouse brain lysate
HEK293 cells (2.5 × 10⁵) stably or transiently expressing forms of GFP-tagged MAPT or GFP were plated per well of a 12-well plate and maintained at 37°C overnight. Frozen aliquots of rTg4510 or non-transgenic littermate mouse brain lysates (2 µg/µL) were thawed and 20 µg of lysate was diluted in 90 µL Opti-MEM. Meanwhile, 4 µL Lipofectamine-2000 was diluted in 96 µL Opti-MEM then mixed with the lysate and Opti-MEM mixture incubated at room temperature for 20 min to form transfection complexes, which were delivered drop-wise to each well. Cells were maintained at 37°C for 48 h until replating for immunoflorescence, biochemical analysis or to produce stable prion-like cells.
A similar proteopathic seeding protocol was followed for HsESC-derived neuron cultures, with minor differences. Two weeks after lentiviral transduction, human neuronal cultures were transduced with mouse brain lysate. Lysates were thawed and 50 µg diluted in 950 µL Opti-MEM and filtered through a 0.45-µm filter. Meanwhile, 40 µL Lipofectamine-2000 was diluted in 960 µL Opti-MEM, and then mixed with the filtered lysate and Opti-MEM mixture and incubated at room temperature for 20 min to form transfection complexes. Employing drop-wise delivery, each well received 6.56 µg/cm2 of mouse brain lysate. Cells were maintained at 37°C for 72 h until they were harvested.
Generation of prion-like cells
Approximately 48 h post-seeding with rTg4510 brain lysate, 0.5 or 100 MAPT RD-GFP-expressing cells were plated per well of a 96-well plate or per 10-cm dish, respectively, and maintained at 37°C for 10–14 days to amplify into individual colonies. Colonies were screened by fluorescence microscopy for the ability to stably propagate GFP-positive MAPT aggregates from mother-to-daughter cell with high fidelity. Selected colonies were expanded directly from wells of the 96-well plate or first isolated with cloning cylinders from 10-cm dishes. The ability to stably propagate MAPT aggregates after continuous passaging into larger culture vessels was a final selection criterion. Clones that produced cytoplasmic speckles/threads were frozen at −80°C for the short-term and used for experiments upon revival.
Staining and microscopy
Immunofluorescence, confocal microscopy and quantification
Cells were plated on poly-L-lysine-coated coverslips and maintained at 37°C until harvest (>24 h later). Cells were washed twice with DPBS and fixed with 10% formalin for 15 min, then re-washed twice and stored in the dark at 4°C. Fixed cells were permeabilized with 0.1% saponin in DPBS for 15 min and blocked with 3% bovine serum albumin, 0.01% saponin in DPBS for 1 h. Alternatively, for detection of endogenous LC3B, washed cells were simultaneously fixed and permeabilized with ice-cold methanol for 15 min at −20°C. Cells were immunostained with primary antibodies diluted in block for 2 h and then washed four times with DPBS. Fluorophore-conjugated secondary antibodies were diluted 1:500 in block and used to immunostain cells for 1 h in the dark prior to washing four-times with DPBS. Coverslips were mounted onto glass slides with mounting medium containing DAPI and sealed with clear nail polish. Slides were kept in the dark at 4°C until confocal microscopy analysis. Images or z-stacks were captured using a TCS SP8X multi-photon confocal microscope with LASX software (Leica, Germany) using identical acquisition conditions between treatment groups. Images were processed and quantified using FIJI ImageJ.
Percentage of cells with GFP-positive aggregates
Z-stacks imaged at 10× objective were max-projected and channels separately thresholded and made binary. The binary DAPI channel was “watershed” and the number of cells in each field was calculated using “analyze particles”. In the same field, “analyze particles” was used to calculate the number of cells with GFP-positive MAPT aggregates from the binary GFP channel. The ratio was used to quantify the percentage of cells with GFP-positive aggregates.
GFP-positive aggregates per cell and size-frequency of aggregates
Z-stacks imaged at 63× objective (individual cytoplasmic aggregates are resolvable) were max-projected and channels separately thresholded and made binary. The number of cells in each field was calculated from the DAPI channel. In the same field, “analyze particles” was used to calculate the number of GFP-positive MAPT aggregates and their 2D-area (µm2) from the binary GFP channel. The ratio was used to quantify the number of GFP-positive aggregates per cell, and the frequency of occurrence of different-sized aggregates (relative to cell number).
Percentage of SQSTM1 positive GFP-positive aggregates
Z-stacks imaged at 63× objective (individual cytoplasmic aggregates are resolvable) were max-projected and channels separately thresholded and made binary. The number of cells in each field was calculated from the DAPI channel. In the same field, “analyze particles” was used to calculate the number of GFP-positive MAPT aggregates from the binary GFP channel; the same method was followed for the binary SQSTM1 channel. The “image calculator” function was used to generate a binary image of particles present in both the binary GFP “AND” SQSTM1 channels from which “analyze particles” was used to quantify the number of SQSTM1- and GFP-double-positive particles. The number of particles from each binary channel (GFP-, SQSTM1- and double positive) were normalized to the number of cells in the field, and then double positive signal was expressed as a percentage of total GFP signal.
GFP-positive aggregates per MAP2-positive area in neurons and size-frequency of aggregates
Z-stacks imaged at 40× objective (individual cytoplasmic aggregates are resolvable) were max-projected and saved as TIF files that were blinded to the experimenter until completion of data analysis. Max-projection files were opened, and GFP and MAP2 channels made binary. First, MAP2-positive area (µm2) was calculated using the “analyze particles” function. Following this, GFP-positive MAPT aggregates that overlapped with MAP2 positive neurons were identified using the “image calculator” “AND” function, which were subsequently quantified using “analyze particles”. Because of the disordered cell shape of neurons, the number of GFP-positive MAPT aggregates that overlapped with MAP2 positivity was normalized to the MAP2 positive area (µm2) in the field, rather than DAPI-positive nuclei (cell number). The frequency of occurrence of different-sized aggregates was also calculated (relative to MAP2 positive area). Data were then normalized to control.
Staining amyloid material with Methoxy-X04
Formalin-fixed cells as per immunofluorescence were stained in 100 µM Methoxy-X04 (in water) or water alone for 30 min in the dark. Cells were washed four-times with DPBS and coverslips mounted onto glass slides with Mowiol 4–88-mounting medium (lacking DAPI) and sealed with clear nail polish. Slides were kept in the dark at 4°C until confocal microscopy analysis.
Transmission electron microscopy
Cells were plated to achieve ~80% confluence two-days later. Cells were washed twice with DPBS and fixed with 1.25% glutaraldehyde, 4% paraformaldehyde in PBS (4.9 mM Na2HPO4, 1.2 mM KH2PO4, 145.5 mM NaCl, pH 7.2) overnight at 4°C. Cells were washed once with 4% sucrose in PBS and stained with 2% osmium tetroxide for 1 h while rotating. Cells were re-washed then dehydrated with increasing concentrations of ethanol (70%, 90%, 95% and 100% for ~30 min/concentration). Cells were treated with propylene oxide for 30 min, before incubation in a 1:1 solution of 100% propylene oxide:100% resin from the Procure 812 embedding kit for 1 h and infiltration for two days, before embedding in fresh resin and polymerization at 70°C for 24 h. Sections of 80nm thickness were mounted on mesh copper grids. Images were captured using a Tecnai G2 Spirit TWIN Transmission Electron Microscope (FEI, USA).
Cell lysis
Cells were washed twice with ice-cold DPBS then lysed on ice for 30 min with lysis buffer containing EDTA-free protease inhibitor cocktail (1 tablet/25 mL buffer) and phosphatase inhibitors sodium orthovanadate, sodium pyrophosphate, β-glycerophosphate, and sodium fluoride if required. Cells were then collected and clarified at 4°C.
Whole-cell lysates for SDS-PAGE (polyacrylamide gel electrophoresis)/immunoblotting
Cells were lysed in RIPA lysis buffer containing 1 mM sodium orthovanadate, 10 mM sodium pyrophosphate, 10 mM β-glycerophosphate, 50 mM sodium fluoride and clarified for 15 min at 21,130 × g in standard lysis conditions, or lysed with the same lysis buffer containing 2.5% SDS without clarification in stringent lysis conditions.
Differential sedimentation lysates
Cells were lysed in 0.05% Triton X-100 in DPBS lysis buffer and twice clarified for 5 min each at 23 × g and 94 × g, respectively.
Whole-cell lysates for SDD-AGE (semi-denaturing detergent agarose gel electrophoresis/immunoblot
Cells were lysed in 0.05% Triton X-100 in/DPBS lysis buffer, triturated 25-times and twice clarified for 5 min each at 23 × g and 94 × g, respectively.
Whole-cell lysates for immunoprecipitation
Cells were lysed in buffer containing 1% Triton X-100, 40 mM HEPES, pH 7.4, 2.5 mM MgCl2, 1 mM sodium orthovanadate, 10 mM sodium pyrophosphate, 10 mM β-glycerophosphate, 50 mM sodium fluoride. Lysates were clarified at 15,871 × g for 15 min.
Biochemical analyses
SDS-PAGE electrophoresis and immunoblotting
Cleared lysates were combined with LDS sample buffer and reducing agent prior to boiling for 5 min at 95°C, then loaded onto pre-cast gels and run at 130 V for up to 90 min. Total protein was transferred to methanol-activated PVDF membranes at 35 V for 90 min. Membranes were blocked for 1 h with 5% fat-free skim milk in TBST (50 mM Tris, 150 mM sodium chloride, 0.1% Tween-20) and then probed with primary antibodies diluted in 2% BSA in TBST containing 0.02% sodium azide, with shaking, overnight at 4°C. Membranes were washed three-times with TBST then re-probed with HRP-conjugated secondary antibody diluted 1:10,000 in block. Membranes were washed a further three-times then imaged by chemilluminescence. Quantification of densitometry was performed using FIJI ImageJ.
Differential sedimentation
Differential sedimentation for the extraction of detergent-insoluble MAPT was carried out similarly to previous studies [Citation5,Citation6]. Clarified lysate was normalized to 1 µg/µL protein concentration with lysis buffer containing inhibitors after BCA analysis. Clarified lysate (100 µg) was ultra-centrifuged at 186,000 × g for 1 h at 4°C, while the remaining lysate was kept as the “total” fraction. The supernatant was kept as the “soluble” fraction and the pellet washed in 100 µL of lysis buffer containing inhibitors and ultracentrifuged once more at 186,000 × g for 30 min at 4°C. The supernatant was discarded, and the pellet resuspended in 100 µL of 2× LDS sample buffer containing 2× reducing agent and kept as the “insoluble” fraction. Total and soluble fractions were mixed with LDS sample buffer containing reducing agent and equal volumes resolved by SDS-PAGE and analyzed by immunoblot.
SDD-AGE
Clarified lysate was normalized to 1 µg/µL protein concentration with lysis buffer containing inhibitors after BCA analysis. Clarified lysate (10 µg) was combined with an equal volume (10 µL) of a modified Laemmli sample loading buffer (20 mM Tris, pH 7.4, 200 mM glycine, 0.04% SDS, 10% glycerol, 0.1% bromophenol blue) then loaded onto pre-set gels (1.5% agarose dissolved in 20 mM Tris, pH 7.4, 200 mM glycine, 0.02% SDS). Samples were run at 125 V for 90 min, then total protein was transferred to methanol-activated PVDF membranes at 100 V for 90 min. Blocking and antibody probing was performed as per immunoblotting.
Density-gradient lysosomal enrichment
Lysosomal enrichment by Percoll density-gradient subcellular fractionation was performed as previously described [Citation17,Citation76].
Immunoprecipitation
A volume of clarified lysate was kept as “input”, and the remainder used for immunoprecipitation. Protein G Dynabeads (25 µL bead mixture/10-cm dish of cells) were washed with 0.05% Tween 20 in DPBS before magnetic separation. Anti-FLAG M2 antibody diluted in wash buffer (1 µg/200 µL) was added to the beads and incubated for 20 min shaking at room temperature. Antibody-linked beads were washed three times with lysis buffer then combined with clarified lysate, and incubated for 1 h shaking at 4°C. The beads were washed three times with lysis buffer and immunoprecipitated proteins eluted in 2× LDS sample buffer with boiling for 5 min at 95°C, before analysis by SDS-PAGE/immunoblotting.
Flow cytometry
Cell viability assay
HEK293 cells (3.75 × 10⁵) were plated per well of a 6-well plate and incubated for 48 h. To determine if MAPT RD-GFP expression or aggregation contributed to toxicity, non-transduced HEK293 cells were used as a control. The following day, cells were gently pipetted to obtain a uniform cell suspension containing both adherent and floating cells. In brief, the cells were centrifuged at 1500 × g for 5 min, washed with DPBS, then resuspended in ANXA5 binding buffer containing 0.25 µg/mL ANXA5-Alexa Fluor 647 and 1 µg/mL DAPI, and incubated in the dark for 15 min at room temperature. Additional binding buffer was added to each sample prior to analysis by flow cytometry with a FACS Fortessa (BD Bioscience). A live-dead cell cocktail was used for staining/gating controls. For each condition >20,000 events were analyzed.
Live cell RFP:GFP ratiometric analysis
HeLa cells stably expressing RFP-GFP-LC3B were exposed to siRNAs for seven-days (see siRNA transfection). Cells were processed and RFP, GFP and RFP:GFP florescence quantified in live cells by flow cytometry as previously reported [Citation41]. Data were analyzed using Flow Jo software.
Statistical Analysis
The statistical analyses performed are explicitly stated in the figure legend. Gaussian (normal) distribution was verified with a Shapiro-Wilk test. Parametric analyses were used for normally distributed data; non-parametric analyses were used for non-normally distributed data. All statistical analyses were performed using Prism 8 software. Values report the mean ± SEM or observation frequency. Statistical significance was attributed for p < 0.05. Graphs were annotated with asterisk (*) to denote p-values as follows: *p < 0.05, **p < 0.01, ***p < 0.001 and ****p < 0.0001.
Abbreviations
ACTB: actin beta; ATG5: autophagy related 5; ANXA5/annexin V: annexin A5; CTSD: cathepsin D; CQ: chloroquine; EEA1: early endosome antigen 1; FL: full length; GFP: green florescent protein; HsESC: human embryonic stem cell; IGF2R/CI-MPR: insulin like growth factor 2 receptor; LAMP2: lysosomal associated membrane protein 2; MAP1LC3B/LC3B: microtubule associated protein 1 light chain 3 beta; MAP2: microtubule associated protein 2; MAPT/tau: microtubule associated protein tau; MTOR: mechanistic target of rapamycin kinase; PAGE: polyacrylamide gel electrophoresis; RD: repeat domain; RFP: red fluorescent protein; SDD-AGE: semi-denaturing detergent agarose gel electrophoresis; SDS: sodium dodecyl sulfate; shRNA: short hairpin RNA; siRNA: short interfering RNA; SQSTM1/p62: sequestosome 1; UBC: ubiquitin C; VPS35: VPS35 retromer complex component.
Supplemental Material
Download MS Word (42.3 MB)Acknowledgments
We thank all lab members for insightful discussions and technical advice. We thank Rohan D. Teasdale (University of Queensland) for sharing knock-out cells and editing the manuscript, Jürgen Götz (University of Queensland) for providing the mouse brain lysates, Juan Carlos Polanco (University of Queensland) for technical advice, Kathryn Hattersley, Julien Bensalem and Celia Fourrier (South Australian Health & Medical Research Institute) for technical advice and editing the manuscript, Ruth Williams (Adelaide Microscopy) for electron microscopy, Makoto Kamei (South Australian Health & Medical Research Institute and Centre for Cancer Biology) for technical confocal microscopy advice. This investigation was supported by Lysosomal Health in Ageing at the South Australian Health & Medical Research Institute. J.M.C was supported by a Research Training Stipend and a Commonwealth Scholarship from the Australian Government, and Research Degree Excellence Grant from the University of South Australia, D.D was supported by a National Health & Medical Research Council project grant (1124490), S.K is a National Health & Medical Research Council Senior Principal Research Fellow (1103006).
Supplementary material
Supplemental data for this article can be accessed here.
Disclosure statement
We declare no conflicts of interest.
References
- Kaur J, Debnath J. Autophagy at the crossroads of catabolism and anabolism. Nat Rev Mol Cell Biol. 2015;16(8):461–472.
- Gatica D, Lahiri V, Klionsky DJ. Cargo recognition and degradation by selective autophagy. Nat Cell Biol. 2018;20(3):233–242.
- Deng Z, Purtell K, Lachance V, et al. Autophagy Receptors and Neurodegenerative Diseases. Trends Cell Biol. 2017;27(7):491–504.
- Brier MR, Gordon B, Friedrichsen K, et al. Tau and Aβ imaging, CSF measures, and cognition in Alzheimer’s disease. Sci Transl Med. 2016;8(338):338ra66.
- Kaufman SK, Sanders DW, Thomas TL, et al. Tau Prion Strains Dictate Patterns of Cell Pathology, Progression Rate, and Regional Vulnerability In Vivo. Neuron. 2016;92(4):796–812.
- Sanders DW, Kaufman S, DeVos S, et al. Distinct tau prion strains propagate in cells and mice and define different tauopathies. Neuron. 2014;82(6):1271–1288.
- Jaunmuktane Z, Mead S, Ellis M, et al. Erratum: evidence for human transmission of amyloid-β pathology and cerebral amyloid angiopathy. Nature. 2015;526(7574):595.
- Purro SA, Farrow MA, Linehan J, et al. Transmission of amyloid-β protein pathology from cadaveric pituitary growth hormone. Nature. 2018;564(7736):415–419.
- Irwin DJ, Abrams JY, Schonberger LB, et al. Evaluation of potential infectivity of Alzheimer and Parkinson disease proteins in recipients of cadaver-derived human growth hormone. JAMA Neurol. 2013;70(4):462–468.
- Polanco JC, Li C, Durisic N, et al. Exosomes taken up by neurons hijack the endosomal pathway to spread to interconnected neurons. Acta Neuropathol Commun. 2018;6(1):10.
- Evans LD, Wassmer T, Fraser G, et al. Extracellular Monomeric and Aggregated Tau Efficiently Enter Human Neurons through Overlapping but Distinct Pathways. Cell Rep. 2018;22(13):3612–3624.
- Falcon B, Noad J, McMahon H, et al. Galectin-8–mediated selective autophagy protects against seeded tau aggregation. J Biol Chem. 2018;293(7):2438–2451.
- Bordi M, Berg MJ, Mohan PS, et al. Autophagy flux in CA1 neurons of Alzheimer hippocampus: increased induction overburdens failing lysosomes to propel neuritic dystrophy. Autophagy. 2016;12(12):2467–2483.
- Carosi JM, Sargeant TJ. Rapamycin and Alzheimer disease: a double-edged sword? Autophagy. 2019;15(8):1460–1462.
- Hassiotis S, Manavis J, Blumbergs PC, et al. Lysosomal LAMP1 immunoreactivity exists in both diffuse and neuritic amyloid plaques in the human hippocampus. Eur J Neurosci. 2018;47(9):1043–1053.
- Whyte LS, Hassiotis S, Hattersley KJ, et al. Lysosomal Dysregulation in the Murine App Model of Alzheimer’s Disease. Neuroscience. 2020;429:143–155.
- Cui Y, Carosi JM, Yang Z, et al. Retromer has a selective function in cargo sorting via endosome transport carriers. J Cell Biol. 2019;218(2):615–631.
- Maruzs T, Lőrincz P, Szatmári Z, et al. Retromer Ensures the Degradation of Autophagic Cargo by Maintaining Lysosome Function in Drosophila. Traffic. 2015;16(10):1088–1107.
- Seaman MNJ. Cargo-selective endosomal sorting for retrieval to the Golgi requires retromer. J Cell Biol. 2004;165(1):111–122.
- Arighi CN, Hartnell LM, Aguilar RC, et al. Role of the mammalian retromer in sorting of the cation-independent mannose 6-phosphate receptor. J Cell Biol. 2004;165(1):123–133.
- Steinberg F, Gallon M, Winfield M, et al. A global analysis of SNX27–retromer assembly and cargo specificity reveals a function in glucose and metal ion transport. Nat Cell Biol. 2013;15(5):461–471.
- Small SA, Kent K, Pierce A, et al. Model-guided microarray implicates the retromer complex in Alzheimer’s disease. Ann Neurol. 2005;58(6):909–919.
- Vagnozzi AN, Li J-G, Chiu J, et al. VPS35 regulates tau phosphorylation and neuropathology in tauopathy. Mol Psychiatry. 2019. DOI:https://doi.org/10.1038/s41380-019-0453-x.
- Li JG, Chiu J, Pratico D. Full recovery of the Alzheimer’s disease phenotype by gain of function of vacuolar protein sorting. Mol Psychiatry. 2019;35. DOI: https://doi.org/10.1038/s41380-019-0364-x.
- Young JE, Fong LK, Frankowski H, et al. Stabilizing the Retromer Complex in a Human Stem Cell Model of Alzheimer’s Disease Reduces TAU Phosphorylation Independently of Amyloid Precursor Protein. Stem Cell Reports. 2018;10(3):1046–1058.
- Chen X, Kordich JK, Williams ET, et al. Parkinson’s disease-linked D620N VPS35 knockin mice manifest tau neuropathology and dopaminergic neurodegeneration. Proc Natl Acad Sci U S A. 2019;116(12):5765–5774.
- Falcon B, Zhang W, Murzin AG, et al. Structures of filaments from Pick’s disease reveal a novel tau protein fold. Nature. 2018;561(7721):137–140.
- Fitzpatrick AWP, Falcon B, He S, et al. Cryo-EM structures of tau filaments from Alzheimer’s disease. Nature. 2017;547(7662):185–190.
- Zhang W, Tarutani A, Newell KL, et al. Novel tau filament fold in corticobasal degeneration. Nature. 2020;580(7802):283–287.
- Bolander A, Kieser D, Scholz C, et al. Synthesis of Methoxy-X04 Derivatives and Their Evaluation in Alzheimer’s Disease Pathology. Neurodegener Dis. 2014;13(4):209–213.
- Wallberg F, Tenev T, Meier P. Analysis of Apoptosis and Necroptosis by Fluorescence-Activated Cell Sorting. Cold Spring Harb Protoc. 2016;2016(4):pdb prot087387.
- Wlodkowic DT, Skommer J, Darzynkiewicz Z. Apoptosis and beyond: cytometry in studies of programmed cell death. Methods Cell Biol. 2011;103:55–98.
- Kiladjian -J-J, Bourgeois E, Lobe I, et al. Cytolytic function and survival of natural killer cells are severely altered in myelodysplastic syndromes. Leukemia. 2006;20(3):463–470.
- Klionsky DJ, Abdelmohsen K, Abe A, et al. Guidelines for the use and interpretation of assays for monitoring autophagy (3rd edition). Autophagy. 2016;12(1):1–222.
- Rubinsztein DC, Shpilka T, Elazar Z. Mechanisms of autophagosome biogenesis. Curr Biol. 2012;22(1):R29–34.
- Hanada T, Noda NN, Satomi Y, et al. The Atg12-Atg5 conjugate has a novel E3-like activity for protein lipidation in autophagy. J Biol Chem. 2007;282(52):37298–37302.
- Willems L, Chapuis N, Puissant A, et al. The dual mTORC1 and mTORC2 inhibitor AZD8055 has anti-tumor activity in acute myeloid leukemia. Leukemia. 2012;26(6):1195–1202.
- Watanabe Y, Tanaka M. p62/SQSTM1 in autophagic clearance of a non-ubiquitylated substrate. J Cell Sci. 2011;124(16):2692–2701.
- Yu Y, Run X, Liang Z, et al. Developmental regulation of tau phosphorylation, tau kinases, and tau phosphatases. J Neurochem. 2009;108(6):1480–1494.
- Ozdemir AY, Rom I, Kovalevich J, et al. PINCH in the cellular stress response to tau-hyperphosphorylation. PLoS One. 2013;8(3):e58232.
- Hein LK, Apaja PM, Hattersley K, et al. A novel fluorescent probe reveals starvation controls the commitment of amyloid precursor protein to the lysosome. Biochim Biophys Acta Mol Cell Res. 2017;1864(10):1554–1565.
- Kimura S, Noda T, Yoshimori T. Dissection of the autophagosome maturation process by a novel reporter protein, tandem fluorescent-tagged LC3. Autophagy. 2007;3(5):452–460.
- Fuse A, Furuya N, Kakuta S, et al. VPS29-VPS35 intermediate of retromer is stable and may be involved in the retromer complex assembly process. FEBS Lett. 2015;589(13):1430–1436.
- Gieselmann V, Hasilik A, von Figura K. Processing of human cathepsin D in lysosomes in vitro. J Biol Chem. 1985;260(5):3215–3220.
- Vilarino-Guell C, Wider C, Ross O, et al. VPS35 mutations in Parkinson disease. The American Journal of Human Genetics. 2011;89(1):162–167.
- Cataldi S, Follett J, Fox JD, et al. Altered dopamine release and monoamine transporters in Vps35 p.D620N knock-in mice. Npj Parkinson’s Disease. 2018;4(1):27.
- Wang W, Wang X, Fujioka H, et al. Parkinson’s disease–associated mutant VPS35 causes mitochondrial dysfunction by recycling DLP1 complexes. Nat Med. 2016;22(1):54–63.
- Follett J, Bugarcic A, Yang Z, et al. Parkinson Disease-linked Vps35 R524W Mutation Impairs the Endosomal Association of Retromer and Induces α-Synuclein Aggregation. J Biol Chem. 2016;291(35):18283–18298.
- Braak H, Braak E. Neuropathological stageing of Alzheimer-related changes. Acta Neuropathol. 1991;82(4):239–259.
- Wen L, Tang F-L, Hong Y, et al. VPS35 haploinsufficiency increases Alzheimer’s disease neuropathology. J Cell Biol. 2011;195(5):765–779.
- He Z, Guo JL, McBride JD, et al. Amyloid-beta plaques enhance Alzheimer’s brain tau-seeded pathologies by facilitating neuritic plaque tau aggregation. Nat Med. 2018;24(1):29–38.
- Miura E, Hasegawa T, Konno M, et al. VPS35 dysfunction impairs lysosomal degradation of alpha-synuclein and exacerbates neurotoxicity in a Drosophila model of Parkinson’s disease. Neurobiol Dis. 2014;71:1–13.
- Follett J, Norwood SJ, Hamilton NA, et al. The Vps35 D620N Mutation Linked to Parkinson’s Disease Disrupts the Cargo Sorting Function of Retromer. Traffic. 2014;15(2):230–244.
- Rojas R, van Vlijmen T, Mardones GA, et al. Regulation of retromer recruitment to endosomes by sequential action of Rab5 and Rab7. J Cell Biol. 2008;183(3):513–526.
- Qureshi YH, Patel VM, Berman DE, et al. An Alzheimer’s Disease-Linked Loss-of-Function CLN5 Variant Impairs Cathepsin D Maturation, Consistent with a Retromer Trafficking Defect. Mol Cell Biol. 2018;38(20):e00011-18.
- Seaman MNJ. Retromer and the cation-independent mannose 6-phosphate receptor-Time for a trial separation? Traffic. 2018;19(2):150–152.
- Kvainickas A, Jimenez-Orgaz A, Nägele H, et al. Cargo-selective SNX-BAR proteins mediate retromer trimer independent retrograde transport. J Cell Biol. 2017;216(11):3677–3693.
- Simonetti B, Danson CM, Heesom KJ, et al. Sequence-dependent cargo recognition by SNX-BARs mediates retromer-independent transport of CI-MPR. J Cell Biol. 2017;216(11):3695–3712.
- Khurana V, Elson-Schwab I, Fulga TA, et al. Lysosomal dysfunction promotes cleavage and neurotoxicity of tau in vivo. PLoS Genet. 2010;6(7):e1001026.
- Chen X, Li Y, Wang C, et al. Promoting tau secretion and propagation by hyperactive p300/CBP via autophagy-lysosomal pathway in tauopathy. Mol Neurodegener. 2020;15(1):2.
- Vaz-Silva J, Gomes P, Jin Q, et al. Endolysosomal degradation of Tau and its role in glucocorticoid-driven hippocampal malfunction. Embo J. 2018;37(20):e99084.
- Chen JJ, Nathaniel DL, Raghavan P, et al. Compromised function of the ESCRT pathway promotes endolysosomal escape of tau seeds and propagation of tau aggregation. J Biol Chem. 2019;294(50):18952–18966.
- Brelstaff J, Tolkovsky AM, Ghetti B, et al. Living Neurons with Tau Filaments Aberrantly Expose Phosphatidylserine and Are Phagocytosed by Microglia. Cell Rep. 2018;24(8):1939–1948. e4.
- Morsch R, Simon W, Coleman PD. Neurons may live for decades with neurofibrillary tangles. J Neuropathol Exp Neurol. 1999;58(2):188–197.
- Kfoury N, Holmes BB, Jiang H, et al. Trans-cellular propagation of Tau aggregation by fibrillar species. J Biol Chem. 2012;287(23):19440–19451.
- Jankowsky JL, Zheng H. Practical considerations for choosing a mouse model of Alzheimer’s disease. Mol Neurodegener. 2017;12(1):89.
- Caballero B, Wang Y, Diaz A, et al. Interplay of pathogenic forms of human tau with different autophagic pathways. Aging Cell. 2018;17(1):e12692.
- Verheyen A, Diels A, Dijkmans J, et al. Using Human iPSC-Derived Neurons to Model TAU Aggregation. PLoS One. 2015;10(12):e0146127.
- Gorantla NV, Chinnathambi S. Autophagic Pathways to Clear the Tau Aggregates in Alzheimer’s Disease. Cell Mol Neurobiol. 2020. DOI:https://doi.org/10.1007/s10571-020-00897-0
- Binder JL, Chander P, Deretic V, et al. Optical induction of autophagy via Transcription factor EB (TFEB) reduces pathological tau in neurons. PLoS One. 2020;15(3):e0230026.
- Mecozzi VJ, Berman DE, Simoes S, et al. Pharmacological chaperones stabilize retromer to limit APP processing. Nat Chem Biol. 2014;10(6):443–449.
- Li J-G, Chiu J, Ramanjulu M, et al. A pharmacological chaperone improves memory by reducing Aβ and tau neuropathology in a mouse model with plaques and tangles. Mol Neurodegener. 2020;15(1):1.
- Boyer LFC, Campbell B, Larkin S, et al. Dopaminergic Differentiation of Human Pluripotent Cells. Curr Protoc Stem Cell Biol. 2012;22(1). DOI:https://doi.org/10.1002/9780470151808.sc01h06s22
- Bardy C, van den Hurk M, Eames T, et al. Neuronal medium that supports basic synaptic functions and activity of human neurons in vitro. Proc Natl Acad Sci U S A. 2015;112(20):E2725–34.
- Bardy C, van den Hurk M, Kakaradov B, et al. Predicting the functional states of human iPSC-derived neurons with single-cell RNA-seq and electrophysiology. Mol Psychiatry. 2016;21(11):1573–1588.
- Carosi JM, Hattersly K, Cui Y, et al. Subcellular Fractionation of Hela Cells for Lysosome Enrichment Using a Continuous Percoll-density Gradient. Bio-protocol. 2019;9(18):e3362.
- Polanco JC, Scicluna BJ, Hill AF, et al. Extracellular Vesicles Isolated from the Brains of rTg4510 Mice Seed Tau Protein Aggregation in a Threshold-dependent Manner. J Biol Chem. 2016;291(24):12445–12466.
- Stewart SA, Dykxhoorn DM, Palliser D, et al. Lentivirus-delivered stable gene silencing by RNAi in primary cells. RNA. 2003;9(4):493–501.
- Scott KL, Kabbarah O, Liang M-C, et al. GOLPH3 modulates mTOR signalling and rapamycin sensitivity in cancer. Nature. 2009;459(7250):1085–1090.
- Sarbassov DD, Guertin DA, Ali SM, et al. Phosphorylation and regulation of Akt/PKB by the rictor-mTOR complex. Science. 2005;307(5712):1098–1101.