
ABSTRACT
Macroautophagy/autophagy dysregulation has been noted in diabetic nephropathy; however, the regulatory mechanisms controlling this process remain unclear. In this study, we showed that SMAD3 (SMAD family member 3), the key effector of TGFB (transforming growth factor beta)-SMAD signaling, induces lysosome depletion via the inhibition of TFEB-dependent lysosome biogenesis. The pharmacological inhibition or genetic deletion of SMAD3 restored lysosome biogenesis activity by alleviating the suppression of TFEB, thereby protecting lysosomes from depletion and improving autophagic flux in renal tubular epithelial cells in diabetic nephropathy. Mechanistically, we found that SMAD3 directly binds to the 3ʹ-UTR of TFEB and inhibits its transcription. Silencing TFEB suppressed lysosome biogenesis and resulted in a loss of the protective effects of SMAD3 inactivation on lysosome depletion under diabetic conditions. In conclusion, SMAD3 promotes lysosome depletion via the inhibition of TFEB-dependent lysosome biogenesis; this may be an important mechanism underlying autophagy dysregulation in the progression of diabetic nephropathy.
Abbreviations: AGEs: advanced glycation end products; ATP6V1H: ATPase H+ transporting V1 subunit H; CTSB: cathepsin B; ChIP: chromatin immunoprecipitation; Co-BSA: control bovine serum albumin; DN: diabetic nephropathy; ELISA: enzyme-linked immunosorbent assay; FN1: fibronectin 1; HAVCR1/TIM1/KIM-1: hepatitis A virus cellular receptor 1; LAMP1: lysosomal associated membrane protein 1; LMP: lysosome membrane permeabilization; MAP1LC3B/LC3B: microtubule associated protein 1 light chain 3 beta; NC: negative control; SIS3: specific inhibitor of SMAD3; SMAD3: SMAD family member 3; siRNA: small interfering RNA; SQSTM1/p62: sequestosome 1; TECs: tubular epithelial cells; TFEB: transcription factor EB; TGFB1: transforming growth factor beta 1; TGFBR1: transforming growth factor beta receptor 1; UTR: untranslated region; VPS11: VPS11 core subunit of CORVET and HOPS complexes.
Introduction
Diabetic nephropathy (DN) is a severe renal complication in patients with diabetes mellitus [Citation1, Citation2, Citation3, Citation4, Citation5]. Despite extensive prevention and treatment efforts, DN remains a major cause of end-stage renal disease and a public health burden worldwide [Citation6,Citation7]. Therefore, the identification of new pathophysiological mechanisms and the development of novel therapeutic strategies for DN are urgently needed. Increasing evidence suggests that renal tubules are not only passively affected by glomerular injury but also act as active participants in the progression of DN [Citation8]. Under diabetic conditions, high glucose [Citation9,Citation10], advanced glycation end products (AGEs) [Citation1,Citation11], advanced oxidation protein products [Citation10], urinary proteins, and other endogenous nephrotoxins [Citation12] can induce the activation, transdifferentiation, hypertrophy, and apoptosis of renal tubular epithelial cells (TECs). A growing body of evidence also suggests that autophagy protects TECs from injuries and cell death in various kidney diseases, including DN [Citation13, Citation14, Citation15]. We have previously shown that lysosome depletion due to lysosome membrane permeabilization (LMP) is the main mechanism weakening the protective effect of autophagy in TECs in DN [Citation1]. We have also found that long-term exposure to proteinuria, a secondary nephrotoxin factor exacerbating the progression of DN, inhibits autophagy in TECs by impairing lysosome structure and function [Citation16]. Therefore, the disruption of autophagic flux by lysosome depletion promotes TEC damage and accelerates DN progression. It has been suggested that the prevention of lysosome depletion by either eliminating damaged lysosomes or replenishing intact lysosomes may improve autophagic flux and therefore may protect TECs from injury under diabetic conditions [Citation17,Citation18]. However, the molecular mechanisms underlying lysosome depletion under diabetic conditions remain largely unclear.
TGFB1 (transforming growth factor beta 1) is a key mediator of DN. When TGFB1 induces TGFBR1 activation, SMAD2 and SMAD3 are phosphorylated, and then the complex cooperates with SMAD4 and is translocated from the cytoplasm into the nucleus to regulate gene expression. As an inhibitor of TGFB signaling, SMAD7 is potently induced by TGFB1 and acts in an autocrine negative feedback loop to avoid the over-activation of TGFB-SMAD3 signaling [Citation19]. We and others have demonstrated that the TGFB-SMAD signaling pathway is highly activated in response to a variety of diabetic insults, such as high glucose and AGEs, and actively promotes renal glomerular lesion and tubulointerstitial fibrosis [Citation20–28]. Intriguingly, SMAD2-SMAD3 complex activation is accompanied by the loss of inhibitory SMAD7 in DN [Citation24], whereas the overexpression of SMAD7 [Citation24,Citation25,Citation29] or targeting SMAD3 [Citation30,Citation31] and SMAD3-dependent non-coding RNAs [Citation26,Citation32,Citation33] protects against renal injury in DN.
Studies over the past decade have demonstrated complex interactions between autophagy and the TGFB-SMAD pathway in various cells [Citation34]. Autophagy activation by TGFB is mediated by SMAD-dependent and -independent pathways [Citation35,Citation36]. In TECs, TGFB1 may initiate autophagy [Citation37,Citation38], while autophagy can conversely promote the degradation of TGFB1 [Citation39]. However, the mechanisms by which the TGFB-SMAD pathway regulates autophagy and TEC injury in DN are far from clear, particularly because TGFB-SMAD functions are dependent on cell type and context [Citation40]. In the present study, we evaluated the hypothesis that SMAD3, a key mediator of TGFB-SMAD signaling, contributes to lysosome depletion during the progression of DN, and investigated the mechanism underlying the effects of SMAD3 in diabetic TECs.
Results
SMAD3 promoted autophagy dysregulation by triggering lysosome depletion in TECs under diabetic conditions
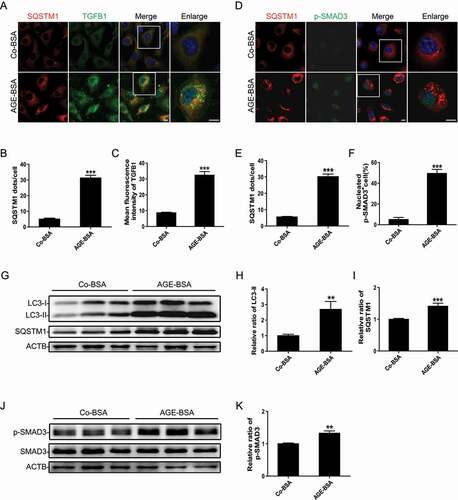
Autophagic flux blockage is a major cause of the dysregulation of autophagy in TECs under diabetic conditions [Citation1]. Accordingly, we first examined whether the TGFB-SMAD3 pathway is involved in the autophagic flux blockage in DN based on the accumulation of microtubule-associated protein 1 light chain 3B II (LC3-II) and SQSTM1/p62 (sequestosome 1) in vitro. HK-2 cells were treated with AGE-BSA to mimic TEC injury in diabetic conditions. We found that AGE-BSA induced the activation of TGFB-SMAD3 signaling in HK-2 cells, with the accumulation of SQSTM1-positive puncta in the cytoplasm (). A western blot analysis also revealed that AGE-BSA notably induced the phosphorylation of SMAD3, with simultaneous increases in LC3-II and SQSTM1 (). These results indicate that SMAD3 is indeed involved in AGEs-induced autophagic flux blockage under diabetic conditions.
Figure 1. AGE-BSA-induced SMAD3 activation is associated with autophagic blockage in HK-2 cells. (A) Double immunofluorescence staining of SQSTM1 and TGFB1 in HK-2 cells exposed to 30 μg/ml AGE-BSA or 30 μg/ml Co-BSA for 24 h. (B and C) Quantification of SQSTM1 puncta and TGFB1 fluorescence intensity. (D) Double immunofluorescence staining of SQSTM1 and phospho-SMAD3 in AGE-BSA or Co-BSA-treated HK-2 cells. (E and F) Quantification of SQSTM1 puncta and phospho-SMAD3 protein-positive nuclei. (G–K) Western blot analysis of LC3, SQSTM1, and phospho-SMAD3 expression in AGE-BSA or Co-BSA-treated HK-2 cells. Bars represent means ± SEM from at least 3 independent experiments. *P< 0.05, **P< 0.01 and ***P< 0.001. DAPI was used to stain nuclei. Scale bar: 10 µm
We further evaluated autophagic activity in AGE-BSA-treated TECs following SMAD3 inhibition by SIS3, a specific pharmacological inhibitor of SMAD3, or siRNA-mediated knockdown of endogenous SMAD3. Immunofluorescence staining and western blotting showed that SMAD3 knockdown significantly alleviated the accumulation of autophagic vacuoles, as evidenced by the decreased number of LC3-II and SQSTM1-positive puncta () as well as the reduced protein levels of LC3-II and SQSTM1 () in HK-2 cells exposed to AGE-BSA.
Figure 2. Inhibition of SMAD3 improves autophagic flux and protects HK-2 cells from injury after treatment with AGE-BSA. (A) Immunofluorescence staining of LC3 and SQSTM1 in HK-2 cells with or without SMAD3 gene knockdown after exposure to 30 μg/ml AGE-BSA or 30 μg/ml Co-BSA for 24 h. (B and C) Quantification of LC3 and SQSTM1 puncta. (D–G) Western blot analysis of phospho-SMAD3, LC3, and SQSTM1 expression in AGE-BSA or Co-BSA-treated HK-2 cells. (H) Fluorescent microscopic analysis of autophagic flux in RFP-GFP-LC3 plasmid-transfected HK-2 cells. After transient transfection with RFP-GFP-LC3 plasmids, HK-2 cells were pretreated with 10 µM SIS3 or 10 µM dimethyl sulfoxide (DMSO) for 1 h and exposed to AGE-BSA or Co-BSA. The yellow puncta indicate autophagosomes (arrowheads), and red puncta indicate autolysosomes (arrows). (I) Quantitative data for autophagosomes or autolysosomes in each cell. (J–L) Western blot analysis of HAVCR1 and FN1 expression in AGE-BSA or Co-BSA-treated HK-2 cells. (M) Immunofluorescence staining of FN1 in HK-2 cells. (N and O) ELISA of HAVCR1 and FN1 in the HK-2 cell culture supernatants. Bars represent means ± SEM for at least 3 independent experiments. *P< 0.05, **P< 0.01, and ***P< 0.001. DAPI was used to stain nuclei. Scale bar: 10 μm
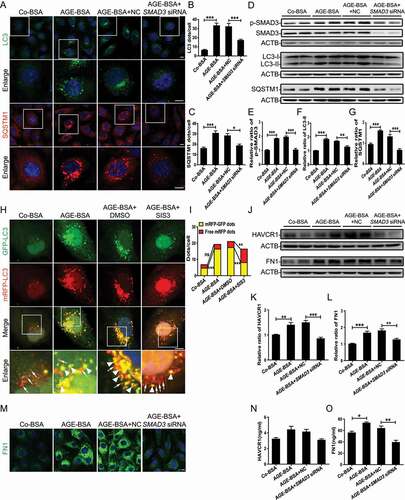
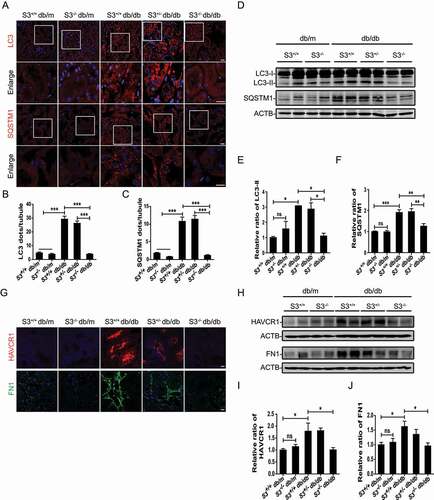
To confirm our observations, autophagic flux was further monitored using the tandem RFP-GFP-LC3 construct based on the principle of lysosomal quenching of GFP in GFP-labeled autophagic substrates [Citation41]. Yellow (GFP and mRFP signals) puncta represent LC3-II-positive autophagosomes, while red-only puncta represent autolysosomes due to the relative resistance of RFP to degradation by lysosomal proteases. As shown in , after exposure to AGE-BSA, the number of yellow puncta was increased, suggesting the disruption of autophagic flux. Importantly, SMAD3 inactivation by SIS3 remarkably reduced the accumulation of yellow puncta and enhanced the number of red puncta in AGE-BSA-treated cells, which is implying the restoration of autophagic flux. In addition to the restoration of autophagic flux, the expression and secretion of HAVCR1 (hepatitis A virus cellular receptor 1) and extracellular matrix FN1 (fibronectin 1) decreased markedly in AGE-BSA-stimulated HK-2 cells with SMAD3 inhibition (). In concordance with the results of in vitro experiments, the knockout of smad3 in db/db mice (disruption of exon 8) notably reduced the accumulation of LC3-II and SQSTM1-positive dots () and decreased the protein expression levels of LC3-II and SQSTM1 in TECs (). As expected, the increases in both HAVCR1 and FN1 in renal tubules in db/db mice were attenuated by the deletion of smad3 (), consistent with our recent findings that the deletion of smad3 protects against nephropathy by suppressing renal fibrosis and inflammation and preventing an increase in serum creatinine and microalbuminuria in db/db mice [Citation31]. These results indicate that SMAD3 disrupts autophagic flux and promotes TEC injury under diabetic conditions.
Figure 3. Smad3 gene knockout alleviates autophagic blockage and protects TECs. (A–C) Immunofluorescence staining of LC3 and SQSTM1 in TECs from db/m mice and db/db mice with or without smad3 gene knockout. DAPI was used to stain nuclei. Scale bar: 10 µm. (D–F) Western blot analysis of LC3 and SQSTM1 expression in the renal tissues of mice. (G) Fluorescent microscopic analysis of HAVCR1 and FN1 in renal tissues of mice. Scale bar: 10 μm. (H–J) Western blot analysis of FN1 and HAVCR1 expression in the renal tissues of mice. Each bar represents the mean ± SEM for groups of five to eight mice. Smad3+/+ db/m (n= 8), smad3−/- db/m (n= 5), Smad3+/+ db/db (n= 8), Smad3± db/db (n= 8), and smad3−/- db/db (n= 8).*P < 0.05, **P < 0.01, and ***P < 0.001.
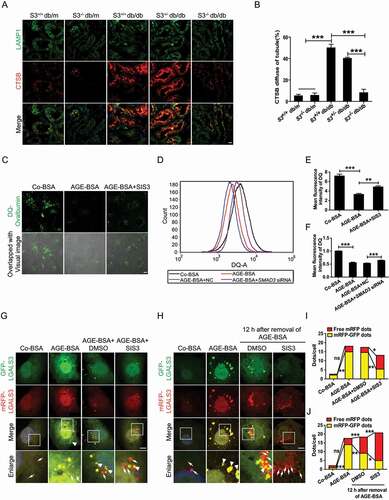
The degradation of lysosomes is crucial for maintaining autophagic flux [Citation1,Citation42] and contributes to the blockage of autophagy flux in diabetic conditions [Citation1]. Therefore, we speculated that SMAD3 might disrupt autophagic flux by impairing lysosomal degradation. To test this hypothesis, DQ-ovalbumin with a self-quenched conjugate of ovalbumin that exhibits bright green fluorescence upon proteolysis was utilized to evaluate the degradation of lysosomes. As expected, AGE-BSA treatment significantly impaired DQ-ovalbumin degradation, which was partially rescued by SIS3 ( and E). This was further confirmed in SMAD3-silenced HK-2 cells by flow cytometry ( and F).
Figure 4. Inhibition of SMAD3 improves lysosome degradation and promotes the clearance of damaged lysosomes under diabetic conditions. (A) Double immunofluorescence staining of LAMP1 and CTSB in TECs in renal tissues from wild-type and smad3 knockout db/db mice. (B) Quantitative analysis the number of the LMP tubular in the groups of mice. Smad3+/+ db/m (n= 8), smad3−/- db/m (n= 5), Smad3+/+ db/db (n= 8), Smad3± db/db (n= 8), and smad3−/- db/db (n= 8). (C) Immunofluorescence staining of DQ-ovalbumin in HK-2 cells. (D) Flow cytometric analysis of DQ-ovalbumin staining in HK-2 cells with or without SMAD3 siRNA knockdown after exposure to 30 μg/ml AGE-BSA of 30 μg/ml Co-BSA for 24 h. (E and F) Quantitative analysis of the mean fluorescent intensity of DQ-ovalbumin. (G and H) Fluorescent microscopic analysis of lysosome rupture (G) and clearance (H) in RFP-GFP-LGALS3 plasmid-transfected HK-2 cells. The yellow puncta indicate ruptured lysosomes (arrowheads), while the red dots represent functional lysosomes with lysophagic degradation of damaged lysosomes (arrows). (I and J) Quantitative data for yellow puncta or free red puncta per cell. Data represent the means ± SEM for at least 3 independent experiments. *P < 0.05, **P < 0.01, and ***P < 0.001. DAPI was used to stain nuclei. Scale bar: 10 µm
These results suggest that SMAD3 promotes autophagy dysregulation by triggering lysosome depletion in TECs and accelerates TEC injury under diabetic conditions.
SMAD3 triggered lysosome depletion by impairing the clearance of damaged lysosomes and suppressing lysosome biogenesis in TECs under diabetic conditions
We have previously detected the initiation of LMP in TECs of human DN and in AGE-BSA-treated HK-2 cells [Citation1]. Consistent with previous results, LMP also occurred in TECs of db/db mice, as detected by the colocation of lysosomal protease CTSB (cathepsin B) and LAMP1 (lysosomal associated membrane protein 1). This was largely improved by deleting smad3, after which the accumulation of damaged lysosomes characterized by irregular and large LAMP1 granules with dispersed CTSB expression was reduced ( and B). These findings indicate that SMAD3 may promote LMP or/and inhibit the clearance of damaged lysosomes in TECs under diabetic conditions. To test whether SMAD3 inhibition enhances the clearance of damaged lysosomes and thereby restores the lysosome degradation capacity, HK-2 cells were transfected with an RFP and GFP tandem fluorescent-tagged LGALS3/Galetin-3 plasmid, tfGal3, to detect lysosomal rupture. As shown in and I, treatment with AGE-BSA resulted in severe lysosome damage. In contrast, pre-treatment with the SMAD3 inhibitor SIS3 notably increased the clearance of damaged lysosomes. Further confirming this result, 12 h after the withdrawal of AGE-BSA, a number of yellow puncta were converted into red puncta, and SIS3 significantly accelerated this process ( and J). These findings imply that SMAD3 impairs the clearance of damaged lysosomes in TECs under diabetic conditions.
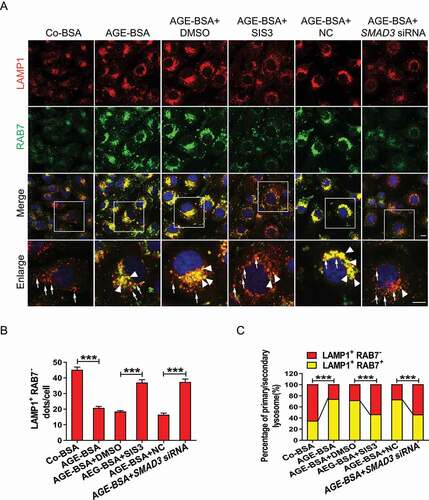
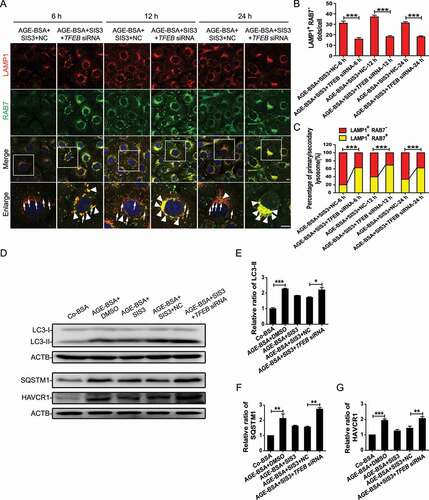
The maintenance of lysosomal degradation and the removal of damaged lysosomes rely on a sufficient quantity of intact lysosomes, which are partly replenished by lysosome biogenesis. We evaluated whether the inhibition of SMAD3 would promote lysosome biogenesis by double staining of LAMP1 and RAB7. Positive staining for both LAMP1 and RAB7 in lysosomal compartments indicators secondary lysosomes, whereas LAMP1-positive alone indicates primary lysosomes [Citation42]. We found that AGE-BSA suppressed lysosome biogenesis, as evidenced by a significant increase in the number of LAMP1 and RAB7-positive vesicles in HK-2 cells. The pharmacological inhibitor SIS3 or genetic knockdown of SMAD3 increased the number of vesicles positive for LAMP1 alone but diminished the number of LAMP1 and RAB7 double-positive puncta under diabetic conditions (). These observations suggest that under diabetic conditions, SMAD3 may impede lysosome biogenesis.
Figure 5. Inhibition of SMAD3 increases lysosome biogenesis under diabetic conditions. (A) Double-immunofluorescence staining of LAMP1 and RAB7 to detect primary or secondary lysosomes. HK-2 cells with or without the inhibition of SMAD3 by SIS3 and or with or without the knockdown of SMAD3 by SMAD3 siRNA were exposed to AGE-BSA or Co-BSA for 24 h. LAMP1 and RAB7 double-positive dots represent secondary lysosomes (arrowheads), while single LAMP1-positive dots indicate primary lysosomes (arrows). Scale bar: 10 μm. (B and C) Quantitative data for primary lysosomes or the percentage of primary and secondly lysosomes in each cell. Data represent the means ± SEM for at least 3 independent experiments. ***P< 0.001
SMAD3 suppressed lysosome biogenesis in a TFEB-dependent manner
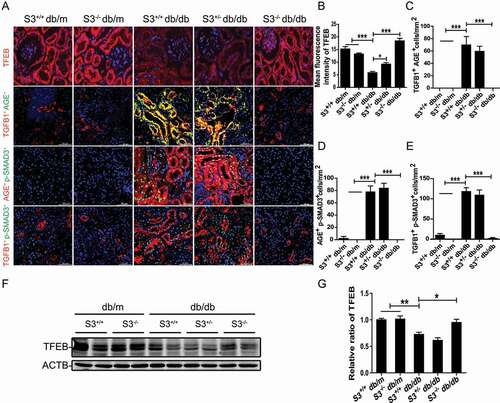
As lysosome biogenesis and autophagy are coordinated by TFEB, a master regulator of the coordinated lysosomal expression and regulation network [Citation43], we hypothesized that SMAD3 may inhibit lysosome biogenesis by impairing TFEB function in DN. We first tested this hypothesis in db/db mice with or without the deletion of Smad3. Two-color immunofluorescence showed massive tubular AGE deposition, strong TGFB1 expression, and marked activation of SMAD3, as identified by phospho-SMAD3 nuclear translocation in the damaged tubulointerstitial areas, presumably in TECs, in Smad3+/+ db/db and Smad3± db/db mice, which was associated with a loss of tubular TFEB (). In contrast, similar to normal db/m mice (Smad3+/+ db/m and smad3−/- db/m), db/db mice lacking Smad3 (smad3−/- db/db) were protected against the loss of tubular TFEB expression without notable AGEs deposition and TGFB-SMAD3 signaling activation (). These data suggest that the local deposition of AGEs and upregulation of TGFB1 activate SMAD3 to suppress the expression of tubular TFEB, thereby suppressing lysosome biogenesis in TECs under diabetic conditions. Western blot analysis confirmed this notion that compared with both Smad3+/+ db/db and Smad3± db/db mice in which TFEB expression was largely reduced, the deletion of Smad3 (smad3−/- db/db) restored TFEB expression levels to those in normal Smad3+/+ db/m and smad3−/- db/m mice ( and G).
Figure 6. Smad3 gene knockout enhanced the expression of TFEB and reduced the expression of TGFB1, AGEs and phosphor-SMAD3. (A–E) Immunofluorescence staining of TFEB and double immunofluorescence staining of TGFB1 and AGEs, phospho-SMAD3 and AGEs, and TGFB1 and phospho-SMAD3 in renal TECs from wild-type and smad3 knockout db/db mice. Smad3+/+ db/m (n= 5), smad3−/- db/m (n= 5), Smad3+/+ db/db (n= 5), Smad3± db/db (n= 5), and smad3−/- db/db (n= 5). (F and G) Western blot analysis of TFEB expression in renal tissues from db/m mice and db/db mice with or without smad3 knockout. Each bar represents the mean ± SEM for groups of five to eight mice. Smad3+/+ db/m (n= 8), smad3−/- db/m (n= 5), Smad3+/+ db/db (n= 8), Smad3± db/db (n= 8), and smad3−/- db/db (n= 8). *P< 0.05, ***P< 0.001. Scale bar: 50 µm
We then tested the regulatory role of SMAD3 in TFEB expression in AGE-BSA-treated HK-2 cells. Real-time PCR showed that AGE-BSA significantly suppressed the mRNA levels of TFEB as well as its target genes VPS11 (VPS11 core subunit of CORVET and HOPS complexes) and ATP6V1H (ATPase H+ transporting V1 subunit H), which were restored by silencing SMAD3 (). Similar results were found by western blotting in which the AGE-BSA-induced inhibition of TFEB in HK-2 cells and mouse renal tubular epithelial cells was reversed by blocking SMAD3 with the pharmacological inhibitor SIS3 or by silencing SMAD3 with siRNA ( and Figure S2). Interestingly, silencing SMAD3 constitutively increased the expression of TFEB in HK-2 cells in the absence of AGE-BSA ( and I), suggesting a critical role for SMAD3 in the regulation of TFEB expression in both physiological and pathological conditions.
Figure 7. Inhibition of SMAD3 enhanced the expression of TFEB and its downstream genes under diabetic conditions. (A–C) Real-time PCR analysis of the mRNA levels of TFEB and its target genes VPS11 and ATP6V1H in HK-2 cells with or without SMAD3 siRNA knockdown followed by 30 μg/ml AGE-BSA or 30 μg/ml Co-BSA treatment for 24 h. (D–I) Western blot analysis of TFEB expression in HK-2 cells. Cells with or without SMAD3 inactivation by SIS3 and cells with or without SMAD3 silencing were exposed to AGE-BSA or Co-BSA for 24 h. Data represent the means ± SEM of at least 3 independent experiments. *P< 0.05, **P< 0.01, and ***P< 0.001
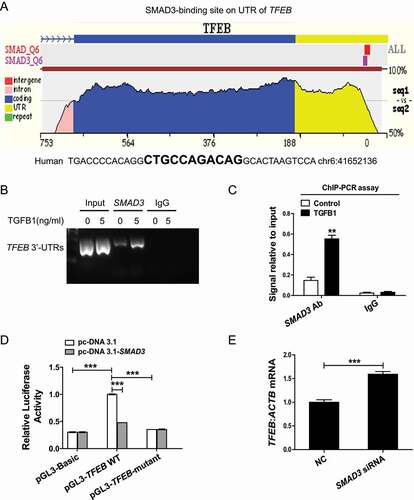
We next investigated the mechanism by which SMAD3 inhibits TFEB expression. A SMAD3-binding site was found within the 3ʹ-untranslated region (UTR) of human TFEB by using the ECR Browser (rVista 2.0, http://rvista.dcode.org/) ( and Figure S3). A ChIP analysis further showed that SMAD3 binds to the 3ʹ-UTR of TFEB, and this was enhanced upon TGFB1 treatment (). To address the effect of this binding on TFEB expression, we fused the TFEB 3ʹ-UTR to a luciferase reporter and performed dual luciferase reporter assays. The overexpression of SMAD3 strongly inhibited luciferase reporter activity, while mutations in the SMAD3-binding site in the TFEB 3ʹ-UTR abrogated this inhibitory effect of SMAD3 (). Additionally, siRNA-mediated silencing of SMAD3 increased the expression of TFEB (). These findings demonstrate that SMAD3 directly inhibits the transcription of TFEB by binding to its 3ʹ-UTR.
Figure 8. SMAD3 bound to TFEB 3ʹ-UTR to suppress TFEB transcription. (A) ECR Browser was used to predict the SMAD3-binding site within the 3ʹ-UTR of human TFEB. (B and C) ChIP analysis of the SMAD3-binding site. HK-2 cells were exposed to 5 ng/ml TGFB1 for 6 h. The DNA fragment corresponding to the 3ʹ-UTR of TFEB enriched by SMAD3 binding was evaluated by agarose gel electrophoresis or real-time quantitative PCR. (D) Luciferase activity in HK-2 cells transfected with the TFEB-luciferase reporter constructs along with SMAD3 plasmids or control empty vectors. (E) Real-time PCR analysis of the mRNA levels of TFEB. Data represent the means ± SEM for at least 3 independent experiments. **P< 0.01 and ***P< 0.001
Because addition of AGE-BSA induced TGFB1 production and SMAD3 activation in HK-2 cells () and the co-localization of massive AGEs deposition, strong TGFB1 expression, and a marked SMAD3 activation were tightly associated with loss of TFEB expression in the diabetic kidney of db/db mice (), We thus examined whether TGFB1, like AGEs, is also a key mediator of the SMAD3-mediated inhibition of tubular TFEB expression. As shown in and B, either TGFB1 or AGE-BSA was capable of activating SMAD3 at 30 min; however, the AGE-BSA-induced activation of SMAD3 after 30 min was TGFB-independent, as the addition of the TGFBR1 inhibitor galunisertib was unable to block AGE-BSA-induced SMAD3 phosphorylation. In contrast, both AGE-BSA and TGFB1-induced SMAD3 phosphorylation at 12 and 24 h were TGFB dependent. These results were consistent with the notion that the early AGEs-induced SMAD3 activation occurs independent of TGFB via the MAPK/ERK-MAPK14/p38-SMAD pathway and late activation at 12 and 24 h occurs by a TGFB-dependent mechanism [Citation23].
Figure 9. SMAD3 reduced the expression of TFEB under diabetic conditions. (A and B) Western blot analysis of phospho-SMAD3 expression in HK-2 cells. The cells were pretreated with 10 µM galunisertib or 10 µM SIS3 for 1 h and then exposed to AGE-BSA or TGFB1 for another 30 min, 12 h, or 24 h. (C–E) Western blot analysis of TFEB and phospho-SMAD3 expression in HK-2 cells. The cells were stimulated with AGE-BSA, TGFB1, AGE-BSA, and TGFB1 for 24 h. (F–H) Western blot analysis of TFEB and phospho-SMAD3 expression in HK-2 cells. The cells were pretreated with 10 µM galunisertib for 1 h and then exposed to TGFB1 for another 24 h. Data represent the means ± SEM for at least 3 independent experiments. *P< 0.05, **P< 0.01, and ***P< 0.001
Unexpected, although TGFB1 and AGEs induced SMAD3 activation in a similar fashion, they had opposite effects on TFEB expression. AGEs inhibited but TGFB1 increased the expression of TFEB in HK-2 cells, and the combination of TGFB1 and AGE-BSA (mimicking the diabetic conditions in vitro) significantly suppressed the expression of TFEB by further activating SMAD3 (). Interestingly, blocking TGFB signaling with galunisertib weakened the activation of SMAD3 but partially inhibited TFEB expression (). This contradictory result suggests the complexity of TGFB1 signaling in the regulation of TFEB expression. We further investigated the effects of individual SMAD molecules, such as SMAD2, SMAD3, and SMAD7. As shown in , silencing SMAD3 resulted in a further increase in TGFB1-induced TFEB expression. In contrast, silencing SMAD7, a SMAD3 inhibitor, enhanced SMAD3 activation and thus suppressed TGFB1-induced TFEB expression by HK-2 cells (). Because TGFB1 induces SMAD7 mRNA expression ( and H), high levels of SMAD7 may suppress SMAD3 phosphorylation and therefore increase TFEB expression in response to TGFB1. In addition, the knockdown of SMAD2, another downstream mediator of TGFB1 signaling, had no effect on the mRNA and protein expression of TFEB and the transcription of its downstream target genes VPS11 and ATP6V1H (). These data demonstrated that SMADs acting downstream of TGFB signaling have distinct regulatory effects on TFEB.
Figure 10. SMAD3 and SMAD7 have opposite effects on the expression of TFEB induced by TGFB. (A–F) Western blot analysis of phospho-SMAD3 and TFEB expression in HK-2 cells. The cells with or without SMAD3 or SMAD7 silencing were exposed to 2 ng/ml TGFB1 for 24 h. (G and H) Real-time PCR analysis of the mRNA levels of SMAD7. The HK-2 cells were exposed to AGE-BSA or TGFB1 for 12 h or 24 h. (I and J) Western blot analysis of TFEB expression in HK-2 cells. The cells with or without SMAD2 silencing were exposed to 2 ng/ml TGFB1 for 24 h. (K–M) Real-time PCR analysis of the mRNA levels of TFEB and its target genes VPS11 and ATP6V1H in HK-2 cells with or without SMAD2 siRNA knockdown. Data represent the means ± SEM of at least 3 independent experiments. *P< 0.05, **P< 0.01, and ***P< 0.001
To confirm the protective effect of TFEB on SMAD3-induced autophagy dysregulation during the development of DN, we knocked down TFEB in HK-2 cells. Silencing TFEB reversed the protective effect of SMAD3 inhibition on the AGEs-induced inhibition of lysosome biogenesis and autophagy influx blockade, as demonstrated by increases in both LAMP1 and RAB7 () and LC3-II and SQSTM1 (), resulting in tubular injury detected by HAVCR1 expression ( and G).
Figure 11. TFEB knockdown abolishes the protective effects of SMAD3 inactivation on lysosome biogenesis and autophagic flux in HK-2 cells. (A) Double immunofluorescence staining of LAMP1 and RAB7 to detect primary and/or secondary lysosomes. HK-2 cells with or without TFEB siRNA knockdown, were pretreated with SIS3 10 μM for 1 h and exposed to 30 μg/ml AGE-BSA for indicated time periods. LAMP1 and RAB7 double-positive dots represent secondary lysosomes (arrowheads), while single LAMP1-positive dots indicate primary lysosomes (arrows). Scale bar: 10 μm. (B and C) Number of primary lysosomes or percentage of primary and secondly lysosomes per cell. (D) Western blot analysis of LC3, SQSTM1, and HAVCR1 levels in HK-2 cells. Briefly, HK-2 cells with or without TFEB siRNA knockdown were pretreated with 10 μM SIS3 or DMSO for 1 h and exposed to 30 μg/ml AGE-BSA or Co-BSA for 24 h. (E–G) Densitometry results; the ratio of LC3-II, SQSTM1, or HAVCR1 to ACTB is expressed as a fold change compared with the level in controls. Data represent the means ± SEM of at least 3 independent experiments. *P < 0.05, **P < 0.01, and ***P < 0.001.
Discussion
We have previously reported that the autophagy pathway is blocked in TECs in DN and lysosome depletion caused by pathogenic factors in DN, such as AGEs and urinary proteins, is the major mechanism underlying autophagy inactivation in TECs [Citation1,Citation16]. However, we and others have also reported that the TGFB-SMAD3 pathway is highly activated in DN [Citation21,Citation22,Citation23,Citation44] and plays an important role in diabetes-related renal glomerular injury and tubulointerstitial fibrosis [Citation21,Citation25]. In the present study, we further demonstrated that SMAD3 activation is a key step in lysosome depletion and subsequent autophagy dysregulation in DN and that SMAD3 triggered this process transcriptionally by inhibiting TFEB-dependent lysosome biogenesis.
Lysosome depletion contributes to autophagic flux blockage in TECs in DN [Citation1,Citation16,Citation45], but LMP is considered the leading cause of lysosome depletion [Citation1]. However, the detailed roles of LMP in DN remain unclear. We observed a notable restoration of DQ-ovalbumin degradation after SMAD3 knockdown or inactivation in AGEs-treated cells. In addition, the knockout of smad3 in db/db mice markedly reduced the accumulation of damaged lysosomes in TECs as evidenced by the reduced leakage of CTSB from LAMP1-positive lysosomes into the cytoplasm. These results indicate that SMAD3 activation is involved in lysosome depletion and LMP in TECs under diabetic conditions.
Lysosome repair requires the removal of injured lysosomes in addition to lysosome regeneration [Citation46]. The removal of severely damaged lysosomes involves “lysophagy” [Citation47], which is dependent on functional lysosomes [Citation46]. By lysosome rupture assays using tfGal3, we found that the clearance of damaged lysosomes in AGEs-treated TECs was impaired, and this process was repaired by the inhibition of SMAD3. Thus, it is likely that SMAD3 activation impairs the elimination of damaged lysosomes from TECs and thus leads to lysosome depletion in DN by a SMAD3-dependent mechanism. We further found that suppresses lysosome biogenesis and acts as a negative regulator for the clearance of damaged lysosomes under diabetic conditions.
Most importantly, we found that SMAD3 may trigger lysosome depletion and autophagy dysfunction by a TFEB-dependent mechanism. TFEB is a master regulator in lysosome biogenesis [Citation43,Citation48]. Lysosome depletion caused by the decreased expression and activity of TFEB has been implicated in the pathology of many human disorders, such as Parkinson [Citation49,Citation50], Alzheimer [Citation51], and Huntington diseases [Citation52]. In addition, TFEB downregulation has also been observed in kidney diseases, including nephropathic cystinosis [Citation53]. In contrast, TFEB overexpression results in the suppression of AGE-induced autophagic impairment in podocytes [Citation54]. In the present study, we found that after exposure to AGEs, the protein and mRNA levels of TFEB as well as its target genes (VPS11 and ATP6V1H) decreased notably in HK-2 cells, and these changes were reversed by the pharmacological inhibition or silencing of SMAD3. In vivo, the deletion of smad3 also protected against the loss of TFEB in db/db mice and thus restored the function of lysosomes and autophagy in DN. These findings indicate that SMAD3 may function to suppress TFEB expression, thereby inhibiting lysosome biogenesis and causing autophagy dysfunction. We identified a transcription factor binding site for SMAD3 within the 3ʹ-UTR of human TFEB and confirmed the negative regulatory effect of SMAD3 on TFEB transcription by real-time PCR and luciferase reporter assays. Moreover, silencing TFEB reversed the protective effect of SMAD3 inhibition on autophagic flux and lysosome biogenesis, further supporting the regulatory role of TFEB in protection against SMAD3-mediated lysosome depletion and autophagy dysregulation in the development of DN.
SMAD3 can be activated by many factors, including TGFB1, AGEs, and angiotensin II, in many chronic diseases, including DN [Citation55]. In the present study, we found that AGEs were capable of activating SMAD3 signaling via both TGFB-dependent and -independent mechanisms, consistent with previous findings [Citation23,Citation25]. Indeed, the colocalization of massive AGE deposition, strong TGFB1 expression, SMAD3 activation, and the loss of TFEB in damaged TECs in Smad3+/+db/db and Smad3±db/db mice but not in smad3−/-db/db mice suggested that both AGEs and TGFB1-induced SMAD3 activation are responsible for lysosome depletion and autophagy dysregulation in DN. Interestingly, although AGEs or TGFB1 was able to induce SMAD3 phosphorylation similarly, their regulatory roles in TFEB expression were different as AGEs induced suppression but TGFB1 increased expression of TFEB, whereas, the combination of TGFB1 and AGEs significantly enhanced activation of SMAD3 and suppressed the expression of TFEB, mimicking to the results as seen in the diabetic kidneys of Smad3+/+ db/db and Smad3± db/db mice. Consistent with previous report in renal fibrosis [Citation56], our results indicated that both AGEs and TGFB1-induced inhibition of TFEB are SMAD3-dependent but SMAD2-independent, as silencing SMAD3, not SMAD2, reversed the inhibitory effect of AGEs or TGFB1 on TFEB expression. Furthermore, the discrepancy between AGEs and TGFB1 on TFEB expression in vitro may be associated with the imbalance between SMAD3 and SMAD7. We found that TGFB1 was capable of inducing SMAD7 in cultured TECs and reversing SMAD3-mediated inhibition of TFEB. Thus, the imbalance of SMAD3-SMAD7 signaling may explain our observation that the TGFB1-induced upregulation of TFEB was suppressed by blocking general TGFB signaling with the TGFBR1 inhibitor galunisertib, silencing SMAD7, but was enhanced by specifically silencing SMAD3.
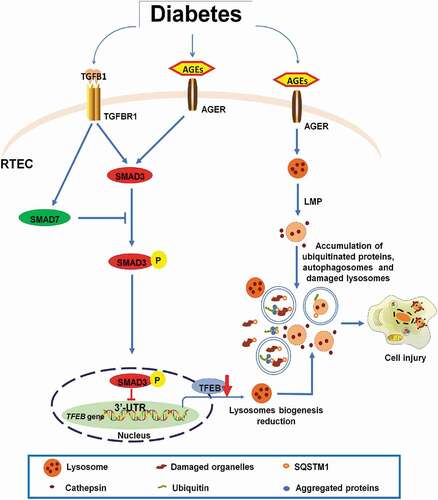
In summary, the present study reveals that in DN, the activation of SMAD3 triggers autophagy dysfunction and promotes DN. SMAD3 may bind to and suppress TFEB expression transcriptionally to inhibit lysosome biogenesis, which impairs the clearance of damaged lysosomes and results in lysosome depletion in TECs under diabetic conditions (). Thus, SMAD3 may drive the development of DN, as the deletion of smad3 protects against autophagy dysregulation and progressive renal injury, including renal fibrosis and inflammation, as described in this study and recently reported [Citation31]. These findings provide additional insights into the understanding of mechanisms underlying autophagy dysfunction during the progression of diabetic kidney injury.
Figure 12. Schematic representation of the role of SMAD3 activation in the regulation of the autophagy-lysosome pathway in DN. Activation of SMAD3 may suppress the expression of TFEB and thus inhibits lysosome biogenesis under diabetic conditions
Materials and methods
Cell culture and treatments
Human proximal tubular HK-2 cells (ATCC, CRL-2190TM) and mouse renal tubular epithelial cells (mTECs, a gift from Dr. Jeffrey B. Kopp, NIH, Bethesda, MD, USA) were maintained in DMEM (Gibco, C11995500BT) supplemented with 10% fetal bovine serum (Gibco, 10,270,106) and 1% penicillin-streptomycin at 37°C in an incubator with 5% CO2. To mimic diabetic conditions in vitro, the cells were exposed to 30 μg/ml non-glycated control bovine serum albumin (Co-BSA; Sigma Aldrich, B2064) or AGE-BSA (EMD Millipore, 121,800) for 0, 6, 12, and 24 h. RNA, protein, and/or supernatants were collected for subsequent analyses, as described below.
To determine the regulatory role of SMAD3 in AGE-BSAinduced autophagy, HK-2 cells were treated with either a pharmacological inhibitor of SMAD3, SIS3 (10 μM; Sigma Aldrich, S0447), 1 h prior to the addition of AGE-BSA or a specific SMAD3 siRNA. For the siRNA-mediated knockdown of SMAD3, HK-2 cells were transfected with 60 nM SMAD3 siRNA (sense: 5ʹ-GCGUGAAUCCCUACCACUATT-3ʹ, antisense: 5ʹ-UAGUGGUAGGGAUUCACGCTT-3) for 24 h or a negative control (NC) siRNA (sense: 5ʹ-UUCUCCGAACGUGUCACGUTT-3ʹ, antisense: 5ʹ- ACGUGACACGUUCGGAGAATT-3ʹ) (GenePharma) using a Lipofectamine 3000 Kit (Invitrogen, L3000015) according to the manufacturer’s instructions. In addition, to investigate the regulatory effects of SMAD3 in lysosome depletion via TFEB, HK-2 cells were transfected with 60 nM TFEB siRNA (sense: 5ʹ-AGACGAAGGUUCAACAUCATT-3ʹ, antisense: 5ʹ-UGAUGUUGAACCUUCGUCUTT-3ʹ) for 48 h or with NC siRNA. To evaluate whether TGFB1 induces the expression of SMAD3 and SMAD7 simultaneously, HK-2 cells were transfected with 60 nM SMAD3 siRNA or 60 nM SMAD7 siRNA (sense: 5ʹ-CCGUGCAGAUCAGCUUUGUTT-3ʹ, antisense: 5ʹ-ACAAAGCUGAUCUGCACGGTT-3ʹ) for 24 h and stimulated with 2 ng/ml TGFB1 for protein collection. To rule out the contribution of SMAD2 to SMAD3-related lysosome depletion via TFEB, HK-2 cells were transfected with 60 nM SMAD2 siRNA (sense: 5ʹ-GAAGAGGAGUGCGCUUAUATT-3ʹ, antisense: 5ʹ-UAUAAGCGCACUCCUCUUCTT-3ʹ). Silencing SMAD2 did not influence the expression of TFEB or the downstream genes VPS11 and ATP6V1A. The silencing efficiencies of siRNA against SMAD2, SMAD3, SMAD7, and TFEB, and the inhibitor of TGFBR1 galunisertib (10 µM; Selleck, S2230) and SIS3 are shown in Figure S1.
Mice
Male db/db and db/m mice were purchased from Laboratory Animal Services Center, the Chinese University of Hong Kong. All mice were fed as previously described [Citation32]. Mice with different genotypes were obtained by crossing heterozygous db/m mutants with heterozygous smad3 mutants (both have the C57BL6 background). Genotyping was performed as described previously [Citation26,Citation27]. Five inbred strains were used: Smad3+/+ db/m (n= 8), smad3−/-db/m (n= 5), Smad3+/+ db/db (n= 8), Smad3± db/db (n= 8), and smad3−/- db/db (n= 8). The animals were sacrificed by the intravenous injection of a pentobarbital overdose after anesthesia by ketamine solution at 32 weeks. Samples of kidney tissues were collected for histology, immunofluorescence, and western blotting assays as described previously [Citation56]. The study was conducted following the protocols approved by the Animal Experimentation Ethics Committee of the Chinese University of Hong Kong (AEEC No. 09/027/MIS).
Western blot analysis
Total protein extracts from kidney tissues and HK-2 cells were lysed in radio-immunoprecipitation assay lysis buffer (RIPA) buffer (Beyotime Biotechnology, P0013B) supplemented with 1 mM phenylmethanesulfonyl fluoride (Beyotime Biotechnology, ST506) and protease-phosphatase inhibitors (Applygen, P1260). The suspensions were centrifuged at 13,000 × g at 4°C for 15 min. The supernatants were collected and assayed for total protein concentration using a BCA Protein Assay Kit (Thermo Fisher, 23,227). Equal amount of protein from different conditions were separated on SDS-polyacrylamide gels and transferred onto polyvinylidene difluoride (PVDF) membranes (EMD Millipore, ISEQ00010). After blocking of nonspecific binding with 5% bovine serum albumin in PBST (0.05% Tween ® 20 [Sigma Aldrich, P7949] in PBS [Boster Biological Technology, AR0030]) for 1 h at room temperature, the membranes were probed overnight at 4°C with primary antibodies, including anti-p62/SQSTM1 (Abcam, ab91526), anti-LC3B (Sigma Aldrich, L7543), anti-fibronectin (Abcam, ab23750), anti-HAVCR1/TIM1/KIM-1 (R&D Systems, AF1817), anti-HAVCR1/TIM1/KIM-1 (Abcam, ab47635), anti-phospho-SMAD3 (Abcam, ab52903), anti-SMAD3 (Cell Signaling Technology, 9523), anti-TFEB (BETHYL, A303-672), and anti-ACTB/β-actin (Santa Cruz Biotechnology, sc-47,778). After washing in PBST, the membranes were incubated with horseradish peroxidase-conjugated anti-mouse IgG (Beyotime Biotechnology, A0216), anti-rabbit IgG (Beyotime Biotechnology, A0208), or anti-donkey IgG (Beyotime Biotechnology, A02181). After washing, the membranes were incubated with Clarity Western ECL Substrate (BioRad, 1,705,061) to detect immune complex. Blots were imaged with the C500 Imaging System (Azure biosystems) at automatic exposure mode to avoid saturation. The densities of protein signals were then quantified using ImageJ (NIH). The linear response range of the detection system was established using a two-fold dilution series of protein loadings. Appropriate protein loading was selected to ensure that band detection was within the linear range of the detection system.
Immunofluorescent analysis
HK-2 cells grown on coverslips or cryosections from kidney tissues were fixed with 4% paraformaldehyde (Sigma Aldrich, P6148) in PBS for 10 min at room temperature, followed by permeabilization with 0.5% Triton X-100 (Sigma Aldrich, T8787) in PBS for 10 min and staining with anti-LC3B (Abcam, ab51520), anti-p62/SQSTM1 (Abcam, ab91526), anti-TGFB1 (Abcam, ab92486), anti-phospho-SMAD3 (Abcam, ab52903), anti-LAMP1 (Abcam, ab24170), anti-RAB7 (Abcam, ab50533), anti-Cathepsin B (R&D Systems, AF965), anti-HAVCR1/TIM1/KIM-1 (R&D Systems, AF1817), anti-FN1/fibronectin (Abcam, ab23750), anti-phospho-SMAD3 (Santa Cruz Biotechnology, SC-11,769-R), or anti-AGE (Abcam, ab23722) overnight at 4°C. After washing with PBS, the cells or tissue sections were incubated with Alexa Fluor 488 donkey anti-rabbit IgG (Invitrogen, A21206), Alexa Fluor 594 donkey anti-mouse IgG (Invitrogen, A21203), anti-Rb polymer HRP (Dako, K4003), and DAPI (Beyotime Biotechnology, C1005) for nuclear staining. The specimens were observed under a confocal microscope (Leica Microsystems, TCS SP5 II). ImageJ was utilized to quantify the mean fluorescence of each protein, unless otherwise indicated.
Two AGE proteins were detected with the primary antibodies anti-AGE (Abcam, ab23722) and anti-TGFB1 (Abcam, ab92486) from the same species using the Tyramide SuperBoost Kits with Alexa Fluor Tyramides (Invitrogen, MAN0015834). FFPE mouse kidney tissues were labeled with rabbit anti-AGE and AF488 Tyramide conjugate (standalone) (Thermo Fisher, B40953) to detect the AGEs (green). Primary and secondary antibodies were stripped using citrate buffer (pH 6.0) (005000) in a microwave. TGFB1 (red) was then labeled with anti-TGFB1 (Abcam, ab92486) and AF555 Tyramide conjugate (standalone) (Thermo Fisher, B40955). Nuclei were labeled with DAPI (Beyotime Biotechnology, C1005). Images were obtained using a confocal microscope. At least 20 randomly chosen fields (200×) were observed for scoring.
ELISA for FN1 and HAVCR1
The quantity of FN1 and HAVCR1 in cultured cell supernatants was measured by human fibronectin ELISA kit (R&D Systems, DFBN10) and human HAVCR1 ELISA kit (R&D Systems, DKM100) respectively, according to the manufacturer’s instructions.
Autophagic flux assay
Autophagic flux was monitored using a tandem fluorescent-tagged LC3 probe (tfLC3; Addgene, 21,074; Tamotsu Yoshimori Lab) based on different pH stabilities of RFP and GFP, as described elsewhere [Citation57]. Briefly, HK-2 cells were transfected with 2 μg/ml tfLC3 plasmids using the Lipofectamine 3000 Transfection Kit according to the manufacturer’s instructions. Following different treatments, the cells were observed under a TCS SP5 II confocal microscope (Leica), and Photoshop was used to calculate the number of dots per cell. Yellow dots (RFP and GFP signal) represent autophagosomes, while red dots (RFP signal) represent autolysosomes.
Lysosome rupture and elimination assay
Lysosomal rupture was assessed using an RFP and GFP tandem fluorescent-tagged LGALS3/Galetin-3 probe (tfGal3; Addgene, 64,149; Tamotsu Yoshimori Lab), as described previously [Citation58]. Briefly, HK-2 cells were transfected with 2 μg/ml tfGal3 plasmids, using the Lipofectamine 3000 Transfection Kit according to the manufacturer’s instructions. After different treatments, the cells were observed under the TCS SP5 II confocal microscope. LGALS3/Galectin-3 is a β-galactoside-binding lectin distributed throughout the cytoplasm and nucleus. When LMP occurs, tfGal3 infiltrates the ruptured lysosome lumen and rapidly binds to the galactose-rich inner membrane, exhibiting both GFP and RFP fluorescence, yielding yellow signals. Damaged lysosomes are selectively engulfed by autophagosomes and fused with intact lysosomes for degradation. During this process, GFP fluorescence is quenched due to the acidic lumenal environment, while RFP remains relatively stable, resulting in a change from yellow puncta to red under a confocal microscope. The numbers of yellow dots (ruptured lysosomes) and red dots (lysosomes eliminated by selective autophagy, or lysophagy [Citation58]) were calculated using Photoshop.
DQ-ovalbumin dequenching assay
The proteolytic degradation of lysosomes was assessed using DQ-ovalbumin (Invitrogen, D12053) according to the manufacturer’s instructions. Once degraded by lysosomes, DQ-ovalbumin can form green fluorescent puncta. Briefly, after different treatments, HK-2 cells were incubated with 4 μg/ml DQ-ovalbumin at 37°C for 2 h. The cells were then trypsinzed and subjected to flow cytometry to determine the fluorescence intensity of DQ-ovalbumin using a FACSCanto II platform (BD, FACSCanto II). Alternatively, the cells were fixed with 4% paraformaldehyde for 10 min, and images were obtained using the TCS SP5 II confocal microscope. Fluorescence intensity of DQ-ovalbumin in individual cells was measured, and at least 50 cells per experimental condition were evaluated.
MTT assay
To determine cell viability, the colorimetric MTT metabolic activity assay was used. HK-2 cells (5000 cells/well) were cultured in a 96-well plate at 37°C and exposed to various concentrations of galunisertib for 24 h. Cells treated with medium only served as a negative control. After the supernatant was removed, 10 µl of MTT solution (5 mg/ml in PBS) and 100 µl of medium were added to each well. After incubation for another 4 h, the resultant formazan crystals were dissolved in dimethyl sulfoxide (100 µl/well) and absorbance was measured using a microplate reader (BioTek ELX800) at 570 nm. The relative cell viability (%) was expressed as a percentage relative to that of untreated control cells. Based on the results (shown in Figure S1), 10 µM galunisertib was chosen as the stimulation dose in our study.
Reverse transcription and real-time PCR analysis
Total RNA from cultured cells or kidney tissues was extracted using RNAiso Plus (Takara, 9109). The cDNA was synthesized using a PrimeScript RT Reagent Kit (Takara, RR047A), and real-time PCR was performed as described previously [Citation59] using the following primers: human SMAD3 (forward: 5ʹ-GTCTGCAAGATCCCACCAG-3ʹ;reverse:5ʹ-AGCCCTGGTTGACCGACT-3ʹ),TFEB (forward: 5ʹ-ACCTGTCCGAGACCTATGGG-3ʹ; reverse: 5ʹ-CGTCCAGACGCATAATGTTGTC-3ʹ), SMAD2 (forward: 5ʹ-ACTAACTTCCCAGCAGGAAT-3ʹ; reverse: 5ʹ-GTTGGTCACTTGTTTCTCCA-3ʹ), SMAD7 (forward: 5ʹ-TACCGTGCAGATCAGCTTTG-3ʹ; reverse: TTTGCATGAAAAGCAAGCAC-3ʹ); ATP6V1H (forward: 5ʹ-CTGCTCACGATGTTGGAGAA-3ʹ; reverse: 5ʹ-GGCCAGCAGAGCATTATAGC-3ʹ), VPS11 (forward: 5ʹ-CGGCGCTTCGTTTTCTTCG-3ʹ; reverse: 5ʹ-CCCGTAGTTTGTAGGCTTGGAA-3ʹ), and ACTB (forward: 5ʹ-TCTGGCACCACACCTTCTACAATG-3ʹ; reverse: 5ʹ-AGCACAGCCTGGATAGCAACG-3ʹ).
Chromatin immunoprecipitation (ChIP) analysis
ChIP was performed using a Simple ChIP Enzymatic Chromatin IP Kit (Cell Signaling Technology, 9003) as described previously [Citation60]. HK-2 cells were treated with 5 ng/ml rh-TGF-β1 (R&D Systems, 240-B-002) for 3 h. Then, cells were collected for ChIP. In brief, the cells were cross-linked with 1% formaldehyde for 10 min at 37°C, quenched with glycine, and then sonicated using a disruptor to generate 300- to 600-bp DNA fragments. Immunoprecipitation was performed using an anti-SMAD3 antibody (Cell Signaling Technology, 9523), and a normal Rabbit IgG (Cell Signaling Technology, 2729) was used as a control. Precipitated DNAs were detected by PCR using specific primers to detect the binding of SMAD3 to the 3ʹUTR of human TFEB (forward: 5ʹ-CAGGCCCTCTTCTCACCTCT-3ʹ; reverse: 3ʹ-GGCTGCACTGTGTGTGAAGT-5ʹ).
Dual-luciferase reporter assay
The SMAD3 coding region (NM_005902.3) cloned into pcDNA3.1 vectors (pcDNA3.1-SMAD3), and the full-length TFEB sequence with the wild-type (WT) or mutated SMAD3-binding site within the 3ʹ-UTR cloned into pGL3-basic luciferase reporter plasmids (pGL3-TFEB-WT or pGL3-TFEB-mutant) were provided by Synbio Technologies (Suzhou, China). A luciferase reporter assay was performed by Landbiology (Guangzhou, China) using a Dual Luciferase Reporter Assay Kit (Promega, E1910) as described previously [Citation60,Citation61]. Luciferase activity was measured at 48 h after transfection of 293 T cells with the pGL3-TFEB-WT, pGL3-TFEB-mutant or pGL3-basic constructs with the pcDNA3.1-SMAD3 expression plasmids (or pcDNA3.1 empty vectors) using a luminometer (Promega, GloMax-Multi Detection System) according to the manufacturer’s instructions. For all experiments, Renilla luciferase reporter plasmids were co-transfected into 293 T cells and used as internal controls to correct for variation in transfection efficiency among samples. Relative reporter activity was expressed as the ratio of firefly luciferase activity to Renilla luciferase activity.
Statistical analysis
All data are expressed as means ± standard error of the mean (S.E.M.) from at least three independent experiments. Results were analyzed using the Student’s t-test and one-way analysis of variance (ANOVA), followed by Tukey’s post-hoc tests implemented in GraphPad Prism 6. A P-value of <0.05 was considered statistically significant.
Supplemental Material
Download MS Word (1.1 MB)Acknowledgments
We thank Prof. De-li Shi and Dr. Xiao-yu Li for their comments on the manuscript.
Disclosure statement
No potential conflicts of interest were disclosed.
Supplementary material
Supplemental data for this article can be accessed here.
Additional information
Funding
References
- Liu WJ, Shen TT, Chen RH, et al. Autophagy-lysosome pathway in renal tubular epithelial cells is disrupted by advanced glycation end products in diabetic nephropathy. J Biol Chem. 2015;290:20499–20510.
- Fiseha T. Urinary biomarkers for early diabetic nephropathy in type 2 diabetic patients. Biomark Res. 2015;3:16.
- Liu J, Wang C, Liu F, et al. Metabonomics revealed xanthine oxidase-induced oxidative stress and inflammation in the pathogenesis of diabetic nephropathy. Anal Bioanal Chem. 2015;407:2569–2579.
- Zhang X, He H, Liang D, et al. Protective effects of berberine on renal injury in streptozotocin (STZ)-induced diabetic mice. Int J Mol Sci. 2016;17:1327.
- Johnson SA, Spurney RF. Twenty years after ACEIs and ARBs: emerging treatment strategies for diabetic nephropathy. Am J Physiol Renal Physiol. 2015;309:F807–20.
- GBD 2015 Eastern Mediterranean Region Diabetes and Chronic Kidney Disease Collaborators. Diabetes mellitus and chronic kidney disease in the eastern mediterranean region: findings from the global burden of disease 2015 study. Int J Public Health. 2018;63:177–186.
- Thomas MC, Cooper ME, Zimmet P. Changing epidemiology of type 2 diabetes mellitus and associated chronic kidney disease. Nat Rev Nephrol. 2016;12:73–81.
- Liu BC, Tang TT, Lv LL, et al. Renal tubule injury: a driving force toward chronic kidney disease. Kidney Int. 2018;93:568–579.
- Tziomalos K, Athyros VG. Diabetic nephropathy: new risk factors and improvements in diagnosis. The Review of Diabetic Studies: RDS. 2015;12:110–118.
- Li X, Zhang T, Geng J, et al. Advanced oxidation protein products promote lipotoxicity and tubulointerstitial fibrosis via CD36/β-catenin pathway in diabetic nephropathy. Antioxid Redox Signal. 2019;31:521–538.
- Tang SC, Chan LY, Leung JC, et al. Differential effects of advanced glycation end-products on renal tubular cell inflammation. Nephrology (Carlton, Vic). 2011;16:417–425.
- Tang SCW, Leung JCK, Lai KN. Diabetic tubulopathy: an emerging entity. Contrib Nephrol. 2011;170:124–134.
- Ding Y, Choi ME. Autophagy in diabetic nephropathy. J Endocrinol. 2015;224:R15–30.
- Liu WJ, Luo MN, Tan J, et al. Autophagy activation reduces renal tubular injury induced by urinary proteins. Autophagy. 2014;10:243–256.
- Takahashi A, Takabatake Y, Kimura T, et al. Autophagy inhibits the accumulation of advanced glycation end products by promoting lysosomal biogenesis and function in the kidney proximal tubules. Diabetes. 2017;66:1359–1372.
- Liu WJ, Xu BH, Ye L, et al. Urinary proteins induce lysosomal membrane permeabilization and lysosomal dysfunction in renal tubular epithelial cells. Am J Physiol Renal Physiol. 2015;308:F639–49.
- Yang D, Livingston MJ, Liu Z, et al. Autophagy in diabetic kidney disease: regulation, pathological role and therapeutic potential. Cell Mol Life Sci. 2018;75:669–688.
- Zhang W, Li X, Wang S, et al. Regulation of TFEB activity and its potential as a therapeutic target against kidney diseases. Cell Death Discov. 2020;6:32.
- Gu YY, Liu XS, Huang XR, et al. Diverse role of TGF-β in kidney disease. Front Cell Dev Biol. 2020;8:123.
- Guo K, Lu J, Kou J, et al. Increased urinary Smad3 is significantly correlated with glomerular hyperfiltration and a reduced glomerular filtration rate and is a new urinary biomarker for diabetic nephropathy. BMC Nephrol. 2015;16:159.
- Li J, Qu X, Yao J, et al. Blockade of endothelial-mesenchymal transition by a Smad3 inhibitor delays the early development of streptozotocin-induced diabetic nephropathy. Diabetes. 2010;59:2612–2624.
- Ono H, Abe H, Sakurai A, et al. Novel interplay between Smad1 and Smad3 phosphorylation via AGE regulates the progression of diabetic nephropathy. Sci Rep. 2018;8:10548.
- Li JH, Huang XR, Zhu HJ, et al. Advanced glycation end products activate Smad signaling via TGF-beta-dependent and independent mechanisms: implications for diabetic renal and vascular disease. Faseb J. 2004;18:176–178.
- Chen HY, Huang XR, Wang W, et al. The protective role of Smad7 in diabetic kidney disease: mechanism and therapeutic potential. Diabetes. 2011;60:590–601.
- Chung AC, Zhang H, Kong YZ, et al. Advanced glycation end-products induce tubular CTGF via TGF-beta-independent Smad3 signaling. J Am Soc Nephrol. 2010;21:249–260.
- Sun SF, Tang PMK, Feng M, et al. Novel lncRNA Erbb4-IR promotes diabetic kidney injury in db/db mice by targeting miR-29b. Diabetes. 2018;67:731–744.
- Sun SF, Zhao TT, Zhang HJ, et al. Renoprotective effect of berberine on type 2 diabetic nephropathy in rats. Clin Exp Pharmacol Physiol. 2015;42:662–670.
- You YK, Huang XR, Chen HY, et al. C-reactive protein promotes diabetic kidney disease in db/db mice via the CD32b-Smad3-mTOR signaling pathway. Sci Rep. 2016;6:26740.
- Li JH, Huang XR, Zhu HJ, et al. Role of TGF-beta signaling in extracellular matrix production under high glucose conditions. Kidney Int. 2003;63:2010–2019.
- Fujimoto M, Maezawa Y, Yokote K, et al. Mice lacking Smad3 are protected against streptozotocin-induced diabetic glomerulopathy. Biochem Biophys Res Commun. 2003;305:1002–1007.
- Xu BH, Sheng J, You YK, et al. Deletion of Smad3 prevents renal fibrosis and inflammation in type 2 diabetic nephropathy. Metabolism. 2020;103:154013.
- Zhang YY, Tang PM, Tang PC, et al. LRNA9884, a novel Smad3-dependent long noncoding RNA, promotes diabetic kidney injury in db/db mice via enhancing MCP-1-dependent renal inflammation. Diabetes. 2019;68:1485–1498.
- Chen HY, Zhong X, Huang XR, et al. MicroRNA-29b inhibits diabetic nephropathy in db/db mice. Mol Ther. 2014;22:842–853.
- Wu TT, Li WM, Yao YM. Interactions between Autophagy and Inhibitory Cytokines. Int J Biol Sci. 2016;12:884–897.
- Suzuki HI, Kiyono K, Miyazono K. Regulation of autophagy by transforming growth factor-β (TGF-β) signaling. Autophagy. 2010;6:645–647.
- Ding Y, Kim JK, Kim SI, et al. TGF-{beta}1 protects against mesangial cell apoptosis via induction of autophagy. J Biol Chem. 2010;285:37909–37919.
- Koesters R, Kaissling B, Lehir M, et al. Tubular overexpression of transforming growth factor-beta1 induces autophagy and fibrosis but not mesenchymal transition of renal epithelial cells. Am J Pathol. 2010;177:632–643.
- Xu Y, Yang S, Huang J, et al. Tgf-β1 induces autophagy and promotes apoptosis in renal tubular epithelial cells. Int J Mol Med. 2012;29:781–790.
- Ding Y, Kim S, Lee SY, et al. Autophagy regulates TGF-β expression and suppresses kidney fibrosis induced by unilateral ureteral obstruction. J Am Soc Nephrol. 2014;25:2835–2846.
- Massagué J. TGFβ signalling in context. Nat Rev Mol Cell Biol. 2012;13:616–630.
- Hariharan N, Zhai P, Sadoshima J. Oxidative stress stimulates autophagic flux during ischemia/reperfusion. Antioxid Redox Signal. 2011;14:2179–2190.
- Yap CC, Digilio L, McMahon LP. Degradation of dendritic cargos requires Rab7-dependent transport to somatic lysosomes. J Cell Biol. 2018;217:3141–3159.
- Settembre C, Medina DL. TFEB and the CLEAR network. Methods Cell Biol. 2015;126:45–62.
- Fontán G. AIDS in children. Anales espanoles de pediatria. 1985;23:157–162.
- Song XB, Liu G, Liu F, et al. Autophagy blockade and lysosomal membrane permeabilization contribute to lead-induced nephrotoxicity in primary rat proximal tubular cells. Cell Death Dis. 2017;8:e2863.
- Papadopoulos C, Meyer H. Detection and clearance of damaged lysosomes by the endo-lysosomal damage response and lysophagy. Curr Biol. 2017;27:R1330–r41.
- Hasegawa J, Maejima I, Iwamoto R, et al. Selective autophagy: lysophagy. Methods. 2015;75:128–132.
- Sardiello M, Palmieri M, Di Ronza A, et al. A gene network regulating lysosomal biogenesis and function. Science (New York, NY). 2009;325:473–477.
- Dehay B, Bové J, Rodríguez-Muela N, et al. Pathogenic lysosomal depletion in Parkinson’s disease. J Neurosci. 2010;30:12535–12544.
- Decressac M, Mattsson B, Weikop P, et al. TFEB-mediated autophagy rescues midbrain dopamine neurons from α-synuclein toxicity. Proc Natl Acad Sci U S A. 2013;110:E1817–26.
- Tiribuzi R, Crispoltoni L, Porcellati S, et al. miR128 up-regulation correlates with impaired amyloid β(1-42) degradation in monocytes from patients with sporadic Alzheimer’s disease. Neurobiol Aging. 2014;35:345–356.
- Tsunemi T, Ashe TD, Morrison BE, et al. PGC-1α rescues Huntington’s disease proteotoxicity by preventing oxidative stress and promoting TFEB function. Sci Transl Med. 2012;4:142ra97.
- Rega LR, Polishchuk E, Montefusco S, et al. Activation of the transcription factor EB rescues lysosomal abnormalities in cystinotic kidney cells. Kidney Int. 2016;89:862–873.
- Zhao X, Chen Y, Tan X, et al. Advanced glycation end-products suppress autophagic flux in podocytes by activating mammalian target of rapamycin and inhibiting nuclear translocation of transcription factor EB. J Pathol. 2018;245:235–248.
- Meng XM, Nikolic-Paterson DJ, Lan HY. TGF-β: the master regulator of fibrosis. Nat Rev Nephrol. 2016;12:325–338.
- Meng XM, Huang XR, Chung AC, et al. Smad2 protects against TGF-beta/Smad3-mediated renal fibrosis. J Am Soc Nephrol. 2010;21:1477–1487.
- Liu WJ, Li ZH, Chen XC, et al. Blockage of the lysosome-dependent autophagic pathway contributes to complement membrane attack complex-induced podocyte injury in idiopathic membranous nephropathy. Sci Rep. 2017;7:8643.
- Maejima I, Takahashi A, Omori H, et al. Autophagy sequesters damaged lysosomes to control lysosomal biogenesis and kidney injury. Embo J. 2013;32:2336–2347.
- Liu JX, Yang C, Zhang WH, et al. Disturbance of mitochondrial dynamics and mitophagy in sepsis-induced acute kidney injury. Life Sci. 2019;235:116828.
- Tang PM, Zhou S, Meng XM, et al. Smad3 promotes cancer progression by inhibiting E4BP4-mediated NK cell development. Nat Commun. 2017;8:14677.
- Feng M, Tang PM, Huang XR, et al. TGF-β mediates renal fibrosis via the Smad3-Erbb4-IR long noncoding RNA axis. Mol Ther. 2018;26:148–161.