
ABSTRACT
Pancreatic cancer is one of the most aggressive tumors associated with a poor clinical prognosis, weakly effective therapeutic options. Therefore, there is a strong impetus to discover new therapeutic targets in pancreatic cancer. In the present study, we first demonstrated that TSPAN1 is upregulated in pancreatic cancer and that TSPAN1 depletion decreases pancreatic cancer cell proliferation in vitro and in vivo. TSPAN1 expression was correlated with poor overall survival of pancreatic cancer patients. Moreover, we demonstrated that TSPAN1 is a novel positive regulator of macroautophagy/autophagy characterized by decreased LC3-II and SQSTM1/p62 expressions, inhibited puncta formation of GFP-LC3 and autophagic vacuoles. We also demonstrated that tspan1 mutation impaired autophagy in the zebrafish model. Furthermore, we showed that TSPAN1 promoted autophagy maturation via direct binding to LC3 by two conserved LIR motifs. Mutations in the LIR motifs of TSPAN1 resulted in a loss of the ability to induce autophagy and promote pancreatic cancer proliferation. Second, we discovered two conservative TCF/LEF binding elements present in the promoter region of the TSPAN1 gene, which was further verified through luciferase activity and ChIP assays. Furthermore, TSPAN1 was upregulated by FAM83A through the canonical WNT-CTNNB1 signaling pathway. We further demonstrated that both TSPAN1 and FAM83A are both direct targets of MIR454 (microRNA 454). Additionally, we revealed the role of MIR454-FAM83A-TSPAN1 in the proliferation of pancreatic cancer cells in vitro and in vivo. Our findings suggest that components of the MIR454-FAM83A-TSPAN1 axis may be valuable prognosis markers or therapeutic targets for pancreatic cancer.
Abbreviations: AMPK: adenosine 5‘-monophosphate (AMP)-activated protein kinase; APC: APC regulator of WNT signaling pathway; ATG: autophagy related; AXIN2: axin 2; BECN1: beclin 1; CCND1: cyclin D1; CSNK1A1/CK1α: casein kinase 1 alpha 1; CTNNB1/β-catenin: catenin beta 1; DAPI: 4ʹ6-diamino-2-phenylindole; EBSS: Earle’s balanced salt solution; EdU: 5-ethynyl-20-deoxyuridine; FAM83A: family with sequence similarity 83 member A; GAPDH: glyceraldehyde-3-phosphate dehydrogenase; GFP: green fluorescent protein; GSEA: gene set enrichment analysis; GSK3B: glycogen synthase kinase 3 beta; IHC: immunohistochemical; LAMP1: lysosomal associated membrane protein 1; LIR: LC3-interacting region; MAP1LC3/LC3, microtubule associated protein 1 light chain 3; MIR454: microRNA 454; miRNA: microRNA; MKI67: antigen identified by monoclonal antibody Ki 67; MTOR: mechanistic target of rapamycin kinase; MTT: 3-(4,5-dimethylthiazol-2-yl)-2, 5-diphenyltetrazolium bromide; MYC: MYC proto-oncogene, bHLH transcription factor; OS: overall survival; PDAC: pancreatic ductal adenocarcinoma; RAB7A: RAB7A, member RAS oncogene family; shRNA: short hairpin RNA; SQSTM1: sequestosome 1; TBE: TCF/LEF binding element; TCGA: The Cancer Genome Atlas; TCF/LEF: transcription factor/lymphoid enhancer binding factor; TCF4: transcription factor 4; TSPAN1: tetraspanin 1; TUNEL: terminal deoxynucleotidyl transferase mediated dUTP nick end labeling; UTR: untranslated region; WT: wild type.
Introduction
Pancreatic cancer is an aggressive tumor with a devastating malignancy capability and a 5-year survival rate of less than 5% [Citation1]. Approximately 90% of pancreatic cancers are pancreatic ductal adenocarcinoma (PDAC), which is characterized by early-stage metastasis and adverse reactions to radiotherapy and chemotherapy. Pancreatic cancer is expected to be the 2nd leading cause of cancer-related death by 2020 [Citation2]. Although diagnostic and surgical treatment methods have been developed to aid in lengthening survival and providing symptom relief, few approaches provide a curative effect [Citation1]. Thus, it is important to understand the biology of pancreatic cancer and identify putative therapeutic targets in dysregulated oncogenic pathways that can enable earlier diagnosis and individualized treatment for PDAC patients. High-frequency somatic mutations in a subset of genes, including KRAS (KRAS proto-oncogene), CDKN2A (cyclin dependent kinase inhibitor 2A), TP53 (tumor protein p53) and SMAD4/DPC4 (SMAD family member 4), as well as mutations that result in constitutively activated signaling pathways, are thought to be related to pancreatic cancer progression, such as autophagy and WNT-CTNNB1 signal pathway [Citation3]. Autophagy is an evolutionarily conserved intracellular degradation process and a lysosomal-dependent catabolic pathway. The large capacity of autophagosomes allows autophagy to eliminate protein aggregates and damaged organelles to maintain cytoplasmic homeostasis [Citation4]. The initiation of autophagy requires the involvement of several autophagy-related (ATG) proteins in response to nutrient depletion and subsequent adenosine 5‘-monophosphate (AMP)-activated protein kinase (AMPK) activation or MTOR (mechanistic target of rapamycin kinase) inhibition [Citation5–7]. Autophagy is crucial for pancreatic tumor growth and progression, which has been shown by numerous in vivo xenograft models and transgenic mice models [Citation8–10 Canonical WNT ligands, including WNT3 and WNT8A, are markedly upregulated in PDAC tissues [Citation11]. Once WNT ligands bind to their member receptors, the degradation of CTNNB1 is blocked, and accumulated CTNNB1 is translocated into the nucleus where it subsequently activates target genes in concert with TCF/LEF co-factors. Moreover, enforced canonical WNT-CTNNB1 signaling using a Ptff1a-Cre drive (Ptff1a-Cre; Ctnnb1exon3/+) resulted not only in acinar proliferation but also the development of large benign tumors [Citation12]. The WNT-CTNNB1 signaling pathway was reported to be a negative regulator of both basal and stress-induced autophagy [Citation13–15]. However, the mechanism of exitance of both the high levels of autophagy and WNT-CTNNB1 signaling in pancreatic cancer remains largely unknown.
MicroRNAs (miRNAs) are a large class of small non-coding RNAs that target the RNA interference (RNAi) effector complex RNA-induced silencing complex (RISC) to specific messenger RNAs (mRNAs) and regulate its expression [Citation16]. Based on the specific paired sequences, every miRNA has many predicted target mRNAs [Citation17]. These small endogenous RNA molecules are evolutionarily ubiquitous and participate in various biological processes, including cancer development [Citation18]. Multiple studies have demonstrated that miRNAs function as oncogenes or antioncogenes in pancreatic cancer onset and tumorigenesis [Citation19]. Previously, gene expression data of pancreatic cancer were analyzed in The Cancer Genome Atlas (TCGA) with respect to improved therapeutic response [Citation20], and potential prognostic miRNA biomarkers were identified for predicting overall survival of pancreatic cancer with early stage [Citation21]. In this study, we observed that MIR454-5p (hereafter called MIR454) was downregulated in pancreatic cancer and correlated with the overall survival of pancreatic cancer patients. MIR454 was previously reported to be a biomarker in pancreatic cancer and hepatocellular carcinoma patients [Citation22,Citation23], but the biological function of MIR454 in pancreatic cancer has remained obscure.
TSPAN1 (tetraspanin 1), a member of the tetraspanin (TSPAN/TM4SF) superfamily characterized by tetraspanin-enriched microdomains (TEMs), was reported to be involved in many fundamental biological processes, including cell proliferation, adhesion and migration [Citation24]. Recently, TSPAN1 was reported to promote the progression of many types of cancer, such as cholangiocarcinoma, ovarian carcinomas, gastric and colorectal cancers [Citation25–28 However, the underlying mechanism associated with this activity requires further investigation. FAM83A/BJ-TSA-9 (family with sequence similarity 83 member A) was originally identified as a potential tumor-specific gene [Citation29] and also contributes to chemoresistance in pancreatic cancer through the WNT-CTNNB1 pathway [Citation30]. In this study, we demonstrated that higher TSPAN1 expression correlates with poor pancreatic cancer overall survival and that TSPAN1 depletion suppresses pancreatic cancer cell proliferation. We also highlight the role of TSPAN1 in autophagy flux interacting with LC3 and promoting autophagosome maturation. Through genome-wide expression analysis, we further identified and verified that TSPAN1 and FAM83A are both direct targets of MIR454. Furthermore, we demonstrated that FAM83A could upregulate TSPAN1 mRNA level through the WNT-CTNNB1 signal pathway. Additionally, the role of MIR454-FAM83A-TSPAN1 in the proliferation of pancreatic cancer cells was investigated in vitro and in vivo.
Results
TSPAN1 is upregulated and TSPAN1 depletion decreases cell proliferation in human pancreatic cancer
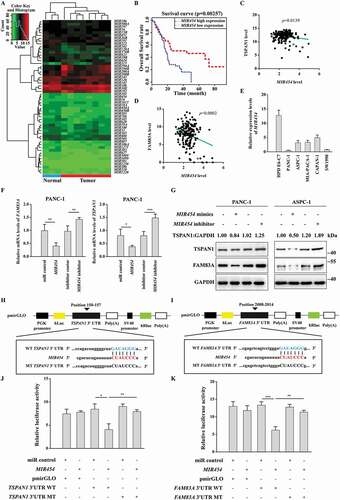
To investigate the role of TSPAN1 in pancreatic cancer, we first set out to verify the expression level of TSPAN1 in pancreatic cancer tissues using commercial pancreatic cancer patient tissue arrays. The results of the immunohistochemical (IHC) analysis revealed that TSPAN1 protein expression levels were significantly increased in pancreatic cancer patients, and more importantly, with the advanced stages of pancreatic cancer compared to those observed in normal tissues (). We also observed that both the protein and mRNA levels of TSPAN1 were higher in a panel of pancreatic cancer cell lines, including SW1990, MIA-PACA-1, CAPAN-1, PANC-1 and ASPC-1, compared with those observed in the normal pancreatic duct epithelial cell line HPD E6-C7. ( and S1A). Similar results were observed in human pancreatic cancer samples from gene expression omnibus (GEO) datasets (GSE287351) and the TCGA database (Fig. S1B and S1C). We next investigated the relevance of the TSPAN1 expression level with clinicopathological features of pancreatic cancer patients from the IHC results of the commercial tissue arrays. We observed that increased expression of TSPAN1 significantly correlates with the tumor size (p = 0.0301) and tumor stage (p < 0.0001) (). We also observed that patients with high TSPAN1 levels showed higher ratio of perineural invasion (PNI), which is one of the hallmarks of advanced pancreatic cancer and predicts its development and unfavorable prognosis [Citation31]. Kaplan-Meier results revealed that patients with higher TSPAN1 expression levels were associated with poorer overall survival (OS) (). These results indicated that TSPAN1 is upregulated in pancreatic cancer and is closely related to its poor prognosis.
Figure 1. TSPAN1 is upregulated and TSPAN1 depletion decreases cell proliferation in human pancreatic cancer. (A) Representative immunohistochemical images of TSPAN1 expression in human pancreatic cancer tissues and normal pancreatic tissues and the quantification of TSPAN1 intensity. (B) Quantification of TSPAN1 expression in different stages of pancreatic cancer and normal pancreatic tissue samples. (C) Relative protein levels of TSPAN1 and LC3 in human normal pancreatic duct epithelial HPD E6-C7 cells and human pancreatic cancer PANC-1, ASPC-1, MIA-PACA-2, CAPAN-1 and SW1990 cells. (D) Kaplan-Meier overall survival curves for TSPAN1 in pancreatic cancer patients. (E and F) MTT assays were performed to examine the effect of TSPAN1 small interfering RNAs (#1, targeting CDS and #2, targeting 3ʹUTR) on cell viability. (G-I) DNA synthesis ability of the cells transfected with or without TSPAN1 siRNAs were assessed by EdU assays. (J and K) Colony formation assays were performed to assess the proliferation of cells transfected with or without TSPAN1 siRNAs. (L) Excised tumors in different groups were shown. (M) Growth curves showing the changes in the tumor volume in mice in different groups every 5 d from the injection. (N) Weight of the excised tumors in each group. (O) Representative H&E staining images and immunohistochemical images of MKI67 in excised tumors tissues. Data were represented as mean ± SD, *P < 0.05; **P < 0.01; ***P < 0.001
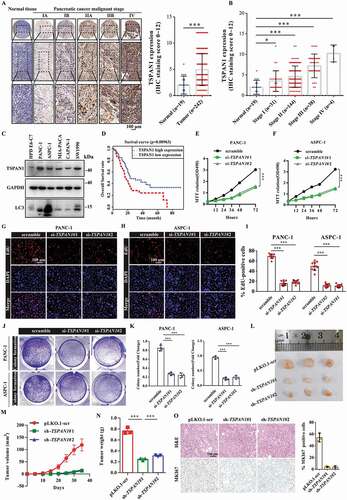
Table 1. Clinicopathologic characteristics of pancreatic cancer patients with different TSPAN1 expression
To confirm the biological role of TSPAN1 in pancreatic cancer proliferation, we first investigated the growth of the pancreatic cancer cells after TSPAN1 small interfering RNA (siRNA) transfection using 3-[4,5-dime-thylthiazol-2-yl]-2,5 diphenyl tetrazolium bromide (MTT) assays. The results showed that TSPAN1 depletion significantly inhibited the growth of PANC-1 and ASPC-1 cells ( and S1D). Subsequently, a 5-ethynyl-20-deoxyuridine (EdU) incorporation assay was performed to assess the changes in DNA synthesis in PANC-1 and ASPC-1 cells transfected with TSPAN1 siRNAs. The results revealed that TSPAN1 depletion led to a significant reduction in DNA synthesis compared with that observed in the control cells (). Consistently, TSPAN1 depletion attenuated PANC-1 and ASPC-1 cells colony formation activities (). Moreover, we assessed the effects of TSPAN1 overexpression in normal pancreatic duct epithelial HPD E6-C7 cells, and the results indicated that TSPAN1 overexpression significantly increased the number of EdU-positive cells compared to that observed for cells transfected with an empty vector (Fig. S1E). Furthermore, we also observed that TSPAN1 overexpression enhanced the colony formation of HPD E6-C7 cells (Fig. S1F).
To further evaluate the role of TSPAN1 in pancreatic cancer development in vivo, tumor xenograft models were constructed by subcutaneously injecting PANC-1 cells stably overexpressing TSPAN1 shRNAs into nude mice. We found that the proliferation rate of the xenograft tumors was significantly lower than that of the control xenograft tumors (). Moreover, prominently lower tumor volumes and weights were observed in TSPAN1-depleted xenograft tumors (), and TSPAN1 depletion also contributed to the downregulation of MKI67 in xenograft tumor tissues (). Taken together, these data indicate that TSPAN1 depletion decreases pancreatic cancer cell proliferation.
TSPAN1 depletion impairs autophagy flux in vitro and in vivo
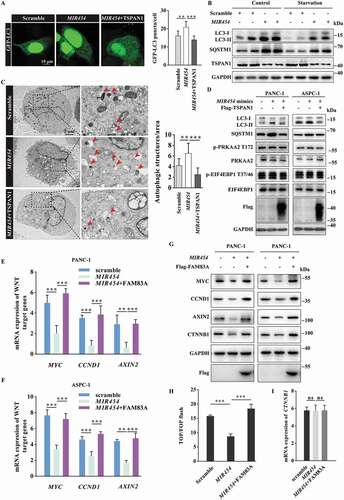
Pancreatic cancer was previously reported to have a distinct dependence on autophagy for eliminating reactive oxygen species, DNA damage, and sustaining oxidative phosphorylation. Through a gene set enrichment analysis (GSEA) using the TCGA database of pancreatic cancer, we found that many genes correlated with metabolism and degradation were enriched in the group expressing high levels of TSPAN1 (Fig. S2A-E), suggesting a metabolic function of TSPAN1 in pancreatic cancer development. Moreover, we noticed that the genes involved in autophagy were also co-expressed with TSPAN1 (). Pancreatic cancer cells with high TSPAN1 expression levels showed increased autophagy activity compared with normal pancreatic duct epithelial cells, as indicated by the conversion of LC3-II, a widely used marker of autophagosomes [Citation32] (). Next, we assessed the role of TSPAN1 in autophagy. We first transfected GFP-LC3 into ASPC-1 cells and analyzed the formation of autophagosomes as indicated by GFP-LC3 puncta after TSPAN1 knockdown. The results revealed that TSPAN1 depletion significantly increased the formation of GFP-LC3 puncta under both nutrient-rich and Earle’s balanced salt solution (EBSS) starvation conditions (). We also found that LC3-II levels were significantly increased in TSPAN1-depleted ASPC-1 cells under either nutrient-rich or starvation conditions (). As increased LC3 levels could have resulted from either induction of autophagy or a block in the turnover of LC3-bound autophagosomes, we examined the levels of SQSTM1 protein to distinguish between these possibilities, which is a widely used marker for autophagy flux since it is recruited by LC3 into the autophagosomes and eventually degraded in lysosomes. The results indicated that TSPAN1 depletion also increased the level of SQSTM1 (). In addition, TSPAN1 overexpression significantly decreased both the levels of LC3-II and SQSTM1 under either nutrient-rich or starvation conditions (). We also observed significantly elevated numbers of autophagic vacuoles in TSPAN1 siRNA transfected PANC-1 cells through transmission electron microscopy observations (). Furthermore, we found that the levels of two reticulophagy markers, the tubular ER membrane protein REEP5 (receptor accessory protein 5) and the sheet ER membrane protein CKAP4 (cytoskeleton associated protein 4), remained unaltered after TSPAN1 depletion. We also found that TSPAN1 depletion had limited effects on the mitophagy markers, TOMM20 (translocase of outer mitochondrial membrane 20) and TIMM23 (translocase of inner mitochondrial membrane 23) (Fig. S2F).
Figure 2. TSPAN1 depletion impairs autophagy flux in vitro and in vivo. (A) Gene set enrichment analysis (GSEA) using the TCGA database revealed many genes that correlated with autophagy were enriched in pancreatic cancer patients with high TSPAN1 expression. (B and C) Representative confocal images of GFP-LC3 distribution in ASPC-1 cells transfected with TSPAN1 siRNAs. The number of LC3 puncta was quantified (n =10). Scale bars, 10 µm. (D) Western blotting analysis of LC3 and SQSTM1 in ASPC-1 cells transfected with TSPAN1 siRNA, with or without EBSS starvation. (E) The relative levels of SQSTM1 and LC3-II were normalized to GAPDH and quantified. (F) Western blotting analysis of LC3 and SQSTM1 in HEK293T cells transfected with TSPAN1 overexpression vector, with or without EBSS starvation. (G) The relative levels of SQSTM1 and LC3-II were normalized to GAPDH and quantified. (H and I) Representative images of autophagosomes or autolysosomes of the PANC-1 cells transfected with TSPAN1 siRNAs in nutrient-rich or EBSS starvation conditions. Both low- and high-power (zoom) images are displayed. Red arrows indicate autophagic structures. The puncta number of autophagic structures per area were quantified (n =10). (J and K) Representative confocal images of GFP-Lc3 puncta present in the indicated region from 4 dpf WT and tspan1 mutant larvae. The puncta number of Lc3 was quantified (n =10). (L) Level of Lc3 and SQSTM1 were detected in WT and tspan1 mutant embryos at 4 dpf. Protein samples were extracted from 4 dpf WT and tspan1 mutant larvae (>10 embryos/sample). Data were represented as mean ± SD, *P < 0.05; **P < 0.01; ***P < 0.001
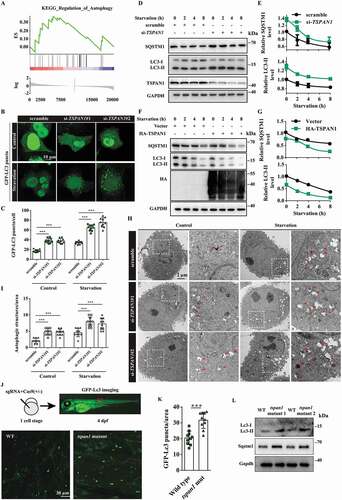
To assess the possible role of TSPAN1 in the regulation of autophagy in vivo, we used CRISPR-Cas9 genome editing technology to generate tspan1 mutant zebrafish embryos or larvae in the zebrafish line Tg (CMV: EGFP-Lc3) [Citation33]. The overall homology between human and zebrafish TSPAN1 is 46.3%. To generate tspan1 gene depletion or protein loss of function constructs, we designed two different short guide RNAs for target sites at the beginning of coding exons 2 of the tspan1 gene (ENSDARG00000052027), upstream of the exons encoding the function transmembrane domain region (Fig. S2G). A mixture of sgRNA and Cas9 protein was injected into zebrafish embryos at the one-cell stage, and the effect of CRISPR-Cas9 was verified by Sanger sequencing and qRT-PCR assays (Fig. S2H and S2I). We imaged GFP-Lc3 puncta signals in vivo in the trunk region of the zebrafish embryo and performed Lc3 western blotting analyses on whole embryo extracts at 4 d post-fertilization (dpf). The results indicated that tspan1 mutants exhibited significantly increased GFP-Lc3 puncta (). We also found that the Lc3-II protein level was elevated in the tspan1 mutant zebrafish, which is consistent with the GFP-Lc3 puncta results (). Furthermore, we also found that tspan1 mutations resulted in increased SQSTM1 levels (). These results indicated that TSPAN1 depletion impairs autophagy both in vitro and in vivo.
TSPAN1 interacts with LC3 through conserved LIRs and promotes autophagosome maturation
The observed phenotypes in TSPAN1-transfected cells indicated the probable role of TSPAN1 in enhancing the turnover of LC3-bound autophagosomes and the fusion of autophagosomes with lysosomes [Citation32]. To test this possibility, we first investigated the cellular distribution of TSPAN1, observing that mCherry-TSPAN1 colocalized with the late endosome marker GFP-RAB7A and the lysosome maker GFP-LAMP1, indicating that TSPAN1 localized in lysosomes, consistent with the results of a previous report [Citation34]. We also found that some TSPAN1 localized in the cell membrane (). Furthermore, we found the co-localization between GFP-TSPAN1 and mCherry-LAMP1 almost disappeared when we fused green fluorescent protein to the N-terminals of TSPAN1 and the distribution of TSPAN1 was different with mCherry fused TSPAN1 (). Due to mCherry fluorescence being more stable than GFP fluorescence in acidic environments, the result indicated that the N-terminals of TSPAN1 was included in the lumen of lysosomes, as shown in . Because LC3 is indispensable for autophagosome formation, membrane tethering, and hemifusion [Citation35], we subsequently investigated whether TSPAN1 could interact with LC3. To this end, a co-immunoprecipitation assay was performed using lysates of cells transfected with HA-TSPAN1 and GFP-mRFP-LC3, and the result showed that GFP-mRFP-LC3 was present in the immunoprecipitate of HA-TSPAN1 (Fig. S3A). LC3 interactors have been reported to typically contain an LC3-interacting region (LIR) with the consensus sequence W/F/Y-X-X-L/I/V that tightly fits into two conserved hydrophobic pockets on LC3 that are collectively termed the LIR docking site (LDS) [Citation36,Citation37]. Thus, we subsequently examined whether TSPAN1 interacts with LC3 using an LIR-LDS interface, and the results showed that the interaction between TSPAN1 and LC3 was abolished when the LDS was mutated (F52A/L53A for LC3B) (). We also identified three potential LIRs in the TSPAN1 protein upon sequence analysis, which we named LIR1 (amino acids [aa] 43-46), LIR2 (aa 117-120) and LIR3 (aa 201-204) (). To determine which of the putative LIRs (LIR1, LIR2 and LIR3) were responsible for the observed binding, we mutated each LIR sequence by replacing the tryptophan or phenylalanine residue in the motif with an alanine residue (M1, M2 and M3). The results showed that mutation of the LIR2 and LIR3 sequences almost abolished, mutation of LIR1 decreased the interaction between TSPAN1 and LC3 (). In addition, we found the interaction between TSPAN1 and LC3 was significantly increased after we treated the cells with chloroquine (CQ), an inhibitor of autophagic flux that prevents autophagosome-lysosome fusion and lysosomal protein degradation (). We further assessed the effects of the three LIR mutants of TSPAN1 on autophagy flux, and the results indicated that the LIR2 and LIR3 mutants lost the ability to increase the level of LC3-II and SQSTM1 compared with wild-type TSPAN1 ( and S3B).
Figure 3. TSPAN1 interacts with LC3 through conserved LIRs and promotes autophagosome maturation. (A) Co-localization between GFP-LAMP1, GFP-RAB7A and mCherry-TSPAN1 in HeLa cells. (B) Co-localization between GFP-TSPAN1 and mCherry-LAMP1 in HeLa cells. (C) Schematic illustration of TSPAN1 protein and the LIR motifs of TSPAN1 protein localized in the lysosome membrane. (D) Sequences alignment of the predicted LIR motifs and its mutations in the TSPAN1 protein. “M” represents mutation. (E) The interaction between TSPAN1 and wild-type or F52A/L53A mutant LC3. (F) The interaction between LC3 and TSPAN1 was abolished by replacing the phenylalanine and leucine with alanine residues in LIR2 or LIR3. (G) The interaction between LC3 and TSPAN1 was enhanced by CQ (10 μM) treatment. (H) Western blotting analysis of LC3 and SQSTM1 in HEK293T cells transfected with TSPAN1 and its mutants with or without CQ (10 μM) treatment. (I and J) Representative confocal microscopy images of the red-only puncta and the yellow puncta in ASPC-1 cells after co-transfection with TSPAN1 siRNA#2 (targeting the 3ʹUTR of TSPAN1 mRNA) with or without the wild-type TSPAN1 or TSPAN1 M2/3 mutant under nutrient-rich and EBSS starvation conditions. The numbers of the red-only puncta and yellow puncta were quantified (n=10). Scale bars, 10 µm. (K) Excised tumors in different groups were shown. (L) Weights of the excised tumors in each group. (M) Growth curve showing the changes in the tumor volume in mice in different groups every 5 d from the injection. Data were represented as mean ± SD, *P < 0.05; **P < 0.01; ***P < 0.001
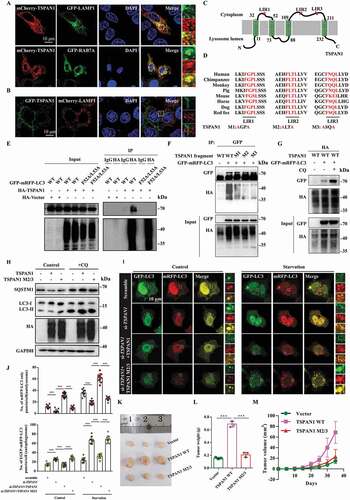
To investigate whether TSPAN1 affects autophagosome maturation, we performed confocal imaging using the tandem reporter GFP-mRFP-LC3. In this system, the appearance of red puncta indicates autolysosomes, and the yellow puncta (owing to merged green and red signals) represents autophagosomes [Citation38]. The results revealed that TSPAN1 depletion reduced the number of red-only LC3 puncta and increased the number of yellow LC3 puncta in ASPC-1 cells under either nutrient-rich or starvation conditions, while TSPAN1 co-transfection reversed the effect of TSPAN1 knockdown (targeting the TSPAN1 3ʹUTR). Moreover, co-transfection with TSPAN1 LIR2 and LIR3 mutants had little effect on the number of red-only or yellow LC3 puncta (). These data indicated that TSPAN1 interacts with LC3 through conserved LIRs and promotes autophagosome maturation.
We further determined whether TSPAN1 promotes pancreatic cancer in an autophagy-dependent manner. To this end, tumor xenograft models were constructed by subcutaneously injecting PANC-1 cells with stable overexpression of wild-type or LIR mutant (M2/3) TSPAN1 into nude mice (Fig. S3C). We found that the proliferation rate of the xenograft tumors with TSPAN1 overexpression was significantly increased; however, little effect was observed in TSPAN1 LIR mutant overexpressed xenograft tumors (). We also found a lower level of SQSTM1 in xenograft tumors with stable WT TSPAN1 expression compared with tumors with the control empty vector or TSPAN1 M2/3 (Fig. S3D). Furthermore, we investigated the effects of TSPAN1 and the TSPAN1 M2/3 mutant on normal pancreatic duct epithelial HPD E6-C7 cell proliferation through EdU incorporation and MTT assays in ATG7-depleted backgrounds. The results were similar to those observed in the tumor xenograft models. However, the effects of TSPAN1 on HPD E6-C7 cell proliferation were significantly inhibited (Fig. S3E-H). These data indicated that TSPAN1 promotes pancreatic cancer cell proliferation in an autophagy-dependent manner.
TSPAN1 is upregulated by the canonical WNT-CTNNB1 signaling pathway and correlated with FAM83A in human pancreatic cancer
WNT-CTNNB1 and autophagy are two of the most activated signaling pathway in pancreatic cancer [Citation9,Citation39]. Surprisingly, we found there were four probable TCF/LEF binding elements (TBE1-4), which highly matched the SCTTTGWWS motif [Citation40] on the 2-kb 5ʹ-promoter region of TSPAN1 (). Therefore, we subsequently assessed whether TSPAN1 could be upregulated by the canonical WNT-CTNNB1 signaling pathway. As expected, we found that both the protein and mRNA levels of TSPAN1 were increased after treatment with WNT3A (), or LiCl, another WNT-CTNNB1 agonist through inhibition of the activation of GSK3B (glycogen synthase kinase 3 beta) and the degradation of CTNNB1 in HEK293T cells (Fig. S4A and S4B). We also found that the expression level of TSPAN1 was increased in PANC-1 cells treated with WNT3A in time- and dose-dependent manners ( and S4C). To further confirm the mechanism by which WNT-CTNNB1 increased the mRNA level of TSPAN1, a series of luciferase report plasmids carrying wild-type or mutant TSPAN1 promoter regions (TBE1-4) were generated. As shown in , after transfection with the luciferase report plasmids in 293T cells, we found that TBE2 or TBE3 deletion significantly reduced the reporter luciferase activity, whereas no effect was observed after TBE1 or TBE4 deletion. Furthermore, the deletion of both TBE2 and TBE3 completely abolished the reporter luciferase activity. Additionally, the reduction of the luciferase activity between the wild-type and TBE2 or TBE3 deletion constructs was much more robust after treatment with LiCl. ChIP experiments were subsequently conducted, and the results demonstrated that the CTNNB1-TCF4 transcription complex was bound with the TSPAN1 promoter, especially with TBE2 and TBE3 (). These results indicated that TSPAN1 is a direct target of the WNT-CTNNB1 signaling pathway.
Figure 4. TSPAN1 is upregulated by the canonical WNT-CTNNB1 signaling pathway and correlated with FAM83A in human pancreatic cancer. (A) Schematic diagram of the TCF/LEF binding element (TBE1-4) in the promoter region of TSPAN1. (B and C) The protein and mRNA levels of TSPAN1 after treatment with WNT3A (100 ng/ml) for 0, 2, 4, 6, 8 h in 293T cells indicated by western blotting and q-RT PCR assays. (D) The protein level of TSPAN1 after treatment with WNT3A for indicated time in PANC-1 cells were analyzed by western blotting assay. (E) Schematic diagram of the generated luciferase report plasmids and the relative luciferase activity after transfection with the plasmids in 293T cells with or without LiCl (50 mM) treatment. (F) A ChIP experiment was used to detect binding between the CTNNB1-TCF4 complex and the predicted TCF/LEF binding element in the TSPAN1 promoter. The promoter of MYC was used as a positive control. (G and H) The protein and mRNA levels of TSPAN1 after FAM83A siRNA transfection in ASPC-1 cells with or without WNT3A treatment. (I) The correlation between mRNA expression of TSPAN1 and FAM83A in the TCGA database. (J) Representative IHC images of TSPAN1 and FAM83A in 44 human pancreatic cancer patient tissues. (K and L) The correlation between the level of FAM83A, CTNNB1 and TSPAN1 in 44 human pancreatic cancer patient tissues
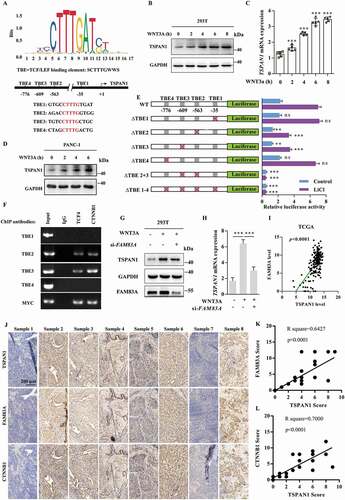
We then asked whether TSPAN1 correlated with WNT-CTNNB1 signaling pathway in pancreatic cancer progression. Through generation of the expression profile of genes in pancreatic cancer tissues (Fig. S4D), We found FAM83A, which was previously reported to be associated with poorer overall survival and disease-free survival in pancreatic cancer by activating WNT-CTNNB1 signaling pathway [Citation30], was among the top 10 upregulated genes in pancreatic cancer (Fig. S4E). Moreover, both TSPAN1 and FAM83A were significantly enriched in cell proliferation biological processes resulting from a DAVID ontology enrichment search (http://david.abcc.ncifcrf.gov/) (Fig. S4F). We also found that patients exhibiting abnormal expression of FAM83A showed an adverse clinical outcome (Fig. S4G). Furthermore, we noted that FAM83A could actually decrease both the protein and mRNA levels of TSPAN1 after WNT3A treatment (). Additionally, from the mRNA analysis of the TCGA and GEO database, we found that the level of TSPAN1 was positively correlated with FAM83A (, S4H-J). The positive correlation between the protein level of TSPAN1 and FAM83A was confirmed in 44 pancreatic cancer patient tissues (). Collectively, these data indicated TSPAN1 is upregulated by the canonical WNT-CTNNB1 signaling pathway and correlated with FAM83A in human pancreatic cancer.
MIR454 directly targets TSPAN1 and FAM83A
Since the reported regulatory feedback mechanism between WNT-CTNNB1 and autophagy was almost negative [Citation14], it appeared that there could be another distinct mechanism in pancreatic cancer that maintains both the high activity of WNT-CTNNB1 and autophagy. miRNAs regulate gene expression post-transcriptionally and play important roles in cancer development [Citation41,Citation42]. Therefore, we subsequently assessed whether miRNA(s) could link both the WNT-CTNNB1 and autophagy in pancreatic cancer. To this end, we investigated the miRNA expression profile of pancreatic cancer using the TCGA database. We identified 55 miRNAs that were differentially expressed, comprising 6 upregulated and 49 downregulated miRNAs, in the pancreatic cancer patients (fold-change > 1.5 and p < 0.05) (). We identified 3 miRNAs (MIR454, MIR206 and MIR197) as potential regulators of both TSPAN1 and FAM83A using 2 screening algorithms (Fig. S5A and S5B). Among these miRNAs, we found that low MIR454 expression showed poor overall survival of the pancreatic cancer patients in Kaplan-Meier analysis, whereas MIR206 and MIR197 showed negative correlations (, S5C and S5D). Furthermore, MIR454 levels were inversely correlated with the levels of TSPAN1 and FAM83A (), and we also verified that the expression of MIR454 was lower in pancreatic cancer cells compared with normal pancreatic duct epithelial cells ().
Figure 5. MIR454 directly targets TSPAN1 and FAM83A. (A) Clustered heatmap of differentially expressed miRNAs. Each column indicates a tissue sample and each row indicates an individual gene. Red and green strips represent high and low miRNA expression, respectively. (B) Kaplan-Meier overall survival curves for MIR454 in pancreatic cancer patients. (C and D) MIR454 levels were inversely correlated with the levels of TSPAN1 (C) and FAM83A (D). (E) The relative mRNA level of MIR454 was detected in human normal pancreatic duct epithelial HPD E6-C7 cells and human pancreatic cancer PANC-1, ASPC-1, MIA-PACA-2, CAPAN-1 and SW1990 cells. (F) Relative mRNA levels of TSPAN1 and FAM83A after transfected with miR control, MIR454 mimics, inhibitor control and MIR454 inhibitor in PANC-1 cells. (G) Relative protein levels of TSPAN1 and FAM83A after transfected with miR control, MIR454 mimics, inhibitor control and MIR454 inhibitor in PANC-1 and ASPC-1 cells. (H) Schematic illustration of predicted miRNA binding sites within the 3′-UTR of TSPAN1 mRNA (position 150 to 157) and generation of the WT-TSPAN1 3′UTR and MT-TSPAN1 3′UTR luciferase reporter vectors. (I) Schematic illustration of predicted miRNA binding sites within the 3′-UTR of FAM83A mRNA (position 2008 to 2014), and generation of the WT-FAM83A 3ʹUTR and MT-FAM83A 3ʹUTR luciferase reporter vectors. (J) Luciferase activity was measured in lysates of HEK293T cells transfected with the wild-type 3′-UTR and mutant 3′-UTR of TSPAN1 luciferase constructs and a MIR454 mimic or a scrambled miRNA control. The luciferase activity was normalized to renilla luciferase activity. (K) Luciferase activity was measured in lysates of HEK293T cells transfected with the wild-type 3′-UTR and mutant 3′-UTR of FAM83A luciferase constructs and a MIR454 mimic or a scrambled miRNA control. The luciferase activity was normalized to renilla luciferase activity. Data were represented as mean ± SD, *P < 0.05; **P < 0.01; ***P < 0.001
To investigate whether TSPAN1 and FAM83A are targeted by MIR454, we assessed the mRNA levels of TSPAN1 and FAM83A after transfecting two pancreatic cancer cell lines, PANC-1 and ASPC-1, with MIR454 mimics and inhibitors. We found that the mRNA levels of TSPAN1 and FAM83A were both decreased in cells transfected with MIR454 mimics and increased in cells transfected with MIR454 inhibitors (, S5E and S5F). The inhibitory effect of MIR454 on the protein levels of TSPAN1 and FAM83A was also confirmed by western blotting analysis of the two cell lines (). To further confirm whether the effect of MIR454 on TSPAN1 and FAM83A was specific, we performed bioinformatics analysis and identified putative binding sites for MIR454 within the 3′UTRs of the human TSPAN1 and FAM83A mRNAs (). Furthermore, we performed a luciferase activity assay using a luciferase expression vector containing the 3′UTR segments of TSPAN1 and FAM83A along with the putative MIR454 binding sites. The results showed that the activity of the luciferase reporter vectors carrying the TSPAN1 and FAM83A 3′UTR-WT sequences could be significantly decreased by MIR454 mimics compared with the control groups, whereas mutating the putative MIR454 binding sites completely eliminated these inhibitory effects (). To investigate whether there is a feedback mechanism between TSPAN1-FAM83A and MIR454, we assessed the expression level of MIR454 after TSPAN1 or FAM83A depletion. However, the data showed that TSPAN1 or FAM83A depletion had no effect on MIR454 expression (Fig. S5G). Taken together, these data indicated that TSPAN1 and FAM83A are direct targets of MIR454.
MIR454 attenuates autophagy flux by targeting TSPAN1 and functions independently of the AMPK and MTOR pathways
To confirm the role of MIR454 in autophagy, we analyzed the formation of autophagosomes, as indicated by the formation of GFP-LC3 puncta, the levels of LC3-II and SQSTM1 in western blotting assays and the number of the autophagic vacuoles in cells using transmission electron microscopy assays. The results revealed that MIR454 overexpression significantly increased the formation of GFP-LC3 puncta, while overexpression of TSPAN1 reversed the effect of MIR454 (). We also found that both the LC3-II and SQSTM1 levels were significantly increased in MIR454-transfected ASPC-1 cells under basal conditions. Moreover, the elevated LC3-II and SQSTM1 levels were observed under serum starvation and the lysosome blocker CQ treatment conditions ( and S6A). In addition, we also observed significantly elevated numbers of autophagic vacuoles in MIR454-transfected PANC-1 cells and recovered autophagic vacuoles in TSPAN1 co-transfected cells through transmission electron microscopy observations (). We further investigated whether the MIR454-TSPAN1 axis has any effect on AMPK activity, which is known to stimulate autophagy by directly phosphorylating ULK1 and BECN1 [Citation6,Citation43]. The results revealed that the MIR454-TSPAN1 axis did not affect the activity of AMPK, as indicated by the unaltered level of phosphorylated PRKAA2/AMPKα2 at threonine 172 (). MTOR activity is known to inhibit autophagy through phosphorylation at serine residues 367 and 757 in ULK1 and ATG13, respectively [Citation5,Citation6]. Our data showed that neither MIR454 mimics nor MIR454 inhibitor altered the level of phosphorylated EIF4EBP1, which is the downstream effector protein of MTORC1. Moreover, there were consistently elevated LC3-II and SQSTM1 levels in MIR454 mimics-transfected cells and decreased LC3-II and SQSTM1 levels in MIR454 inhibitor-transfected cells in the presence of torin1, an inhibitor of MTORC1 (Fig. S6B and S6C). We also checked the effect of the MIR454-TSPAN1 axis on MTOR activity and found that MIR454 and TSPAN1 overexpression had no effect on MTOR activity as well (). Taken together, these findings showed that MIR454 inhibits autophagy flux through targeting TSPAN1 and functions independently of the AMPK and MTOR pathways.
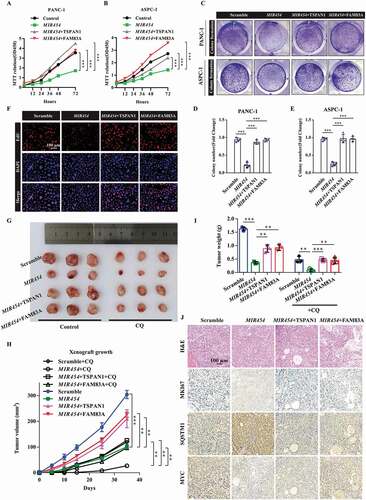
Figure 6. Role of MIR454 in regulating autophagy flux and the WNT-CTNNB1 signaling pathway. (A) Representative confocal images of GFP-LC3 distribution in ASPC-1 cells transfected with MIR454 mimics and the TSPAN1 expression vector. The puncta number of LC3 was quantified (n =10). Scale bars, 10 µm. (B) Western blotting analysis of LC3 and SQSTM1 in ASPC-1 cells transfected with MIR454 mimics with or without EBSS starvation. (C) Representative transmission electron microscope images of autophagosomes or autolysosomes of the PANC-1 cells transfected with MIR454 mimics and TSPAN1 expression vector. Both low- and high-power (zoom) images are displayed. Red arrows indicate autophagic structures. The puncta number of autophagic structures per area were quantified (n =10). (D) Western blotting analysis of PANC-1 and ASPC-1 cells transfected with MIR454 mimics and TSPAN1 expression vector using the indicated antibodies. (E and F) Relative mRNA levels of the WNT-CTNNB1 target genes CCND1, MYC and AXIN2 after transfection with miR control, MIR454 mimic and MIR454 inhibitor in PANC-1 (E) and ASPC-1 (F) cells. (G) Relative protein levels of CCND1, MYC, AXIN2 and CTNNB1 in PANC-1 and ASPC-1 cells transfected with miR control, MIR454 mimic and MIR454 inhibitor. (H) Effects of MIR454 and FAM83A overexpression on TOP/FOP flash luciferase activity in human pancreatic cancer ASPC-1 cells. (I) MIR454 and FAM83A overexpression had no effect on CTNNB1 mRNA expression in human pancreatic cancer ASPC-1 cells. The quantification data were showed as mean ± SD, **P< 0.01, ***P< 0.001
MIR454 inhibits the WNT-CTNNB1 pathway by targeting FAM83A
We next tested whether MIR454 had an opposite effect on the WNT-CTNNB1 pathway. The results showed that MIR454 reduced the mRNA levels of CCND1, MYC and AXIN2, which are target genes of the WNT-CTNNB1 pathway, while overexpression of FAM83A recovered the mRNA levels of these WNT target genes in PANC-1 and ASPC-1 cells (). The western blotting assay showed that the protein levels of WNT target genes were also reduced after MIR454 overexpression and reversed by FAM83A (). Moreover, we found that the TOP flash activity, which dictates the CTNNB1 pathway transcriptional activity, was significantly decreased in MIR454-transfected ASPC-1 cells and recovered by FAM83A overexpression (). Furthermore, we also noticed that MIR454 could reduce the protein level of CTNNB1 without altering its mRNA level, and FAM83A overexpression also had no effect on CTNNB1 mRNA levels (), suggesting that FAM83A upregulates CTNNB1 expression at the translation level. Taken together, these data revealed that MIR454 inhibits the WNT-CTNNB1 pathway by targeting FAM83A.
Role of the MIR454-FAM83A-TSPAN1 axis in pancreatic cancer cell proliferation in vitro and in vivo
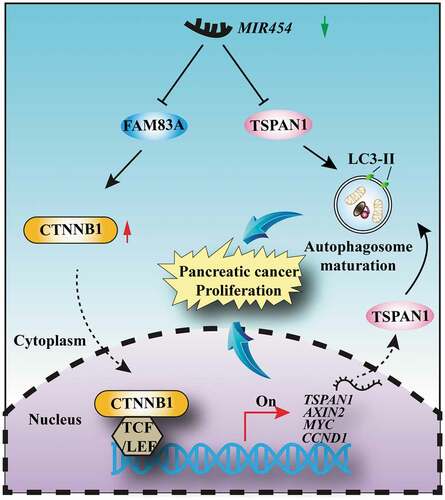
To confirm the biological role of the MIR454-FAM83A-TSPAN1 axis in pancreatic cancer proliferation, we first examined the growth and colony formation of pancreatic cancer PANC-1 and ASPC-1 cells transfected with MIR454 mimics and/or TSPAN1 or FAM83A expression vectors. The results showed that TSPAN1 and FAM83A overexpression could recover the inhibited proliferation ability and colony formation activity induced by MIR454 mimics in both PANC-1 and ASPC-1 cells (). Moreover, we investigated the expression of the cell proliferation protein MKI67, which is widely used as a proliferation indicator in pancreatic cancer cells. The western blotting assay revealed that MIR454 expression decreased MKI67 expression level in both PANC-1 and ASPC-1 cells, whereas TSPAN1 or FAM83A expression increased MKI67 expression levels (Fig. S7A). Furthermore, EdU incorporation assays were performed, and the results revealed that MIR454 expression led to a significant reduction in DNA synthesis compared with that observed in control cells, while TSPAN1 or FAM83A overexpression increased DNA synthesis ( and S9C). Furthermore, TSPAN1 expression promoted the recovery of the DNA synthesis activity induced by FAM83A depletion, whereas MIR454 expression produced aggravating effects (Fig. S7B and S7C). In addition, TUNEL assays were performed and showed that MIR454 expression markedly elevated the number of TUNEL-positive apoptotic cells, which was decreased after TSPAN1 or FAM83A expression compared with the control group (Fig. S7D). Taken together, these data indicated that MIR454 overexpression suppresses pancreatic cancer cell proliferation by targeting TSPAN1 and FAM83A.
Figure 7. Role of the MIR454-FAM83A-TSPAN1 axis in pancreatic cancer cell proliferation in vitro and in vivo. (A and B) MTT assays were performed to examine the effect of MIR454, TSPAN1 and FAM83A overexpression on cell viability. (C-E) Colony formation assays were performed to assess the proliferation of cells transfected with MIR454, TSPAN1 and FAM83A overexpression vectors. (F) DNA synthesis in the cells transfected with MIR454, TSPAN1, FAM83A overexpression vectors were assessed by EdU assays. (G) Representative images of excised tumors in different groups of nude mice were shown. (H) Growth curve showing the changes in the tumor volume in mice in different groups from the injection. (I) Weight of the excised tumors in each group. (J) Representative H&E staining images and immunohistochemical images of MKI67, SQSTM1 and MYC expression in excised tumors tissues. The quantification data were showed as mean ± SD, **P< 0.01, ***P< 0.001
To further elucidate the role of the MIR454-FAM83A-TSPAN1 axis in pancreatic cancer development in vivo, we used tumor xenograft models by subcutaneously injecting nude mice with PANC-1 cells stably overexpressing MIR454 alone or co-overexpressing TSPAN1 or FAM83A treated with or without autophagy inhibitor CQ. The results showed that the proliferation rate of MIR454-overexpressing xenograft tumors was significantly lower than that of the negative control xenograft tumors (). Lower tumor volumes and weights were also observed in MIR454-overexpressing xenograft tumors (). Moreover, the forced expression of TSPAN1 and FAM83A caused an inverse phenotype in xenograft mice (). In addition, CQ treatment decreased the effects of MIR454-FAM83A-TSPAN1 in the ability of xenograft tumor formation (). Furthermore, the levels of MKI67 and MYC staining were observed to be decreased in MIR454-overexpressing xenograft tumor tissues, while that of SQSTM1 was increased (). Taken together, these data revealed that MIR454 decreased and TSPAN1 or FAM83A overexpression recovered the proliferative potential of pancreatic cancer cells.
Discussion
The TSPAN1 gene is located on chromosome 1p34.1 and encodes a 26 kDa protein. However, the observed molecular weights of wild-type TSPAN1 proteins expressed in ovarian carcinoma cells were observed to be higher than the calculated values due to the N-glycosylation [Citation34]. Consistently, we also confirmed the band shift of TSPAN1 in pancreatic cancer cells. The results of recent research studies on TSPAN1 have focused on its ability to promote proliferation and migration in cancers. However, the mechanism underlying the activities of TSPAN1 are not well understood.
In this study, for the first time, we discovered that TSPAN1 is a novel positive regulator of autophagy maturation in vitro and in vivo. Furthermore, we discovered that TSPAN1 promotes autophagosome maturation and interacts with LC3 through conserved LIRs. Alignment of the LIRs with sequences of the TMSF4 superfamily (data not shown) showed that the LC3-binding site LIRs are unique in the TSPAN1 protein compared with other members of the TMSF4 superfamily across mammalian species, suggesting that their role in the regulation of autophagy may be conserved only in TSPAN1. Dysfunction of autophagy has been discovered linking to the progression of various human cancers, either enhancing or preventing tumorigenesis depending on the tumor type or context [Citation44–46]. Autophagy is activated in rapidly growing tumors in regions of hypoxia and/or nutrient deprivation, such as pancreatic cancer, which requires autophagy for tumor growth [Citation9,Citation47]. In this context, genetic or pharmacological inhibition of autophagy could lead to increased reactive oxygen species, elevated DNA damage, and metabolic defects leading to the regulation of cell proliferation retardation or cell death [Citation48]. Autophagy also plays essential roles in the survival of many cancer patients in cases of therapies stress, such as that caused by chemotherapy, radiotherapy, and targeted agents, thereby promoting therapeutic resistance [Citation49,Citation50]. In the present study, our data showed that TSPAN1F117A,L120A and TSPAN1F201A,L204A (M2/3) mutations, which resulted in defective autophagy activity, showed little effect on pancreatic cancer growth in vivo compared with that observed in cells harboring wild-type TSPAN1, indicating that the tumor-promoting role of TSPAN1 occurs primarily through autophagy. We also demonstrated that the ‘autophagy-addicted’ PDAC cell lines PANC-1 and ASPC-1 require a high level of TSPAN1 to maintain high basal levels of autophagy, rapid proliferation and sustained growth without suppressing MTORC1, which controls protein synthesis and gene transcription, proliferation, and motility [Citation51]. These results can also explain the seemingly contradictory co-existence of intact MTORC1 function and strong autophagy activity in pancreatic cancer and other cancers. The subcellular localization data showed that the TSPAN1-mCherry fusion protein was localized in LAMP1-positive and RAB7A-positive intracellular vesicles, indicating an essential role of TSPAN1 in endosome-mediated biological activity.
Through the genome-wide expression analysis of the TCGA database of pancreatic cancer patient tissues, we identified TSPAN1 and FAM83A, which are both upregulated in pancreatic cancer patients, were direct targets of MIR454. The dysregulation of MIR454 has been reported to be implicated in several disorders, including lung injury, diastolic dysfunction and brain developmental remodeling [Citation52,Citation53]. In cancer, high or low MIR454 expression has been observed in lung, gastric, prostate, colorectal and hepatocellular cancer, as well as in melanoma [Citation54–56]. These results indicate that MIR454 has different roles in different types of tumors. Consistent with other previous findings, our data also showed that the proliferation of pancreatic cancer cells was markedly inhibited by MIR454 [Citation25,Citation30]. Additionally, the inhibitory effect of MIR454 on pancreatic cancer cells could be reversed by either TSPAN1 or FAM83A restoration. Consistently, we noted that MIR454 could significantly reduce the expression of WNT target genes, such as CCND1, MYC and AXIN2. We also found that the inhibitory effect of MIR454 could be reversed by the co-expression of FAM83A, indicating that the MIR454-TSPAN1 and MIR454-FAM83A axes cooperate and function in the proliferation of pancreatic cancer cells. MIR454 was reported to play roles in cell cycle and cell apoptosis regulation thus affect the ability of cell proliferation [Citation57], however, our data showed that the proliferation of MIR454-overexpressed xenograft tumor was significantly enhanced by autophagy inducer rapamycin. Indicating that MIR454 promotes pancreatic cancer proliferation also through increasing autophagy activity. Furthermore, we noticed that FAM83A downregulated the protein level of CTNNB1, but had no effect on CTNNB1 mRNA levels, suggesting that FAM83A upregulates CTNNB1 expression at the translational level. As previously reported, FAM83 proteins interacted with CK1 isoforms through the conserved domain of unknown function 1669 (DUF1669) [Citation58], and FAM83A interacted with CSNK1A1/CK1α (casein kinase 1 alpha 1), a potent inhibitor of WNT signaling that primes CTNNB1 phosphorylation and subsequent degradation [Citation59]. These results suggest the possibility that FAM83A functions in the CTNNB1 destruction complex, which consists of GSK3B, CSNK1A1, APC, and AXIN1.
Crosstalk between autophagy and WNT-CTNNB1 signaling has been previously investigated. However, the reported regulatory feedback mechanism between WNT-CTNNB1 and autophagy was almost negative [Citation13–15]. For example, the WNT-CTNNB1 signaling pathway could suppress autophagosome formation and directly represses the transcription of SQSTM1 via TCF4 (transcription factor 4) [Citation13]. And components of WNT-CTNNB1 signaling could be selectively degraded via the formation of an LC3 or SQSTM1 binding complex during nutrient deprivation, such as CTNNB1 [Citation14] and Dishevelled (Dishevelled segment polarity proteins) [Citation60]. However, our data showed that there were two conservative TCF/LEF binding elements in the promoter region of the TSPAN1 gene, and both the mRNA and protein levels of TSPAN1 could be increased under the treatment of WNT3A and LiCl. In summary, our data demonstrated a positive feedback loop between MIR454-FAM83A-TSPAN1 in regulating autophagy and the WNT-CTNNB1 signaling pathway: The mRNA level of TSPAN1 is upregulated by FAM83A through facilitating the CTNNB1-TCF4 complex recruitment to the promoter region of TSPAN1. Then, increased TSPAN1 promotes autophagy activity through binding to LC3 and mediates autophagy maturation. Combine the inhibitory effect of MIR454 toward TSPAN1 and FAM83A could be abrogated because of the downregulation of MIR454 in pancreatic cancer, we propose a model for the mechanism by which MIR454 regulates pancreatic cancer proliferation (). However, the molecular mechanism of reduced MIR454 in pancreatic cancer should be addressed in the future.
Figure 8. Schematic diagram of the biological role of the MIR454-TSPAN1-FAM83A axis in pancreatic cancer proliferation
Materials and methods
Cell lines, reagents, and antibodies
Human normal pancreatic duct epithelial cell line HPD E6-C7 was a gift from Dr. HaiMing Hu (Wuhan Institute of Virology, Chinese Academy of Sciences, China). Human pancreatic cancer cell lines PANC-1, ASPC-1 and MIA-PACA-2 were purchased from the cell center of Institute of Biochemistry and Cell Biology, Chinese Academy of Sciences (TCHu 98, TCHu 8 and SCSP-568). CAPAN-1 and SW1990 were purchased from Cobioer (Nanjing, CBP60543 and CBP60691). Autophagy inhibitor chloroquine diphosphate salt (CQ, 10 μM) was purchased from Sangon Biotech (Shanghai, A506569). EBSS (Hyclone, SH30024.01) starvation in this study was carried out to switch the culture medium from the complete medium to the EBSS medium unless described otherwise. Commercially available antibodies and dilutions used are as follows: anti-TSPAN1 (Proteintech, 16058-1-AP; 1:1000 dilution), anti-GAPDH (Proteintech, 60004-1-Ig; 1:1000 dilution), anti-LC3 (Cell Signaling Technology, 4108; 1:1000 dilution), anti-mouse HA (EMD Millipore, M180-3; 1:1000 dilution), anti-Rabbit HA (Proteintech, 51064-2-AP; 1:1000 dilution), anti-GFP (EMD Millipore, 598; 1:1000 dilution), anti-REEP5 (Santa Cruz Biotechnology, sc-393508; 1:500 dilution), anti-CKAP4 (Santa Cruz Biotechnology, sc-393544; 1:500 dilution), anti-TOMM20 (Cell Signaling Technology, 42406; 1:3000 dilution), anti-TIMM23 (Santa Cruz Biotechnology, sc-514463; 1:1000 dilution), anti-p-PRKAA2-T172 (Cell Signaling Technology, 2535; 1:1000 dilution), anti-PRKAA2 (Proteintech, 18167-1-AP; 1:1000 dilution), anti-p-EIF4EBP1-T37/46 (Cell Signaling Technology, 2855; 1:1000 dilution), anti-EIF4EBP1 (Proteintech, 60246-1-Ig; 1:1000 dilution), anti-CTNNB1 (Proteintech, 51067-2-AP; 1:1000 dilution), anti-CCND1 (Proteintech, 60186-1-Ig; 1:1000 dilution), anti-MYC (Proteintech, 60178-1-Ig; 1:1000 dilution), anti-AXIN2 (Proteintech, 20540-1-AP; 1:1000 dilution), anti-MKI67 (BOSTER, BM4381; 1:1000 dilution), anti-FAM83A (Abclonal, A15201; 1:1000 dilution).
Plasmids construction, cell culture, siRNAs and transfection
DNA fragments encoding TSPAN1 and FAM83A amplified by PCR were gifts from prof. Jiahuai Han (Xiamen University). The PCR products of TSPAN1 and FAM83A were cloned into pcDNA3.0-3×HA (Miaolingbio, P9394) and pCMV-3×Flag (Sigma, E4401), respectively. The nucleotide sequences of all constructs were confirmed by DNA sequencing. ptfLC3 (Mammalian expression of rat LC3 fused to mRFP and GFP) was a gift from Tamotsu Yoshimori (Addgene, 21074). The sequence of MIR454 was 5′-ACCCUAUCAAUAUUGUCUCUGC-3′. Commercially synthesized 2ʹ-O-methyl-modified antisense oligonucleotide of MIR454 was used as a MIR454 inhibitor (anti-MIR454). Human normal pancreatic duct epithelial cells HPD E6-C7, human pancreatic cancer cells PANC-1, ASPC-1, MIA-PACA-2 were cultured in Dulbecco’s modified Eagle’s medium (DMEM; Hyclone, SH30022.01). Human pancreatic cancer cells CAPAN-1 were cultured in improved minimum essential medium (IMEM) (Gibco, A1048901) and SW1990 were cultured in Leibovitz’s L-15 medium (Gibco, 11415-064). All culture mediums were supplemented with 10% fetal bovine serum (Biological Industries, 04-001-1ACS), 100 U/ml penicillin G and 100 μg/ml (Biosharp, BL505A) streptomycin at 37°C in a humidified incubator containing 5% CO2. siRNA for TSPAN1#1 was 5ʹ-CCAGUCUAUUAAACCCUUGAU-3ʹ. siRNA for TSPAN1#2 was 5ʹ-CCUCUUCAAUUUGCUCAUCUU-3ʹ. siRNA for FAM83A was 5ʹ-GCACAACAACAUCAGAGACCU-3ʹ. Lipofectamine 2000 Transfection Reagent (Invitrogen, 11668019) was used to transfect the PANC-1 and ASPC-1 cell lines with the MIR454 mimics, inhibitors and siRNAs, and the expression vector of TSPAN1 or FAM83A was transfected using Lipofectamine 3000 (Invitrogen, L3000015) according to the manufacturer’s protocols.
Lentiviral production and creation of stable cell lines
MIR454 mimics or scramble RNA were subcloned into the lentiviral vector pLKO.1-puro (Sigma, 8453). DNA fragments encoding TSPAN1 or FAM83A were subcloned into the lentiviral vector pCDH-CMV-MCS-EF1-turboRFP-T2A-Neo, which was a gift from Dr. Xiaorong Zhang (Institute of Biophysics, Chinese Academy of Sciences, China). 5 μg lentiviral constructs were co-transfected with viral packaging plasmids 3 μg psPAX2 and 3 μg pMD2.G (also gifts from Dr. Xiaorong Zhang) into 293T cells in 10 cm dishes. At 8 h post-transfection, the medium was replaced with complete DMEM, and the viral supernatant was harvested at 48 h post-transfection and filtered through a 0.22 µm membrane. In addition, PANC-1 cells were plated in another 6 cm dish the day before the viral supernatant was harvested. After applying the viral supernatant to PANC-1 cells with 10 μg/μl of polybrene (Solarbio, H8761), selection for puromycin (Solarbio, IP1280) and/or G418 (Yeasen, 60220ES03) resistance was initiated 48 h after transfection. The selection medium was changed every 3-4 d for several weeks, and clones of puromycin- and/or G418-resistant cells were isolated and expanded for further characterization. The stably expressing MIR454 mimics, TSPAN1 and FAM83A cells were maintained with complete culture medium supplemented with 2 μg/ml puromycin and/or 100 μg/ml G418.
Genome-wide mRNA and miRNA expression analysis
Integrative analysis of TCGA mRNA and miRNA expression data was performed as previously described [Citation61]. Briefly, pancreatic cancer mRNA_HiSeq and miRNA_HiSeq Level 3 RNA-sequencing data were downloaded from the TCGA data portal (http://cancergenome.nih.gov/). Reads were aligned to the NCBI GRCh38-lite reference genome. Gene expression was quantified as fragments per kilobase transcript per million mapped reads (FPKM), and miRNA was annotated based on miRbase v16. Both mRNA and miRNA expression data were log2 transformed. The heatmap analysis of the mRNA or miRNA expression pattern was performed using R version 3.2.2 software with the “edgeR” package. The fold-change analysis was performed on the two categories of samples (Normal and Tumor), followed by an unpaired t-test (unequal variance) that was performed to obtain significant gene entities. Gene Ontology analysis was performed using the DAVID (Database for Annotation, Visualization and Integrated Discovery) classification system (https://david.abcc.ncifcrf.gov/) to evaluate the functional classes of the genes. Two screening algorithms were used to identify the miRNA(s) that target both TSPAN1 and FAM83A. Method 1 used the prediction algorithm of TargetScan 6.2, in which the in silico analysis identified 75 microRNAs that targeted both TSPAN1 and FAM83A. Method #2 used microRNAs that were identified as being significantly downregulated in pancreatic cancer. A combination of the two screening methods identified 16 microRNAs selected for further analysis. To generate a high confidence dataset of global miRNA-mRNA interactions, we identified pairwise negative correlations of miRNA with target mRNA expression, using linear regression in conjunction with available prediction tools from miRNA target databases.
RNA extraction and qRT-PCR
Total RNA was extracted from cultured pancreatic cancer cells using TRIzol reagent (Invitrogen, 15596026) according to the manufacturer’s protocol. qRT-PCR was performed as previously described [Citation62]. The mRNA expression level for each sample was normalized to the expression of GAPDH and miRNA expression was normalized to RNU6-6P/RNU6B using the 2−ΔΔct method [Citation63] with three biological replicates of comparative qRT-PCR. Quantitative PCR was performed using the Universal SYBR qPCR Master Mix (Vazyme, Q511-02). The following primer sequences were used for qRT-PCR: TSPAN1, (forward) 5′-GTGGCTTCACCAACTATACG-3′ and (reverse) 5′-GACTGCATTAGTTCGGATGT-3′; GAPDH, (forward) 5′-AGCCACATCGCTCAGACAC-3′ and (reverse) 5′-GCCCAATACGACCAAATCC-3′; FAM83A, (forward) 5′-CCCATCTCAGTCACTGGCATT-3′ and (reverse) 5′-CCGCCAACATCTCCTTGTTC-3′; CCND1, (forward) 5′-GCGTGTAGCTATGGAAGTTGCA-3′ and (reverse) 5′-CATCCCGAATGAGAGTCCTACAG-3′; MYC, (forward) 5′-ATCTCACAGTGACCAACCCAAA-3′ and (reverse) 5′-TCGGTCACGGAGCCAATC-3′; AXIN2, (forward) 5′-CAAGGGCCAGGTCACCAA-3′ and (reverse) 5′-CCCCAACCCATCTTCGT-3′; CTNNB1, (forward) 5′-GTGCTATCTGTCTGCTCTAGTA-3′ and (reverse) 5′-CTTCCTGTTTAGTTGCAGCATC-3′; MIR454-RT, 5′-GTCGTATCCAGTGCAGGGTCCGAGGTATTCGCACTGGATACGACGCAGAG-3′, (forward) 5′-GCGCGACCCTATCAATATTGT-3′ and (reverse) 5′-AGTGCAGGGTCCGAGGTATT-3′; RNU6-6P, (forward) 5′-CTCGCTTCGGCAGCACA-3′ and (reverse) 5′-AACGCTTCACGAATTTGCGT-3′. The primers used for zebrafish gene were as follows: tspan1, (forward) 5′-CTGCTTCACATTTGTCAAAGC-3′ and (reverse) 5′-CTCCTTCAGTCCAGGTATG-3′; gapdh, (forward) 5′-TCGGTCGCATTGGC-3′ and (reverse) 5ʹ-CCGCCTTCTGCCTTA-3′.
Immunoprecipitation
Cells were washed twice with phosphate-buffered saline (PBS; Servicebio, WGSH30256-01) and lysed with RIPA lysis buffer (50 mM Tris-HCl pH 7.4, 150 mM NaCl, 1% Triton X-100 [Sangon Biotech, 9002-93-1], 10 mM NaF, and 1 mM EDTA) containing proteinase inhibitor cocktail (Biomake, B14001) and Halt phosphatase inhibitor cocktail (Thermo Fisher Scientific, 78420). Protein concentration was measured using a BioRad Protein Assay kit (BioRad, 5000006). Cell lysates were incubated overnight with primary antibodies according to each individual experiment after pretreatment with IgG and protein A/G magic beads (Bimake, B23202), and then incubated with protein A/G magic beads for 2 h at 4°C. The immunoprecipitate was then subjected to western blotting.
Western blotting
Cell lysates were prepared as described previously[Citation61]. Briefly, the immunoprecipitate or cell lysates were boiled in 2 × SDS loading buffer (100 mM Tris-HCl, pH 6.8, 4% [wt:vol] SDS, 200 mM dithiothreitol, 0.2% [wt:vol] bromophenol blue, and 20% [vol:vol] glycerol [Biosharp, BS154]) for 8 min at 98°C and then loaded on SDS-PAGE gels. The gels were then blotted onto a 0.45-µm polyvinylidene fluoride membrane (PVDF; Millipore, IPFL85R). After incubated with primary antibodies and secondary antibodies, the signals of the protein in the PVDF membranes were detected using Supersignal West Pico Plus (Invitrogen, 34580) according to the manufacturer’s instructions.
Immunohistochemistry
Immunohistochemistry was performed as described previously [Citation62]. Briefly, the antibody against TSPAN1 was tested on sections from a human tissue array (Alenabio, PA805b) that contains formalin-fixed paraffin-embedded pancreatic cancer tissues and normal tissue samples. To quantify the status of TSPAN1 protein expression in these groups, the intensity of the TSPAN1 immunoreaction was divided into five grades depending on the percentage of positive cells (percentage scores): <10% (0), 10–25% (1), 25–50% (2), 50–75 (3), and >75% (4). The intensity of staining was divided into four grades (intensity scores): no staining (0), light brown (1), brown (2), and dark brown (3). The overall staining score was determined by the formula: overall scores = percentage score × intensity score [Citation64].
Dual-luciferase reporter assay
For regulation of MIR454 toward TSPAN1 mRNA: Dual-luciferase reporter assay was performed as described previously [Citation62]. Briefly, the 3′UTR of TSPAN1 mRNA amplified from pancreatic cancer PANC-1 cells by PCR and then cloned in between the XhoI and SalI sites of a pmirGLO Dual-Luciferase miRNA target expression vector (Promega, E1330). The primer sequences used for TSPAN1 3′UTR qRT-PCR were (forward) CTGCCACATGGGAACTGTGAAGAG and (reverse) CCTTAGAGGCTCTGGAATGCC. The MIR454 target site-mutation TSPAN1 3ʹUTR luciferase reporter (MT TSPAN1) construct was generated using the QuikChange II XL Site-Directed Mutagenesis Kit (Stratagene, 200521). The nucleotide sequences of all constructs were confirmed by DNA sequencing. Luciferase reporter plasmids plus MIR454 mimics or miR control were co-transfected into HEK293T cells using Lipofectamine 2000. After 48 h of transfection, the luminescence ratio of the experimental reporter (Firefly) to the control reporter (Renilla) was calculated. All experiments were performed in triplicate.
For regulation of WNT-CTNNB1 toward TSPAN1 promoter: The TSPAN1 promoter region, which from 1000 bp upstream to 38 bp downstream of the transcription start site (TSS) was cloned into the firefly luciferase reporter plasmid pGL3-Basic (Promega, E1751). The renilla luciferase vector was used as an internal control and was purchased from Promega (Promega, E6971). The primer sequences used for TSPAN1 promoter qRT-PCR were (forward) ATGCGTATGTGTTGTTACATATATCGTGTGG and (reverse) GTAGGTGTAGCTGCTGGTGTGTGT. The nucleotide sequences of all constructs were confirmed by DNA sequencing. After 48 h of transfection, the luminescence ratio of the experimental reporter (Firefly) to the control reporter (Renilla) was calculated. All experiments were performed in triplicate.
MTT assay
MTT assay was performed as described previously [Citation65]. Briefly, human pancreatic cancer PANC-1 and ASPC-1 cells (1 × 10³ cells/well) were seeded into 96-well plates, then cells were stained at the indicated time points with 100 μl sterile MTT dye (0.5 mg/ml; Sigma, M2128) for 4 h at 37°C after MIR454 mimics, TSPAN1 and/or FAM83A transfection and later 48 h culture. After adding 150 μl DMSO (Sigma, W387520), the number of viable cells was assessed by measurement of the absorbance at 450 nm by a microplate reader. All experiments were performed in triplicate.
CRISPR-Cas9 mediated mutagenesis of zebrafish tspan1
Single guide RNAs (sgRNAs) targeting the second coding exon of zebrafish tspan1 (ENSDARG00000052027) were designed using the chop-chop website [Citation66]. SgRNAs were purchased from Sangon Biotech (Shanghai), and the sequences of TSPAN1 target sites were ATCTGGAGTCACGTCAATAT and TGTGGCTACCGTAGGGATAT, respectively. For in vitro transcription of sgRNAs, 0.5 µg template DNA was used to generate sgRNAs using the MEGA short script ®T7 kit (Thermo Fisher Scientific, AM1354) and purified with an RNA Clean up kit (TIANGEN, DP412). The Cas9 Nuclease was purchased from New England Biolabs (NEB, M0646). A mixture of sgRNA and Cas9 was injected into one-cell stage WT (AB line) embryos (sgRNA 150 pg/embryo and Cas9 300 pg/embryo). The effect of CRISPR injection was confirmed by PCR and Sanger sequencing.
Colony formation assay
Human pancreatic cancer PANC-1 and ASPC-1 cells transfected with MIR454, TSPAN1 and/or FAM83 were seeded into 12-well plates and incubated with complete medium at 37°C for 2 – 3 weeks. Then, the cells were fixed with 4% paraformaldehyde and stained with 2% crystal violet. The images were obtained and the number of colonies was counted.
Immunofluorescence and confocal microscopy
PANC-1, ASPC-1 and HeLa cells transfected with the appropriate plasmids were grown on 12-well plates, and for confocal microscopy on glass chambers, at 60% density and cultured for 48 h. After treatment with or without EBSS for 2 h, cells were fixed with 4% paraformaldehyde in PBS and permeabilized with 0.5% Triton X-100. Then cells were blocked with 10% goat serum (Sangon Biotech, E510009) and subsequently incubated with primary antibodies and fluorescence-labeled secondary antibodies. DAPI (Solarbio, C0065) was used for nuclei staining. For immunofluorescence, the images were obtained by using the Olympus IX73 fluorescence microscope. For confocal microscopy, cells plated on the glass chambers were examined with a confocal laser-scanning microscope (Leica SP8, Wetzlar, Germany) using a 63× oil immersion objective. Data analysis was performed using the Leica LAS AF Lite software. The numbers of GFP-LC3 puncta per cell were assessed in 10 non-overlapping fields.
TUNEL assay
Apoptotic cells within PANC-1 and ASPC-1 cells after MIR454 and TSPAN1 overexpression were examined by One Step TUNEL (TdT-mediated dUTP Nick-End Labeling) Apoptosis Assay Kit (Beyotime, C1090) in accordance with the manufacturer’s protocols.
GSEA analysis
Global mRNA expression profiles of the top 20 human pancreatic cancer tissues with the highest and lowest expression of TSPAN1 obtained from The Cancer Genome Atlas (TCGA) database were subject to Gene Set Enrichment Analysis (GSEA) using the GSEA v2.2.4 software (http://www.broadinstitute.org/gsea/). GSEA was performed to uncover the Kyoto Encyclopedia of Genes and Genomes (KEGG) and Gene Ontology (GO) biological processes that are positively correlated with TSPAN1 expression. KEGG and GO biological process gene sets were downloaded from the Molecular Signatures Database (MSigDB) (http://www.broadinstitute.org/gsea/). GSEA was conducted to identify the association of TSPAN1 expression with cell autophagy, metabolism and biosynthesis signatures. Enrichment analysis was performed using 1000 phenotype permutations, and gene sets with nominal p-value < 0.05 and false discovery rate (FDR) < 0.25 were considered significant.
Electron microscopy assay
PANC-1 cells were washed in PBS twice and fixed in 2.5% glutaraldehyde and then further fixed with 2% osmium tetroxide buffer. Then fixed cells were dehydrated using a graded ethanol series and embedded in epon. Electron microscopy was performed with a JEM-100CX-II TEM (Joel, Tokyo, Japan) transmission electron microscope, using ultrathin sections (45 nm) stained with lead citrate and uranyl acetate.
TOP/FOP flash luciferase assay
TOP/FOP flash luciferase assay was performed as described previously [Citation65]. The human pancreatic cancer ASPC-1 cells were transfected with M50 Super 8 × TOPFlash (Addgene, 12456; deposited by Randall Moon) and M51 Super 8 × FOPFlash (TOPFlash mutant; Addgene, 12457; deposited by Randall Moon) [Citation67] plasmid along with an internal Renilla control plasmid according to the manufacturer’s protocol.
Chromatin immunoprecipitation assay
Chromatin immunoprecipitation (ChIP) was performed as described previously [Citation65]. Briefly, 1 × 10⁷ cells were collected and fixed with 1% formaldehyde, after which the cells were scraped and lysed in SDS lysis buffer (1% SDS, 40 mmol/L Tris [pH 7.9], 15 mmol/L EDTA, 1.5 mmol/L DTT, and protease inhibitors). The soluble material was purified by centrifugation and then mixed with the appropriate antibody (polyclonal antibodies against TCF4 or CTNNB1) or control rabbit IgG overnight at 4°C, which was followed by incubation with magic protein A/G beads under reverse rotation at 4°C for 2 h. The beads were subsequently resuspended in elution buffer (50 mM NaHCO3 and 1% SDS) and reverse DNA/protein cross-linked at 65°C for 4 h. qPCR was used to analyze the binding of the CTNNB1-TCF-4 complex to the TSPAN1 promoter using the primers listed below: MYC, 5′-GTGAATACACGTTTGCGGGTTAC-3′ (forward), 5′-AGAGACCCTTGTGAAAAAAACCG-3′ (reverse). TBE1, 5′-CTGACCTTCACTTTTCTTACCAGGGC-3′ (forward), 5′-GTAGGTGTAGCTGCTGGTGTGTGT-3′ (reverse). TBE2, 5′-CACTTCCTGAACCCCAGGGG-3′ (forward), 5′-CTTAGTCGCTGGGAACATTTTGTAGG-3′ (reverse). TBE3, 5′-CCCATCCCATAACCTGAGGAGC-3′ (forward), 5′-CCCCTGGGGTTCAGGAAGTG-3′ (reverse), TBE4, 5′-CTTGCATGCATGTGTGTGGTTG-3′ (forward), 5′-CACTGACACACCATGCCCAG-3′ (reverse).
5-Ethynyl-20-deoxyuridine (EdU) incorporation assay
EdU assay was performed to assess the proliferation of pancreatic cancer ASPC-1 cells. The BeyoClick™ EdU Cell Proliferation kit with Alexa Fluor 555 was purchased from Beyotime (Shanghai, C0075S). ASPC-1 cells were plated in 24 wells and transfected with MIR454 mimics and FAM83A the next day. After 48 h cultivation, cells were fixed using 4% paraformaldehyde and stained with DAPI after incubation with 50 mM EdU solution for 2 h. The EdU-labeled cells were photographed and counted under an Olympus FSX100 microscope (Olympus, Tokyo, Japan).
Subcutaneous xenograft experiments
All animal experiments were carried out in compliance with the protocol specifically approved for the use of laboratory animals of the Wuhan University Animal Biosafety Level III Laboratory Animal Care and Use Committee. Male BALB/c nude mice at 4–6 weeks of age (18–22 g) were purchased from Vital River Laboratory Animal Technology (Beijing, China). Subsequently, 3 × 10⁶ stably maintained PANC-1 cells were resuspended in 100 μl PBS and injected subcutaneously into the left or right dorsal flank of 3 female nude mice per group. Autophagy inhibitor CQ intraperitoneal treatment commenced once tumors became palpable with a dose of 60 mg/kg twice per week. The length and width of mouse tumors were measured every 5 d with calipers, and tumor volume (V) was calculated as the formula: V = [(length × width × 2)/2]. Experimental mice were euthanized at the end of the observation period, and then the tumors were excised and weighed.
Statistical analysis
All experiments were performed independently at least three times. All statistical analysis was performed using GraphPad Prism 6.0 software (GraphPad, La Jolla, CA, USA). All data are presented as mean ± SD (standard deviation) from triplicates. p values < 0.05 were statistically significant. Statistical analysis was done using paired Student’s t-test; *represents P <0.05, **represents P <0.01 and ***represents P <0.001.
Supplemental Material
Download Zip (24.9 MB)Acknowledgements
We thank Prof. Daniel Klionsky for sharing the GFP-Lc3 transgenic zebrafish line. We also thank Hubei University of Technology and University of Alberta for financial support for this research.
Disclosure statement
No potential conflict of interest was reported by the authors.
Supplementary Material
Supplemental data for this article can be accessed here.
Additional information
Funding
Related Research Data
References
- Siegel RL, Miller KD, Jemal A. Cancer statistics, 2016. CA Cancer J Clin. 2016;66(1):7–30.
- Zeitouni D, Pylayeva-Gupta Y, Der CJ, et al. KRAS Mutant Pancreatic Cancer: No Lone Path to an Effective Treatment. Cancers (Basel). 2016;8(4):45. DOI:https://doi.org/10.3390/cancers8040045.
- Bardeesy N, DePinho RA. Pancreatic cancer biology and genetics. Nat Rev Cancer. 2002;2(12):897–909.
- Galluzzi L, Pietrocola F, Levine B, et al. Metabolic control of autophagy. Cell. 2014;159(6):1263–1276.
- Hosokawa N, Hara T, Kaizuka T, et al. Nutrient-dependent mTORC1 association with the ULK1-Atg13-FIP200 complex required for autophagy. Mol Biol Cell. 2009;20(7):1981–1991. DOI:https://doi.org/10.1091/mbc.e08-12-1248.
- Egan D, Kim J, Shaw RJ, et al. The autophagy initiating kinase ULK1 is regulated via opposing phosphorylation by AMPK and mTOR. Autophagy. 2011;7(6):643–644. DOI:https://doi.org/10.4161/auto.7.6.15123.
- Zhou C, Qian X, Hu M, et al. STYK1 promotes autophagy through enhancing the assembly of autophagy-specific class III phosphatidylinositol 3-kinase complex I. Autophagy. 2019;7::1–21.
- Yang A, Rajeshkumar NV, Wang X, et al. Autophagy is critical for pancreatic tumor growth and progression in tumors with p53 alterations. Cancer Discov. 2014;4(8):905–913.
- Yang S, Wang X, Contino G, et al. Pancreatic cancers require autophagy for tumor growth. Genes Dev. 2011;25(7):717–729. DOI:https://doi.org/10.1101/gad.2016111.
- Rosenfeldt MT, O’Prey J, Morton JP, et al. p53 status determines the role of autophagy in pancreatic tumour development. Nature. 2013;504(7479):296–300. DOI:https://doi.org/10.1038/nature12865.
- Pasca Di Magliano M, AV B, PW H, et al. Common activation of canonical Wnt signaling in pancreatic adenocarcinoma. PLoS One. 2007;2(11):e1155. DOI:https://doi.org/10.1371/journal.pone.0001155.
- Heiser PW, Cano DA, Landsman L, et al. Stabilization of beta-catenin induces pancreas tumor formation. Gastroenterology. 2008;135(4):1288–1300. DOI:https://doi.org/10.1053/j.gastro.2008.06.089.
- Nager M, Sallan MC, Visa A, et al. Inhibition of WNT-CTNNB1 signaling upregulates SQSTM1 and sensitizes glioblastoma cells to autophagy blockers. Autophagy. 2018;14(4):619–636. DOI:https://doi.org/10.1080/15548627.2017.1423439.
- Petherick KJ, Williams AC, Lane JD, et al. Autolysosomal beta-catenin degradation regulates Wnt-autophagy-p62 crosstalk. Embo j. 2013;32(13):1903–1916. DOI:https://doi.org/10.1038/emboj.2013.123.
- Liu C, Sun L, Yang J, et al. FSIP1 regulates autophagy in breast cancer. Proc Natl Acad Sci U S A. 2018;115(51):13075–13080. DOI:https://doi.org/10.1073/pnas.1809681115.
- Zhou SY, Xu ML, Wang SQ, et al. Overexpression of Pygopus-2 is required for canonical Wnt activation in human lung cancer. Oncol Lett. 2014;7(1):233–238. DOI:https://doi.org/10.3892/ol.2013.1691.
- Kozomara A, Griffiths-Jones S. miRBase: annotating high confidence microRNAs using deep sequencing data. Nucleic Acids Res. 2014;42(Database issue):D68–73.
- Hayes J, Peruzzi PP, Lawler S. MicroRNAs in cancer: biomarkers, functions and therapy. Trends Mol Med. 2014;20(8):460–469.
- Gu DN, Jiang MJ, Mei Z, et al. microRNA-7 impairs autophagy-derived pools of glucose to suppress pancreatic cancer progression. Cancer Lett. 2017;400:69–78.
- Gibori H, Eliyahu S, Krivitsky A, et al. Amphiphilic nanocarrier-induced modulation of PLK1 and miR-34a leads to improved therapeutic response in pancreatic cancer. Nat Commun. 2018;9(1):16. DOI:https://doi.org/10.1038/s41467-017-02283-9.
- Liao X, Wang X, Huang K, et al. Genome-scale analysis to identify prognostic microRNA biomarkers in patients with early stage pancreatic ductal adenocarcinoma after pancreaticoduodenectomy. Cancer Manag Res. 2018;10:2537–2551.
- Yu L, Gong X, Sun L, et al. miR-454 functions as an oncogene by inhibiting CHD5 in hepatocellular carcinoma. Oncotarget. 2015;6(36):39225–39234. DOI:https://doi.org/10.18632/oncotarget.4407.
- Fan Y, Xu LL, Shi CY, et al. MicroRNA-454 regulates stromal cell derived factor-1 in the control of the growth of pancreatic ductal adenocarcinoma. Sci Rep. 2016;6:22793.
- Lazo PA. Functional implications of tetraspanin proteins in cancer biology. Cancer Sci. 2007;98(11):1666–1677.
- Wang Y, Liang Y, Yang G, et al. Tetraspanin 1 promotes epithelial-to-mesenchymal transition and metastasis of cholangiocarcinoma via PI3K/AKT signaling. J Exp Clin Cancer Res. 2018;37(1):300. DOI:https://doi.org/10.1186/s13046-018-0969-y.
- Zhang X, Shi G, Gao F, et al. TSPAN1 upregulates MMP2 to promote pancreatic cancer cell migration and invasion via PLCgamma. Oncol Rep. 2019;41(4):2117–2125.
- Lee CH, Im EJ, Moon PG, et al. Discovery of a diagnostic biomarker for colon cancer through proteomic profiling of small extracellular vesicles. BMC Cancer. 2018;18(1):1058. DOI:https://doi.org/10.1186/s12885-018-4952-y.
- Scholz CJ, Kurzeder C, Koretz K, et al. Tspan-1 is a tetraspanin preferentially expressed by mucinous and endometrioid subtypes of human ovarian carcinomas. Cancer Lett. 2009;275(2):198–203. DOI:https://doi.org/10.1016/j.canlet.2008.10.014.
- Li Y, Dong X, Yin Y, et al. BJ-TSA-9, a novel human tumor-specific gene, has potential as a biomarker of lung cancer. Neoplasia. 2005;7(12):1073–1080. DOI:https://doi.org/10.1593/neo.05406.
- Chen S, Huang J, Liu Z, et al. FAM83A is amplified and promotes cancer stem cell-like traits and chemoresistance in pancreatic cancer. Oncogenesis. 2017;6(3):e300. DOI:https://doi.org/10.1038/oncsis.2017.3.
- Bapat AA, Hostetter G, Von Hoff DD, et al. Perineural invasion and associated pain in pancreatic cancer. Nat Rev Cancer. 2011;11(10):695–707.
- Klionsky DJ, Abdelmohsen K, Abe A, et al. Guidelines for the use and interpretation of assays for monitoring autophagy (3rd edition). Autophagy. 2016;12(1):1–222.
- He C, Bartholomew CR, Zhou W, et al. Assaying autophagic activity in transgenic GFP-Lc3 and GFP-Gabarap zebrafish embryos. Autophagy. 2009;5(4):520–526. DOI:https://doi.org/10.4161/auto.5.4.7768.
- Scholz CJ, Sauer G, Deissler H. Glycosylation of tetraspanin Tspan-1 at four distinct sites promotes its transition through the endoplasmic reticulum. Protein Pept Lett. 2009;16(10):1244–1248.
- Nakatogawa H, Ichimura Y, Ohsumi Y. Atg8, a ubiquitin-like protein required for autophagosome formation, mediates membrane tethering and hemifusion. Cell. 2007;130(1):165–178.
- Birgisdottir AB, Lamark T, Johansen T. The LIR motif - crucial for selective autophagy. J Cell Sci. 2013;126(Pt15):3237–3247.
- Behrends C, Sowa ME, Gygi SP, et al. Network organization of the human autophagy system. Nature. 2010;466(7302):68–76. DOI:https://doi.org/10.1038/nature09204.
- Kimura S, Noda T, Yoshimori T. Dissection of the autophagosome maturation process by a novel reporter protein, tandem fluorescent-tagged LC3. Autophagy. 2007;3(5):452–460.
- JPt M, Wang SC, Hebrok M. KRAS, Hedgehog, Wnt and the twisted developmental biology of pancreatic ductal adenocarcinoma. Nat Rev Cancer. 2010;10(10):683–695.
- Cadigan KM, Waterman ML. TCF/LEFs and Wnt signaling in the nucleus. Cold Spring Harb Perspect Biol. 2012;4(11):pii:a007906.
- Goedeke L, Rotllan N, Canfran-Duque A, et al. MicroRNA-148a regulates LDL receptor and ABCA1 expression to control circulating lipoprotein levels. Nat Med. 2015;21(11):1280–1289. DOI:https://doi.org/10.1038/nm.3949.
- Szafranska AE, Davison TS, John J, et al. MicroRNA expression alterations are linked to tumorigenesis and non-neoplastic processes in pancreatic ductal adenocarcinoma. Oncogene. 2007;26(30):4442–4452.
- Egan DF, Shackelford DB, Mihaylova MM, et al. Phosphorylation of ULK1 (hATG1) by AMP-activated protein kinase connects energy sensing to mitophagy. Science. 2011;331(6016):456–461. DOI:https://doi.org/10.1126/science.1196371.
- Kimmelman AC. The dynamic nature of autophagy in cancer. Genes Dev. 2011;25(19):1999–2010.
- Zhou C, Wang M, Yang J, et al. Integral membrane protein 2A inhibits cell growth in human breast cancer via enhancing autophagy induction. Cell Commun Signal. 2019;17(1):105. DOI:https://doi.org/10.1186/s12964-019-0422-7.
- Orsini M, Chateauvieux S, Rhim J, et al. Sphingolipid-mediated inflammatory signaling leading to autophagy inhibition converts erythropoiesis to myelopoiesis in human hematopoietic stem/progenitor cells. Cell Death Differ. 2019;26(9):1796–1812. DOI:https://doi.org/10.1038/s41418-018-0245-x.
- Perera RM, Stoykova S, Nicolay BN, et al. Transcriptional control of autophagy-lysosome function drives pancreatic cancer metabolism. Nature. 2015;524(7565):361–365. DOI:https://doi.org/10.1038/nature14587.
- Kimmelman AC, White E. Autophagy and Tumor Metabolism. Cell Metab. 2017;25(5):1037–1043.
- Dubrovska A, Digomann D, Linge A. SLC3A2/CD98hc, autophagy and tumor radioresistance: a link confirmed. Autophagy. 2019;15(10):1850–1851.
- Zhou C, Yi C, Yi Y, et al. LncRNA PVT1 promotes gemcitabine resistance of pancreatic cancer via activating Wnt/β-catenin and autophagy pathway through modulating the miR-619-5p/Pygo2 and miR-619-5p/ATG14 axes. Mol Cancer. 2020;19(1):118.
- Zoncu R, Efeyan A, Sabatini DM. mTOR: from growth signal integration to cancer, diabetes and ageing. Nat Rev Mol Cell Biol. 2011;12(1):21–35.
- Tao Z, Yuan Y, Liao Q. Alleviation of Lipopolysaccharides-Induced Acute Lung Injury by MiR-454. Cell Physiol Biochem. 2016;38(1):65–74.
- Somel M, Liu X, Tang L, et al. MicroRNA-driven developmental remodeling in the brain distinguishes humans from other primates. PLoS Biol. 2011;9(12):e1001214. DOI:https://doi.org/10.1371/journal.pbio.1001214.
- Zhao X, Li X, Zhou L, et al. LncRNA HOXA11-AS drives cisplatin resistance of human LUAD cells via modulating miR-454-3p/Stat3. Cancer Sci. 2018;109(10):3068–3079.
- Xu G, Zhu H, Zhang M, et al. Histone deacetylase 3 is associated with gastric cancer cell growth via the miR-454-mediated targeting of CHD5. Int J Mol Med. 2018;41(1):155–163.
- Fu Q, Gao Y, Yang F, et al. Suppression of microRNA-454 impedes the proliferation and invasion of prostate cancer cells by promoting N-myc downstream-regulated gene 2 and inhibiting WNT/beta-catenin signaling. Biomed Pharmacother. 2018;97:120–127.
- Fan Y, Shi C, Li T, et al. microRNA-454 shows anti-angiogenic and anti-metastatic activity in pancreatic ductal adenocarcinoma by targeting LRP6. Am J Cancer Res. 2017;7(1):139–147.
- Fulcher LJ, Bozatzi P, Tachie-Menson T, et al. The DUF1669 domain of FAM83 family proteins anchor casein kinase 1 isoforms. Sci Signal. 2018;11(531):pii:eaao2341. DOI:https://doi.org/10.1126/scisignal.aao2341.
- Amit S, Hatzubai A, Birman Y, et al. Axin-mediated CKI phosphorylation of beta-catenin at Ser 45: a molecular switch for the Wnt pathway. Genes Dev. 2002;16(9):1066–1076. DOI:https://doi.org/10.1101/gad.230302.
- Gao C, Cao W, Bao L, et al. Autophagy negatively regulates Wnt signalling by promoting Dishevelled degradation. Nat Cell Biol. 2010;12(8):781–790. DOI:https://doi.org/10.1038/ncb2082.
- Zhou C, Wang M, Zhou L, et al. Prognostic significance of PLIN1 expression in human breast cancer. Oncotarget. 2016;7(34):54488–54502. DOI:https://doi.org/10.18632/oncotarget.10239.
- Zhou C, Yu J, Wang M, et al. Identification of glycerol-3-phosphate dehydrogenase 1 as a tumour suppressor in human breast cancer. Oncotarget. 2017;8(60):101309–101324. DOI:https://doi.org/10.18632/oncotarget.21087.
- Livak KJ, Schmittgen TD. Analysis of relative gene expression data using real-time quantitative PCR and the 2(-Delta Delta C(T)) Method. Methods. 2001;25(4):402–408.
- Wang L, Wei D, Huang S, et al. Transcription factor Sp1 expression is a significant predictor of survival in human gastric cancer. Clin Cancer Res. 2003;9(17):6371–6380.
- Zhou C, Zhang Y, Dai J, et al. Pygo2 functions as a prognostic factor for glioma due to its up-regulation of H3K4me3 and promotion of MLL1/MLL2 complex recruitment. Sci Rep. 2016;6:22066.
- Labun K, Montague TG, Gagnon JA, et al. CHOPCHOP v2: a web tool for the next generation of CRISPR genome engineering. Nucleic Acids Res. 2016;44(W1):W272–276. DOI:https://doi.org/10.1093/nar/gkw398.
- Veeman MT, Slusarski DC, Kaykas A, et al. Zebrafish prickle, a modulator of noncanonical Wnt/Fz signaling, regulates gastrulation movements. Curr Biol. 2003;13(8):680–685. DOI:https://doi.org/10.1016/S0960-9822(03)00240-9.